LabVIEW Lecture I: Introduction - Physicsgan/teaching/fall12/LabViewI.pdfWhy use LabVIEW? •...
16
LabVIEW Lecture I: Introduction • LabVIEW – Laboratory V irtual Instrument Engineering W orkbench • Product of National Instruments (ni.com) – First released, 1986 • Based on – A graphical programming environment, replaces lines of code with interconnected icons – Allowing “easy” automated data acquisition, instrument control, and industrial automation K.K. Gan 1 LabVIEW Jeff Kodosky (1988), “Father of LabVIEW”
Transcript of LabVIEW Lecture I: Introduction - Physicsgan/teaching/fall12/LabViewI.pdfWhy use LabVIEW? •...
LabVIEW �Lecture I: Introduction
• LabVIEW – Laboratory Virtual Instrument Engineering Workbench • Product of National Instruments (ni.com)
– First released, 1986
• Based on – A graphical programming environment, replaces lines of code with interconnected icons – Allowing “easy” automated data acquisition, instrument control, and industrial automation
K.K. Gan 1 LabVIEW
Jeff Kodosky (1988), “Father of LabVIEW”

Why Use Automated Data Acquisition?
• In classical experiments… – Data from sensors are sent to a meter or gauge, read by the
experimenter, and recorded by hand in a logbook – The experimenter must always be present to take the data
unless using a chart recorder etc. • What if paper or tapes are lost / soiled! • Difficult to post process
• In automated experiments… – Data acquisition systems measure and record directly to disk
• The benefits of automated systems are tremendous – Increased frequency with which measurements can be taken – Potential to automate pre and post processing and build in
quality control – Remote accessibility to data
• Software (LabVIEW in our case) controls the automated data acquisition and processing
K.K. Gan 2 LabVIEW

Why use LabVIEW? • LabVIEW is a graphical programming language that allows for instrument
control, data acquisition, and pre/post processing of acquired data • The purpose of using this graphical language is to allow people with
limited coding experience to write programs develop automated experiments much faster than with conventional programming environments
• Another key benefit of LabVIEW over conventional programming environments is the extensive support for accessing instrumentation hardware – Writing instrument drivers by hand requires a hardware and operating system expert along with
thousands of lines of code – Drivers for hundreds of instruments and buses are available for “free” on ni.com and bundled with the
software package (base price $1250) • Due to the popularity, most instrument makers provide working LabVIEW drivers • The large community also posts/tests drivers for instruments that are not available directly from
the vendors
K.K. Gan 3 LabVIEW

Example: C-code vs. LabVIEW C++ Program #include<stdio.h>
main() { int a, b, c;
printf("Enter two numbers to add\n"); scanf("%d%d",&a,&b);
c = a + b;
printf("Sum of entered numbers = %d\n",c);
return 0; }
LabVIEW Program
K.K. Gan 4 LabVIEW
Interface/Output
Interface/Output
Which looks simpler for a novice to understand?
LabVIEW Program Basics
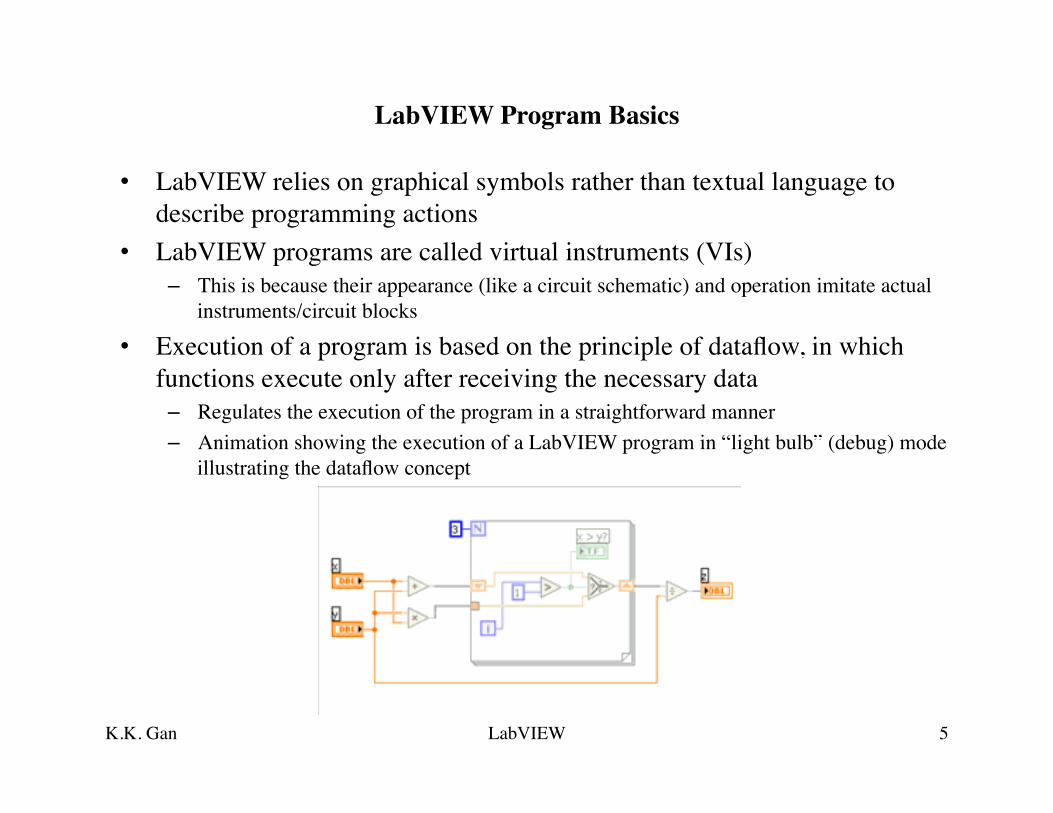
• LabVIEW relies on graphical symbols rather than textual language to describe programming actions
• LabVIEW programs are called virtual instruments (VIs) – This is because their appearance (like a circuit schematic) and operation imitate actual
instruments/circuit blocks
• Execution of a program is based on the principle of dataflow, in which functions execute only after receiving the necessary data – Regulates the execution of the program in a straightforward manner – Animation showing the execution of a LabVIEW program in “light bulb” (debug) mode
illustrating the dataflow concept
K.K. Gan 5 LabVIEW

LabVIEW Program Basics Ctd. • LabVIEW programs are called virtual instruments (VIs) • Each VI contains three main parts
– Front Panel • GUI (Graphic User interface), allow users interact with the VI when the program is running • Users can control the program, change inputs, and see data updated in real time
– Block Diagram • The code that controls the program. When a VI is run, values from controls flow through the
block diagram, where they are operated on in the functions/icons – Icons – blocks that perform functions on the data
• Every front panel control or indicator has a corresponding terminal on the block diagram
K.K. Gan 6 LabVIEW
Front Panel Block Diagram
Icon (add) Controls (inputs)
Indicators (outputs)
K.K. Gan 7 LabVIEW
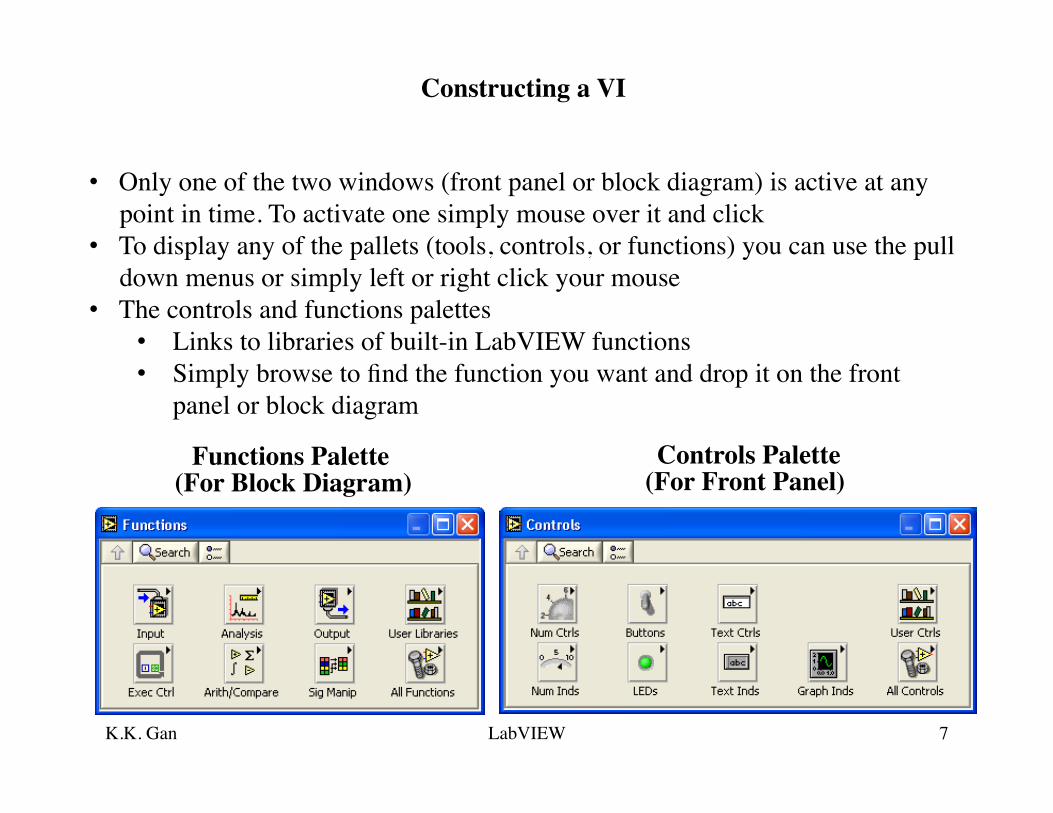
Constructing a VI
• Only one of the two windows (front panel or block diagram) is active at any point in time. To activate one simply mouse over it and click
• To display any of the pallets (tools, controls, or functions) you can use the pull down menus or simply left or right click your mouse
• The controls and functions palettes • Links to libraries of built-in LabVIEW functions • Simply browse to find the function you want and drop it on the front
panel or block diagram
Controls Palette (For Front Panel)
Functions Palette (For Block Diagram)

Constructing a VI Ctd.
K.K. Gan 8 LabVIEW
Operating Tool
Positioning/Resizing Tool
Labeling Tool
Wiring Tool
Shortcut Menu Tool
• Floating Palette • Used to operate and modify front
panel and block diagram objects
Scrolling Tool
Breakpoint Tool
Probe Tool
Color Copy Tool
Coloring Tool
Tools Palette
Automatic Selection Tool

Debugging Techniques
K.K. Gan 9 LabVIEW
• Finding Errors
• Execution Highlighting (“light bulb” mode)
• Probes
Double Click on the “broken” run button and a window describing the detected error appears.
Click on the execution highlighting button. The data flow is now shown in real time and is animated using bubbles. Present values are displayed on wires.
Right-click on a wire to display a probe which shows data as it flows through wire segment.
You can also select Probe tool from Tools palette and click on wire.
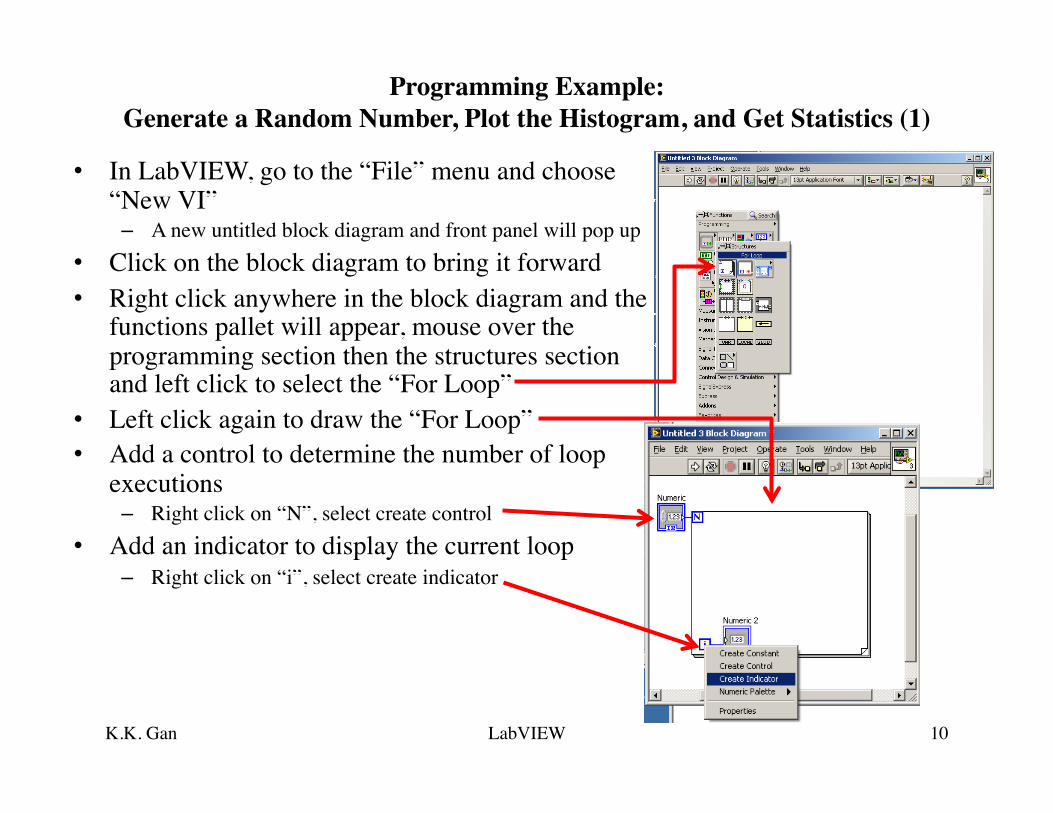
Programming Example: �Generate a Random Number, Plot the Histogram, and Get Statistics (1)
• In LabVIEW, go to the “File” menu and choose “New VI” – A new untitled block diagram and front panel will pop up
• Click on the block diagram to bring it forward • Right click anywhere in the block diagram and the
functions pallet will appear, mouse over the programming section then the structures section and left click to select the “For Loop”
• Left click again to draw the “For Loop” • Add a control to determine the number of loop
executions – Right click on “N”, select create control
• Add an indicator to display the current loop – Right click on “i”, select create indicator
K.K. Gan 10 LabVIEW
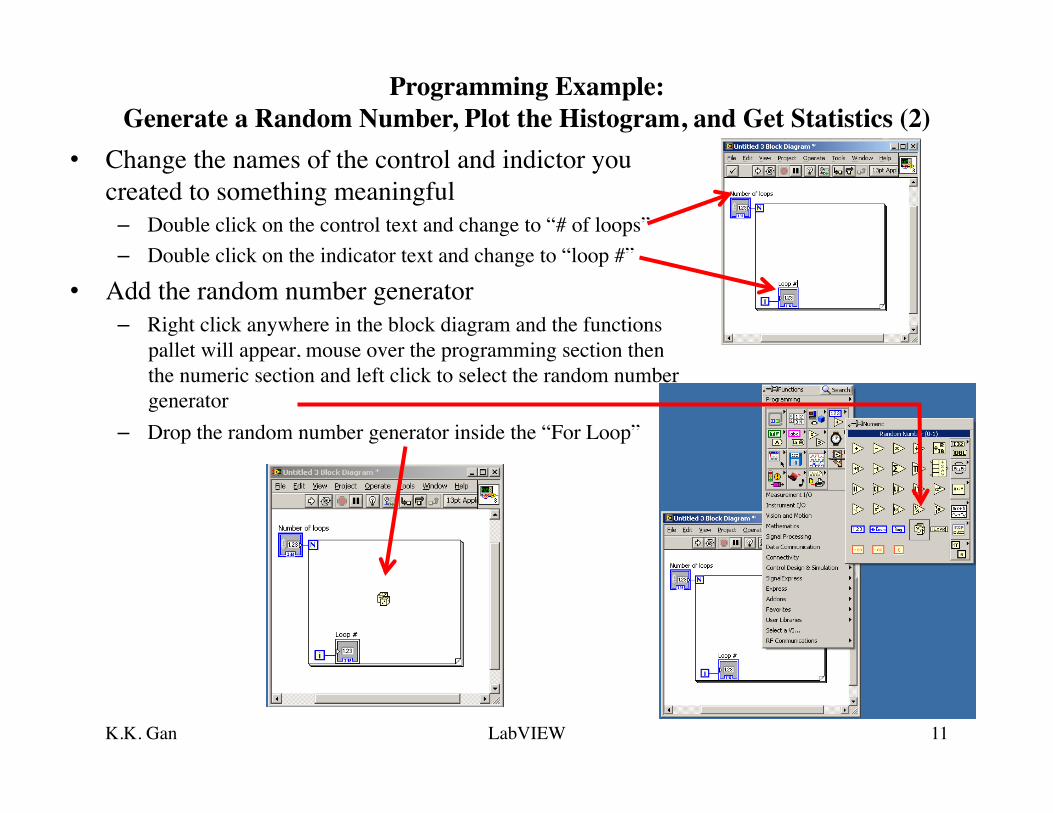
Programming Example: �Generate a Random Number, Plot the Histogram, and Get Statistics (2)
• Change the names of the control and indictor you created to something meaningful – Double click on the control text and change to “# of loops” – Double click on the indicator text and change to “loop #”
• Add the random number generator – Right click anywhere in the block diagram and the functions
pallet will appear, mouse over the programming section then the numeric section and left click to select the random number generator
– Drop the random number generator inside the “For Loop”
K.K. Gan 11 LabVIEW
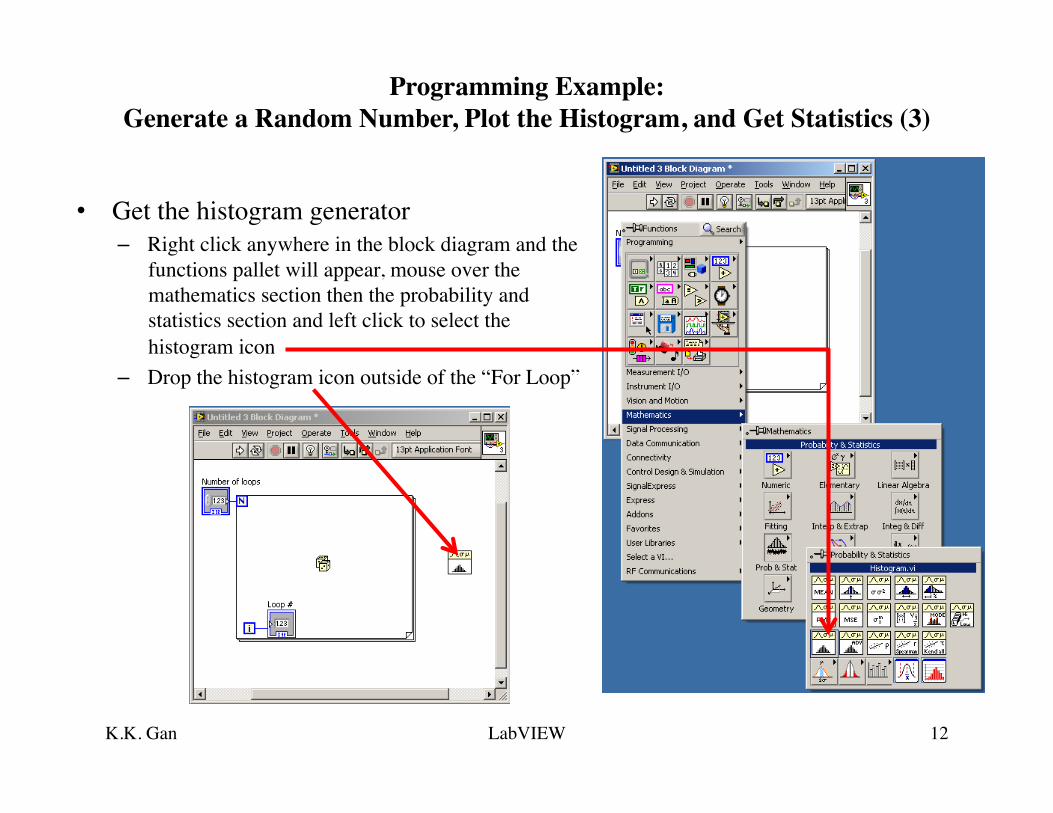
Programming Example: �Generate a Random Number, Plot the Histogram, and Get Statistics (3)
• Get the histogram generator – Right click anywhere in the block diagram and the
functions pallet will appear, mouse over the mathematics section then the probability and statistics section and left click to select the histogram icon
– Drop the histogram icon outside of the “For Loop”
K.K. Gan 12 LabVIEW

Programming Example: �Generate a Random Number, Plot the Histogram, and Get Statistics (4)
• Get the standard deviation and variance icon – Right click anywhere in the block diagram and the
functions pallet will appear, mouse over the mathematics section then the probability and statistics section and left click to select the standard deviation and variance icon
– Drop the standard deviation and variance icon outside of the “For Loop”
K.K. Gan 13 LabVIEW

Programming Example: �Generate a Random Number, Plot the Histogram, and Get Statistics (5)
• Connect the output of the random number generator to the X input of the histogram and standard deviation and variance icons using the wiring tool – Note that the wire makes a box with brackets on the edge of
the “For Loop”. This is telling you that an array of numbers is being constructed. In this case the array will contain as many random numbers as the value inserted in the number of loops control.
• Create the outputs – With the wiring tool active, right click on the Histogram
Graph output of the generate histogram icon, choose create indicator.
– With the wiring tool active, right click on the mean output of the standard deviation and variance icon, choose create indicator.
– With the wiring tool active, right click on the standard deviation output of the standard deviation and variance icon, choose create indicator.
– With the wiring tool active, right click on the variance output of the standard deviation and variance icon, choose create indicator..
K.K. Gan 14 LabVIEW
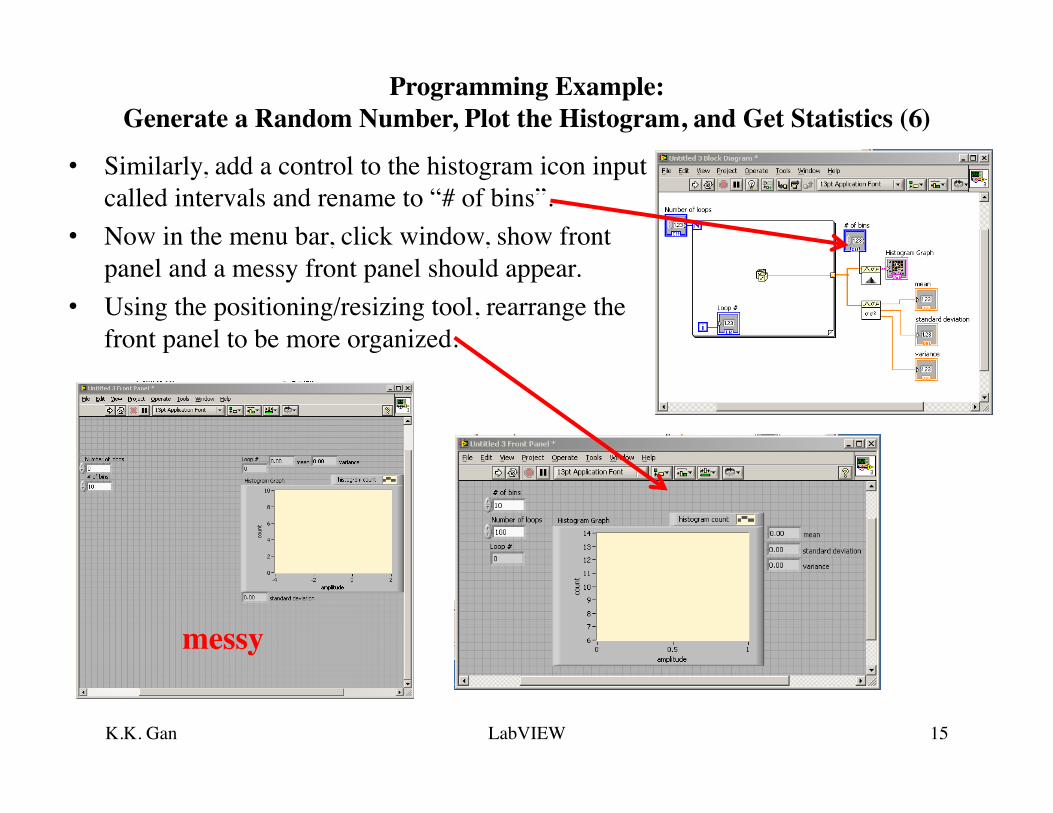
Programming Example: �Generate a Random Number, Plot the Histogram, and Get Statistics (6)
• Similarly, add a control to the histogram icon input called intervals and rename to “# of bins”.
• Now in the menu bar, click window, show front panel and a messy front panel should appear.
• Using the positioning/resizing tool, rearrange the front panel to be more organized.
K.K. Gan 15 LabVIEW
messy
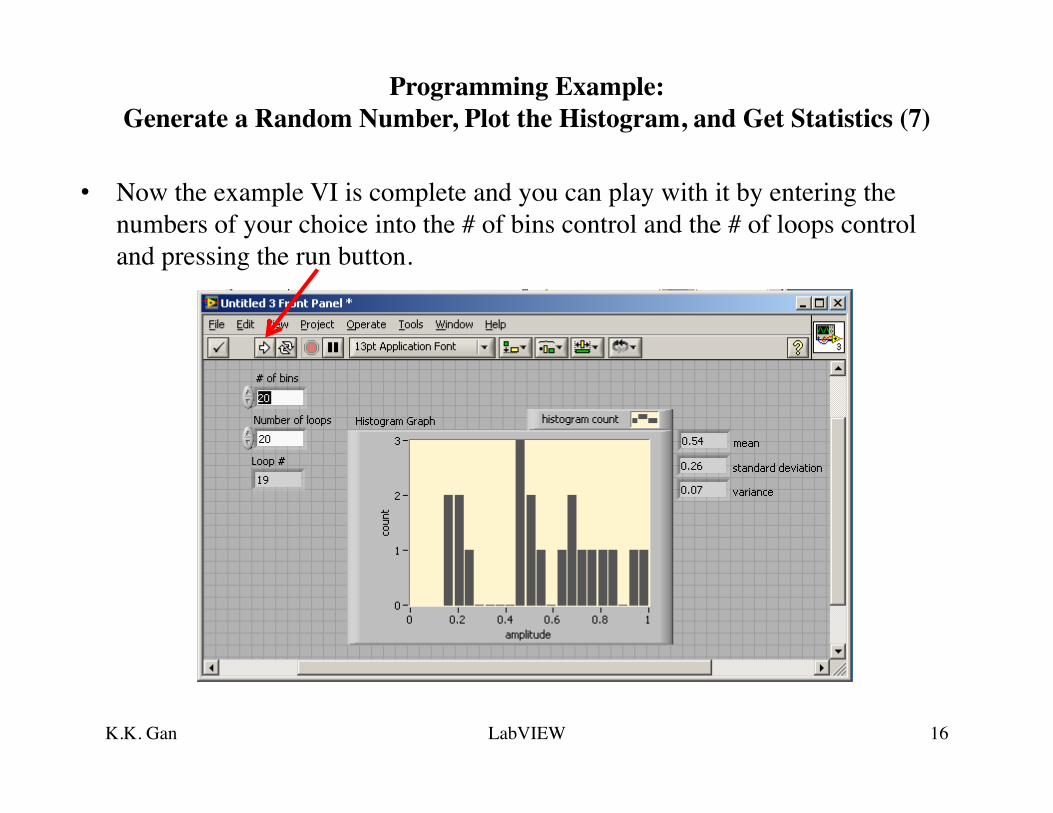
Programming Example: �Generate a Random Number, Plot the Histogram, and Get Statistics (7)
• Now the example VI is complete and you can play with it by entering the numbers of your choice into the # of bins control and the # of loops control and pressing the run button.
K.K. Gan 16 LabVIEW