
LABOUR MARKET POLICY IN AUSTRIA 2012 - Startseite - · PDF file · 2017-10-31labour...
66
LABOUR MARKET POLICY IN AUSTRIA 2012
Transcript of LABOUR MARKET POLICY IN AUSTRIA 2012 - Startseite - · PDF file · 2017-10-31labour...

LABOUR MARKET POLICY IN AUSTRIA 2012
FEDERAL MINISTRY OF LABOUR, SOCIAL AFFAIRS AND CONSUMER PROTECTIONStubenring 1, 1010 ViennaTel.: +43 1 711 00 – 0 [email protected]

This report, a detailed compilation of labour market data, and a short report on the cur-rent trends in the labour market are also available at:http://www.bmask.gv.at/cms/site/liste.html?channel=CH0694
Detailed statistical tables on the development of unemployment and employment in Austria can be accessed from the internet at:http://www.dnet.at/elis/http://www.dnet.at/bali/
IMPRINT
Media owner and publisher: Federal Ministry of Labour, Social Affairs and Consumer Pro-tection; Stubenring 1, 1010 Vienna • Responsible for the content: Division VI of the Federal Ministry of Labour, Social Affairs and Consumer Protection, APF Team • Compiled by: Eva Auer, Dagmar Brandstätter, Andreas Buzek, Manfred Clemenz, Claudia Friedenthal, Peter Grahofer, Birgit Neuhold, Silvia Perfler, Sonja Schmöckel, Anika Türk • Place of publishing and production: Vienna, September 2013 • Layout: Günter Jexenflicker, BMASK • Printed by: BMASK • ISBN: 978-3-85010-334-3 • Ordering information: Available from the BMASK Or-dering Service https://broschuerenservice.bmask.gv.at or by e-mail: [email protected].
All rights reserved: Any use (also in part) of this publication is only allowed with the media owner‘s permission. This is particularly applicable to any kind of reproduction, translation, microfilming, broadcasting on TV and radio, as well as digital processing and data feeding (via Internet or CDs etc.)
Vienna, October 2013

1
INHALT
SUMMARY 3
1 LABOUR MARKET DEVELOPMENT – A DYNAMIC ADJUSTMENT TO STRUCTURAL CHANGES 5
2 THE PRINCIPLES OF AUSTRIAN LABOUR MARKET POLICY 112.1 A comparison of labour market policy in European countries 13
3 SPENDING ON LABOUR MARKET POLICY 153.1 International comparison of Austrian spending on active and activating labour market policy 183.2 Spending according to socio-economic groups 19
4 PERFORMANCE OF THE PUBLIC EMPLOYMENT SERVICE (AMS) AND ACTIVE LABOUR MARKET POLICY 214.1 Job placement by the Public Employment Service (AMS) 214.3 Labour market policy for young peo 27
4.3.1 International perspectives 274.3.2 Labour market policy for young people in Austria 284.3.3 Outlook for the priorities of 2013: medium to long-term reform options 33
4.4 New developments in the employment of foreign citizens 34
5 EFFECTS OF LABOUR MARKET POLICY AND THE COSTS OF UNEMPLOYMENT 375.1 Employment effects of labour market policy and easing of the burden on the overall economy 375.2 Fiscal costs of unemployment 38
6 A SUBSISTENCE INCOME FOR THE UNEMPLOYED - UNEMPLOYMENT IN-SURANCE 416.1 Benefits 416.2 Conditions of entitlement to unemployment benefit 426.3 Amount of unemployment benefit 446.4 Unemployment assistance 456.5 Transition benefit 466.6 Advances on benefits from pension insurance 476.7 Benefits for the promotion of employment 486.8 Sanctions 49

2
7 THE EFFECTIVE USE OF RESOURCES BY THE AMS 53
8 EMPLOYMENT AGENCIES AND PRIVATE RECRUITMENT AGENCIES 2012 55
9 LABOUR MARKET DATA FOR 2012, AMS SUBSIDIES AND BENEFITS IN 2012 57

SUMMAry
3
SUMMARY
The development of the labour market in 2012 was characterised by a further increase in ac-tively employed persons and a simultaneous rise in registered unemployed. Since the crisis year 2009, more than 110,000 jobs have been created in Austria. However, as an increasing number of older workers are remaining in the labour market for longer, and the trend towards higher participation in employment by women is continuing, the additional number of workers has ex-ceeded the growth in new jobs. A further reason is the continuing difficult economic situation in our most important trading countries. In particular, the economic situation in Austria’s main trading partner Germany worsened in 2012. For this reason, the increase in unemployment accelerated to +6.4% in the second half of 2012 (particularly in the export sector) after +4,9% in the first half of the year.
The number of actively employed persons in 2012 remained at a high level of 3,370,479 (up 47,154 or +1.4% year on year).
The trend in the number of unemployed was more unfavourable in the case of men than in that of women: On average in 2012, unemployment rose by 6.7% (+9,260) in the case of men and by 4.4% (+4,681) among women. The tense economic situation had a particularly negative effect on the male-dominated sectors of employment agencies and construction.
Compared to other European countries, Austria had one of the lowest unemployment rates in 2012 at 4.3% (EU-27: 10.5%). With an employment rate of 72.5% in 2011 according to Eurostat, Austria ranked fifth within the European Union after the Netherlands, Sweden, Germany and Denmark (EU-27: 64.1%) .
The funding for active and activating labour market policy measures amounted to around € 2,085 million in 2012. The Public Employment Service’s budget for active labour market promo-tion amounted to € 971 million. Since 2002, the proportion of the total expenditure on labour market policy accounted for by spending on active and activating measures has thus risen by more than 13,6 percentage points to 35,6%.
In 2012, a total of 397,390 persons (of whom 202,221 were women) were included in AMS promo-tional measures, and 1,092,802 new support cases were approved. The greater part of funding relates to the field of qualifications, particularly educational measures (82.5% of persons); the most important mechanisms for promoting employment (18.7% of persons) are integration sub-sidies, socio-economic enterprises and community work projects. Support measures include advisory and support centres, child care benefits and the business start-up programme (24.8% of all persons; multiple subsidies are possible).

4

1 LABOUr MArkET DEvELOPMENT – A DyNAMIC ADJUSTMENT TO STrUCTUrAL CHANGES
5
1 LABOUR MARKET DEVELOPMENT – A DYNAMIC ADJUSTMENT TO STRUCTURAL CHANGES
DEVELOPMENTS IN 2012
» The development of the labour market in 2012 was characterised by a further increase in actively employed persons and a simultaneous rise in registered unemployed. Since the crisis year 2009, more than 110,000 jobs have been created in Austria. However, as an increasing number of older workers are remaining in the labour market for longer, and the trend towards higher participation in employment by women is continuing, the additional number of workers has exceeded the growth in new jobs. A further reason is the continuing difficult economic situation in our most important trading countries. In particular, the economic situation in Austria’s main trading partner Germany worsened in 2012. For this reason, the increase in unemployment accelerated to +6.4% in the second half of 2012 (particularly in the export sector) after +4.9% in the first half of the year.
» The number of actively employed persons in 2012 remained at a high level of 3,370,479 (up 47,154 or +1.4% year on year). viewed according to gender, men benefited from the rise in employment rather more than women on average over 2012: among men, the rise of the number of actively employed persons was 1.3%; in the case of women it was 1.6%. The following sectors were mainly responsible for the rise in actively employed men: manufacturing and commerce, information and communications services, the hospitality industry and construction. Among women it was public administration, the hospitality industry, commerce and manufacturing.
» The trend in the number of unemployed was more unfavourable in the case of men than in that of women: On average in 2012, unemployment rose by 6.7% (+9,260) in the case of men and by 4.4% (+4,681) among women. The tense economic situation had a particularly negative effect on the male-dominated sectors of employment agencies and construction.
» The trend in unemployment among 15-24 year olds in relation to overall unemployment was re-latively favourable in 2012 (unemployed persons aged 15-24: +3.7%, unemployed overall: +5.7). Whereas in the first half of 2012 the rise among men (+3.4%) and women (+3.6%) was roughly equal, there was a clear rise of +6.4% among men in the second half of the year. By contrast, the rise in unemployment among women slowed to 1%.
» For demographic reasons, unemployment among persons over 50 (+9.9%) rose noticeably more than overall unemployment (+5.7%). Unemployment among men and women in this age group rose similarly by +9.6% and +10% respectively in 2012. In the first half of 2012, there was a rise of +9.5% among men, and +9% among women. This increase intensified in the second half of the year to +10.6% among men and +10.2% among women.

1 LABOUr MArkET DEvELOPMENT – A DyNAMIC ADJUSTMENT TO STrUCTUrAL CHANGES
6
EMPLOYMENT
In spite of the sluggish state of the economy in 2012 with real GDP growth of only 0.8%, the number of employment relationships in Austria on average in 2012 - according to the data pub-lished by the Main Federation of Social Insurance Institutions – increased by 43,705 (or 1.3%) to 3,465,453 compared to the previous year. If those completing military service and persons on parental leave who have an ongoing employment relationship are disregarded, there was – on annual average – an increase in the number of actively employed persons of 47,154 (+1.4%) to 3,370,479.
As in the previous year, the number of employees rose constantly from January to December 2012. However, the gradual growth in employment was noticeably weaker in 2012 than in the previous year.For 2013, the Austrian Institute of Economic research is expecting real GDP growth of merely 0.4%, and only in 2014 a slight recovery of GDP growth to a rate of 1.6% (forecast in June 2013).
UNEMPLOYMENT
On average over the year, unemployment rose by 13,941 (+5.7%) to 260,643. The rise in unemploy-ment which already began in the second half of 2011 could be observed in every month of 2012.
Taking participation in training courses into account, the increase in 2012 was +17,312 (+5.6%) to 327,246.
Differentiated according to gender, men were more affected than women: if participation in training programmes is taken into account, male unemployment rose by 4.8% or 8,747 in the first half of 2011, and by 8% or 12,706 in the second half of 2012. By comparison, unemployment among women (adjusted for participation in training courses) rose noticeably less at 3.7% or 5,214 in the first half of 2012 and by 5.7% or 7,958 in the second half of 2012.
Men were disproportionately affected by the rise in unemployment in 2012 (see figure below). On average over the year, male unemployment rose by 9,260 (+6.7% to 148,355), whereas female unemployment rose by 4,681 (+4.4% to 112,288).

1 LABOUr MArkET DEvELOPMENT – A DyNAMIC ADJUSTMENT TO STrUCTUrAL CHANGES
7
Change in unemployment according to gender to the same month in the previous year in %
0
2
4
6
8
10MenWomen
Dec
12
Nov
12
Oct
12
Sep
12
Aug
12
July
12
June
12
May
12
Apr
12
Mar
12
Feb
12
Jan
124.
71.
7
4.2
7.2
2.6
5.7
5.5
7.5
2.4
6.1
4.4
7.1 7.
39.
9
4.5
7.7
3.0
6.7
4.5
8.0
4.5
8.7
4.6
6.8
Differentiated according to sectors, the traditionally male-dominated manufacturing sector1 was clearly less affected (men: +5.6, women: +2.0) than the tertiary sector2 with +6% (men: +7.2%, women: +4.7%).
The potential workforce rose throughout 2012 - on average over the year the increase was by 57,646 (+1.6%) to 3,726,096. The rise in the potential workforce was somewhat greater among men at +1.7% than among women at +1.5%.
THE DYNAMICS OF THE AUSTRIAN LABOUR MARKET
Around 1.7 million employment relationships are entered into each year in Austria and 1.6 mil-lion are terminated. Of the 1.7 million people starting an employment relationship, 284,000 moved directly from another employment relationship, 38,500 were previously self-employed, 528,500 were registered as unemployed with the AMS, and 810,300 were previously classified as not being part of the labour force. The number of employees at the end of December 2012 (3,335,600) results from the number of employees at the end of December 2011 (3,307,100)
1 Proportion of women among the employed 21.1%; among the unemployed 19.4%2 Proportion of women among the employed 54.3%; among the unempoyed 49.2%

1 LABOUr MArkET DEvELOPMENT – A DyNAMIC ADJUSTMENT TO STrUCTUrAL CHANGES
8
plus the new employment relationships (approx. 1.7 million) minus those who left employment relationships (approx. 1.6 million).
Dynamics of the labour market in Austria 2012
Sources: AMS DWH Employment history monitoring. Source of data for active employment: Federation of Austrian Social Insurance Institutions; as of 10.05.2013; rounded figures
With an average fluctuation rate3 of 49%, the Austrian labour market is highly dynamic. However, there is a relatively high concentration in individual sectors: in the seasonal sector, agriculture and forestry have a turnover rate of 256%, tourism has a rate of 146% and the construction industry has a rate of 73%. In the field of other business services, fluctuation amounts to 112% (including employment agencies with 155%), while in the arts, entertainment and leisure sectors it is 94%.
3 Fluctuation (number of those signing on + number signing off)/(2* average number of persons in employment); source: mon_erwerb_chg und mon_erwerb_epi
Number of active employees
12/2011
3,307,100
Number ofself-employed
12/2011
422,400
Number of active
employees
12/2012
3,335,600
Number ofself-employed
12/2012
431,000
Registration with AMS(unemployment,
skills training)
Out of LabourForce
284,800
38,500
39,000
2,300
424,000
319,800
810,300
15,800
528,500
55,500
454.300
53,800
11,200
849,300

1 LABOUr MArkET DEvELOPMENT – A DyNAMIC ADJUSTMENT TO STrUCTUrAL CHANGES
9
Duration of periods of unemployment in days, 2012
0
500
1,000
1,500
2,000
2,5002,
024
1,66
7
1,64
1
1,63
3
967
924
834
773
751
740
714
703
696
646
613
431
410
318
278
229
203
125
Agric
ultu
re a
nd fo
rest
ry
Agen
cy w
orke
rs
Tour
ism
Prov
. of o
ther
bus
ines
s se
rvic
es
Art
s, en
tert
ainm
ent,
leis
ure
Upb
ringi
ng a
nd e
duca
tion
Cons
truc
tion
Priv
ate
hous
ehol
ds
Prov
. of t
ech.
/sci
. ser
vice
s
Prov
. of o
ther
ser
vice
s
Info
rmat
ion
and
com
mun
icat
ions
Hea
lth c
are
and
soci
al s
ecto
rs
Wat
er s
uppl
y/w
aste
wat
er
Tran
spor
t and
war
ehou
sing
Reta
iling
Min
ing
Real
est
ate/
hous
ing
Man
ufac
turin
g
Fina
ncia
l/ins
ur. s
ervi
ces
Ener
gy u
tiliti
es
Publ
ic a
dmin
istr
atio
n
Extr
a-te
rrito
rial o
rgan
isat
ions
An employment relationship in Austria in 2012 lasted for around 600 days on average. This was an increase of 11 days compared to the previous year. The longest durations were recorded in the sectors of extraterritorial organisations with 2,024 days, public administration with 1,667 days, energy utilities with 1,641 days, and financial and insurance services with 1,633 days. At the lower end of the scale are agriculture and forestry with 125 days, tourism with 229 days and the provision of other business services (including employment agencies) with 278 days (including the placement and leasing of workers with an employment duration of 203 days). Key labour market figures at a glance
Change to previous year
2012 Absolute in %Employees 3,465,454 + 43,706 +1.3
Annual average unemployed 260,643 +13,941 +5.7
Long-term unemployed > 6 months 34,701 + 3,194 +10.1
below 12 months 5,368 + 468 +9.6
Inflows to unemployment 1,006,863 + 26,406 +2.7
Outflows from unemployment 1,131,832 + 15,625 +1.4
Inflows of vacancies 408,285 -8,283 -2.0
Unemployment rate (national method) 7.0% + 0.3
Unemployment rate (EU criteria) 4.3% + 0.1
Source: AMS Data Warehouse, Federation of Austrian Social Insurance Institutions, EUrOSTAT

1 LABOUr MArkET DEvELOPMENT – A DyNAMIC ADJUSTMENT TO STrUCTUrAL CHANGES
10

11
2 THE PrINCIPLES OF AUSTrIAN LABOUr MArkET POLICy
2 THE PRINCIPLES OF AUSTRIAN LABOUR MARKET POLICY
According to the Labour Market Promotion Act (AMFG), the Minister of Labour, Social Affairs and Consumer Protection has to contribute towards the achievement and maintenance of full employment and the optimal functioning of the labour market with all means available.
The tasks of the Minister of Labour, Social Affairs and Consumer Protection with respect to the Public Employment Service (AMS) are orientated towards the provisions of the Public Employ-ment Service Act (AMSG), in which labour market policy should, within the federal government’s full employment policy framework, match the supply of and demand for labour as completely, economically and sustainably as possible while maintaining social and economic principles in order to prevent and eliminate unemployment. In this way, a supply of workers for the economy as well as the employment of all persons who are available to the Austrian labour market should be ensured as far as possible. This includes providing a subsistence income during unemploy-ment within the framework of legal provisions.
The labour market policy implemented by the Public Employment Service within the framework of the law concentrates on the provision of the following services:
» The placement of suitable workers in jobs » Providing support in the elimination of obstacles to the placement of workers » Measures to increase the transparency of the labour market » reducing the quantitative or qualitative imbalances between labour supply and demand by
means of retraining and upskilling in line with labour market needs. » Saving jobs if this is in the interests of an active labour market policy » Providing a subsistence income to the unemployed within the framework of unemployment
insurance.
The placement of workers (and thus the filling of job vacancies) and the provision of a subsistence income in the form of unemployment benefit and unemployment assistance form a functional and institutional unit which ensures that the principle of ‘priority for activation before the pas-sive provision of benefits’ is applied.
Labour market policy is currently being carried out according to the targets set in 2010 by the Minister of Employment, Social Affairs and Consumer Protection for the Public Employment Service to carry out labour market policy. The current labour market policy objectives focus on the following goals.

2 THE PrINCIPLES OF AUSTrIAN LABOUr MArkET POLICy
12
THE GOAL IS TO:
» Counteract the exclusion of persons or groups of persons in the labour market in the interests of equal opportunities
» Ensure that periods of unemployment are as short as possible, preferably by placement in job vacancies
» Integrate persons threatened by long-term unemployment into the labour market as sustai-nably as possible with the aid of labour market policy tools
» Attempt to (re-)integrate persons into working life at an income and qualifications level which is as high as possible
» Strongly promote the equal treatment of the sexes and to counteract gender-specific labour market segregation
» Further increase the effectiveness and efficiency of measures » Further develop early intervention » Make the specialist occupational potential of persons with migrant backgrounds visible and
usable » Fill job vacancies as quickly and fittingly as possible » Offer advice and support for the preparation towards taking up self-employment and/or
ending a period of unemployment » keep people in employment as far as possible, also with the aid of labour market policy tools » Make use of periods of involuntary under-employment (e.g. short-time working and seasonal
unemployment) to acquire skills and obtain qualifications » Conceive and offer qualifications programmes and qualifications which are suited to the
respective target groups and which have a promising future » Examine and improve the quality and sustainability of skills training » Provide an adequate subsistence income during skills training » Further develop the instrument of individual advice and support for jobseekers with frequent/
longer periods of unemployment, with the goal of achieving improved and more sustainable labour market integration (e.g. via targeted comprehensive support during the reintegration process – case management)
» Offer companies advice so that they can create and promote new working hours models as well as new opportunities for their employees to obtain skills/qualifications, whereby parti-cular focus should be placed on the gender-specific distribution of working hours
» Push for early notification of unemployment with a strong emphasis on self–service – without the limitation of other services
» Increase transparency in the labour market » Intensify customer orientation and to offer precisely matched placements » Ensure the quality and transparency of the IT system.

13
2 THE PrINCIPLES OF AUSTrIAN LABOUr MArkET POLICy
These objectives are closely linked to those of the guidelines for employment policy measures of the Member States within the framework of ‘Europe 2020 – a strategy for smart, sustainable and integrative growth’ which obliges the Member States to implement the following main points:
» Increase of the employment rates of women and men, the reduction of structural unemploy-ment and the promotion of high quality jobs
» The development of a workforce whose qualifications correspond to the requirements of the labour market, and the promotion of lifelong learning
» Increasing the quality and performance levels of the general and vocational education systems at all levels and improving access to higher education or to equivalent forms of education
» Combating poverty and social exclusion
The Europe 2020 strategy requires that every Member State should present a National reform Programme for Growth and Employment by the end of April of each year at the latest. The 2011 Austrian reform Programme, which is based on the draft programme of November 2010, illus-trates how the objectives and obligations of the Europe 2010 strategy are to be implemented at a national level. The measures mentioned in the Austrian reform Programme to achieve the national Europe 2020 objectives focus on the years 2011 and 2012 and are divided into five nati-onal goals in accordance with the Europe 2020 core objectives. The themes of entrepreneurship and competition are dealt with as an additional field.
The parts which are relevant for labour market policy targets are the headline targets of employ-ment and, in some areas, the reduction of poverty and social exclusion.
See also http://www.bmask.gv.at/site/Arbeit/Arbeitsmarkt/Arbeitsmarkt_und_EU/
2.1 A comparison of labour market policy in European countries
The Public Employment Service has initiated an international comparison together with other labour market administration services in Europe and is playing a leading role in the EU project Mutual Learning - Benchmarking among PES. In 2012, a total of 23 public employment services from the following countries participated: Belgium, Germany, the Uk, Estonia, Finland, France, Ireland, Italy, Croatia, Latvia, Lithuania, Luxembourg, Malta, the Netherlands, Austria, Sweden, Switzerland, Slovenia, Hungary, the Czech republic and Cyprus. The particular challenge in this project is - in spite of very differing national tasks, objectives, priorities and measuring methods – to draw up results indicators which make benchmarking possible. This was achieved by means of precise descriptions of national procedures and the national context variables, which have a considerable influence on the results and enable a plausible interpretation of the indicator values. The focus of the benchmarking project is on mutual learning and the exchange of good practice. The variables and indicators on jobseekers were revised and adapted in recent years. Since then, a differentiation has been made according to gender and age, and sub-indicators

2 THE PrINCIPLES OF AUSTrIAN LABOUr MArkET POLICy
14
on the use of online services have been introduced. For example, AMS Austria has been able to benefit from the experience of Sweden in customer satisfaction. We have also been able to learn about the multi-channel strategy and online services from countries such as the Netherlands, Belgium and Sweden. Examples of good practice which can be useful to the AMS for future de-velopments have been located in the fields of staff competence, profiling and education advice. When comparing indicators on events in the labour market, great care and a good knowledge of national differences are necessary to be able to comment on them. AMS Austria achieves good results among jobseekers overall. For example, AMS Austria is in first place in the category ‘change from unemployment to employment as a proportion of all registered unemployed’. Its results among women and those over 50, however, could be improved. In comparison to other participating countries, AMS Austria needs to make ground among women and older people in ‘the change of unemployed persons to employment as a proportion of all de-registrations’, among other things.

15
3 SPENDING ON LABOUr MArkET POLICy
3 SPENDING ON LABOUR MARKET POLICY
In 2012, the AMS’ budget for active labour market promotion including short-time working amoun-ted to € 971 million; the total for active and activating labour market policy was € 2,085 million.
The budget for skills training, support and the promotion and subsidisation of the employment of jobseekers and those threatened by unemployment was thus – due to the positive economic development in 2011 – reduced by 11.5% compared to 2010. However, the 2012 budget was still 0.9% higher than the previous year’s figure and was thus 14.6% above the funding for active and activating labour market policy in 2008.
The proportion of the total expenditure on labour market policy accounted for by spending on active and activating measures has thus risen by more than 13.6 percentage points to 35.6% since 2002. This signifies that the AMS’ room for intervention has improved considerably and that activation strategy is reflected in labour market policy.
In the federal budget estimate for the cost of conducting labour market policy, the level of funding provided to the Public Employment Service in Austria (AMS) for active and activating labour market policy in 2013 has been adjusted in accordance with the continuing difficult state of the employment market.
Active and activating labour market policy1) in EUr millionsactive labour market policy 2)
2002 2003 2004 2005 2006 2007 2008 2009 2010 2011 2012 2013*
AMS 628 700 711 712 847 846 882 1,120 1,079 975 971 1,058
Federal Ministry of Labour, Social Affairs and Consumer Protection - Division vI
38 66 82 73 80 61 30 57 52 43 41 80
BMASk-IEF apprenctice training bonus4) 85 120 125 132 139 143 63 30
IEF-BMASk benefits under section 19 voc. Training Act
5 71 163 159 163 159
Total for active labour market policy 666 852 913 910 1,059 1,046 1,060 1,310 1,324 1,177 1,174 1,297
activating labour market policy
2002 2003 2004 2005 2006 2007 2008 2009 2010 2011 2012 2013*
Activating LMP for skills training3) 169 219 270 354 429 409 400 583 757 661 703 770
PT allowance for older workers 230 417 564 502 456 411 358 290 255 228 207 220
Total 399 636 833 857 885 820 758 873 1.012 889 910 991
total active + activating labour market policy
2002 2003 2004 2005 2006 2007 2008 2009 2010 2011 2012 2013*
Active + activating LMP 1,065 1,488 1,746 1,766 1,944 1,866 1,819 2,183 2,335 2,066 2,085 2,288
Change to previous year in percent +17.0 +39.7 +17.4 +1.2 +10.0 -4.0 -2.5 +20.0 +7.0 -11.5 +0.9 +9.7
1) Without company-related labour market subsidies according to the Labour Market Promotion Act2) Paragraphs 1/2011*, 1/2023* short-time working subsidies, activation subsidies and apprentice training subsidies under section §13e Insolvency Act
(IESG)3) Including social insurance contributions for activating UI benefit and for subsistence allowance according to Section 35 Public Employment Service
Act (AMSG)4) Earmarked funding* 2013: Estimate

3 SPENDING ON LABOUr MArkET POLICy
16
The spending on purely passive benefits to provide a subsistence income for unemployed per-sons rose by around 5% in 2012.
Training and obtaining qualifications forms a key focus of the AMS’ labour market support schemes and accounts for around 66% of the AMS’ programme budget (including short-time working) and around 82% of approved subsidy cases and newly subsidised persons.
A total of 347,235 persons received funding for the first time in 2012 as part of the AMS’ labour market promotion measures. As one person can be granted several subsidies, a total of over 1 million subsidy cases were approved and processed. The number of people supported for the first time rose by around 31,200 (9.9%) compared to 2011. The percentage of women among those receiving support for the first time was around 51%.
Subsidies and benefits paid for the purposes of activation include a wide range of benefits based on unemployment insurance legislation, including pro rata social insurance contributions which are used for activation purposes and not as an explicit wage replacement income (such as unemployment benefit and unemployment assistance). This category of benefits includes: » Part-time benefit for older workers » Unemployment benefit/unemployment assistance for training » Unemployment benefit for rehabilitation » Unemployment benefit for foundation programmes and re-employment benefits » Solidarity bonus and further education/training benefit.
Funding from UI for active LMP measures*) in EUr millions
2002 2003 2004 2005 2006 2007 2008 2009 2010 2011 2012
vocational mobility (AD/ND), training after
receipt of child care benefit (kUG)113.4 149.3 179.1 270.6 326.5 302.6 281.2 362.3 446.7 393.1 446.0
Labour foundation unemployment benefit
(incl. temporary support)40.6 54.4 56.7 64.3 68.4 65.8 68.7 109.6 153.8 118.8 92.2
re-employment benefit after kUG 0 0 0 0 0 0 0 0 0 0 0
Unemployment benefit for rehabilitation
measures8.7 8.8 6.5 2.2 0.4 0.04 0.02 0.04 0.01 0 0
PT allowance for older workers 230.3 417.3 563.5 502.4 455.9 411.3 358.3 289.7 255.1 227.9 207.2
Further education benefit (educational leave)
and solidarity bonus6.0 6.9 7.7 12.1 9.5 10.2 21.9 74.7 108.1 109.8 131.8
*) Active use of ‘passive’ unemployment insurance funding including the SI contributions paid for these measures and for AMS services. Since 2009, short-time working subsidies are paid for from hhrechtli ansatz of insurance benefits (and no longer from funding for labour market promotion). Spending related to short-time working, however, is still summarised under active labour market policy. 2002-2004 without health insurance contri-butions, as these were paid as a lump sum to the Federation of Austrian Social Insurance Institutions during this period.
Sources: AMS Austria Annual reports; AMS Data Warehouse; 2002 Implementation report for the NAP, BMASk Division vI

17
3 SPENDING ON LABOUr MArkET POLICy
Expenditure and subsidy cases in active labour market policy In the years 2008, 2009, 2010, 2011 and 2012
Activating subsidies and benefits
Gen. support cases and
expenditure 2008
Gen. .support cases and
expenditure 2009
Gen. support cases and
expenditure 2010
Gen. support cases and
expenditure 2011
Gen. support cases and
expenditure 2012
Active and activating measures of the AMS and the Federal Ministry of Labour, Social Affairs and Con-sumer Protection including appren-tice training bonus and short-time working1
€ 1,818.4 m € 2,182.9 m € 2,335.4 m € 2,066 m € 2,085.3 m
including: AMS subsidies (without activating expenditure)Total qualifications measures (AMS DWH)
716,315 896,150 894,529 782,953 897,155
Spending on qualifications measu-res acc. to AMS-DWH
€ 611.8m € 699.7 m € 687m € 666.7 m € 640.5 m
Promotion of educational measures (EM)
164,227 206,156 217,707 186,681 211,693
Spending on EM (training, initial and further training etc.)
€ 360.9m € 444.4m € 431.2 m € 455.5m € 432 m
Child care allowance (CCA) 11,241 9,134 8,830 9,800 10,896
Expenditure on CCA € 5.6m € 4.1 m € 4 m € 4.5 m € 5.1 m
Company integration subsidies for problem groups (CIS)
27,068 29,135 37,261 25,799 30,256
Expenditure on CIS € 73.9 m € 82m € 116.5 m € 61 m € 68.3 m
Non-profit employment projects (NEP)
5,753 7,079 6,303 5,764 5,520
Expenditure on NEP € 47.2 m € 56.4m € 40.5 m € 44.7 m € 41.1 m
Socio-economic enterprises (SEE) 14,620 18,050 20,465 22,373 26,861
Expenditure on SEE € 70.3 m € 79.9 m € 82m € 96.4 m € 114.9 m
Women in promotional measures (incl. short-time working)
449,579 553,603 550,143 494,172 557,975
AMS expenditure on subsidies for women 2) € 425.9 m € 490.3 m € 495.6m € 454 m € 457.8 m
People with disabilities in subsidy measures
119,848 135,321 143,855 137,352 156,482
AMS expenditure on subsidies for people with disabilities3) € 139.9 m € 151m € 145.6m € 149.5 m € 155.6 m
Total approved support cases (with short-time working subsidies but without apprentice training bonus)2)
857,238 1,231,338 1,125,238 956,958 1,092,802
1) Without company-related labour market subsidies from the Federal Ministry of the Economy, Families and youth and/or the Federal Ministry of Labour, Social Affairs and Consumer Protection (BMASk) [including social insurance contributions for activating LMP for skills training and subsistence allowances according to Section 35 of the Public Employment Service Act, part-time allowance for older workers, short-time working subsidies, app-rentice training bonus and apprentice subsidies according to Section 19c vocational Training Act; §19c]
2) AMS Austria Annual reports (including short-time working)3) Estimate by BMASk/Division vI - only expenditure on subsidies, without activating UI funding Source: AMS, BMASk

3 SPENDING ON LABOUr MArkET POLICy
18
3.1 International comparison of Austrian spending on active and acti-vating labour market policy
In an international comparison, Austria was slightly above the European (unweighted) average of OECD member states (0.58%) in 2011 (most recent available figures), with spending on active and activating labour market policy (according to EU and OECD definitions) accounting for 0.75% of GDP. If the proportion of GDP accounted for by active labour market policy is standardised to 1% of the unemployment rate in order to be able to genuinely compare the different labour market situations and problems, Austria’s position is improved. With a figure of 0.18%, Austria is among the top three of all OECD states.
2011: Expenditure on active and activating labour market policy in % of GDP (per percentage point of the unemployment rate)
0.00 0.05 0.10 0.15 0.20 0.25 0.30 0.35Expenditure as a % of GDP
Mexico (2011)
United States (2011)
Greece (2010)**
Slovak Republic (2011)
Hungary (2011)
Canada (2011)
Czech Republik (2011)
New Zealand (2011)
Spain (2011)
Poland (2011)
Portugal (2011)
United Kingdom (2009/2010)
Italy (2011)
Australia (2011)
Japan (2011)
Ireland (2010)
Korea (2011)
France (2011)
Luxembourg (2011)
Finland (2011)
Germany (2011)
Norway (2011) **
Sweden (2011)
Austria (2011)
Belgium (2011)
Netherlands (2011)
Denmark (2011) 0.297
0.252
0.221
0.179
0.140
0.136
0.131
0.134
0.117
0.094
0.097
0.069
0.059
0.056
0.049
0.049
0.046
0.043
0.041
0.040
0.040
0.035
0.033
0.022
0.017
0.016
0.002
** Greece, Norway: LMP Categories 2-7, Expenditure for active labour market policyData Source: OECD (Employment Outlook 2013), EUrOSTAT; calculation BMASk

19
3 SPENDING ON LABOUr MArkET POLICy
Compared to countries with similar levels of unemployment, it can thus be concluded that labour market policy interventions in Austria are highly effective and efficient. This is also confirmed by the fact that the AMS as the main organisation for the implementation of labour market policy has obtained excellent results in comparison to similar organisations abroad and is considered internationally to be an example of best practice with regard to key performance indicators.
3.2 Spending according to socio-economic groups
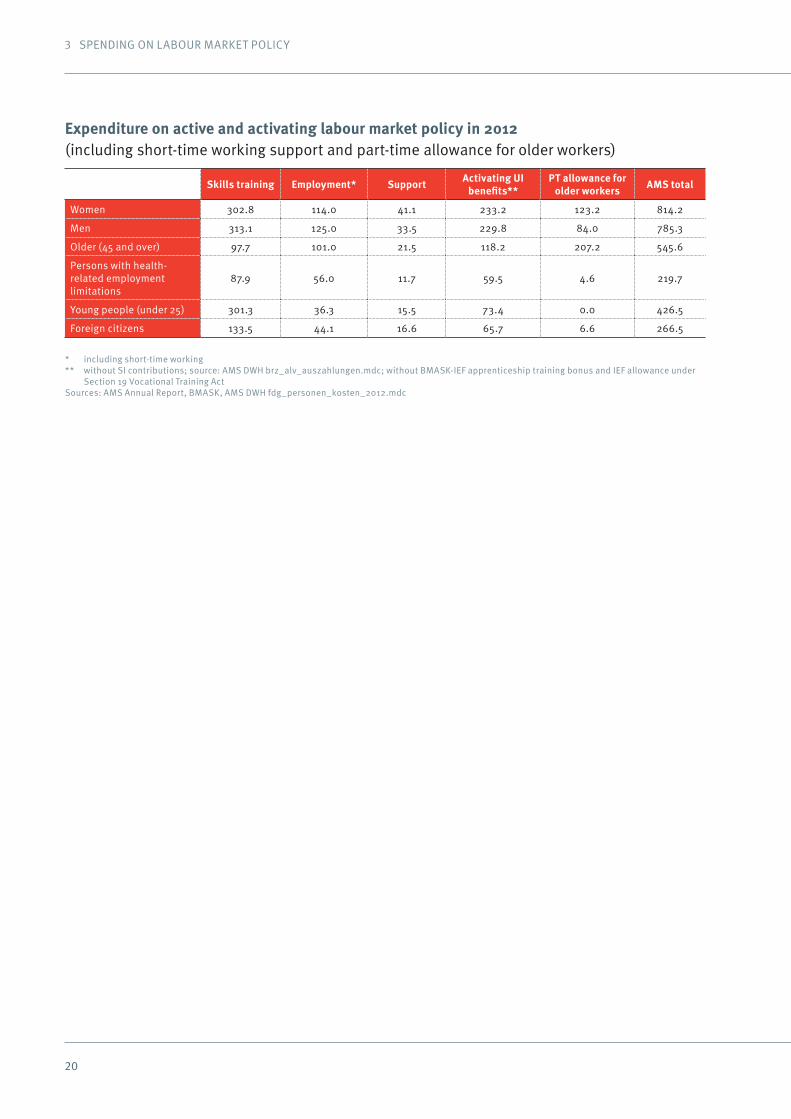
In 2012, 49.3% of the AMS’ gender-assignable programme budget was used for active measures (without short-time working) for women (€ 455.9m). This proportion should be seen against the background that in 2012 around 43% of the annual average number of registered unemployed were women (or around 43% of those persons affected by unemployment). The overall spending in 2012 on active and activating labour market policy (not including the apprenticeship training bonus) amounted to € 814.2m on women and € 785.4m on men.
LMP funding used for women and men in 2012*
Gender-assignable AMS measures
Not gender-specific assignable measures
Change between 2011 and 2012*
in EUr millions Women Men Women Men
Subsidies and activating LMP 2011* 2012* 2011* 2012* 2011* 2012* Ver. in % Ver. in %
Skills training 311.8 302.8 329.1 313.1 25.9 24.6 -2.9% -4.8%
Employment 103.4 114.0 115.2 125.0 2.6 3.3 10.2% 8.5%
including short-time working 2.2 1.9 3.9 2.1 0.0 0.0 -12.9% -45.2%
Support 38.8 41.1 34.0 33.5 14.0 13.6 5.8% -1.3%
Sub-total active LMP
including short-time working454.0 457.8 478.3 471.6 42.4 41.6 0.8% -1.4%
Activating UI benefits** 209.0 233.2 221.4 229.8 0 0 11.6% 3.8%
Sub-total active and activating LMP
without part-time allowance for older
workers
663.0 691.0 699.7 701.5 42.4 41.6 4.2% 0.3%
PT allowance for older workers 127.0 123.2 100.9 84.0 - - -3.0% -16.7%
Total 790.0 814.2 800.5 785.4 42.4 41.6 3.1% -1.9%
* Without BMWA-IEF apprenticeship training bonus and IEF allowance under Section 19 vocational Training Act** Without social insurance contributions, without part-time allowance for older workers; AMS DWH Datenwürfel brz_alv_auszahlungen.mdcSources: AMS Annual reports, AMS DWH
In view of the necessary multiple allocations, it is impossible to add up LMP spending on in-dividual groups. For example, the spending on men with disabilities is shown in the category ‘people with disabilities’ as well as the category ‘men’.
3 SPENDING ON LABOUr MArkET POLICy
20
Expenditure on active and activating labour market policy in 2012 (including short-time working support and part-time allowance for older workers)
in EUr millions Skills training Employment* Support Activating UI benefits**
PT allowance for older workers AMS total
Women 302.8 114.0 41.1 233.2 123.2 814.2
Men 313.1 125.0 33.5 229.8 84.0 785.3
Older (45 and over) 97.7 101.0 21.5 118.2 207.2 545.6
Persons with health-related employment limitations
87.9 56.0 11.7 59.5 4.6 219.7
young people (under 25) 301.3 36.3 15.5 73.4 0.0 426.5
Foreign citizens 133.5 44.1 16.6 65.7 6.6 266.5
* including short-time working** without SI contributions; source: AMS DWH brz_alv_auszahlungen.mdc; without BMASk-IEF apprenticeship training bonus and IEF allowance under
Section 19 vocational Training ActSources: AMS Annual report, BMASk, AMS DWH fdg_personen_kosten_2012.mdc

21
4 PErFOrMANCE OF THE PUBLIC EMPLOyMENT SErvICE (AMS) AND ACTIvE LABOUr MArkET POLICy
4 PERFORMANCE OF THE PUBLIC EMPLOYMENT SERVICE (AMS) AND ACTIVE LABOUR MARKET POLICY
4.1 Job placement by the Public Employment Service (AMS)
Eliminating unemployment via the matching of workers with vacancies and the filling of job va-cancies are among the main tasks of the Public Employment Service (AMS). In order to ensure that jobseekers are matched with vacancies as quickly and fittingly as possible, the AMS draws up a support agreement at the start of unemployment together with the customer. In the support agreement, the basic conditions, the support target, and the activities of the AMS and the custo-mer are laid down. To provide better orientation and understandability, the agreement is printed out and given to the customer and is considered binding. The AMS takes the needs of jobseekers into account in its support and advisory work, and – if it is meaningful in terms of labour market policy – works with instruments such as skills training, benefits and employment subsidies in order to provide the best possible placement service for its customers. Special services in the form of case management are available for customers with multiple problem situations.
When the AMS is notified of a vacancy, a service agreement is concluded with the company which regulates the procedure to be followed for filling the vacancy (e.g. pre-selection, subsidies, EU-wide personnel recruiting). The needs of large companies which have branches or locations in several provinces are dealt with by the AMS’ key account management. key account management increases service orientation towards companies which are active in different parts of the country. In 2012, 400 companies throughout Austria were supported by key account management, and 110,177 job vacancies were acquired. In addition, the AMS offers companies the pre-selection of candidates as an additional high quality service. In 2012, pre-selection was carried out in 16.5% (2011: 12.5%) of orders.
EURES
EUrES – the European job network of the public employment services of the EEA countries and Switzerland – promotes the European-wide exchange of vacancies and workers’ mobility”. Within the framework of EUrES, Austria works in the cross-border partnerships of Pannonia, Transtirolia and Bodensee together with neighbouring regions. In addition, the job network is also involved in cross-border activities with Slovenia and Germany.
Overall, 880 EUrES advisors provide support throughout Europe to workers and companies. A total of 14 EUrES advisors work in Austria. The shortages of personnel in winter tourism in Aus-tria have been considerably reduced. In the winter season 2012/2013, around 700 jobseekers from the EEA were placed with Austrian tourism businesses. The interest of Austrian workers in looking for jobs across Europe is also increasing. A total of more than 8000 workers and 1,450 companies from Austria use a ‘My EUrES account’ for their jobseeking or personnel recruitment.

4 PErFOrMANCE OF THE PUBLIC EMPLOyMENT SErvICE (AMS) AND ACTIvE LABOUr MArkET POLICy
22
ONLINE SERVICES OF THE PUBLIC EMPLOYMENT SERVICE
Jobseekers and companies have personal online access to the services of the AMS via their eAMS account. via their eAMS account, users can change address and contact details, view payment data, access placement suggestions and make applications for AMS benefits online. All of this can also be done outside the opening hours of AMS offices. In 2012, 148,200 customers opened a new eAMS account – one in four persons seeking a job or an apprenticeship now has an active eAMS account. Customer support consists of personal interview appointments and contact via eAMS account. The proportion of these two elements will be agreed upon according to needs. The extension of eAMS account services and communication via this channel will also have particular significance in the future.
Companies and businesspeople also have the opportunity to change their address and contact details via their eAMS account, to advertise vacancies and to make online applications for the employment of foreign workers or for AMS benefits. In 2012, 6,600 companies used an eAMS account.
The eJob room is a platform where jobseekers can find vacancies and where businesses can find new employees. Jobseekers and companies can get in touch with each other directly and make applications or place job advertisements online. There were an average of around 94,000 vacancies posted in the eJob-room in 2012 and approximately 203,000 applications. Of these, around 19,000 applications and 18,000 job offers were entered using self-service. The further extension of self-service is being accelerated by the complete redesign of eJob room.
CUSTOMER SATISFACTION
A client monitoring system (CMS) is used to systematically record the satisfaction levels of cus-tomers with the services of the AMS in all the regional offices on a quarerly basis. These results are considered highly significant and flow into the ongoing process of improving service offers and into the labour market policy steering mechanisms of the AMS. With 75.2% very satisfied or satisfied companies, the best results since the initiation of the CMS survey were achieved in 2012. After a decrease in the previous year, the proportion of jobseekers who are satisfied or very satisfied with the AMS remained stable at 67%. The accuracy of placements, the support agreement and the assistance provided in making applications and punctual benefits payment are the factors with a strong influence on the satisfaction of customers. Apart from receiving a subsistence income, the personal contact between customers and their AMS advisor is an important point when it comes to customer satisfaction. 85% of jobseeking customers affirm that “The advisor takes my personal situation into ac-count and we look for a solution together” and “The advisor informs me correctly and concisely”. Contact with the advisor also plays a key role for business customers. Whereas the AMS advisors and their support in matters related to benefits are among the strengths of the AMS, there is still considerable room for improvement in the accurate matching of vacancies with customers.

4 PErFOrMANCE OF THE PUBLIC EMPLOyMENT SErvICE (AMS) AND ACTIvE LABOUr MArkET POLICy
23
The ServiceLines have been an expression of the AMS’ customer orientation for many years now. Both workers and companies appreciate being able to resolved their concerns quickly and unbu-reaucratically on the telephone. In 2012 a total of 4.5m calls were taken by the ServiceLines. The overall satisfaction of customers with the ServiceLine rose from 77.1% in 2011 to 78.8% in 2012.
CAREERS ADVICE AND CAREERS INFORMATION
High quality, early and comprehensive careers and educational advice is of crucial importance, particularly as a preventive measure to avoid young people breaking off school and training. Careers information and advice and the subsequent careers choices are the first opportunities to break up segregation in the labour market. Gender-sensitive careers guidance can create in-terest among girls for technical and scientific occupations and extend the room for manoeuvre of girls and boys with regard to their choice of work.
There are 66 Careers Information Centres (BIZ) in Austria where young people and adults can obtain free information about various occupations, job opportunities, training and further training paths. Alongside personal advice and lectures, the AMS also provides modern media libraries with a wide range of information materials such as brochures, information folders and video films. It is also possible to take a computer-based occupational interests test which can help to provide individuals with information about which careers would be suited to them.
The participation of all the pupils of the 7th and 8th school years at a schools event at a care-ers information centre of the AMS or the social partners is designed to ensure that each pupil becomes familiar with a competent information centre for careers and educational information. In 2012, around 66,600 pupils informed themselves about career and training opportunities (+20.5% compared to 2011) during a school class visit.
Teachers and pupils both gave positive evaluations of their visits to the BIZ. 84% of teachers were very satisfied with the contents, the presentation and the support of the BIZ advisors. Pu-pils also obtained new ideas for their decisions with regard to careers and education/training.
The proportion of adult visitors is still markedly high at 59%. The information events for adults were mainly centred on new developments in the employment market. Overall there were a total of 470,200 visitors (adults, young people, individuals and groups) in the Careers Information Centres.
The careers information on the AMS website http://www.ams.at/buw.html provides information on occupations, payment, initial and further training and labour market data, and offers brochu-res for downloading. The online offers and information are presented in subject-related blocks in the form of a ‘careers compass’, which makes navigation and orientation simpler.

4 PErFOrMANCE OF THE PUBLIC EMPLOyMENT SErvICE (AMS) AND ACTIvE LABOUr MArkET POLICy
24
In addition, the youth platform Arbeitszimmer (Workroom) www.arbeitszimmer.cc offers in-formation about choosing schools, university courses and careers. On these platforms, young people and adults can obtain information, tips and ideas for careers choices and for vocational re-orientation, and can at the same time take advantage of various opportunities such as a so-called visual company search and interactive training on how to make applications.
In the AMS research Network, the activities of around 50 private and public research institutions in the fields of research into the labour market, occupations and qualifications are networked. The extensive online platform offers news, events, publications and web tips, among other things.
4.2 AMS-driven labour market support schemes
INDIVIDUALISED PRESENTATION
In 2012, a total of 397,390 persons (of whom 202,221 were women) were included in AMS pro-motional measures, and 1,092,802 new support cases were approved. Below you will find a table of AMS programmes on the basis of the total number of persons participating.
AMS Austria subsidies and benefits in 2012
Number of persons
Total
Absolute change to the previous year
Change to the previous year
in %of whom women
Absolute change to the previous year
Change to the previous year
in %
All subsidies and benefits 397,390 +20,299 +5.4% 202,221 +9,211 +4.8%
Employment 74,466 +8,365 +12.7% 36,168 +3,551 +10.9%
Skills training 327,966 +18,028 +5.8% 165,758 +7,568 +4.8%
Support 98,713 +7,739 +8.5% 53,186 +4,913 +10.2%
** Number of persons: Numbers of persons are counted unequivocally by means of PST keys across all dimensions in relation to the respective number of subsidy cases. support cases In unequivocal counting, a person is counted in each category in which they appear, but only once overall.
Source: AMS DWH fdg_personen_1012
In 2012, the AMS supported 20,299 persons (+5.4%) more than in the previous year. The major part of subsidies can be assigned to the field of skills training – 82.5% of the persons who took part in AMS programmes (+0.4% compared to the previous year), fall into this category. 17.4% of participants (-4.7%) received employment subsidies and 24.8% of all persons (+0.6%) were included in support measures.
The relative overall increase in the number of persons subsidised by the AMS compared to the previous year (+12.7%) is primarily caused by the rise in employment subsidies – the increa-sed granting of integration subsidies (+12.6%) and increased participation in socio-economic enterprises (+23.2%).
In the area of skills training, the most frequent subsidies were those to cover living costs (240,490 persons). Subsidies for educational measures were received by 195,368 persons, and

4 PErFOrMANCE OF THE PUBLIC EMPLOyMENT SErvICE (AMS) AND ACTIvE LABOUr MArkET POLICy
25
allowances for ancillary course costs were paid to 205,949 persons. 50,517 unemployed persons took part in courses provided by external educational providers. 47,565 employees also took part in AMS-subsidised skills training. Subsidies for apprenticeships were paid for a total of 12,882 persons; this financial support was primarily provided for disadvantaged young people and girls in occupations with a low proportion of women.
INDIVIDUALISED PRESENTATION
The total number of participants in the three major types of subsidisation, i.e. skills training, subsidies to employment and support, is higher than the total number of all participants per year. The reason for this is that a person can, for example, receive both support subsidies and skills training subsidies in the reporting period.
Skills training measures and related benefits include skills training for jobseekers, skills training for employees (QfB); skills training for employees on short-time work (Qfk), labour foundations (AST); orientation- and skills training measures and support for active jobseeking for the unemployed (BM); subsistence allowance (DLU); benefits to cover course costs and ancilliary course costs (kk, kNk) and subsidies for apprenticeships (LEHr, SZL). Employment measures and related benefits include company integration subsidies (BEBE), non-profit em-ployment projects (GBP), socio-economic enterprises (SÖB), benefits for one-person companies (EPU), the solidarity bonus (SOL), the journey to work benefit (ENT), subsidies for short time working (kUA) and the wage top-up system (kOMB). Support measures and related benefits include the promotion of labour market policy advisory and support facilities (BBE), start-up subsidies (GB), the business start-up programme (UGP), child care subsidies (kBE), subsidies for child care facilities (kBE) and interview allowance (vOr).
In the field of employment subsidies, the main focus was on company integration subsidies (BEBE), which were received by 33,261 persons. Employment subsidies were awarded to 32,018 persons in socio-economic enterprises (SÖB) and employment projects in the non-profit sector (GBP). Employment subsidies are practically always (except in the case of journey to work be-nefit) paid directly to companies or job scheme operators, who in return for this provide work for unemployed persons or refrain from making workers redundant (short-time work subsidies). The number of persons subsidised via short-time working benefit fell by 8.3% in 2012.
The most frequent subsidies paid as part of support measures relate to advice and support fa-cilities (76,493 unemployed persons were supported in such facilities) and the AMS child care allowance (7,210 persons), which is the reason for the high proportion of women in this area. Subsidies related to start-ups (start-up subsidies and advisory services as part of the business start-up programme) were also provided on behalf of a further 8,024 persons.

4 PErFOrMANCE OF THE PUBLIC EMPLOyMENT SErvICE (AMS) AND ACTIvE LABOUr MArkET POLICy
26
SELECTED FUNDING PRIORITIES
The AMS continued the multi-year skills training programme FiT (Women in Skilled Trades and Technology) in 2012. This programme motivates women to take up training in non-traditional occupations. Alongside an apprenticeship, there are also AMS subsidies for attending specia-list schools, technical colleges or universities of applied sciences. Preparatory and supporting measures such as careers guidance, advice (also with regard to child care) and support during training also form part of the programme.
In 2012, 3,639 women took part in a preparatory Broaden your Perspectives course. 2,260 wo-men took part in preparatory manual/technical skills training, and 1,185 women completed a non-traditional training programme, with a completed apprenticeship being the minimum level reached. The overall costs for the programme in 2012 amounted to around EUr 21m.
The labour market and employment policy focus on older people has been further developed and extended in recent years. The package of measures taken to increase the integration into the labour market of older people is diverse and ranges from the reduction of non-wage labour costs via the safeguarding of existing employment relationships to the active support of the re-integration of jobseekers.
In 2012, the AMS awarded subsidies to around 67,324 persons over the age of 50, whereby a large number of people from this age group participate in employment programmes and account for more than a third of those taking part.
An analysis according to age groups shows a significant involvement of young people in active labour market support schemes: young people (up to the age of 24) accounted for 107,868 persons (27.1%), the intermediate age group (25-49 years) contained the largest proportion of persons with 233,636 (58.8%), and older people (50 and over) accounted for 68,980 persons (17.4%). In comparison, the proportions of the annual average number of registered jobseekers accounted for by the various age groups are as follows: young people 15%, intermediate age group 62% and older people 23%.
A total of 53,164 (+4,790; +9.9%) persons with health-related employment limitations (of whom 11,475 were registered disabled persons) and 42,605 persons with other health problems making it difficult for them to find jobs) were subsidised in 2012.
USE OF FUNDS
In 2012, around 50.9% of the persons participating in AMS programmes were female and al-most 47.1% of the gender-assignable subsidy budget was deployed to support women in the labour market. However, the proportion of participants in all measures who were women varied according to programme categories: skills training 50.5%, support 53.9%, employment 48.6%.

4 PErFOrMANCE OF THE PUBLIC EMPLOyMENT SErvICE (AMS) AND ACTIvE LABOUr MArkET POLICy
27
If we view AMS expenditure on subsidies4 in individual programme categories (see chapter 3.2 ‘Spending broken down according to socioeconomic groups’), the picture is slightly different to that in the individualised perspective used above: skills training programmes still account for the major part, also in terms of costs, at 66%, but this percentage is significantly lower than that of the number of participants (82.5%). Employment subsidies, which only involve 18.7% of all subsidised persons, accounted for 24.9% of funding, whereas support measures required only 9.1% of funding while involving 24.8% of persons.
Use of the budget for active subsidies (payments) in 2012 according to areas in €
Employment 242,220,111.54
Skills training 640,503,133.85
Support 88,256,061.29
Total 970,979,306.67
Source: fdg_personen_kosten_1012
In the area of skills training, the most significant tools in budget terms were subsidising the training and upskilling of jobseekers, covering their living costs during training, and benefits to cover course costs.
In the category of employment subsidies, spending is essentially divided up into two major groups of tools, integration subsidies on the one hand and socioeconomic enterprises and non-profit employment projects on the other.
In terms of support measures, the focus is primarily on spending on labour market-related advisory and support centres, child-care subsidies, the business start-up programme and the related subsidies for start-ups.
4.3 Labour market policy for young peo
4.3.1 International perspectives
According to Eurostat, an average of around 5.55 million young people under 25 were unemployed in the European Union in 2012, which is equivalent to an unemployment rate of 22.8%. Even before the economic and financial crisis in 2007, youth unemployment was twice as high as the total unemployment rate. Measures to contain youth unemployment at international level have not yet become fully effective.
How different youth unemployment levels can be even within Europe can be seen in an inter-national comparison for the year 2012: Greece and Spain have the worst levels, where with
4 All data: spending on subsidies without activating UI funding (this is unemployment insurance funding which is deployed for activating labour market policy); including funding which cannot be assigned on a gender-specific basis; source: AMS Data Warehouse; data cube fdg_Personen_kosten_1012mdc, payment (kum.) indicator.

4 PErFOrMANCE OF THE PUBLIC EMPLOyMENT SErvICE (AMS) AND ACTIvE LABOUr MArkET POLICy
28
55.4% and 53.2% respectively more than every other young person was unemployed in 2012. By contrast, Germany (8.1%), Austria (8.7%), and the Netherlands (9.5%) have the lowest and best rates. The success of these countries is also shown by the fact that the countries occupying the fourth place and lower already have unemployment rates of over 14%, while the average for the EU 15 is 22.3%. In 12 out of the 27 EU Member States, almost one in four young people were thus without work at the end of 2012.
Far-reaching successes in the fight against youth unemployment appear to lie in programmes and projects which improve infrastructure. Starting in 2012, the European Union strongly sup-ported a job guarantee for young people, a plan which was then realised as the European youth Guarantee in an EU resolution in 2013.
The lack of integration of young people into the labour market has a wide range of effects: at an individual level they have to deal with poorer career opportunities and therefore a loss of income in the medium and long term, which in turn has an influence on their satisfaction and quality of life. From a social perspective they experience stigmatisation and marginalisation. From an economic perspective, the young persons affected are more frequently unemployed and for longer periods, they fall back on benefits from unemployment- and social insurance more often and have a greater need for state-financed initial and further training programmes, which in turn leads to lower value added and has an effect on GDP.
4.3.2 Labour market policy for young people in Austria
Austria owes its low youth unemployment rate to the relatively low level of overall unemployment (4.3% on average in 2012 according to Eurostat), demographic changes and the dual system of vocational training. The political focus on a comprehensive and far-reaching labour market policy for young people is a further factor in this success. reintegrating young people into working life and intensified preventive approaches are key factors here.
In the field of Austrian labour market policy, a differentiation is made between two target groups due to their differing needs: young people up to the age of 19 and young adults between 20 and 24. This differentiation is reflected in the design of needs-orientated offers: for young people up to the age of 19 for whom the transition to continuing training or into the labour market is relevant, the focus is on the interface between school and continuing systems such as higher-level schools, the dual system of vocational training or entry into working life. For young people aged 20-24 who are registered unemployed, the focus is on suitable programmes for obtaining skills and qualifications which they did not obtain previously and employment subsidies in or-der to reintegrate them into the labour market. Due to the training guarantee which has existed since 2008 and the Campaign for the Future of youth launched in 2009, programme priorities were created containing offers which fulfil the specific requirements of young people up to the age of 19, and also for 20-24 year olds. The development of a closely-knit network is designed to ensure that suitable offers will increasingly be available for everyone. This special focus on

4 PErFOrMANCE OF THE PUBLIC EMPLOyMENT SErvICE (AMS) AND ACTIvE LABOUr MArkET POLICy
29
labour market policy for young people within the context of overall unemployment is also re-flected in the amount of funding deployed: The expenditure on labour market policy for young people was EUr 613 million in 2012.
4.3.2.1 Labour market policy for young people aged between 15 and 19
The goal is to coordinate education and training systems in a coherent way across all institutions and to link the subsidies offered so that an increasingly smaller number of young people drop out of the system and so that young people are supported in a more targeted way. In particular, important steps towards intensified interdisciplinary cooperation are taken by means of better coordination and cooperation between labour market policy and education policy. By main-streaming the Austrian education and training strategy in this way, a broadly-based range of programmes is created which increasingly does justice to the diverse needs of young people.
There are programmes at numerous levels to integrate young people into the labour market, to keep them in the education system or to reintegrate them into it: dropout avoidance and advice at the interface between schools and working life are accorded special emphasis.
CAREERS GUIDANCE
Information about relevant education pathways and career opportunities are of immense im-portance for the individual planning of a young person’s career. Suitable, early and high quality educational and careers guidance facilitate the selection of suitable career paths by young people. Careers orientation is seen as a long, continuous and complex process which takes place at several educational locations and is accompanied in a targeted way. young people are also introduced to less well-known occupations – outside the traditional ones – in order to show them a range of jobs and apprenticeships which is as broad as possible. For example, girls can be shown that they can often not only have clearly better opportunities in the labour market when they choose a non-traditional occupation, but can also have better earnings from the beginning. The objective of successful careers orientation is also to motivate and enable young people to realise their personal goals. Since 2009, a visit to a Careers Information Centre (CIS), e.g. at the Public Employment Service (AMS), has been part of the compulsory subject of careers orientation for pupils in years 7 and 8 of school. The 66 Careers Information Centres (CIS) of the AMS were used by around 470,200 persons in 2012, of whom around 103,000 were young people under 21.
YOUTH COACHING
This programme was developed jointly with the Federal Ministry of Education, the Arts and Cul-ture (BMUkk) and the Federal Ministry of Employment, Social Affairs and Consumer Protection (BMASk), and is implemented by the Federal Social Welfare Office (BSB).

4 PErFOrMANCE OF THE PUBLIC EMPLOyMENT SErvICE (AMS) AND ACTIvE LABOUr MArkET POLICy
30
In phases when difficult decisions have to be made, young people often need professional advice and help, particularly with regard to future planning and the choice of a suitable occupation. Thus the idea was born of approaching young people in schools at the end of compulsory schooling and offering them a person at their side (a youth coach) who advises and supports them in an uncomplicated way and free of charge on problems related to school, careers and personal matters. This is a voluntary scheme, so that it is also possible to talk in a confidential way about issues where young people would often not know whom to turn to. The subjects which can be discussed with a youth coach are diverse and range from school matters and careers to family problems, addiction and debts. If issues arise which go beyond the coaches’ competence, other professionals can be called upon.
Questions about young people’s future work are often particularly difficult for them to answer: What am I going to do after school? How can I find the right job? What should I do when my pa-rents argue? What can I do about my debts? All of these are questions which young people may find it hard to answer on their own. Whether it is information about the world of work, or having someone to accompany them to an advice centre, or to provide help with personal problems, the youth coach is a contact person who is interested in young people’s needs, who listens to them and plans the next steps with them. This offer is available to all young people up to the age of 19 (and up to the age of 25 in exceptional cases for young people with special educational needs or an illness/disability) who need support.
youth coaching was initiated in 2012 as a pilot scheme which was tested in two provinces (vienna and Styria) with around 12,500 participants, and was a resounding success. The success rate of youth coaching was around 85%. This means that only around 15% of participants left the scheme prematurely or without a specific goal. youth coaching was subsequently implemented nationwide in 2013 (estimated provisional number of participants in 2013: just under 35,000). In addition, over two thirds of participants exhibited a significant improvement in individual areas, such as a better self-image or more specific careers ideas. young people with migrant backgrounds benefited at an over-average rate.
APPRENTICE TRAINING IN COMPANIES
The dual system of training, with parallel training and education in a company and a vocatio-nal school, is a success story in the Austrian training landscape. Due to the close connection between education in a school and practical training, it is a highly popular form of training for around 40% of 15 year olds. Many young people consider an apprenticeship in a specialist firm to be a good point of departure for good career and personal development opportunities. As at 31.12.2012, over 125,000 young people in over 33,700 companies were taking part in company apprenticeships (apprentices in the supra-company scheme are not included here). However, the number of those looking for apprenticeships is higher than that of the places available. The requirements which firms make in relation to would-be apprentices are often greater than those

4 PErFOrMANCE OF THE PUBLIC EMPLOyMENT SErvICE (AMS) AND ACTIvE LABOUr MArkET POLICy
31
who are looking for apprenticeships can fulfil, or the places available are not in their preferred jobs or in the regions where they are looking.
A basic subsidy which was introduced in 2008 for companies, quality subsidies and new approa-ches towards targeted dropout prevention and ensuring the success of training (e.g. apprentice coaching, see below) are the instruments used to promote training within companies and the attractiveness of apprenticeships. In addition ‘integrated apprentices’ are also accompanied by a vocational training assistant.
APPRENTICE COACHING
The high proportion of apprentices who drop out early or fail their final examinations as well as the falling number of apprentices and companies in certain sectors of industry led to the amendment of the vocational Training Act in autumn 2011. This amendment led to new support services for companies providing apprenticeship training and for the apprentices themselves: training guidelines for key apprenticeships were drawn up, the LAP Clearing Centre was set up to ensure the quality of examinations, and support offers for internships abroad were establis-hed, etc. The core element of this reform is an advice and support programme for companies and apprentices: apprentice coaching. The aim is to avoid students dropping out and to ensure a successful apprenticeship.
The development of this advice and support programme was initially launched as a pilot project for companies and apprentices in Upper Austria, Styria, Tyrol and vienna in 2012.
TRAINING GUARANTEE AND SUPRA-COMPANY APPRENTICE TRAINING
The youth training guarantee promises every young person a place as an apprentice or trainee. In order to guarantee this, supra-company apprenticeships have been offered since 1998 as a subsidiary system of replacement training places to supplement the falling number of places on offer in the company apprenticeship market. This enables young people who are interested in an apprenticeship and who have not found a suitable place in the normal market to fall back on supra-company training. The goal of this programme is to enable young people to begin an apprenticeship promptly. Supra-company apprenticeships are either taken in a training workshop or in cooperation with a company. An apprenticeship completed within this scheme is equivalent to a normal company apprenticeship and is concluded with the same nationally recognised examination.
On average in 2012, around 10,000 young people benefited from the supra-company appren-ticeship scheme as part of the training guarantee. The expenditure for the Public Employment Service amounted to around EUr 125 million. In order to continue the successful tradition of this form of training in the training year 2012-2013, 11,700 places will be made available in this period.

4 PErFOrMANCE OF THE PUBLIC EMPLOyMENT SErvICE (AMS) AND ACTIvE LABOUr MArkET POLICy
32
PRODUCTION SCHOOLS
For some disadvantaged young people, offers such as supra-company apprenticeships are often too ambitious; they need different types of support offers in order to be gradually led back into learning and working, and to become enthusiastic about it. For this reason, production schools have been established in Austria in some provinces. Here, young people can gain experience of the processes and requirements of the world of work, and can find out how working life functions. The 20 production schools in Austria thus offer not only a broad level of access to basic and specialist training and qualifications; they also provide orientation for young people in the world of work.
The goal of the production schools is to offer stabilisation, increase motivation, provide speci-alist knowledge and a basic qualification – all of which will ideally be put into practice via (re-)integration into the labour market. Even though the production school concept is implemented differently in different regions, all production schools have workshops which facilitate pro-ductive activities and have programmes for careers orientation, socio-educational guidance, internships and eliminating deficits in basic school subjects. The workshops frequently use wood, metal and textiles, but services such as repair or cleaning work are also offered. In the oldest production school in Austria, the vSG Factory in Linz, the students can choose from five different workshops: wood, metal, creative, graphic design and IT. In the wood workshop, stu-dents are taught basic knowledge about working with solid wood and wooden board materials. In this way, the young people learn how to measure, saw, drill, chisel, sand, wax and oil wood. They can then use these skills to manufacture custom-made solid wood furniture, tables and benches etc. In another workshop, such as the graphic design workshop, young people can acquire knowledge about graphic design on a PC. Customer can order business cards, writing paper, folder, flyers etc. there.
The production schools are mainly orientated towards young people between the ages of 15 and 19, but are also open to young people up to the age of 25 who have difficulty in finding a job. Thanks to the opportunities in the workshops, young people can generally combine between twelve and 24 months of working and learning.
In 2012, over 2,600 young people took advantage of this offer in order to prepare themselves for entry into working life by means of realistic careers orientation.
4.3.2.2 Labour market policy for young adults aged between the ages of 20 and 24
young adults aged between the age of 20 and 24 form the second target group in labour market policy for young people. The main obstacle to them finding work is a lack of qualifications and skills. The high risk of unemployment among less well-qualified persons in all age groups is also reflected in the statistics. Among persons whose highest qualification is having completed

4 PErFOrMANCE OF THE PUBLIC EMPLOyMENT SErvICE (AMS) AND ACTIvE LABOUr MArkET POLICy
33
compulsory schooling, the risk of becoming unemployed is 19.4%, whereas it is only 2.4% for university graduates. Support during vocational training and, for somewhat older young persons, completing vocational training and passing apprenticeship examinations which they missed out on in younger years, have therefore been defined as special focuses.
CAMPAIGN FOR THE FUTURE OF YOUNG PEOPLE
The Campaign for the Future of young People has offered a training guarantee for 20-24 year olds since 2009 with the goal of opening up careers perspectives for young people. The Fede-ral Government promises to provide all young unemployed persons between 20 and 24 with a job offer, a targeted training course or a subsidised job within a period of six months. In 2012, this labour market policy priority provided employment for around 96,000 young people, while around 46,000 young persons took part in a targeted training course during this period.
4.3.3 Outlook for the priorities of 2013: medium to long-term reform options
Economic factors, the lack of skilled workers and the increasingly dysfunctional problem of edu-cational disadvantage are the challenges which have to be met in order to continue to ensure a favourable situation in the labour market for young people. These factors lead to the issues which form the priorities for 2013:
NOT IN EDUCATION, EMPLOYMENT OR TRAINING (NEET)
Due to the increased perception of young people who are disadvantaged in the labour market and at risk of exclusion, one target group in particular has become the focus of labour market policy considerations: The acronym NEET (Not in Education, Employment or Training) refers to the group of young people who are not attending a school, are not in work and are not engaged in any further vocational training. According to a study commissioned by the BMASk, there are 78,000 NEET young people in Austria. This group is not homogeneous, but is made up of different sub-groups, for whom various programmes are being created in order to reach them. These sub-groups include young unemployed persons who are mainly dropouts from school who are actively looking for work, young people with illnesses and young mothers who have to look after their children. The idea is to reach these young people on the margins of the system by offering low-threshold contact opportunities: coordinating links with suitable programmes outside schools can form the basis for a sufficiently diverse range of offers.
FIT FOR TRAINING
The need for maturation which has become particularly evident in youth coaching shows that some young people do not receive the support they would need in order to find their way in the labour market. They lack the basics which are a prerequisite for successful integration into

4 PErFOrMANCE OF THE PUBLIC EMPLOyMENT SErvICE (AMS) AND ACTIvE LABOUr MArkET POLICy
34
the labour market. This need for supplementary skills has led to the idea of creating a suitable range of offers to facilitate this maturation process: Fit for training. This offer is conceived as a maturation project which is designed to give young people the opportunity to acquire the basic qualifications they missed out on plus social skills.
These are projects for young people which have a standardised concept with uniform objectives which are implemented regionally in different ways. Part of this concept is for young people to acquire school competences and basic qualifications which were insufficiently communicated in schools and which are presented here with alternative teaching methods so that young people who are tired of school can be motivated to learn. In this way, young people can learn or refine their knowledge of various sets of skills, such as in the new media for example.
Determining a person’s readiness for training means designing the process in such a way that it is possible to establish which training best corresponds to their individual potential. If a young person is communicative and enjoys dealing with other people, s/he should have the oppor-tunity within Fit for Training to identify those types of occupations which are suited to her/his communicative tendency.
A pilot project will begin in 2013. The concept is currently being developed with experts from various fields. According to the current planning status, the project will be gradually introduced in all of the provinces.
4.4 New developments in the employment of foreign citizens
According to the Federation of Austrian Social Insurance Institutions, 527,067 persons of foreign citizenship were employed on average in 2012, of whom almost half (255,062) were from EU Member States.
Compared to the previous year, the overall proportion of foreign employees rose by 7.8% on average, while the proportion of workers from EU Member States rose by 16% (plus 35,009 persons). At the same time, the number of unemployed foreign citizens was also higher than in the previous year (+7,625 Austrians, +6,316 foreign citizens). The unemployment rate among foreign citizens was 9.7% on average over 2012, while the total unemployment rate was 7.0%.
CRITERIA-LED IMMIGRATION SYSTEM
The criteria-led immigration system introduced in July 2011 will – while taking the development of the labour market and the economy into account – enable those key and specialist employees who would otherwise not be available in sufficient numbers (but are urgently needed) to live and work in Austria in the long term.

4 PErFOrMANCE OF THE PUBLIC EMPLOyMENT SErvICE (AMS) AND ACTIvE LABOUr MArkET POLICy
35
Since June 2012, the immigration model has also been opened up to occupations where there is a lack of skilled workers. These occupations with a lack of suitable workers are laid down annually in a decree by the Minister of Employment in agreement with the Minister of the Eco-nomy. The Skilled Workers Decree for 2013 covers 24 occupations with shortages, including electricians, metalworkers, joiners, engineering technicians, woodworking machine operators and qualified nurses.
By the end of December 2012, the AMS had drawn up 2,670 positive reports, upon the basis of which the authorities issued a red-White-red card or an EU Blue card. The majority of those granted cards fall into the category of ‘other key workers’, followed by graduates and particu-larly highly qualified persons. The largest number of applicants came from Bosnia-Herzegovina, the russian Federation, the USA, Croatia, Serbia, the Ukraine and Canada. The key employees who have been issued with cards work in various sectors, especially manufacturing, scientific and technical services, commerce, the maintenance and repair of vehicles, services for sports, entertainment and leisure as well as the information and communications sector. The range of occupations covered includes managers, IT specialists, professional sportspeople and trainers, office workers, technicians and health professions.
WORKING HOLIDAY PROGRAMME WITH SOUTH KOREA
Since July 2012, young Austrians aged 18-30 have had the possibility to take up employment in South korea (alongside the existing destination of New Zealand) during a holiday stay lasting up to six months. This can help to finance their stay and enable them to get to know the working environment in these countries.
The Working Holiday Programme with South korea is based on reciprocity, so young South ko-reans have the same opportunity of a six-month holiday stay for employment and education in Austria. Each side can issue up to 300 working holiday visas per year.
RECOGNITION OF QUALIFICATIONS OBTAINED ABROAD
In order to better use the existing qualifications and skills of migrants, an interministerial working group has drawn up a concept for “contact points and further measures for the recognition of evaluation of qualifications obtained abroad”.
To implement the measures, the BMASk set up four contact points in January 2013 in Innsbruck, Linz, Graz and vienna as well as a central back office for coordination. To ensure that the entire country is covered, provinces without their own contact points will be looked after by one of the four offices mentioned above. The work will be carried out by the following institutions: the Advice Centre for Migrants (vienna, also the back office), Migrare (Linz), Zebra (Graz) and ZeMiT (Innsbruck).

4 PErFOrMANCE OF THE PUBLIC EMPLOyMENT SErvICE (AMS) AND ACTIvE LABOUr MArkET POLICy
36
The contact points are open to all persons (regardless of whether they are registered with the AMS) who have obtained formal qualifications abroad and have questions about their recognition. They offer information in several languages as well as advice and support in the recognition and evaluation procedures. In order to ensure the best possible integration of jobseekers in the labour market in accordance with their qualifications, the contact points work in close cooperation with the AMS.

5 EFFECTS OF LABOUr MArkET POLICy AND THE COSTS OF UNEMPLOyMENT
37
5 EFFECTS OF LABOUR MARKET POLICY AND THE COSTS OF UNEMPLOYMENT
5.1 Employment effects of labour market policy and easing of the burden on the overall economy
The positive effects of placement services – such as filling vacancies quickly, reducing the length of time spent searching for work and minimising the overall costs of unemployment for the economy – are uncontested. But active labour market support and social insurance-based benefits as important elements of labour market policy also make a contribution to positive employment figures. Alongside the direct effects of reducing the strain on the labour market and improving the skills and qualifications of jobseekers, they also increase the demand for educational services and have indirect effects on demand which are created by consumption-boosting expenditure on programmes, subsidies and social insurance-based benefits.
The integration of jobseekers into active labour market programmes and measures directly relieved the pressure on the labour market by around 85,000 persons in 2012.
With the aid of the employment multipliers created by Joanneum research5 for active labour market policy interventions and private consumption, it was established that an indirect employ-ment effect of a further approx. 85,000 persons for 2012 was generated by active and passive labour market expenditure.
If this gross effect is set off against the effect of withdrawals which can be assigned using the relevant Joanneum multipliers for the withheld contributions by employers and employees to unemployment insurance - since due to such withheld contributions companies invest less (thus reducing employment) and employees consume less – this results in a positive net employment effect induced by expenditure on labour market policy measures (plus 6,000 employees per year on average over the year).
The reduced burden on the labour market and the net employment effect of Austrian labour market policy lead to a positive balance of around 91,000 persons on average per year, reducing the unemployment rate by 2.2 percentage points.
5 See: kurzmann r./Gstinig k. (2011), Beschäftigungsmultiplikatoren und die Besetzung von Arbeitsplätzen in Österreich, Policies research report No.127-2011, Nov 2011.

5 EFFECTS OF LABOUr MArkET POLICy AND THE COSTS OF UNEMPLOyMENT
38
Employment effects of labour market policy and easing of the burden on the overall economy
2010 2011 2012
Employment balance in personsDirect burden-reducing effect (BrE) of active LMP/programmes 94,876 79,151 85,086
Gross employment effect (EE) induced by consumption and demand
for education
90,549 84,783 85,568
of which: active LMP 26,893 24,737 24,114
passive LMP 63,657 60,046 61,454
Withdrawal effect (WE) of contribution collection 74,857 77,430 79,570
of which: Employers 35,796 36,858 37,877
Employees 39,061 40,572 41,693
Net employment effect (BrE minus WE) 15,692 7,353 5,998
Employment balance (BRE and net EE absolute) 110,568 86,504 91,084
Employment balance in percentage points of the unemployment rateEmployees 3,360,238 3,421,748 3,465,454
Annual average of actual no. of registered unemployed 250,782 246,702 260,643
‘Fictitious’ unemployed 361,350 333,206 351,727
Fictitious rate of registered unemployed 9.7% 8.9% 9.2%
Difference between actual and fictitious unemployment rate 2.8% 2.2% 2.2%
5.2 Fiscal costs of unemployment
The primary costs incurred are those for providing a subsistence income to unemployed persons and for training them – in other words the expenditure on unemployment benefits and active labour market policy measures. However, unemployment also leads to considerable losses in terms of tax revenue and social insurance contributions. From a broader perspective, the psy-chological and social follow-up costs such as a loss of competences, social exclusion and health problems also have to taken into account.
However, this calculation is limited to the following direct cost factors:
» Benefits and subsistence incomes (including those for unemployed persons taking courses) » Social insurance (for unemployed persons) » Expenditure on active labour market policy measures (particularly skills training) » Personnel and infrastructure of the AMS » Lost tax revenue and social insurance contributions (if these persons were employed)
The differentiation between direct and indirect costs is made according to the usual assumption that the former are linked to specific spending and the latter are linked to non-realised revenues.

5 EFFECTS OF LABOUr MArkET POLICy AND THE COSTS OF UNEMPLOyMENT
39
The fiscal costs of unemployment in Austria calculated in this way amounted to a total of € 7.8bn in 2012. The direct costs of unemployment account for the larger part of the costs at around € 5.3bn; the indirect costs – lost tax revenue and social insurance contributions – total € 2.5bn.
Per person year of unemployment6, fiscal costs of € 27,535 (€ 18,654 as direct and € 8,881 as indirect costs) arose in 2012.
Fiscal costs of unemployment
2010 2011 2012
Fiscal costs of unemployment (in € millions) 7,720 7,468 7,468
Expenditure on unemployment (direct costs) 5,233 5,104 5,275
of which on:
- Expenditure on subsistence income (incl. social insurance) 4,038 3,906 4,105
- Expenditure on active labour market policy measures 773 754 729
- Expenditure on AMS organisation 422 445 441
Lost taxes and duties (indirect costs) 2,480 2,364 2,511
of which on:
- Social insurance without UI (PI, AI, HI, CC, IN, SH) 916 869 921
- Unemployment insurance 377 359 380
- Employer’s cont. to Family Burdens Equalisation Fund 283 269 285
- Local authority tax/surcharge to employer’s contribution 214 204 216
- Wage tax 394 374 407
- vAT 296 289 302
Fiscal costs per person year (in €) 27,314 27,743 27,535
of which:
- Direct costs 18,516 18,962 18,654
- Indirect costs 8,775 8,784 8,881
6 Corresponds to a (fictitious) unemployed person on annual average; a person year of unemployment is equivalent to around three persons affected by unemployment per year – in 2012 the annual average number of registered unemplo-yed persons was around 261,000, whereby 849,000 persons were unemployed at least once a year.

5 EFFECTS OF LABOUr MArkET POLICy AND THE COSTS OF UNEMPLOyMENT
40

6 A SUBSISTENCE INCOME FOr THE UNEMPLOyED - UNEMPLOyMENT IN-SUrANCE
41
6 A SUBSISTENCE INCOME FOR THE UNEMPLOYED - UNEMPLOYMENT IN-SURANCE
The Unemployment Insurance Act regulates that unemployment insurance is compulsory and defines the conditions for the receipt of unemployment benefit and unemployment assistance, such as entitlement, the conditions for claiming benefit and the duration of its receipt.
All employees who are subject to compulsory health insurance or who are entitled to the ser-vices of a health insurance fund (section 1 para.1 of the Unemployment Insurance Act, AIvG) are covered by unemployment insurance. From 1 January 2008, holders of non-standard employment contracts according to Section 4 para 4 of the General Social Insurance Act (ASvG) have also been included in unemployment insurance. From 1.1.2009, the self-employed can also opt to pay in to unemployment insurance under certain conditions.
Employees whose income is below the marginal earnings threshold (2013: € 386.80; 2012: € 376.26; 2011: € 374.02; 2010: € 366.33 per month) are exempted from unemployment insurance.
6.1 Benefits
The following benefits are granted under unemployment insurance:
» Unemployment benefit » Unemployment assistance » Advances on benefits from pension insurance » Further training allowance » PT allowance for older workers » Transition benefits following on from part-time benefit for older workers » Transition benefit
recipients of benefits are covered by health and (with the exception of advances on pension payments) pension insurance. The health and pension insurance cover of persons receiving part-time benefit for older workers is based on their employment relationship.

42
6 A SUBSISTENCE INCOME FOr THE UNEMPLOyED - UNEMPLOyMENT IN-SUrANCE
6.2 Conditions of entitlement to unemployment benefit
The conditions of entitlement to unemployment benefit are: » Unemployment7
» Availability for job placement8
» Ability to work9
» Willingness to work » Fulfilment of the conditions to entitlement » Maximum claim period not yet reached.
AVAILABILITY FOR JOB PLACEMENT
Persons who are available for job placement are prepared to take on and carry out employment of a type which is commonly offered in the labour market and is reasonable, and are legally resident and present in Austria.
Unemployed persons have to be prepared to take on a job for at least 20 hours per week. There are exceptions for persons with child-care responsibilities for children up to the age of ten or disabled children for whom there are provenly no sufficiently long care options. Such persons also fulfil the conditions if they are available for a job with weekly working hours of at least 16 hours.
WILLINGNESS TO WORK
Willingness to work refers to the readiness of the unemployed person to take on an accepta-ble job offered by a regional AMS office or by a service provider commissioned by the AMS. It also means that the unemployed person shall take all necessary measures – insofar as this can be reasonably expected with regard to their personal abilities – which might lead to them being hired. This includes (re-)training as well as participation in programmes to reintegrate them into the labour market.
A job is considered reasonable if it is suited to the physical abilities of the unemployed person and if the work represents neither a danger to their health nor to moral standards. The payment
7 Individuals are defined as unemployed if after the termination of their previous employment relationship or self-employment they are no longer subject to compulsory pension insurance and have not taken up new employment. Persons who left their previous job (including self-employment) voluntarily or due to their own fault will only start to be paid unemployment benefit four weeks after their previous employment ended.
8 All those who are able to and permitted to taken on a job. While child care benefit is being claimed, these conditions are only fulfilled if the child can be looked after by another suitable person or in a suitable child care centre.
9 Persons who are not invalids or not incapacitated as defined by pension insurance legislation are considered able to work. Exempted from this are invalids and persons who are not able to work who have been granted occupational re-habilitation measures, have completed the goal of these measures and who have acquired the necessary entitlement in the course of this measure or subsequently.

43
6 A SUBSISTENCE INCOME FOr THE UNEMPLOyED - UNEMPLOyMENT IN-SUrANCE
and the travelling distance to the place of work10 have to be appropriate. In addition, statutory care obligations have to be able to be met.
If a job offer or participation in a programme is refused or frustrated, the receipt of benefit is suspended for the duration of the refusal, but for at least six weeks after infringement of this obligation. In the case of further infringements of obligations, the minimum period for which benefits can be lost is extended by a further two weeks to eight weeks.
ENTITLEMENT
When claiming unemployment benefit for the first time, jobseekers need to have been in UI contributory employment for a total of 52 weeks in Austria during the last two years before ap-plication (framework period). In the case of any further claims, the claimant must have been in UI contributory employment for a total of 28 weeks within the period of a year. This entitlement is, however, also fulfilled if the conditions for a first-time claim are given.
For persons under 25, a period of one year applies during which they need to have been insured for 26 weeks.
SUSPENSION OF UNEMPLOYMENT BENEFIT
Payment of unemployment benefit is suspended in certain circumstances, which include the receipt of sickness benefit, further training allowance, maternity benefit and during stays abroad.
DURATION OF THE RECEIPT OF UNEMPLOYMENT BENEFIT
The length of time for which unemployment benefit can be claimed depends on the time the person has been insured and their age. Unemployment benefit is usually paid for 20 weeks; this rises to 30 weeks if the claimant has been in UI contributory employment for 156 weeks within five years before applying for benefit. The period of time for which unemployment benefit is paid rises to 39 weeks if 312 weeks of UI contributory employment have been carried out within ten years and the person has reached the age of 40 when applying for benefit, or to 52 weeks if 468 weeks of UI contributory employment have been completed within 15 years and the person has reached the age of 50 when applying.
After completion of vocational rehabilitation measures which began after 31 December 2010, the length of time for which benefit can be claimed rises to 78 weeks.
For persons participating in AMS retraining and upskilling programmes, or courses for reinte-gration into the labour market, the time for which benefit can be claimed is extended by the
10 A total daily journey time of 1.5 hours there and back is considered reasonable. For full-time employment this rises to two hours. Journey times well over these are only considered reasonable under special circumstances.
44
6 A SUBSISTENCE INCOME FOr THE UNEMPLOyED - UNEMPLOyMENT IN-SUrANCE
length of the programme or course. For persons in a labour foundation, the period during which benefit can be claimed is extended by a maximum of 156 weeks. If training lasts for a longer period, or if the person is aged 50 or over, the receipt of unemployment benefit can, however, be extended by 209 weeks.
6.3 Amount of unemployment benefit
Unemployment benefit is composed of the basic amount, family supplements and, if applica-ble, an additional supplement.
The basic amount of unemployment benefit is equivalent to 55% of previous net earnings. The basis for its calculation is the annual contribution base which is recorded by the Federa-tion of Social Insurance Institutions: if unemployment benefit is applied for before 30 June, the person’s earnings from the penultimate calendar year as established from the records of pay liable to UI contributions held by the Federation of Social Insurance Institutions are used to calculate benefit. If the application is made after 30 June, the pay received in the last cal-endar year is used. If no annual contribution bases are available, the person’s earnings of the last six months before application are used to calculate the basic amount.
From 1.1.2010, the assessment basis for the calculation of the basic amount of unemploy-ment benefit – if it is applied for in the first six months of a calendar year – is increased by the revalu-ation factor for social insurance of the respective year (according to Section 108 para. 4 ASvG).
Family supplements are granted at a rate of € 0.97 per day and eligible person. Eligible persons are spouses, co-habiting partners, children and grandchildren, step children, adopted children and foster children. Family supplements are granted for children, grandchildren, step children, adopted and foster children if the unemployed person makes an important contribution towards their maintenance and these persons are entitled to family allowance. Family supplements for spouses (co-habiting partners) are granted if the unemployed person makes an important contribution to their maintenance, if they do not earn an income above the marginal earnings threshold (2013: € 386.80), and if they are entitled to family supplements for – at least – one child, grandchild, step child, adopted or foster child (provided that the latter are minors).
Unemployment benefit including the additional supplement amounted to at least € 27.92 per day in 2013 (2012: € 27.16; 2011: € 26.45; 2010: €26.13; 2009: € 25.75), whereby the amount for unemployed persons entitled to family supplements may not exceed 80% of their previous net daily income on which the calculation is based, and 60% in the case of those not entitled to family supplements.
The highest possible daily rate in Austria (basic amount of unemployment benefit without family supplements) in 2013 was € 47.19 (2012: € 46.36; 2011: € 45.53; 2010: € 44.70; 2009: € 43.87) per day. The maximum level of this benefit is determined by the maximum assessment basis

45
6 A SUBSISTENCE INCOME FOr THE UNEMPLOyED - UNEMPLOyMENT IN-SUrANCE
(2013: € 4,110; 2012: € 4,020; 2011: € 3,930; 2010: € 3,840), which is somewhat lower than the ceiling on insurable earnings (a cap on income liable to social insurance contributions).
Due to the supplementary amount and family supplements, the actual net income replacement rate is over 55 percent. In 2012 the actual rate was around 60 percent of net income.
UNEMPLOYMENT INSURANCE FOR THE SELF-EMPLOYED
Since 1.1.2009, self-employed persons who are insured under the Act on Social Insurance for the Self-Employed (GSvG) can opt for unemployment insurance. Persons who fulfil all of the criteria are informed of this by the Social Insurance Institution for Businesses and - if they wish to be covered by unemployment insurance - have to submit their application within the stated period. This period is six months from being informed by their social insurance institution, and application has to be made in writing. If the applicant opts for unemployment insurance within the first three months, their cover begins from the start of their self-employed work (or from 1 January 2009 at the earliest); if the application is made between the fourth and sixth months, unemployment insurance begins at the start of the following month. The insured person chooses a contribution base according to section 2 of the Labour Market Policy Finance Act (AMPFG) for a compulsory period of at least eight years (or a multiple of eight years). It is possible to withdraw from unemployment insurance within six months of the end of the minimum period.
6.4 Unemployment assistance
Unemployment assistance is granted to an unemployed person if their entitlement to unem-ployment benefit has come to an end, or in the case of transition benefit (from unemployment insurance) if normal retirement age has been reached, and if the person is in financial distress and is available for job placement. Financial distress is defined as a situation in which it is not possible for the unemployed person to fulfil their basic needs. When evaluating financial dist-ress, the overall financial position of the unemployed person and of the spouse (or co-habiting partner) living in the same household is taken into account.
Persons who are not eligible for unemployment assistance solely because of their partner’s income continue to receive pension and health insurance cover as long as the other conditions for the receipt of unemployment assistance are met. This particularly includes registration and availability for jobs.
The amount of unemployment assistance paid depends on the level of unemployment bene-fit. Unemployment assistance amounts to 95% of the relevant basic amount of unemployment be-nefit if the daily basic amount does not exceed 1/30 of the equalisation supplement reference rate (in 2013: € 837.63; 2012: € 814.82; 2011; € 739.40; 2010: € 783.99), which is € 27.92 for the year 2013 or 92% in all other cases (whereby it may not fall below 95% of the calculated basic amount of

46
6 A SUBSISTENCE INCOME FOr THE UNEMPLOyED - UNEMPLOyMENT IN-SUrANCE
€ 27.92 for 2013). Added to this is 95% of the additional supplement to unemployment benefit plus any family supplements.
The net income of the partner (spouse or co-habiting partner) after deduction of an allowance (which varies according to the age and insurance record of the unemployed person and the number of children to be provided for) is taken into account in the calculation of unemployment assistance.
If unemployment benefit has previously been claimed for 20 weeks, unemployment assistance will be limited to the level of the equalisation supplement reference rate after it has been re-ceived for six months (equalisation supplement reference rate 2013: € 837.63; 2012: € 814.82; 2011: € 793.40; 2010: € 783.99). If unemployment benefit has previously been received for 30 weeks, unemployment assistance will be limited to the subsistence level under the Execution regulations (2013: € 977; 2012: € 950; 2011: € 925; 2010: € 914).
Unemployment assistance is principally awarded for a maximum of 52 weeks. However, it will continue to be granted as long as a person’s financial distress continues.
2011 2012
♀ ♂ Total ♀ ♂ Total
Average daily rate of passive benefits in €Unemployment benefit 24.7 29.9 27.7 25.1 30.3 28.1
Unemployment assistance 20.0 23.8 22.3 20.4 24.2 22.7
Unemployment benefit and unemployment assistance 22.7 27.1 25.3 23.0 27.5 25.7
Average duration of benefit receipt in daysUnemployment benefit 70.8 67.8 69.1 71.3 69.6 70.3
Unemployment assistance 121.1 130.3 126.6 121.4 131.4 127.2
Unemployment benefit and unemployment assistance 86.5 87.9 87.3 87.1 89.4 88.5
Sources: AMS benefit recipients statistics; AMS DWH svl_mon_bst_pers_light: Figure average benefit amount daily rate and AMS DWH svl_mon_bew_pers.mdc: Figure average outflows from claim duration in days
6.5 Transition benefit
Since 1.1.2004, transition benefit has been awarded to unemployed persons (upon application) who cannot yet retire due to the raising of retirement age as a result of the phasing out of early retirement for unemployed persons between 2004 and 2006. Persons who were unemployed for at least 52 weeks in the last 15 months and are entitled to unemployment benefit are eligible.
Insurance periods which have been used for entitlement to unemployment benefit can be used again for entitlement to transition benefit. Transition benefit can also be claimed if the unem-ployed person has been in UI contributory employment for 780 weeks during the last 25 years before the claim is made. Certain circumstances such as employment periods with compulsory
47
6 A SUBSISTENCE INCOME FOr THE UNEMPLOyED - UNEMPLOyMENT IN-SUrANCE
health insurance after the end of the obligation to pay UI contributions (e.g. in the case of men over the age of 60) are considered equivalent to UI contributory employment. The period of 25 weeks in which entitlement has to be acquired is extended by periods of child care obligations up to the 15th birthday of the child.
Transition benefit is composed of the basic amount of unemployment benefit plus a supplement of 25% as well as any family supplements the claimant is entitled to.
A regulation was issued (Federal Law Gazette II No. 408/2006) which also provides access to transition benefit to persons who will reach the earliest possible age for early retirement in the years 2007-2009. As part of the Labour Market Package II, the opportunity to take advantage of transition benefit was extended again, whereby the minimum age for entitlement is being increased in stages.
6.6 Advances on benefits from pension insurance
When an application is made for benefits from pension insurance on the grounds of reduced or lost capacity to work, for transition benefit (from statutory pension or accident insurance) or for another pension insurance-related benefit, an advance on pension insurance benefits can be granted to unemployed persons until a decision on the application has been made. From 1.1.2013, entitlement to an advance on pension insurance benefits only exists after a medical report has been issued stating that the person is not capable of work. Up to this time, the person is entitled to unemployment benefit or unemployment assistance, whereby they do not have to be available for job placement for the duration of the examination (this only applies to a period of 2 months at the most). Applicants do not need to be able, willing and ready to work in order to receive such advances. Advances can be granted equivalent to the level of unemployment benefit or unemployment assistance due to the applicant, but may not be higher than the ex-pected average pension amount.
If a pension application is rejected, the unemployed person has to again fulfil the conditions for receipt of UI benefits. The amount of subsequent unemployment benefit or unemployment assistance paid is equivalent to that before the advance was made, and the period of time for which the UI benefit is granted is shortened by the period of time for which the advance was paid.

48
6 A SUBSISTENCE INCOME FOr THE UNEMPLOyED - UNEMPLOyMENT IN-SUrANCE
6.7 Benefits for the promotion of employment
FURTHER TRAINING ALLOWANCE
Further training allowance (Weiterbildungsgeld) provides financial support for two types of leave granted under employment law. In order to take educational leave, a minimum period of employment of six months is required. In addition, participation in a continuing education or further training programme lasting roughly for the duration of the period of educational leave has to be proven. The further training course has to cover at least 20 hours a week, or 16 hours in the case of persons with care obligations for children up to the age of seven for whom no alternative care arrangements for longer periods can be made. Alternatively, they can provide evidence of education/training which takes up a comparable length of time. The period of leave which is agreed upon has to be between a minimum of two months and a maximum of a year.
If a person is granted unpaid leave, the employer has to hire a person who was previously unem-ployed as a replacement and pay them more than the marginal earnings threshold. The period of leave must be at least six months and not more than a year.
In both cases, entitlement to unemployment benefit is a further prerequisite.
Further training allowance is paid at the same level as unemployment benefit, or at least € 14.53 per day.
PT ALLOWANCE FOR OLDER WORKERS
Part-time allowance for older workers reimburses employers for part of the costs which ensue from the wage adjustment (not only those from current gross wages, but also those from special bonus payments).
PT allowance for older workers replaces a proportion (depending on the chosen model - a constant reduction of working hours or a ‘block-time agreement) of half of the difference in gross wages between the reduction in working hours and the gross wages due to the employee because of the wage adjustment – but only up to a maximum of the ceiling on insurable earnings – plus the additional employer’s and employee’s social insurance contributions which have to be paid based on the previous contribution base.
The proportion which is reimbursed is 90% of the additional costs in the case of constantly reduced working hours and 50% for ‘block time’ agreements.
Claims have to fulfil the following conditions:

49
6 A SUBSISTENCE INCOME FOr THE UNEMPLOyED - UNEMPLOyMENT IN-SUrANCE
Claims can only be made for a maximum of seven years until a person fulfils the conditions for receiving a pension at the latest. It can therefore be claimed by women who have reached the age of 53 and by men who have reached the age of 58. (from 2013 it can be claimed if the age 53 has been reached - in the case of women - and 58 in the case of men, but the period during which it can be received is now limited to five years at the most)
The person must have been in UI contributory employment for 780 weeks during the last 25 years before the claim is made. Periods spent raising children up to the child’s 15th birthday are included in the calculations.
Working hours have to be reduced to 40-60% of normal working hours as regulated by a coll-ective agreement.
There must be a corresponding agreement (collective agreement, company agreement or other contract) on the lowering of working hours.
Processed benefits (approvals and rejections
2011 2012
Women Men Total Women Men Total
Unemployment benefit 21,519 427,682 749,201 319,459 431,425 750,884
Unemployment assistance 112,353 147,098 259,451 114,860 148,744 263,604
Transition benefit 2,894 976 3,870 2,250 485 2,735
Further training allowance:
in the case of educational leave 7,390 6,238 13,628 8,370 6,732 15,102
for unpaid leave 98 74 172 79 40 119
PT allowance for older workers 3,425 2,516 5,941 4,140 2,827 6,967
Others* 20,241 27,977 48,218 19,656 26,592 46,248
Total 467,920 642,561 1,080,481 468,814 616,845 1,085,659
of which rejections 31,871 21,153 53,024 30,083 21,115 51,198
* e.g. Advance on pension payments, labour foundations (training courses). Source: AMS DWH
6.8 Sanctions
Unemployed persons are obliged to fulfil the conditions for claiming unemployment benefit or unemployment assistance for the duration of their claim. Sanctions may be imposed if they infringe their obligations.
If the person is deemed unwilling to work, they will lose their entitlement to unemployment benefit or unemployment assistance for the duration of their unwillingness to work, as the latter is a condition of entitlement.

50
6 A SUBSISTENCE INCOME FOr THE UNEMPLOyED - UNEMPLOyMENT IN-SUrANCE
If they refuse or frustrate opportunities to work in the form of reasonable jobs offered to them by the AMS, unemployment benefit or unemployment assistance will be suspended for six weeks, and in repeat cases of refusal for eight weeks. This also applies to the refusal of upskilling or retraining courses, refusal to participate in a programme for reintegration into the labour market, and to a general lack of initiative with regard to looking for a new job.
From 1.1.2008, job placements may also be offered by service providers working on behalf of the AMS, and the frustration or non-acceptance of employment offered in this way is also subject to the same sanctions.
If a person has become unemployed through their own fault, unemployment benefit or unem-ployment assistance can be suspended for four weeks, i.e. they may start to receive benefit after the four weeks have passed.
In addition, if claimants fail to sign on without good reason, they lose their entitlement to un-employment benefit or unemployment assistance until they present themselves at AMS offices in person.
The flexible job reasonability criteria laid down by the Unemployment Insurance Act (AlvG) entitle jobseekers to employment in their former line of work during the first 100 days, and sup-plement this by an individual pay level entitlement: During the first 120 days of unemployment, a job in another occupation or a part-time job only has to be accepted if it offers at least 80% of the person’s assessment basis for unemployment benefit. After this, pay level entitlement remains at 75% as long as unemployment benefit is claimed. This special protection prevents a person’s wages from falling considerably below their previous level, also when their working hours are reduced in part-time work. If a jobseeker was in part-time employment before beco-ming unemployed, their income in the job brokered by the AMS may not be below that of their former part-time work.
At the same time, the AMS was also obliged to draw up a support plan for every unemployed person. The support plan details the type of support required and the measures which need to be taken as well as the reasoning behind the approach selected. This support plan also forms the basis for the assessment of whether a course offered by the AMS is required and whether the rejection of this course offer is subject to the sanctions described above.

51
6 A SUBSISTENCE INCOME FOr THE UNEMPLOyED - UNEMPLOyMENT IN-SUrANCE
Sanctions over time
2011 2012
Women Men Total Women Men Total
Unwillingness to work 114 178 292 84 123 207
rejection of job offers 5,604 12,655 18,259 4,953 11,414 16,367
Giving up a job voluntarily without good
reason
12,544 16,478 29,022 11,751 15,697 27,448
Missing signing on appointments 16,081 40,090 56,171 15,542 39,335 54,877
Total 34,343 69,401 103,744 32,331 66,570 98,901
Source: AMS DWH: svl_pro_bescheid_pers

52
6 A SUBSISTENCE INCOME FOr THE UNEMPLOyED - UNEMPLOyMENT IN-SUrANCE

53
7 THE EFFECTIvE USE OF rESOUrCES By THE AMS
7 THE EFFECTIVE USE OF RESOURCES BY THE AMS
PERSONNEL COSTS AND OPERATING EXPENSES, INVESTMENTS
The costs incurred by the AMS for investments, personnel and operating expenses (without costs for civil servants) in 2012 amounted to around € 400m. Spending in the years 2008-2012 shows the following trends:
AMS total expenditure (2008 - 2012) in thousand euros
Actual number
2008
Actual number
2009
Actual number
2010
Actual number
2011
Actual number
2012
I INVESTMENTS 16,567 13,590 15,589 12,975 12,148
IA Furniture and fittings 11,101 10,577 12,832 9,404 9,970
IB Property 5,466 3,014 2,765 3,570 2,178
II OPERATING AND PERSONNEL COSTS 304,987 335,921 352,366 378,685 387,434
IIA Personnel costs incl. training 187,726 207,204 225,461 234,928 241,637
IIA1-5 Personnel costs excl. training 182,692 201,726 219,205 229,174 236,295
IIA6 Training 5,034 5,478 6,255 5,754 5,341
IIB Divisions 1,209 1,246 1,391 1,482 1,634
IIC Operating expenses 116,053 127,471 125,514 142,274 144,163
IIC1 Marketing 7,503 7,987 8,062 8,329 7,851
IIC2 Fundamental work 4,261 4,551 5,249 5,093 4,594
IIC Operating expenses ICT 42,860 50,465 46,139 62,221 63,042
IIC14 FEDErAL CALCULATION CENTrE, FEDE-
rAL SOCIAL WELFArE OFFICE, FEDErATION OF
SOCIAL INSUrANCE INSTITUTIONS
4,855 4,930 4,996 4,653 5,504
IIC4-13,15-16 Other operating expenses 56,575 59,539 61,068 61,979 73,658
ADMINISTRATION COSTS AMS total 321,554 349,511 367,964 391,659 399,581
III CIVIL SERVANTS (not part of prov.) 53,932 55,809 54,282 53,841 55,915
ADMINSTRATIVE COSTS incl. civil servants 375,486 415,320 422,246 445,500 455,496
Source: AMS Austria
STAFF DEPLOYMENT IN 2012
The human resources plan for 2012 provided for 4,815 posts. On the cut-off date of 31.12.2012, these established posts were filled by around 5,433 staff (of whom 16.5% were civil servants) in the Federal Headquarters and the Provincial and regional Offices. The AMS also employed a total of 54 trainees at this time, of whom 46 were female.

54
7 THE EFFECTIvE USE OF rESOUrCES By THE AMS
The proportion of women among staff is 66.3%.
In addition, in order to enable the extension of the office hours for services for jobseekers and services for companies, 63,341 additional working hours (and overtime largely on the part of private employees – i.e. non-civil servants of the AMS) were arranged.
Staff deployment 2012
Actual no. estab-lished posts 2012
of which established posts civil servants
2012
Established posts target 2012
Proportion of women as at 31.12.2012 in %
AMS Burgenland 167 39 167 62.8
AMS Carinthia 354 100 352 59.7
AMS Lower Austria 741 147 741 69.5
AMS Upper Austria 663 133 664 67.2
AMS Salzburg 272 48 271 66.9
AMS Styria 672 144 671 66.8
AMS Tyrol 357 46 357 60.6
AMS vorarlberg 193 16 194 67.1
AMS vienna 1,231 147 1,232 68.5
Federal HQ 167 42 165 55.8
Total 4,816 862 4,815 66.3
Quelle: AMS Österreich
On 31.12.2012, out of a total of 5,433 employees, 1,686 worked part-time (of whom 89.9% were women).

55
8 EMPLOyMENT AGENCIES AND PrIvATE rECrUITMENT AGENCIES 2012
8 EMPLOYMENT AGENCIES AND PRIVATE RECRUITMENT AGENCIES 2012
recent economic trends in Austria, particularly in the export-oriented sectors, have been accom-panied by typical rises and falls in the number of persons employed by employment agencies. From the third quarter of 2009 onwards, a recovery in exports could be observed, and the em-ployment agencies sector recorded a trend reversal in the labour market in February 2010, with employment figures rising again. The peak of the rise in employment was reached in February 2011 with +25% compared to the previous year.
On average in 2012, the number of employment relationships in this sector fell again and was 1.3% below the previous year’s figure at 82,329.
The annual average number of registered unemployed in the employment agencies sector in 2012 was 28,026, 12.6% higher than in 2011. Unemployment increased again from mid-2011 due to an economic downturn.
According to the results of the survey, as at 31.7.2012 a total of 1,297 employment agencies in Austria had hired out 78,414 workers to companies who were actually working for those com-panies on that day (751 employment agencies notified the authorities that none of their agency personnel were working).
TEMPORARY AND AGENCY WORKERS ACT MAIN RESULTS ACCORDING TO PROVINCES
Survey on cut-off date 31.7.2012
Num
ber o
f age
ncy
wor
kers
31.
7.20
12
Abs
olut
e ch
ange
to
the
prev
ious
yea
r
Chan
ge
to th
e pr
evio
us y
ear
in %
of w
hom
wom
en
31.7
.201
2
Abs
olut
e ch
ange
to
the
prev
ious
yea
r
Chan
ge
to th
e pr
evio
us y
ear
in %
Num
ber o
f blu
e- a
nd
whi
te-c
olla
r em
plo-
yees
as
at 3
1.7.
2012
Num
ber o
f age
ncy
wor
kers
as
a pr
opor
ti-
on o
f em
ploy
ees
of w
hom
wom
en
Num
ber o
f age
ncy
wor
kers
as
a pr
opor
tion
of f
emal
e em
ploy
ees
No.
of e
mpl
oym
ent
agen
cies
*
Burgenland 608 - 118 - 31.6% 80 - 2 - 3.5% 89,010 0.7% 42,076 0.2% 43
Carinthia 5,104 + 45 + 1.1% 1,034 - 203 - 18.5% 198,348 2.6% 93,033 1.1% 206
Lower Austria 7,813 + 2 + 0.0% 1,807 - 194 - 15.8% 526,376 1.5% 230,981 0.8% 225
Upper Austria 23,098 + 1,431 + 7.8% 3,560 - 66 - 2.2% 578,767 4.0% 252,271 1.4% 473
Salzburg 3,801 + 142 + 4.2% 889 + 40 + 5.1% 229,025 1.7% 107,487 0.8% 117
Styria 14,469 + 184 + 1.4% 3,027 - 139 - 5.0% 450,402 3.2% 204,090 1.5% 390
Tyrol 2,361 + 390 + 21.9% 482 + 100 + 29.3% 287,692 0.8% 133,761 0.4% 64
vorarlberg 2,767 + 21 + 0.8% 416 - 2 - 0.4% 142,140 1.9% 63,979 0.7% 58
vienna 18,393 + 1,534 + 9.4% 5,820 + 717 + 13.9% 709,793 2.6% 343,791 1.7% 472
Austria 78,414 + 3,631 + 4.9% 17,115 + 251 + 1.5% 3,211,553 2.4% 1,471,469 1.2% 2,048
* including employment agencies which gave a negative report

56
8 EMPLOyMENT AGENCIES AND PrIvATE rECrUITMENT AGENCIES 2012
The greatest number of agency workers were to be found in the provinces of Upper Austria, vienna, Styria and Lower Austria. The rise was particularly noticeably in the sectors of tourism with +33.3% and in the information and consulting sector with +30.5%. The number of agency workers employed in the metalworking industry, engineering and metal goods, the electrical and electronics industry and the automobile sector etc., all of which fall into the category of ‘in-dustry’, fell significantly by 32.8% in 2009, but rose again by 33.6% in 2010, and also recorded an increase of 26.1% in 2011, but fell again in 2012 by 1.6%. The number of agency workers in the non-ferrous metal industries, for example, was 5.7% below the previous year’s figure, and in the electrical and electronics industry the figure was 6.1% lower than 2011. In the automobile industry, the overall number of agency workers in Austria was almost halved, dropping from 1,439 as recorded in a survey in 2008 to 739 in 2009. In 2010 it reached 1,620, 119.2% over the previous year’s figure, and increased further by 71.1% to 2,722 in 2011. In 2012 it decreased again by 7.8% to 2,557. Only in the metalworking, engineering and metal goods industries was the number of agency workers up 23.7% on the figure from 31.7.2011.
Private recruitment agencies also placed an increased number of people in jobs in 2012. Accor-ding to a survey on 31.12.2012, there were a total of 18,019 job placements throughout Austria due to private recruitment agencies, which is around 17.7% more than in 2011. The activities of private recruitment agencies vary according to provinces: the majority of vacancies filled by such agencies were recorded in vienna and Salzburg.
In 2012, a total of 96,500 vacancies were reported to the AMS by employment agencies and private recruitment agencies, 1.6% less than in the previous year. In 2008 and at the beginning of 2009, this sector was severely affected by the fall in the number of jobs they were able to fill. The increase in 2010 amounted to 29%, and 8.6% in 2011.
In 2012, the employment agencies sector was again one of the most important corporate custo-mers of the Public Employment Service. As a result of the crisis, the number of vacancies notified by employment agencies as a proportion of the total vacancies reported to the AMS in 2009 amounted to only 17%, but has since risen to 20% in 2010, 28.7% in 2011 and 32.6% in 2012.

57
9 LABOUr MArkET DATA FOr 2012, AMS SUBSIDIES AND BENEFITS IN 2012
9 LABOUR MARKET DATA FOR 2012, AMS SUBSIDIES AND BENEFITS IN 2012
Important labour market data Annual average 2012
Total
Change to previous year:
Absolute in %
POTENTIAL WORKFORCE 3,726,096 + 57,646 + 1.6
EMPLOYEES1) 3,465,453 + 43,705 + 1.3
of which non-standard contracts 19,481 - 403 - 2.0
Employees actively working1) 3,370,479 + 47,154 + 1.4
MARGINAL PART-TIME WORKERS2) 316,510 + 8,770 + 2.8
SELF-EMPLOYED 427,446 + 4,754 + 1.1
Employment rate acc. to EUROSTAT 72.5 0.4
REGISTERED UNEMPLOYED 260,643 + 13,941 + 5.7
registered unemployed Austrians 203,772 + 7,625 + 3.9
registered unemployed foreigners 56,871 + 6,316 + 12.5
registered unemployed aged 15-24 40,296 + 1,448 + 3.7
registered unemployed aged 50 and over 59,212 + 5,325 + 9.9
Inflows to unemployment 1,006,863 + 26,406 + 2.7
Outflows from unemployment 1,131,832 + 15,625 + 1.4
Duration of unemployment (in days) 94 + 1 + 1.1
Registered long-term unemployed > 6 months 34,701 + 3,194 + 10.1
> 1 year 5,368 + 468 + 9.6
registered unemployed with job offer - job take-up 49,709 - 858 - 1.7
with job offer - others 4,713 - 363 - 7.2
UNEMPLOYMENT RATE (registered unemployed) 7.0% + 0.3
NOTIFIED VACANCIES 29,422 + 2,888 - 8.9
NUMBER OF JOBSEEKERS PER VACANCY2) 8.9 + 1.2
Unemployment rate according to EUROSTAT 4.3% + 0.1
1) Annual average calculated by the Federal Ministry of Labour, Social Affairs and Consumer Protection (BMASk), active employees without recipients of parental leave benefit and child care benefit and those completing military service
2) Annual average calculated by the BMASk

58
9 LABOUr MArkET DATA FOr 2012, AMS SUBSIDIES AND BENEFITS IN 2012
Men
Change to previous year:
Absolute in %
POTENTIAL WORKFORCE 1,994,890 + 32,825 + 1.7
EMPLOYEES1) 1,846,535 + 23,565 + 1.3
of which non-standard contracts 9,318 - 185 - 1.9
Employee Employees actively working1) 1,836,116 + 23,679 + 1.3
MARGINAL PART-TIME WORKERS2) 113,668 + 4,555 + 4.2
SELF-EMPLOYED 254,039 + 617 + 0.2
Employment rate acc. to EUROSTAT 77.8 0.0
REGISTERED UNEMPLOYED 148,355 + 9,260 + 6.7
registered unemployed aged 15-24 23,013 + 1,068 + 4.9
registered unemployed aged 50 and over 37,379 + 3,410 + 1 0.0
Registered long-term unemployed > 6 months 20,042 + 2,010 + 11.1
> 1 year 3,348 + 285 + 9.3
registered unemployed with job offer - job take-up 34,131 + 317 + 0.9
with job offer - others 1,887 - 219 - 10.4
UNEMPLOyMENT rATE (registered unemployed) 7.4% + 0.3
Unemployment rate according to EUROSTAT 4.4% + 0.4
Women
Change to previous year:
Absolute in %
POTENTIAL WORKFORCE 1,731,206 + 24,821 + 1.5
EMPLOYEES1) 1,618,918 + 20,140 + 1.3
of which non-standard contracts 10,163 - 218 - 2.1
Employees actively working1) 1,534,363 + 23,475 + 1 .6
MARGINAL PART-TIME WORKERS2) 202,842 + 4,215 + 2.1
SELF-EMPLOYED 173,407 + 4,137 + 2.4
Employment rate acc. to EUROSTAT 67.3 + 0.8
REGISTERED UNEMPLOYED 112,288 + 4,681 + 4.4
registered unemployed aged 15-24 17,283 + 381 + 2.3
registered unemployed aged 50 and over 21,833 + 1,915 + 9 .6
Registered long-term unemployed > 6 months 14,659 + 1,184 + 8.8
> 1 year 2,020 + 183 + 10.0
registered unemployed with job offer - job take-up 15,578 - 1,175 - 7.0
with job offer - others 2,826 - 144 - 4.8
UNEMPLOYMENT RATE (registered unemployed) 6.5% + 0.2
Unemployment rate according to EUROSTAT 4.3% 0.0
1) Annual average calculated by the Federal Ministry of Labour, Social Affairs and Consumer Protection (BMASk), active employees without recipients of parental leave benefit and child care benefit and those completing military service
2) Annual average calculated by the BMASk

59
9 LABOUr MArkET DATA FOr 2012, AMS SUBSIDIES AND BENEFITS IN 2012
Subsidies and benefits from the Public Employment Service (AMS) In 2012
Total
Change to previous year:
Number of persons: Absolute in %
All subsidies and benefits 397,390 + 20,299 + 5.4%
of which employment-related 74,466 + 8,365 + 12.7%
including
Company integration subsidies 33,261 + 3,713 + 12.6%
Short-time working subsidy2) 3,558 - 321 - 8.3%
Socio-economic enterprises and employment projects in the non-profit sector 31,909 + 5,011 + 18.6%
of which skills training 327,966 + 18,028 + 5.8%
including
Labour foundations 11,802 - 2,424 - 17.0%
Educational measures 195,368 + 15,901 + 8.9%
Course costs 50,517 + 8,523 + 20.3%
Apprenticeship subsidies 12,882 - 1,079 - 7.7%
Skills training for employees 47,565 - 463 - 1.0%
Subsistence allowance 240,490 + 15,818 + 7.0%
of which support 98,713 + 7,739 + 8.5%
including
Advice and support centres 76,493 + 7,090 + 10.2%
Start-ups subsidies and business start-up programme 8,069 - 45 - 0.6%
Apprenticeship market
Change to previous year:
Absolute in %
Apprenticeship seekers 5,532 + 28 + 0.5
of whom Men 3,075 + 58 + 1.9
Women 2,457 - 30 - 1.2
Notified vacancies for apprentices 3,824 + 174 + 4.8
Public Employment Service training courses
Change to previous year:
Absolute in %
PERSONS in TRAINING 66,602 + 3,371 + 5.3
of whom Men 32,299 + 1,466 + 4 .8
Women 34,303 + 1,905 + 5.9
2) Projects already settled

9 LABOUr MArkET DATA FOr 2012, AMS SUBSIDIES AND BENEFITS IN 2012
60
Men
Number of persons:
Change to previous year:
Absolute in %
All subsidies and benefits 195,205 + 11,078 + 6.0%
of which employment-related 38,298 + 4,813 + 14.4%
including
Company integration subsidies 15,903 + 1,446 + 10.0%
Short-time working subsidy2) 2,301 + 96 + 4.4%
Socio-economic enterprises and employment projects in the non-profit sector 17,939 + 3,151 + 21.3%
of which skills training 162,242 + 10,457 + 6.9%
including
Labour foundations 5,282 + 1,346 - 20.3%
Educational measures 97,602 + 9,003 + 10.2%
Course costs 24,893 + 4,410 + 21.5%
Apprenticeship subsidies 7,174 - 506 - 6.6%
Skills training for employees 19,763 - 178 - 0.9%
Subsistence allowance 121,762 + 9,611 + 8.6%
of which support 45,528 + 2,825 + 6.6%
including
Advice and support centres 35,856 + 2,755 + 8.3%
Start-ups subsidies and business start-up programme 4,575 - 134 - 2.8%
Women
Change to previous year:
Number of persons: Absolute in %
All subsidies and benefits 202,221 + 9,211 + 4.8%
of which employment-related 36,168 + 3,551 + 10.9%
including
Company integration subsidies 17,358 + 2,267 + 15.0%
Short-time working subsidy2) 1,257 - 417 - 24.9%
Socio-economic enterprises and employment projects in the non-profit sector 13,970 + 1,860 + 15.4%
of which skills training 165,758 + 7,568 + 4.8%
including
Labour foundations 6,520 - 1,078 - 14.2%
Educational measures 97,767 + 6,893 + 7.6%
Course costs 25,626 + 4,113 + 19.1%
Apprenticeship subsidies 5,711 - 570 - 9.1%
Skills training for employees 27,818 - 281 - 1.0%
Subsistence allowance 118,735 + 6,206 + 5.5%
of which support 53,186 + 4,913 + 10.2%
including
Advice and support centres 40,637 + 4,334 + 11.9%
Start-ups subsidies and business start-up programme 3,494 + 89 + 2.6%
2) Projects already settled

61
9 LABOUr MArkET DATA FOr 2012, AMS SUBSIDIES AND BENEFITS IN 2012
Under 25 year-olds
Change to previous year
Absolute in %
All subsidies and benefits 110,682 + 1,882 + 1.7%
of which employment-related 12,836 + 1,338 + 11.6%
including
Company integration subsidies 5,865 + 446 + 8.2%
Short-time working subsidy2) 304 + 143 + 88.8%
Socio-economic enterprises and employment projects in the non-profit sector 4,909 + 907 + 22.7%
of which skills training 98,715 + 1,739 + 1.8%
including
Labour foundations 3,185 - 381 - 10.7%
Educational measures 66,948 + 1,860 + 2.9%
Course costs 9,016 + 1,963 + 27.8%
Apprenticeship subsidies 12,818 - 1,050 - 7.6%
Skills training for employees 5,158 - 357 - 6.5%
Subsistence allowance 68,702 + 3,621 + 5.6%
of which support 19,670 + 1,771 + 9.9%
including
Advice and support centres 16,688 + 1,656 + 11.0%
Start-ups subsidies and business start-up programme 421 - 14 - 3.2%
Older persons (50 and older)
Change to previous year
Absolute in %
All subsidies and benefits 68,980 + 6,956 + 11.2%
of which employment-related 19,460 + 2,747 + 16.4%
including
Company integration subsidies 9,244 + 992 + 12.0%
Short-time working subsidy2) 891 + 238 + 36.4%
Socio-economic enterprises and employment projects in the non-profit sector 8,140 + 1,563 + 23.8%
of which skills training 50,868 + 6,289 + 14.1%
including
Labour foundations 1,092 - 407 - 27.2%
Educational measures 27,761 + 3,901 + 16.3%
Course costs 7,699 + 1,945 + 33.8%
Skills training for employees 11,429 + 798 + 7.5%
Subsistence allowance 36,833 + 4,597 + 14.3%
of which support 17,247 + 1,124 + 7.0%
including
Advice and support centres 15,055 + 1,035 + 7.4%
Start-ups subsidies and business start-up programme 977 + 32 + 3.4%
2) Projects already settled

62
9 LABOUr MArkET DATA FOr 2012, AMS SUBSIDIES AND BENEFITS IN 2012
Persons with health-related employment limitations
Change to previous year
Absolute in %
All subsidies and benefits 53,164 + 4,790 + 9.9%
of which employment-related 14,490 + 2,721 + 23.1%
including
Company integration subsidies 7,674 + 1,857 + 31.9%
Short-time working4) n.v. n.v. n.v.
Socio-economic enterprises and employment projects in the non-profit sector 6,284 + 996 + 18.8%
of which skills training 39,337 + 3,066 + 8.5%
including
Labour foundations 746 - 120 - 13.9%
Educational measures 28,330 + 2,166 + 8.3%
Course costs 6,242 + 1,134 + 22.2%
Apprenticeship subsidies 1,132 + 158 + 16.2%
Subsistence allowance 36,448 + 2,637 + 7.8%
of which support 17,660 + 1,603 + 10.0%
including
Advice and support centres 15,136 + 1,388 + 10.1%
Start-ups subsidies and business start-up programme 538 - 10 - 1.8%
4) Data not available, as full AMS registration of the persons was not required

This report, a detailed compilation of labour market data, and a short report on the cur-rent trends in the labour market are also available at:http://www.bmask.gv.at/cms/site/liste.html?channel=CH0694
Detailed statistical tables on the development of unemployment and employment in Austria can be accessed from the internet at:http://www.dnet.at/elis/http://www.dnet.at/bali/
IMPRINT
Media owner and publisher: Federal Ministry of Labour, Social Affairs and Consumer Pro-tection; Stubenring 1, 1010 Vienna • Responsible for the content: Division VI of the Federal Ministry of Labour, Social Affairs and Consumer Protection, APF Team • Compiled by: Eva Auer, Dagmar Brandstätter, Andreas Buzek, Manfred Clemenz, Claudia Friedenthal, Peter Grahofer, Birgit Neuhold, Silvia Perfler, Sonja Schmöckel, Anika Türk • Place of publishing and production: Vienna, September 2013 • Layout: Günter Jexenflicker, BMASK • Printed by: BMASK • ISBN: 978-3-85010-334-3 • Ordering information: Available from the BMASK Or-dering Service https://broschuerenservice.bmask.gv.at or by e-mail: [email protected].
All rights reserved: Any use (also in part) of this publication is only allowed with the media owner‘s permission. This is particularly applicable to any kind of reproduction, translation, microfilming, broadcasting on TV and radio, as well as digital processing and data feeding (via Internet or CDs etc.)
Vienna, October 2013

LABOUR MARKET POLICY IN AUSTRIA 2012
FEDERAL MINISTRY OF LABOUR, SOCIAL AFFAIRS AND CONSUMER PROTECTIONStubenring 1, 1010 ViennaTel.: +43 1 711 00 – 0 [email protected]


![British Columbia Labour Market Outlook 2010 - 2020 · Labour Market OutlookLabour Market Outlook British Columbia Labour Market Outlook: 2010-2020 [2] B.C. Labour Market Outlook,](https://static.fdocuments.in/doc/165x107/5e167e8e481eae63a43f8127/british-columbia-labour-market-outlook-2010-2020-labour-market-outlooklabour-market.jpg)