Labour Market Capacity The Danish case study · Labour Market Capacity The Danish case study ......
41
Labour Market Capacity The Danish case study New Cross-National Architecture for Labour Market Statistics Projects 23 – 28 September 2002 Bellagio, Italy Draft Not for distribution Finn Tidemand Peter Plougmann Orla Skrubbeltrang
Transcript of Labour Market Capacity The Danish case study · Labour Market Capacity The Danish case study ......

Labour Market Capacity
The Danish case study
New Cross-National Architecture for Labour Market Statistics Projects
23 – 28 September 2002
Bellagio, Italy
Draft
Not for distribution
Finn Tidemand
Peter Plougmann
Orla Skrubbeltrang

2
Contents
1. Capacity - input to some key research questions......................................... 3
2. Denmark in the 90s......................................................................................... 4 2.1 Social dialogue and ALMP ..................................................................... 5 2.2 Hours worked - a reason for the collapse of the Philips curve?............... 7
3. Factors that influence the trend in labour market capacity......................... 8 3.1 Reflections on the inflow to and exits from the labour force.................. 8
4. Trends in working time / hours worked in Denmark ................................10 4.1 Total number of yearly hours of paid work in Denmark....................... 11 4.2 Average working time and overtime ..................................................... 12
4.2.1 The actual working time ........................................................... 12 4.2.2 International comparison of weekly hours of work ................... 14
4.3 Part-time work ..................................................................................... 14 4.3.1 The extent of part-time work.................................................... 14 4.3.2 Development in part-time employment .................................... 15 4.3.3 International comparisons of part-time work............................ 15
4.4 Other forms of paid work - second jobs............................................... 16 4.5 Summary of the actual and potential labour market capacity of the
employed............................................................................................. 16 4.6 Conclusion: Limited potential for higher labour market capacity among
employed............................................................................................. 17
5. Flexible inclusion of the ‘quiet reserve’........................................................18 5.1 Labour market participation and the ‘quiet reserve’ .............................. 19 5.2 Who and how many ............................................................................. 21
5.2.1 Persons outside the labour force............................................... 21 5.2.2 The quiet reserve ...................................................................... 22
5.3 Characteristics of the persons in the quiet reserve ................................ 24 5.4 In conclusion - the quiet reserve and their potential to labour market
capacity............................................................................................... 26
6. Dynamics, a thematic discussion ................................................................ 27 6.1 Dynamics of time and effects on the working time............................... 27 6.2 The socio-economic context ................................................................ 28 6.3 Supply of labour by women.................................................................. 29 6.4 Lifestyle Factors................................................................................... 30 6.5 Do we want to work more than we do?................................................ 31 6.6 Motives for working part-time.............................................................. 32 6.7 Motives for second jobs and overtime.................................................. 33 6.8 Financial incentives of increasing the supply of work ........................... 34
7. Conclusions................................................................................................... 37 7.1 Capacity problems ahead...................................................................... 37 7.2 Answers to our two key research questions.......................................... 39
8. Literature ....................................................................................................... 40

3
1. Capacity - input to some key research questions
This paper is supposed to give some input to the considerations in the project when it comes to the following two key questions:
• What factors influence the trend in labour market capacity over time within a country and across countries?
• What is the most appropriate concept of labour market capacity?
We will do so using a country case approach with Denmark as an relevant case.
Politically, the Danish case provides some interesting input to the debate about whether or not the unemployment rate is an adequate measure of economic vitality and potential wellbeing of the population of any nation.
We will use the Danish case to show that the traditional Phillips curve arguments are insufficient to explain what happened in the 90s. We will then address other explanations and pay extra attention to the suggestion of Bluestone and others to focus on the actual growth in supply of hours worked and not unemployment as a factor of great relevance.
We will show that even if hours worked is an important explanatory factor, it is not easy to measure and the new forms of work and employment together with new lifestyles seem to make it difficult just to use standard employment conditions as the only relevant measure.
Throughout this paper we will touch upon different ways of measuring both potential labour market capacity and fluctuations in labour market utilization.
We find it necessary to pay attention to the social and political context for the fluctuations in hours actually worked.
We will argue that a more comprehensive understanding of why some people tend to stay very flexible and accept a high degree of uncertainty is important. Thus the flexibility of the labour market and the incentives for people to enter and exit the labour force seem important in order to understand the trends in labour market capacity and eventually well-being.
Part of our understanding must be linked the notion of different welfare state regimes. We must pay attention to the specific conditions provided by the different well-fare regimes. Only if we include these factors will it be possible to give a comprehensive concept of labour market capacity is the argument1.
1 We are in this aspect in agreement that some of the points made in the paper of Martha MacDonald

4
2. Denmark in the 90s
The paper is based on experiences in Denmark. The economic and employment development in Denmark in the period from 1993/94 to 2002 is an exceptional case in many aspects. This is not the place to go into any great detail2 - it is enough to emphasise the fact that unemployment went down, employment increased, the state deficit was turned into a surplus and the real net income of the average wage and salary earner went up. This happened without any significant increase in inflation.
This situation is reflected in the Phillips curve development in Denmark, posing some theoretical problems for traditional economic thinking and policy recommendations. Figure 2.1 Denmark: Unemployment and nominal wage growth, 1961-1999
Source: Peter Plougmann and Per Kongshøj Madsen; “Flexibility, employment development and active labou r market policy in Denmark and Sweden in the 1990s, Paper to New School, NYC, 2001 (website)
As it can be seen the development in the 90s looks very much like the development in other countries, including the US. The Phillips curve did behave strangely in Denmark in the 90s. Both theoretically and politically there is a need for explaining what made the Danish labour market and economy work with such effect in the 90s and to ask if it is a sustainable situation.
The question is what key drivers were paving the way for the Danish economy in the 90s and what policy might work in the future? 2 See Peter Plougmann and Per Kongshøj Madsen; “Flexibility, employment development and active labour market policy in Denmark and Sweden in the 1990s”
0
5
10
15
20
25
Wag
e gr
owth
(pe
rcen
t)
0 2 4 6 8 10 12 14 Unemployment (percent)
1961
1962
19631964
1965
1966
19671968
19691970
1971
1972
1973
1974
1975
1976
1977 19781979 1980
1981 1982
1983
198419851986
1987
1988
19891990 1991 1992
19931994
19951996199719981999

5
2.1 Social dialogue and ALMP
When looking for key drivers we will emphasise the specific Danish labour market model focusing on social dialogue and consensus building enabling industry, labour and government actors to balance different interests.
Others regard the Active Labour Market Policy (ALMP) as the key explanatory factor. ALMP, so goes the argument, has increased the capability and competence of the unemployed and enhanced the functionality of the segmented labour market thus preventing bottlenecks on the labour market to occur and keeping wage inflation in place.
There is some relevance to both arguments, however there are also some contradictions involved.
Social dialogue has lost some of its effectiveness on the national level due to an increasing negotiation power at company and local level. Centralised collective bargaining agreements tend to be only framework agreements that have to be implemented, leaving it up to the local union representation and the company management to decide on wage increases. However, it is evident that the globalisation process makes it difficult for companies to transfer any cost increases to the market. This puts more emphasis on innovation and productivity issues. In general, both unions and management recognise the need for a cost structure that leaves room for both job security and innovation at the same time. The local negotiation process in the late 90s seems in Denmark in general to have paid much attention to this trade-off between wage increases and productivity. What we have witnessed is an interesting modification of the traditional antagonistic labour-management relation in a modern society.
ALMP might still have some national independence but is increasingly under pressure from EU employment policy demands. Additionally, welfare policy interests3 like early retirement schemes and educational leave schemes influenced the ALMP in the 90s, - blurring the logic of a straightforward focus on maintaining a sufficient labour market capacity. These initiatives were in fact very dangerous because they reduced the labour supply in a period of time when there was a need for additional labour supply.
Since 1997/98, however, there has been increasing political awareness of upcoming problems. One major concern has been the potential lack of labour.4 The reason for this is especially due to the demographic development that in Denmark - as in the majority of EU countries - tends to make the labour market still greyer and - some might add - less flexible, thus endangering future innovation and productivity.
The government estimates that there is a need for approx. 130,000 more people on the labour market within the next 7-8 years in order to compensate for the
3 Peter Plougmann” Hvad kan vi lære af 90’ernes arbejdsmarkedspolitik ? (What is to be learned from the ALMP of the
90s), SFI publication, 2002
4 Oxford Insight (2001),” Are the labour market reserves being depleted?” Report to the Danish Ministry of Labour.

6
demographic effects and secure an adequate additional supply of labour that might prevent bottlenecks on the labour market.
All this indicates a presently very high utilisation of the labour capacity. If the high growth rates continue in the coming decade, the demand for qualified labour that meets the needs of the 'new economy' in Denmark will increase faster than the supply. There are problems appearing already. The Public Employment Service's most recent analysis shows shortages in several dozen job categories and acute shortages in many others, including car mechanics, taxi drivers and nurses.
The major challenge facing the ALMP in Denmark is the need to modernize the programmes and incentives once again. This time to a future where the problems of meeting the demands for skilled labour and labour with specific qualifications related to the new economy are greater than the problems of long-term unemployment. Thus the future focus of ALMP should not be on combating long-term unemployment, but on how to increase the size of the labour force and enhancing the qualifications of the labour force within the framework of the new economy. According to the Danish federation of Trade Unions (LO, 2001) this includes:
• Getting the non-active part of the population mobilized and motivated for entering the labour force
• Integrating immigrants into all parts of the labour market by fighting discrimination
• Establishing a structure on the labour market that will increase the possibilities for older workers to find flexible, part-time employment.
• Reducing the absentees and improving the quality of working life • Reforming the unemployment insurance benefit system in order to adapt it to
a labour market with more free agents and more self-employed people.
In the case of a new recession, Denmark is in danger of encountering heavy 'mismatch' problems on the labour market; i.e. increasing long-term unemployment for labour with low qualifications while there is increasing demand for specialized qualified labour.
This will also lead to a need for a modernization of the ALMP, much along the lines already discussed, but the ALMP must also take the problems related to the long-term unemployment into account. This will be a real challenge for the future ALMP in the welfa re regime of Denmark.
To sum up - there is a need for recognising the impact of moderate local collective bargaining processes and the influence of the ALMP conducted in the 90s as relevant key drivers for explaining the strange Danish Phillips curve. However, it might not be the whole story.

7
2.2 Hours worked - a reason for the collapse of the Philips curve?
Bluestone and Hamilton5 argue that we need to look at the actual hours worked in order to understand what happened in the US in the 90s. When hours worked increase, it has the same effect as an increasing labour force participation rate.
Forcing many working poor to work more hours and developing a culture of workaholics among the well educated seems in the US to be part of the reason for the fact that still more hours are worked by the same working population.
This has led the subgroup on labour market capacity to ask if a measure of labour market utilization based on the ratio between actual hours worked and potential hours worked may be a better indicator of economic capacity than the standard unemployment rate.
Thus it is relevant to look at hours worked in Denmark. We will do that in this section of the paper.
However, we have to remember that it is not possible to analyse the development of actual hours worked/potential hours without paying attention to the social and political context of the different economies.
As we have already seen in the first FORD project there were many different explanations for the same measured level of unemployment. The same is true when it comes to employment and labour force participation (measured in hours).
So we will start with describing what factors we regard as influential on the trends of labour market capacity. We do that empirically, using available statistics and reflecting on other research results that look at incentives and lifestyle as explanatory factors behind the supply of labour.
Finally, we will look into what social and political contexts might be part of the story, including some reflections on the role of labour market flexibility.
5 Measuring Labour Market Capacity, 2001

8
3. Factors that influence the trend in labour market capacity
3.1 Reflections on the inflow to and exits from the labour force
In principle, the labour force and employment are affected by shifts in the inflow to and exits from various sources.
Inflow to the labour market is traditionally divided into:
• Young people (including newly qualified or trained people). • Unemployed people matching enterprise needs without labour market policy
measures. • Integrating the unemployed via labour market policy measures.
These three sources are also relatively well documented and have to a large degree formed the core of labour market policy reasoning in later years.
Exits generally depend on:
• Retirement (due to age), incl. early voluntary retirement • Retirement due to illness/ early non-voluntary retirement and death.
These factors are also relatively well documented empirically and in general there is a good understanding of the policy measures that have a reasonable effect.
In addition to the sources to the labour market capacity already mentioned, it is worth taking note of the following supplemental sources of increasing the labour market capacity:
• The working hours of the employed: full-time, part-time, overtime, second job.
• Flexible inclusion of the so-called "the quiet reserve" into the labour force and often directly into the group of employed (flows from into employment states other then unemployment, particularly from "not in the labour force").
• Finally the balance between immigration and emigration - in total and categorised by qualifications and labour market segments - plays a large role in the development of the labour force and the future size of the labour capacity
These three sources are not quite so well documented and politically there is less awareness of them than of the other sources of increase already mentioned.

9
Figure 3.1 Labour Capacity
Source: Oxford Insight A/S
The approach to the supply of labour and employment in general is illustrated by figure 3.1.
It is worth paying attention to the fact that sources are regulated in different ways. Some are regulated politically and others are in general left to marked forces, although of course regulation and different incentive structures might play into the process as well.
ALMP efforts have been aimed extensively at the regulation and integration of unemployed into the group of employed. ALPM schemes (activation) are still seen as essential for maintaining an adequate pool of labour and we have already discussed the impact on labour capacity.
Labour Capacity
MARKET
POLICY-REGULATED
Immigrant balance
'The quiet reserve'
Employee working hours
Unemployed claimants
Retirement
Activation

10
Retirement schemes like the Early Retirement Scheme (ERS) have proven to by extremely successful seen from a welfare point of view but not from a labour capacity point of view.6
The other sources of increased labour capacity; working time, the inclusion of "the quiet reserve" and the students, have to a large degree been left to the market forces and/or are influenced by a large number of other policy areas (tax, education and training, etc.) than by the labour market policy.
In the next section we will empirically look at the development in Denmark of:
• The working time of the employed categorised by normal working hours, overtime work and multiple jobs,
• Integration of more people from "the quiet reserve", • Finally we will make some short comments on the impact of immigration and
integration of refugees/immigrants resident in Denmark
Together these sources comprise the real reserves for the future Danish labour market.
4. Trends in working time / hours worked in Denmark
Compared to other countries Denmark has a high labour market participation rate. Initially, this presents a picture of a large labour market capacity generally, however, a number of factors may influence the extent of the supply and thus the extent of the reserves that are hidden.
There are factors implying that the supply of labour, and the reserves, is higher or lower than what may initially be presumed on the basis of an analysis of the Danish participation rate.
This section will focus on the supply of labour by the employed in order to analyse the resources held by those in employment when it comes to further increasing the labour market capacity in Denmark.
The analysis is divided into three subsections:
• The average working time and overtime of the employed. • The extent of part-time work. • The extent of second jobs.
6 The ERS was originally put into action as a scheme that simultaneously did reduce the number of often long-term
unemployed and improved the life of many hard working elder employees who had encountered physical problems and/or psychological stress related sickness, all symptoms which made it difficult for them to maintain employment on normal conditions. Many people that went into ERS were at the point when they were entitled to ARS already not in the active labour force. During the years however the situation changes and by the end of the 90s a large majority of all employees on the Danish labour market thought at ERS as the normal retirement age, thus leaving the labour market at the age of 60, that is 5-7 years before retirement age as it was defined before ERS. This has had a profound impact on the labour capacity in more than a decade.

11
4.1 Total number of yearly hours of paid work in Denmark.
The task of analysing the number of hours actually worked in Denmark is difficult due to different data sources indicates different numbers of hours worked.
The Working Time Accounts7 describe the total number of yearly hours of paid work in Denmark. The Working Time Accounts differ from a number of other accounts by referring to the actual number of hours worked and by being based on the Labour Force Survey (LFS). However, since the total number of working hours is based on other information than the Labour Force Survey, the Working Time Accounts and the survey are not in full accordance.
The Labour Market Report published by the Danish Employers' Confederation in 1999 recorded an extent of work of 4.3 billion working hours p.a. (1998)8 calculated on the basis of the working time determined by the labour agreement and the part-time rate.
Figures presented in the Financial Statement and Budget Report 2000 show a number of 4.1 billion hours worked in 1998.9 This figure is somewhat above the 3.6 billion hours stated in the Working Time Accounts and this variation is primarily attributable to different methods of calculation.
Below, table 3.2 presents the total number of hours worked in the five years covered by the Working Time Accounts so far.
Table 4.1 Number of hours worked in Denmark 1995-1999 Number of hours (1000) No. of hours per person
1995 3,374,992 1,293 1996 3,438,935 1,304 1997 3,498,858 1,313 1998 3,574,309 1,304 1999 3,624,395 1,312 Source: The Working Time Accounts, in Labour Market 2000:39, The hours worked are defined as hours paid by an employee, including paid overtime, Absence due to sickness, leave, etc, is not included, Both employees and self-employed persons are included,
We can see an increase in the total number of hours worked of nearly 250 million hours, or 6.9 per cent, from 1995 to 1999. Whether or not this increase is the real explanation why the Phillips curve behaved so strangely in the 90s is difficult to determine. However, these findings correspond somewhat with the findings of Bluestone and others in the US data.
It is relevant to stress that the average number of hours worked per employee also has increased a little in that period. However, the number of hours worked per employee has only risen by approx. 1 per cent.
7 In Danish: "Arbejdstidsregnskabet".
8 Labour Market Report, 1999, Danish Employers' Confederation, figure 1.1. 9 The Financial Statement and Budget Report 2000, table 8.3. Source: In the Report stated as the Annual Danish
Aggregate Model databank.

12
4.2 Average working time and overtime
When the development in the actual supply of labour is examined, an important benchmark is the average working time of the employed. The subsequent analyses of part-time work, overtime and those holding second jobs have to be included in order to give a clear picture of how much Danes actually work.
There is no doubt that the typical working person in Denmark in 2002 works less hours in a year than he or she did 50 years ago.
A significant reason for the fact that the actual working time has dropped in past years is a considerable decrease in the annual working time determined by the collective bargaining agreements. There are two significant factors influencing the general annual working time agreed to:
• The weekly hours worked • Numbers of holidays
There has been a heavy drop in the weekly working hours in manufacturing since the 1950s. From 1958 to 1990 the weekly hours have fallen from 48 to 37 hours. From 1990 up until now there has been no reduction of the weekly working hours in the agreements.
In that same period the holiday period has increased significantly. In 1950 the agreements accepted a three-week holiday period, while the spring 2000 agreements accepted between five and six weeks of holidays or other time off.
Together these two factors mean that the working time in the manufacturing sectors is relatively short in Denmark compared to the rest of the European Union. For full-time employees the working time is less than 1,700 hours per year in Denmark, and in Sweden, the United Kingdom and France, it is nearly 100 hours more. However, in Germany it is approx. 100 hours shorter.10
4.2.1 The actual working time
The decrease in the planned working time per week has had an effect on the actual working time. Figure 2 below shows that the average annual working time in manufacturing has fallen from approx. 2200 hours p.a. in the beginning of the 1950s to approx. 1600 hours p.a. in the beginning of the 1990s.
In the period from 1950 to the beginning of the 1990s the annual working time for an employee has dropped by 25 per cent.
Other European countries have experienced similar declines in the average annual working time over the same period of time. The average annual working time in Germany has been reduced by nearly 35 per cent in the period 1950 to 1997, while countries such as the Netherlands, France and Sweden have experienced drops in working time of between 15 and 25 per cent.11
10 Labour Market Report, 1999, Danish Employers' Confederation
11 Labour Market Report, 1999, Danish Employers' Confederation. Development in the calculated annual working time.

13
Figure 4.1 Average annual hours worked in the industrial sectors, 1948 - 1994
1200
1400
1600
1800
2000
2200
2400
1948 1952 1956 1960 1964 1968 1972 1976 1980 1984 1988 1992
Ho
urs
wo
rked
per
yea
r
Source: 50-year overview, Statistics Denmark
The figures presented above have all been calculated on the basis of information about the working time determined by the labour agreements and the part-time rate on the labour market. In the Labour Force Survey the actual average working time is measured. Since 1990 the actual average weekly working time has been relatively stable in Denmark and the average weekly working time for all employees was 35.5 hours in 1999. When the employment rate is low, the weekly hours worked might increase due to more people putting in more overtime, - that is the difference between work planned and the actual hours worked.
When the actual extent of the work compared to the work planned is examined, it appears that from the beginning of the 1990s and up until the end of 1990s the decline has been most pronounced in the category of people who have worked less than planned/normal, indicating an increasing number of employees accepting and performing overtime.
Figure 4.2 The actual weekly working time of employees in the 90s
32
33
34
35
36
37
1990 1991 1992 1993 1994 1995 1996 1997 1998 1999
Ho
urs
wo
rked
Source: Labour force survey, results. Various years. The avera ge weekly working time refers to a reference week in the second quarter of the year.
14
The share of Danes working overtime has increased nearly 20 per cent from 1990 to 1999. This finding is important when we are discussion the dynamics behind the Phillips curve. However, there is nothing in the data that suggests that the increase of hours worked is anything remotely similar to that of the US.
4.2.2 International comparison of weekly hours of work
Internationally, the average weekly working time – defined as the weekly hours of work in manufacturing sector determined by the labour agreements - is relatively low. In the European Union only the Netherlands has a lower rate of weekly hours of work than Denmark. There are considerable differences in the average weekly hours of work in the European Union. The lowest rate can be found in the Netherlands, where the weekly hours of work are 31.7, and the highest can be found in Greece, where the hours of work are 41.7. For the EU as a whole there has been a decrease in the average weekly hours worked of approximately one hour in the 90s. Again, this is nothing like what we have seen in the US in the 90s.
4.3 Part-time work
Despite the high participation rate in Denmark there may be a relatively large pool of labour hidden as a reserve if a large share of the employees are working part-time jobs. Those working part-time jobs may potentially work more if they give up their part-time jobs and find full-time jobs instead. This potential labour reserve will be examined in the following section.
4.3.1 The extent of part-time work
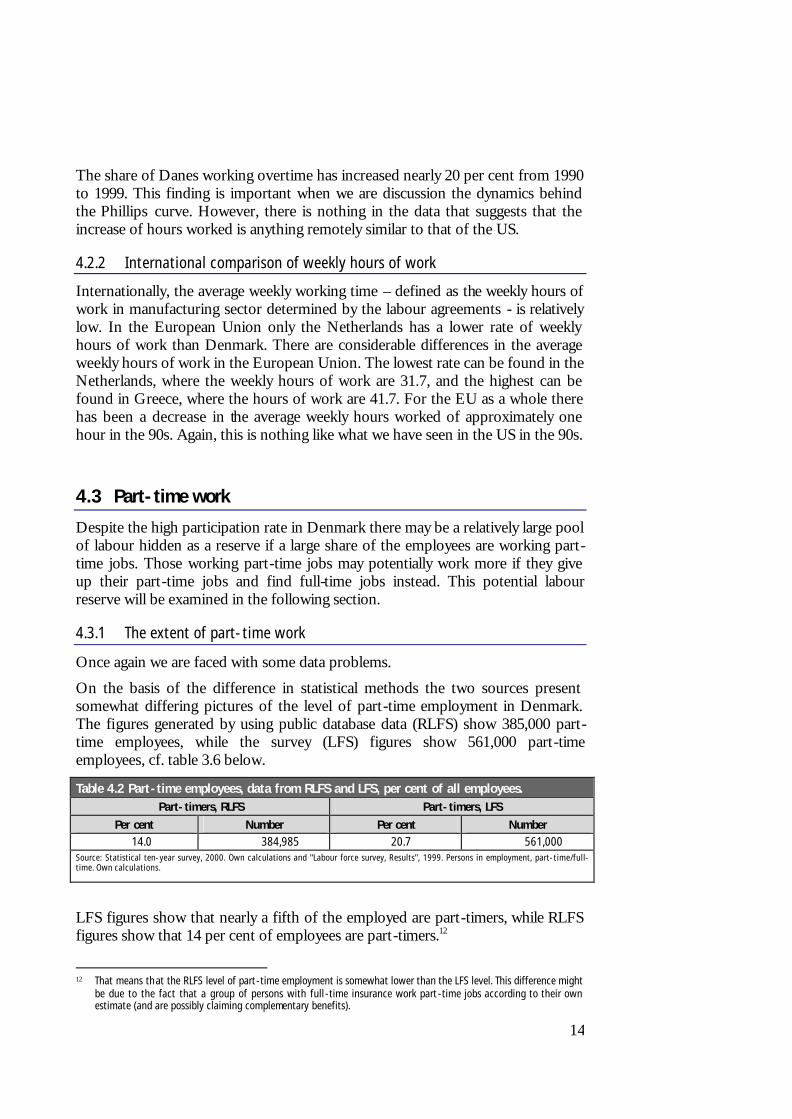
Once again we are faced with some data problems.
On the basis of the difference in statistical methods the two sources present somewhat differing pictures of the level of part-time employment in Denmark. The figures generated by using public database data (RLFS) show 385,000 part-time employees, while the survey (LFS) figures show 561,000 part-time employees, cf. table 3.6 below.
Table 4.2 Part-time employees, data from RLFS and LFS, per cent of all employees. Part-timers, RLFS Part-timers, LFS
Per cent Number Per cent Number 14.0 384,985 20.7 561,000
Source: Statistical ten-year survey, 2000. Own calculations and "Labour force survey, Results", 1999. Persons in employment, part-time/full-time. Own calculations.
LFS figures show that nearly a fifth of the employed are part-timers, while RLFS figures show that 14 per cent of employees are part-timers.12
12 That means that the RLFS level of part-time employment is somewhat lower than the LFS level. This difference might
be due to the fact that a group of persons with full-time insurance work part-time jobs according to their own estimate (and are possibly claiming complementary benefits).

15
The male and female rates of part-time employment differ significantly disregarding the data source used. The female rate is - as might be expected - much higher than the male rate, cf. table 3.7 below.
Table 4.3 Part-time employees, as a share of all employees, RLFS and LFS Part-timers, RLFS Part-timers, LFS
Female Male Female Male Per cent Number Per cent Number Per cent Number Per cent Number 17.6 221,821 11.0 163,164 33.8 422,000 9.6 140,000 Source: "Labour Force Survey, Results", 1999 and Statistical ten-year survey, 2000. Own calculations.
When the LFS figures are examined, it appears that there is three times the number of female part-timers compared with male part-timers. It also appears that more than a third of the women employed are in part-time employment, while only one in ten men are in part-time employment.
4.3.2 Development in part-time employment
The past two years have seen a drop in part-time employment, both in absolute figures and measured as a share of total employment. The very significant differences in the level of male and female part-time employment rates have not changed fundamentally during the past ten years. However, the two rates have converged slightly.
The part-time frequency for women has been reduced by nearly 10 percentage points from 28 per cent in 1990 to 18 per cent in 1999. In comparison, the male part-time rate has experienced a slight increase from 10 to 11 per cent (RLFS).
4.3.3 International comparisons of part-time work
Internationally, the part-time frequency is relatively high in Denmark. When the frequency rate is compared to countries in the rest of the European Union (based on LFS), Denmark has the fourth highest part-time rate. The 1999 EU average was nearly 18 per cent, while the Danish rate was close to 21 per cent.
In an international comparison, the very significant difference between the male and female part-time frequency, which appears in Denmark, is certainly no exception. In all of the EU countries the female part-time rate is considerably higher than the male rate. The EU average shows a part-time male rate of 6 per cent, while the female rate is close to 36 per cent.
The development trend towards a lower part-time employment rate in Denmark is something different from other EU countries. Apart from Denmark, only Sweden has experienced a decline in the part-time employment rate in the last ten years.
The European Union as a whole has seen an increase in the part-time frequency of close to 4 percentage points, moving from a part-time frequency of 14 per cent in 1990 to a frequency of 18 per cent in 1999.
This development indicates that the resources hidden in part-time employment are being exploited in Denmark. In contrast to the development in more or less all

16
other Member States, Denmark is converting part-time employment to full-time employment, which - other things being equal - means that the actual labour market capacity is increasing.
4.4 Other forms of paid work - second jobs
The total supply of labour may increase if the persons in employment take on a second job, thus performing more paid work.
The share of employees working second jobs varies somewhat between the two types of statistics used in Denmark. The level is somewhat higher in the RLFS than in the LFS. According to the method used between 7 and 10 per cent of all employees have a second job.
The share of second jobholders is relatively high in Denmark when compared with the rest of the European Union. Among the EU countries only Sweden has more persons with second jobs than Denmark. In Sweden close to 10 per cent hold second jobs, while Denmark has 7 per cent. The EU average is 3.5 per cent, which is due to the fact that a number of the large countries, such as Germany, Spain, Italy and France, only have a limited number of people holding second jobs.
When the historic development is examined, the main part of the EU countries has experienced an increase in the share of employees with second jobs. However, these are generally relatively moderate increases of between 1 and 2 percentage points for the period. In addition, there are a number of countries, where the share of employees with a second job has been stable or declining for the past ten years.
4.5 Summary of the actual and potential labour market capacity of the employed
The general, long-term conclusion is that since the 1950s the employed have substituted a great deal of working time with leisure time. When the working time is analysed, it appears that
• viewed over a long period of time - from the mid-1950s to the beginning of the 1990s - there has been a drop in the average annual working time for the employee of approx. 25 per cent.
Despite the fact that more people are in employment, the significant drop in the average working time has resulted in a marked decline in the total number of hours worked in the period from 1950 up until the present.
Still, there are many indications that the total work performance has been increasing since the mid-1990s. From 1995 to 1999 there has been an increase in the number of hours worked of close to 250 million or 6.9 per cent.
This covers the fact that more people are in employment .The latest statistics of the actual working time for the employee show that

17
• the average weekly working hours in the reference week have been stable or slightly rising during the 1990s,
• the share working overtime has been increasing in the 1990s and that • the average annual working time for the employee has been rising slightly
since the mid-1990s.
That means that in the past ten years there has been no substitution of working time for leisure time for the employee.
When focus is on other components of the total employment rate; part-time and other paid work/ second job, it appears that the trend is not moving towards substituting work with leisure time.
The 1990s have seen a decline in the share of employees working part-time and a minor increase in the share of employees holding a second job.
However, there is still nearly a fifth of employees in Denmark who work part-time, which - compared with international figures - is a comparatively high level. The decline in part-time work in the 1990s has been sharper for women than for men, which means that the part-time frequency for men and women in Denmark has converged.
The declining trend in the part-time employment rate in Denmark cannot generally be found in the other EU countries.
Close to every tenth employee in Denmark has a second job. The share holding a second job has remained relatively stable, with a small increase at the end of the 1990s. Internationally, the share of second-job holders is rather high in Denmark. The share is twice as large in Denmark as it is in the EU. The main share of the EU countries has, as Denmark, seen increases in the rate of second-job holders. However, they have generally been moderate increases of between 1 and 2 percentage points for the period.
4.6 Conclusion: Limited potential for higher labour market capacity among employed
To sum up, the process of substituting work with leisure, which could be seen in the period from the early 1950s to the early 1990s has not continued in the late 90s.
From the mid-1990s and until the present, Danes have made a reverse substitution, which manifests itself in as an increased participation rate and longer weekly and annual working hours for employees, and in the shape of fewer people working part-time and more people with second jobs.
In some areas there is still room for an increasing number of working hours.
• The general figures for the total average actual working hours show that they are fairly low in Denmark compared with other countries.
• One option of increasing the working hours is to reduce the number of persons with part-time employment. Denmark has a very high part-time

18
frequency. In contrast to many other countries, Denmark is undergoing a development towards a lower share of part-timers. If this development is maintained and part-time employment is replaced by full-time employment, it will result in an increased supply of labour.
• On the other hand, it is doubtful whether there is a potential for encouraging more people to find second jobs. Denmark is one of the EU countries with the highest share of people holding second jobs, and one of the countries where this share has been increasing in later years.
When making a general assessment of the potential labour market capacity of the employees, this analysis shows that the general declining trend in working hours appears to have stopped.
However, there is some probability that the total annual average working hours will decrease in the next few years due to the five extra days of holiday, which have been included in many labour agreements from the beginning of 2000.
This extra week is expected to lead to a drop in the total supply of work hours of approx. 1.2 per cent during the next five years.13 The question is to what extent this drop in the supply of work hours will influence the number of hours worked.
Several labour market researchers14 point out that the general increase in work hours for the employee does not appear to be a potential solution to the labour supply problem of the future.
At present, the options or wishes of the employees have reached a saturation point. Other solutions are needed and a reduction of early retirement, limiting maternity/paternity leave options and increasing the integration of immigrants are some of the most feasible solutions for increasing the labour supply.
It does not appear realistic to solve the future supply problem by attempting only to increase the supply of labour on the basis of those already in employment.
It appears to be possible to create a small supply on the basis of employees, but the supply will not reach a size that matches the expected lack of labour in the near future.
5. Flexible inclusion of the ‘quiet reserve’
An important part of our discussion on labour market capacity has been linked to the notion of inflows from the group ‘not in the labour force’.
Denmark is characterised internationally by a high labour force participation rate. Despite this fact it might still make sense – in the efforts to increase the labour supply – to examine the possibility of increasing the labour force by using what 13 The Financial Statement and Budget Report, 2000, chap. 8.9.
14 E.g. Nina Smith and Ivan Thaulow

19
we prefer to call the ‘quiet reserve’. Persons who are not part of the labour force, but who are able and willing to enter the labour market, are named the ‘quiet reserve’.
Persons outside the labour force will typically enter the labour market in periods of favourable economic conditions, but there will always be mobility into (and out of) the labour force.
This part of the paper will attempt to identify in more detail the extent of the labour potential in the group of persons outside the labour force in order to gain some country-specific insights into the impact of inflows on labour market capacity.
5.1 Labour market participation and the ‘quiet reserve’
There are a number of different terms describing the labour market attachment of the population. A basic term in the description of the labour market attachment is the labour force. The labour force includes persons who are employed as salaried workers, who are self-employed or seeking a job.
The labour force is usually regarded as the resources (the manpower) available for the labour market at a given time.
Different labour market statistics have different definitions of the three central groups that the labour force consists of and this leads to different definitions of the group outside the labour force.
This section deals with the Labour Force Survey (LFS).15 The labour market attachment based on the LFS is described in the table below.
Table 5.1 1st quarter labour market attachment among the 15-66 age group, 2001 Number Per cent
Employed 2,691,000 73.6 Unemployed 148,000 4.0 Outside the labour force 817,000 22.3 Total 3,656,000 99.9 Source; LFS, Statistical News 2001:32.
As mentioned the quiet reserve consists of persons outside the labour force who can enter the labour market. The table above shows that approx. 800,000 persons between 15 and 66 years of age are outside the labour force.
There are many indications that there is some labour potential in the group of persons outside the labour force.
The tables below illustrate the inflow into the group of employed for selected years. The inflow comes from three main sources: the unemployed, students and people from outside of the labour force (previously without a trade or occupation)
15 The Labour Force Survey (LFS) is an interview-based statistic carried out by Statistics Denmark. Its strong point in this
context is that it reveals job wishes and job search behaviour.

20
Table 5.2 Inflow into the group of employed (thousands) Inflow from:
Unemployed Students No trade/occup. Total inflow
Total employment end qt./year.
1990 - 1991 73 103 19 195 2639 1991 -1992 120 125 19 264 2652 1992 - 1993 122 123 20 265 2584 2nd q. 1996 – 2nd q.1997 63 196 41 300 2683 2nd q. 1997 - 2nd q. 1998 60 191 40 291 2686 2nd q. 1998 - 2nd q.1999 62 190 33 285 2713 Source: Statistics Denmark; Statistical News: Labour market (LFS), various volumes. No figures after 1999 have been published and no figures for the period 1993-1997 have been published.
The table shows that inflow into the group of employed by persons with no trade or occupation is considerable, particularly in later years. The inflow consisted of approx. 40,000 persons in 1997 and 1998, while it was somewhat lower in 1999 with a total inflow of 33,000 persons.
In 1999 the quiet reserve inflow made up 1.2 per cent of the total employment rate.
The absolute largest inflow into employment comes from students. Students constitute between half and two thirds of the total inflow into employment in the years illustrated by the table below.
Table 5.3 Share of inflow into employment from various groups (per cent) From unemployment From students From no trade or occupation Total inflow
1991 37 53 10 100 1992 45 47 7 100 1993 46 46 8 100 1997 21 65 14 100 1998 21 66 14 100 1999 22 67 12 100 Source: Statistics Denmark; Statistical News: Labour market (LFS), various volumes. No figures after 1999 have been published and no figures for the period 1993-1997 have been published.
In later years, inflow to employment from person with no trade or occupation constitute between 12 and 14 per cent of the total inflow. The inflow share from this group is thus coming closer to the inflow from the unemployed who in later years have constituted approx. 20 per cent of the total inflow.
In the beginning of the 1990s when the unemployment rate rose and employment rates dropped, the inflow from persons with no trade or occupation was clearly lower than at the end of the 1990s, which was a period characterised by falling unemployment rates and increased employment rates. This type of integration of persons outside the labour force clearly takes place in periods of favourable economic conditions.
A few studies of the potential of the group of persons outside the labour force have been made. The latest study is a calculation made by the Danish Confederation of Trade Unions based on register data that show that Danish men

21
between the ages of 25 and 54 have a participation rate below the OECD average. The Danish Confederation of Trade Unions conclude that – if the participation rate for this group is improved – so that Denmark is placed twice as high in the international comparison compared to now, the labour force will be expanded with 120,000 persons.
This study attempts to examine this type of general calculations and describes a number of characteristics of the group outside the labour force to reveal the real possibility of them entering into the labour force and into employment.
5.2 Who and how many
The ’quiet reserve’ is not a fixed and defined term and there is no unambiguous description of the group. This paper uses a definition/operationalisation of the term based on the statistics available.
The quarterly labour force surveys (LFS) carried out by Statistics Denmark divide the 15 to 66 year olds into three groups:
• The employed • The unemployed • Persons outside the labour force.
The quiet reserve is found in the group outside the labour force.
5.2.1 Persons outside the labour force
Persons outside the labour force 16 are persons who do not have a job and persons who are not unemployed according to the ILO definition (based on the following three criteria: they are not employed, they are actively looking for a job and they are available to start work within two weeks).
In the group of persons outside the labour force there are many who in practice can enter the labour market and find a job, as 30-40,000 thousand persons did every year in the 1990s.
We now attempt to take one step further than observing the historic development; we attempt to describe the potential of the group outside the labour force.
In 1999 nearly 780,000 15 to 66 age group was not part of the labour force. However, far from the majority of all these people can be integrated into the labour market.
A closer analysis shows that the persons outside the labour force may be divided into a number of sub-groups in relation to their status in relation to the labour market.17
16 The LFS is based on a survey, which asks respondents about their labour market attachment.
17 This status is their own assessment of their main occupation/what they mainly regard themselves to be.

22
Table 5.4 Persons outside the labour force divided into sub-groups Do you consider yourself: Number Per cent Unemployed 50,500 6.5 Outside the labour force/no occupation (e.g. housewife) 49,500 6.4 Voluntary early retiree and rehabilitated18 219,000 28.1 Student 200,500 25.7 On leave 24,000 3.1 Old-age pension and early retirement19 236,000 30.3 Total 779,500 100.0 Source: Statistics Denmark, LFS,1999
The existence of a group of people that consider themselves unemployed, but are still registered in the group outside the labour force, is due to the fact that they do not comply with the ILO definition of unemployed. They cannot start a job within two weeks or they have not actively been looking for employment.
5.2.2 The quiet reserve
In the identification of the quiet reserve there are two sets of criteria to be considered. First, the persons ascribed to the quiet reserve must be 'quiet' in the sense that they are not currently included in the potential available for the labour market. Second, the persons must be motivated or be able to be motivated to become employed when presented with job openings that they might fill.
Some of the people that outside the labour force according to the table above, are traditionally included in the group currently considered to be available for the labour market. Based on that it is irrelevant to include the unemployed and persons on leave and students as part of the quiet reserve.
The large group of unemployed included in this group of persons outside the labour force cannot be ascribed to the quiet reserve since the unemployed are already included in the potential available. The fact that among the unemployed there is a relatively large group that is not available for work, as they do not want a job, cf. the table below, primarily questions the size of the volume currently considered available.20
When it also seems irrelevant to include persons on leave and students, it is due to the fact that both these groups are temporarily without occupation (and are thus temporarily not included in the potential available) and will more or less automatically return to the labour force when their leave period ends or they finish their education.
Persons included in the quiet reserve must be motivated or be able to be motivated to enter the labour force/employment when presented with a job
18 ‘Førtidspension og revalidering’ in Danish.
19 ‘Alderspension og efterløn’ in Danish 20 This is a discussion that often appears when the unemployment figures from the LFS are compared with the figures
from e.g. The Register of Unemployment Statistics (CRAM)

23
opening. On this basis it is relevant to identify how many in the group outside the labour force are interested in a job. Based on this question the group can be divided into three segments:
• Those who want and are actively seeking employment (but cannot start work within two weeks)
• Those who want a job, but have not actively looked for employment21
• Those who do not want or look for a job
The table below shows how the persons outside the labour force are divided into the segments in relation to their motivation to work.
Table 5.6 Motivation to work What do you consider yourself: Want and is
looking for a job
Want a job, but is not looking
Do not want a job
Total
Unemployed 9,000 17,000 24,500 50,500 Outside the labour force/no occupation (e.g. housewife)
1,500 7,000 41,00022 49,500
Voluntary early retiree and rehabilitated23 2,000 13,000 204,000 219,000 Student 12,000 74,500 114,000 200,500 On leave 2,000 9,000 13,000 24,000 Recipient of old-age pension and early retirement benefit24
0 2,000 234,000 236,000
Total 26,500 122,500 606,000 779,500 Source: Statistics Denmark, LFS, 1999
When the two criteria are applied in the assessment of the size of the quiet reserve, it appears that the size is reduced considerably. The groups that clearly fall within the two criteria (those that wish to work or can be motivated to work and those not included in the current potential) have been emphasized in the table above with grey colour.
In addition to those emphasized in the table, it may be argued that part of the group "no occupation" may be motivated to work if presented with a relevant job opening even though they indicate that they do not want a job at present.
In this connection the persons currently with no occupation are thought to be more easily motivated to enter the labour market with a job if they have had a job on ordinary terms in the not too distant past.
This analysis has defined the period as two years, which means that it appears to be more realistic to motivate persons with no occupation to take a job, if they
21 Within the last four weeks of the interview date.
22 Of these 41,000 5,600 have stopped working less than two years ago, while 35,400 stopped working more than two years ago.
23 ‘Førtidspension og revalidering’ in Danish.
24 ‘Alderspension og efterløn’ in Danish

24
have been in employment in the past two years. It is not considered realistic to motivate them if they have never been employed or if it has been more than two years since they had a job.25
That leaves the following groups in the quiet reserve:
• Persons with no occupation26 looking for a job or who want a job. Persons with no occupation who do not want a job, but who has had a job in the last two years are included in this group. In total, this group consists of 14,100 persons (the group that does not want a job, but has had one in the past two years consists of 5,600 persons, cf. the note in the table above).
• Persons receiving voluntary early retirement and rehabilitation benefits that are looking for jobs/want jobs. In total, this group consists of 15,000 persons.
• Persons receiving old-age pension or early retirement benefit that are looking for jobs/want jobs. In total, this group consists of 2,000 persons.
• The quiet reserve consists of a minimum of approx. 31,000 persons.
It could be argued that other definitions could be identified. It could be claimed that all persons registered as having no occupation as such, in reality should be included in the quiet reserve, even though they were last employed more than two years ago.
Finally, it has been decided that the study should not include students in the quiet reserve. However, it is known that students with jobs play a significant role on the labour market and that more than 65 per cent of the students over the age of 15 (a total of more than 325,000 persons) have some kind of job while they study.27 They have not been included in the quiet reserve in this connection as they are already active and in time will more or less automatically enter the labour market.
5.3 Characteristics of the persons in the quiet reserve
The persons in the quiet reserve differ significantly in a number of areas from the persons who are part of the labour force.28
First, there is a heavy overrepresentation of women in the quiet reserve.
Women make up approx. 46 per cent of the labour force, but two thirds of the quiet reserves are women.29
Second, it is characteristic that the educational level is clearly lower among the persons in the quiet reserve than in the total labour force. 25 In this connection it can be discussed to what degree the demand side would be interested in employing labour that
has never been on the labour market or that has not been active on the labour market for more than two years.
26 Among others housewives, conscripts and persons who want to take sabbatical leave before or after a study programme.
27 Statistics Denmark, Labour Force Statistics (1998:21)
28 In relation to the age division there are no significant differences.
29 Statistics Denmark, Labour Force Survey

25
While less than 40 per cent of the people in the labour force do not have any formal, professional skills, the same apply to 50 per cent of the persons in the quiet reserve30, cf. the figure below.
Figure 5.1 Educational background in ‘the quiet reserve’
0
10
20
30
40
50
60
Quiet reserve Labour force
Per
cen
t UnskilledSkilled
Further education
Source: Statistics Denmark, LFS
Despite the lower educational level 50 per cent of the persons in the quiet reserve do have qualifications and nearly 20 per cent have received further education. This speaks in favour of a potential, which could contribute with a real supply of labour, which could be in demand.
Just as the educational basis is generally lower among persons in the quiet reserve, they do not have the same work experiences as people in the labour force. More than a third of the persons in the quiet reserve have stopped working three years or longer ago, 31 cf. the figure below.
Figure 5.2 Time of the latest job of the quiet reserve
7%
44%
16%
10%
23%
Has never workedWorked less than a year ago
1-2 years ago 3-4 years ago 5 years ago or longer
Source: Statistics Denmark, LFS
30 Statistics Denmark, Labour Force Survey and Statistical News, Labour Market 1999:36. Unanswered
have not been included.
31 Source: Statistics Denmark, LFS

26
There is no doubt that the persons in the quiet reserve do not have the resources of the persons in the labour force in general, that the educational level is generally lower and the work experiences are generally more obsolete.
Despite this, the persons in the quiet reserve have a number of resources to build on:
• 50 per cent of the persons in the quiet reserve have qualifications • Nearly 50 per cent had a job less than a year ago.
5.4 In conclusion - the quiet reserve and their potential to labour market capacity
The quiet reserve comprises a significant part of the annual additions to those in employment. Approx. 30-40,000 persons entered the labour market from a situation of no occupation at the end of the 1990s.
The total group with no occupation is very large and consists of approx. 780,000 persons. However, an in-depth analysis of the very large group with no occupation suggests that the quiet reserve is not as large as could be the immediate impression when the gross figures are examined.
When the groups registered elsewhere (the unemployed, those on leave and students) and those with a negative attitude towards employment are removed from the group, the large group with no occupation is reduced considerably.
So the quiet reserve only consists of approx. 31,000 persons or 4 per cent of the total group with no occupation.
However, there is some potential in the quiet reserve in relation to the aim of increasing the labour force with approx. 130,000 persons.
In addition, it is worth emphasizing that the persons in the quiet reserve have an age profile, which is generally characteristic of the persons in the labour force. Half are below 40. The ‘quiet reserve’ is not dominated by older people leaving the labour market. A large share of the quiet reserve is expected to wish to return to the labour market.
It is difficult to pinpoint what measures should be used. Even though this study has gone one step further in describing the persons in the quiet reserve, there is still a need to describe the different segments of people in the quiet reserve. That applies to identifying how many find a job for them selves and to identifying the wishes, opportunities and demands that the persons think could improve their job opportunities.
In general, there is an uncovered need for research that describes the quiet reserve further. It is clear that there is a need for differentiated measures for the different segments. For instance, it appears easier to integrate the groups who have job experiences in the past year, while the group of persons who have not had a job

27
within the past four to five years are much more difficult to integrate and here, other measures should be applied.
6. Dynamics, a thematic discussion
This part of the paper discusses the possibilities for changing some of the factors affecting working time.
We are focusing on the possibility of increasing the total working time, of making more people work longer, of making people currently working part-time work full-time or making more people work second jobs.
Selected international research on time and effects on the working time will be used as a basis for the discussion.
6.1 Dynamics of time and effects on the working time
Many countries have carried out ad-hoc surveys of the use of time, which provide indicators of what the real dynamics of the labour supply recorded statistically are.
In one of the most comprehensive attempts to create a coherent overview, Jonathan Gershuny32 has argued that there are three general convergence trends in the western nations' use of time in the last 35-40 years.
Looking at the relationship between paid an unpaid work on one hand and the amount of work in relation to time off, Gershuny finds empirical evidence that - with the exception of a few countries in the second half of the twentieth century - there have been three general convergence trends (which can also be identified in Denmark):
• Convergence in the use of time pattern from country to country (measured in 20 countries). There is an almost constant balance between the total amount paid and unpaid working time (55/45 per cent) and the general trend has moved towards an increase in time off. This trend has given rise to the idea of the 'leisure society'. Sociological studies show that the people living in the west wish to have more leisure time at the expense of working time, while expecting to maintain a high - and rising - level of consumption of goods and services. Many of these are expensive and time-consuming. Tension has been created between time spent on production and time spent on consumption. Changes in technology, productivity and increased use of self-service influence the nature and extent of the paid and unpaid work.
• Another convergence trend in the use of time is found between men and women. Women increase their share of paid work and reduce their share of unpaid work (a little), while men do the opposite. This applies to all the countries analysed. However, even though there is a trend towards
32 Jonathan Gershuny: Changing Times, Oxford, 2000

28
convergence between the use of time by men and women, women still have the largest share of unpaid work.
• The third convergence trend reflects a change in the use of time pattern between social groups. People in high-status jobs have, in contrast to the upper-classes of earlier times, tended to work longer hours and have less leisure time, while people in low-status jobs tend to work shorter hours and have relatively more leisure time. The explanation for this convergence is far from certain. One argument is that the criterion of what gives status is to be busy, i.e. to work long hours. At the same time, many of the activities previously carried out by the upper classes in their leisure time are part of the labour market activities today. Another argument is that the lifestyle aspired to by the higher social groups require an increasing income and hence an increase in paid work. On the other hand, the workers with monotonous and physically demanding work in many of the western countries (i.e. Europe) have had a political and organisational influence that has managed to limit working hours without discouraging a positive real-wage development.
These three convergence trends all refer to the fact that the central dynamics behind the supply of labour are connected to general societal and sociological factors.
Gershuny's convergence trends are found in Denmark, except from the fact that no analyses have been carried out to identify the different reasons that social groups have for working in differentiated working time patterns. So the development trends in Denmark and the majority of the other western countries do not differ greatly.
6.2 The socio-economic context
In relation to the general convergence trends there are some political and contextual issues that affect the supply of working time. This is revealed when international, comparative analyses of the correlation between working time, economic growth, development in income and socio-economic context are made.
On the international level, various development trends in working time have been identified in the past 35-40 years. The working time rate has increased significantly in the United States and has dropped/stagnated in Europe. There are different explanations to this difference.
The United States has experienced a massive decline in the average income of blue-collar workers since 1973,33 which has led to the an increase in the hours worked by the majority of the blue-collar workers because they wish to maintain the current standard of living and lifestyle. This has led to either an increase in hours worked, a decrease in time off, more overtime or/and holding more than one job.34
33 Barry Bluestone, ”Mainstreet versus WallStreet”, New York 2000
34 Juliet B. Schor, “The overworked American, The unexpected decline of leisure“, 1991, (p. 80)

29
The high rate of unemployment in the United States combined with the lack of social security systems has meant that there has been a massive incentive to look for more work and to accept employers' wishes and demands for a higher performance.35
The white-collar workers in the United States have not experienced a similar wage setback, but by far the majority of this share of the American labour market has experienced a modest wage development. 36 The motives behind the increased supply of labour offered by the white-collar workers are of a sociological nature and are based on a wish to maintain their middle-class status with an expensive lifestyle. So the middle-classes accept a model, which implies increased consumption, which in turn requires more work, and more work requires more services and leads to an increase in goods consumption, which in turn reduces the need for unpaid work in the home.
The background to the increase in the supply of working time in the United States has strong political and social dimensions.
Unlike European countries, there is no unionisation to speak of and there is no other collective opposition to a trend towards an increase in hours worked for large groups of the labour force.
In Europe, the government social and labour market policy systems and the collective agreement systems have defined the limits of the possible increases in working time. Here, the picture is quite the opposite: over a long period there has been a clear trend towards a reduction in the weekly and annual hours worked.
Only very recently have the economic feasibility of a continued reduction of working time and the relevance of reducing the supply of older groups of workers been questioned.
In countries such as France and Germany there have been reductions of the normal weekly hours worked to 35 hours or less as a result of policy decisions or collective agreements. Policy decisions have been based on arguments of an improvement in the distribution of the existing work in a period of high unemployment and in Europe, this has led to a development which is radically different from the one in the United States, particularly in the period after 1973.
6.3 Supply of labour by women
Regardless of the difference between the United States and Europe, there are some general trends and dynamics, which have showed an impact in most western countries. The most pronounced change in nearly all of the western countries in the past 35-40 years has been the increased female participation rate. This dynamic may be explained by a number of different sociological and political dynamics. It is also interesting to note that there are limits to the potential of this dynamic.
35 Barry Bluestone, 2000
36 Juliet B. Schor, 1991, p.81.

30
The process of democratisation, the equal opportunity initiatives and particularly the desire for financial independence by women have proved to be central dynamics behind the increased supply of work. It was made possible due to a massive demand for labour, not least in the service sector. In all western countries, this has led a massive increase in the supply of work in the last couple of decades, though there is significant difference in the extent and the point of time when this changed.
Several studies show that there are still contextual and institutional limitations in women's choice of lifestyle, including their working life. However, it is also clear that in many of the western countries, and not least the United States, the key factor behind the supply of labour by women is attitudinal. Preferences, motivation and ambitions influence women's wishes and behaviour.37
In the United States a number of surveys show that the majority of married women on the labour market (regardless of job status) consider themselves secondary to the family income. Men consider themselves (even in jobs and occupations similar to women) the primary source of family income. So there is an attitudinal and socialisation background to the behaviour identified.
It is important to underline that there is still discrimination towards women; that the labour market in many ways continues to be characterised by a male-dominated work culture and a lack of family-friendly personnel policies. That makes it difficult for many women to realise their wishes.
Furthermore, there are clear indications based on life story research emphasising that women's preferences change during a life cycle. There is no doubt that when assessing the dynamics influencing women's supply of labour and their wishes for changes in the extent and flexibility of working time, gender must be included as a determinant and not just a variable. This is no new fact, but it appears to be significant to keep this in mind if an attempt is to be made to increase women's supply of labour.
6.4 Lifestyle Factors
The results of the international studies mentioned indicate very clearly that the sociological and attitudinal factors must be examined, if the reasons for changes in the supply of labour are to be understood. The lifestyle study approach is a research approach that provides an opportunity to pursue this in a Danish context.
Generally, several studies point to the fact that Denmark is not a country characterised by career-oriented people who want to work more than they already do.
A Danish study has attempted to define a typology of Danes in relation to working life/job38. The typology is based on issues concerning the employed and 37 Catherine Hakim, Work-Lifestyle Choices in the 21st Century, Oxford University Press, 2000, p.275. 38 Nina Smith "Arbejde, incitamenter og ledighed" (Work, incentives and unemployment), Rockwool Foundation Research
Unit, 1998

31
their prioritisation of wages, colleagues, career opportunities, working time, work content, etc. The results of the study show that Danes want security more than anything else.
The study shows that by far the majority of the Danes, 46 per cent, are security-oriented. The characteristics of this group are that they give priority to good colleagues, that their job fits their skills and that they have job security. Only a quarter of Danes are career-oriented. This group is characterised by giving priority to the fact that their current job may lead to a higher and better-paid position, that they are free to plan their own work and that their job is challenging.
The remaining group, also a quarter, are the wage earners. This group is characterised by giving priority to a good wage, the material benefits of the job and the fact that they wish to work shorter hours.
In itself, the study does not provide an unambiguous picture of to what degree the Danes wish to work more or not, nor to what extent it is possible to increase the supply of labour.
The typology primarily shows Danes' attitude to work and the priorities Dane´s have in their jobs. The lifestyle study has to be linked to other studies to identify the possibilities of increasing the supply of labour by increasing the working time.
The lifestyle study does, however, point to some central elements in the Danish attitude to work, e.g. the fact that the majority of Danes do not regard the financial incentives of work as important as their relationship to colleagues and the general feeling of job security.
6.5 Do we want to work more than we do?
During the 1990s several survey-based studies of the Danes' attitudes to work, working time, and supply of labour were carried out.39
These studies show more or less concurrently that many Danes want to work less than they do at present. The surveys asked the respondents questions, which did not include consequences of changing their supply of labour (e.g. whether it would be possible to maintain their current job functions, etc.). They were only asked whether they would work fewer or more hours than at present if possible.
Particularly women want to work less than they do already40and therefore a total of
• 41 per cent of employed women want to work less than they do at present.
However, men also generally express a wish to work less and 39 Surveys reported in e.g.: Jens Bonke and Nanna Therese Meibak: "Danskere på fuldtid - deres faktiske og ønskede
arbejdstid (Danes working full-time - their actual and desired working time)", the National Institute of Social Research, 1999. "Kan det betale sig at arbejde?" (Does it pay to work?), Bent Jensen, 1999. "Arbejde, incitamenter og ledighed (Work, incentives and unemployment)", Nina Smith, 1998, "Beskæftiget - ledig - på efterløn (Employed - unemployed - retired)" Gunnar Viby Mogensen (ed),1998. "Hvad får os til at arbejde? (What makes us work?)", Lisbeth Pedersen and Niels Ploug, 1993 .
40 The following figures are found in "Arbejde, incitamenter og ledighed"(Work, incentives and unemployment), Nina Smith, 1998.

32
• 34 per cent of employed men want to work less than they do at present.
Particularly young people want to work less than they do and particularly those between the ages of 26 and 40 express a wish to work less.
The majority of both men and women are satisfied with their current supply of labour, and 58 per cent of men and 51 per cent of women would not change that if they could.
Only 8 per cent of both men and women want to work longer hours, and predominantly workers with very short work hours want to increase their supply labour.
Among women 30 per cent of the employed, who work less than 21 hours per week, want to work longer hours (on average they want to work 3 hours more per week). Among men 18-19 per cent of the employed with less than 37 hours' work per week want to work more (3 hours more for those with less than 21 hours per week and 1 hour more for those who work between 21 and 36 hours per week).
Their wish for a short working time is not realised primarily due to the fact that they cannot reach an agreement with their employer about it or the collective agreement hinders a reduction in their working hours.41
6.6 Motives for working part-time
The relatively high part-time rate in Denmark does not appear to be primarily due to a lack of ordinary full-time jobs. The latest figures show that only approx. 15 per cent of the part-timers work part-time because they could not find full-time employment. The share of involuntary part-timers is relatively low (on the level of the EU average, but clearly below Sweden and Finland, where 30 and 38 per cent of the part-timers work part-time involuntarily42). A number of qualitative studies also show that time is a scarce resource and that part-time employment for many is a means of uniting the conflicting demands of everyday life.43
A qualitative study shows that the motives for doing part-time work are to be found in family and personal interests. When the respondents were asked to explain their choice of part-time employment, they replied that they chose part-time employment due to family considerations and because they wanted time for other things than paid work. For some it is also a health issue: full-time employment would be too strenuous.
Other studies point to the fact that many mothers find it ideal that at least of one the parents work part-time44 and that affects the total labour supply of a family.
41 Nina Smith "Arbejde, incitamenter og ledighed (Work, incentives and unemployment) ", Rockwool Foundation
Research Unit 1998. 42 EUROSTAT: "Labour Force Survey", results 1999.
43 Benedicte Madsen and Mette Nayberg: "Hvornår vil vi arbejde? (When do we want to work?)", Rockwool Foundation Research Unit 1992.
44 Lisbeth Petersen and Niels Ploug "Hvad får os til at arbejde (What makes us work)" p.17, Rockwool Foundation Research Unit 1993.

33
• At first sight employed who are working part-time is a source of an increase in the labour supply, however studies show that a very large share of the part-time employed do not wish to increase their supply of work. Their employment makes allowances for other things that they give priority to in their life.
6.7 Motives for second jobs and overtime
Danes relatively often have second jobs compared with other countries internationally. Only very limited research has been made in this field to study motives and incentives, however, some studies have examined these issues.
A qualitative study from 1992 shows that the motives for taking second jobs range from purely economic motives to having an interest in a particular type of job, including the motive that a second job is a method of ensuring that special qualifications are maintained.45
Overtime is another way of increasing the labour supply. Several studies show that the extent of overtime is often linked to the general domestic economic developments. At the beginning of a financial boom the overtime rate will often rise46 because enterprises exploit the improvement by using the internal numerical flexibility (or intensity flexibility) before recruiting.
These observations are matched by qualitative studies, which often describe the motivation for working overtime as consideration for the workplace. Production requirements may necessitate overtime for periods of time (e.g. during a cyclical upswing). That makes readiness to take on overtime for some occupations a necessary factor in order to maintain a job (if you do not work overtime, you do not keep your job).
At the same time, the individual workplace often has a relatively informal distribution of overtime (to the extent that it is not determined by the nature of the tasks to be carried out) and in this distribution often the rationale of the individual workers determines who takes on overtime. Often reflections on economy and the opportunity to achieve some time off at another time are crucial factors in deciding to take on overtime.47
• Despite the fact that the average working week in Denmark is among the shortest in the European Union, there is no noticeable potential among the employed and the study shows that there is no professed wish among the employed to increase their supply of labour.
45 Benedicte Madsen and Mette Nayberg: "Hvornår vil vi arbejde?" (When do we want to work?), Rockwool Foundation
Research Unit 1992.
46 E.g. in Ron L. Hetrick "Analyzing the recent upward surge in overtime hours" in the Monthly Labor Review, February 2000 .
47 Benedicte Madsen and Mette Nayberg: "Hvornår vil vi arbejde?" (When do we want to work?), Rockwool Foundation Research Unit 1992.
34
6.8 Financial incentives of increasing the supply of work
The potential for increasing the supply of work by increasing the financial incentives of working more has been the subject of several studies48.
In a survey among employed they have focused on the issue of whether a cut in the marginal income tax rate of 5 per cent would increase the supply of work. The results of this survey again show that Danes do not wish to work more even if they were to gain financially from their performance.
Based on the survey responses there appear to be only limited or negative supply effects to a reduction of the marginal income tax rate. More than 60 per cent respond that a reduction of taxes would not affect their supply of work. In total, the replies are:
• 62 per cent expect not to want to change their supply of work if taxes are cut, • 15 per cent want to work more if the marginal income tax rate is cut, while • 19 per cent want to work less if the marginal income tax rate is cut.
Hence it appears that more people among the employed want to substitute some of their working time with time off if their financial situation is not reduced. The income effect thus appears to be more important than the substitution effect when people are asked.49
Particularly people with a small supply of labour would react to a reduction in the marginal income tax rate with an increase in their labour supply. Especially people who work between 1 and 20 hours per week would increase their supply of labour as a consequence of a reduction in the tax rate. Furthermore, among men in particular there is a group that wants to work more. Thus 48 per cent of men and 39 per cent of women with less than 21 hours of work per week would increase their supply of labour, while only 17 per cent of men and 8 per cent of women working 37 hours per week would increase their supply of work if the marginal income tax rate were reduced.
There is a relatively significant occupational difference of the reaction pattern to a tax cut. The figure below clearly shows that - regardless of occupation - the majority do not wish to change their supply of labour as a consequence of a marginal income tax cut. Only in two occupations there are more people expressing a wish to increase their supply of work than a wish to reduce the supply. In the category "self-employed" there are 15 per cent who want to work more and 14 per cent who want to work less and among "other wage earners" 22 per cent want to work more and 13 per cent want to work less.
48 The Rockwool Foundation Research Unit has in 1990s contributed a great deal of research, which examines issues
affecting the supply of work from various angles. 49 Nina Smith "Arbejde, incitamenter og ledighed"(Work, incentives and unemployment), Rockwool Foundation Research
Unit, 1998

35
Figure 6.1 Expected change in supply of work if tax rate is cut (1996)
0%
20%
40%
60%
80%
100%
Sel
f-em
ploy
ed
Exe
cutiv
ew
hite
-col
lar
wor
kers
Whi
te-c
olla
rw
orke
rs in
man
agem
ent
Oth
er w
hite
-co
llar
wor
kers
Ski
lled
wor
kers
Uns
kille
dw
orke
rs
Oth
er w
age
earn
ers
Work more
The same
Work less
Source: Nina Smith "Arbejde, incitamenter og ledighed" (Work, incentives and unemployment), Rockwool Foundation Research Unit, 1998.
Among the executive white-collar workers there would hardly be any effect on the supply of labour following a tax cut. In this group the share of people who would reduce their supply of labour (12 per cent) is the same size as the share that would increase their supply.
Among the white-collar workers in management, other white-collar workers, skilled and unskilled workers a tax cut would generally lead to a reduction in the supply of work, as a significantly higher number of people in these groups would reduce their supply of labour than would increase it.
• In total, this survey indicates that the supply of work would tend to drop if the marginal income tax rate were reduced further. It is highly probable that the supply of work would decline for the groups of white-collar workers in management, other white-collar workers, skilled and unskilled workers.50
Another study describes the correlation between wages, tax rates and the supply of work.51 This study examines three time spheres, leisure time, paid work and unpaid (domestic) work and also studies the effect of wages and taxes on the individual's prioritisation of time between the three groups.
The income effect and the substitution effect influences the socio-economic groups on the labour market differently.
The study indicates that wage and tax pressures are important in the allocation of time, but that the effects can vary greatly between different groups, men and women, and married and single persons:
50 Peder J. Pedersen et al. "Beskæftiget – ledig – på efterløn " (Employed - unemployed -retired), Rockwool Foundation
Research Unit, 1998
51 Jens Bonke "Arbejde, tid og køn i udvalgte lande" (Work, time and sex in selected countries), SFI 1995.

36
• What is most important differs (financial or non-financial incentives) - and how it affects the supply of work in various groups: men, women, young people older people, people with or without children, etc. also differs.
• When the respondents are asked what they give high priority in their working life, their replies differ from the findings of econometric studies of the supply of work. For instance, women reply that they do not prioritise a high level of wages, but the findings of econometric studies indicate that the actual supply of labour is greatly affected by changes in wages.
Another way of assessing whether the supply of work is affected by adjustments of the tax system is via econometric models. A more varied picture of the supply flexibility (i.e. the effect of a tax cut) is presented when econometric calculations of the correlation between tax reforms and work supply are carried out.
In general, the calculations indicate that a reduction of the marginal income tax rate would tend to increase the supply of work, particularly for the low-income groups.52
The general conclusion to the studies described above of the correlation between tax reductions and supply of work is that
"Potential reductions of the income tax for all income groups would primarily lead to an increase in the supply of labour for people, who do not already work long hours, while they would lead to a reduction of the supply of labour for people who work long hours per week".53
At the same time, calculations of the consequences of various types of taxation indicate that a tax reform introducing an employment allowance (giving low-paid workers incentives to work) would increase the amount of people in employment, however, it would only increase the total supply of labour marginally (one model actually shows a reduction of the supply of labour).
In more or less the same way others reach the following conclusion on the potential for increasing the supply of work through tax reforms,
'In general, it can be said that the research in the field basically finds that in this country the effects of taxation and transfer income on the supply of labour are relatively limited.54
Pedersen and Ploug go further and conclude that
'… the non-financial incentives appear to have a significant effect on the supply of work' .
52 Peder J. Pedersen m. fl. "Beskæftiget – ledig – på efterløn "(Employed - unemployed -retired), Rockwool Foundation
Research Unit 1998, p.84.
53 Nina Smith: "Arbejde, incitamenter og ledighed" (Work, incentives and unemployment) p. 232. Rockwool Foundation Research Unit, 1998
54 Lisbeth Petersen and Niels Ploug "Hvad får os til at arbejde"(What makes us work), p.17 . Rockwool Foundation
Research Unit, 1993.

37
7. Conclusions
In examining the case of Denmark we have been able to show the importance of using a broad, sociological approach in order to understand what factors influence the trend in labour market capacity.
We found that the Danish Phillips curve did behave strangely in the 90s.
We argued that there seems to be a number of reasons for this.
First, there seems to have been an effect of the social dialogue. There were some wage restrictions due to a strong performance by the unions. Even if the process of collective bargaining agreements tended to lose some power to the decentralised negotiations at company level, nominal wage increases were moderate, but still high enough to leave room for net real income increases in the 90s for the average wage and salary earner.
Second, the ALMP did have some moderate success when it came to reducing the long-term and youth unemployment. However, the different paid-leave schemes and early retirement schemes presented a dangerous capacity policy in the 90s, reducing the potential labour supply.
Third, the total hours actually worked were relative stabile in the 90s and actually increased in the last years of the 90s by 6.9 pct. This was due to
• No reduction in the agreed working time in the collective bargaining agreements
• More unemployed becoming employed • More people working overtime • Less people working part-time - part-time employed turned full-time
employed • More people entering the labour force from the ‘quiet reserve’ (inflow into
the labour market from a section of the group ‘not in labour force’) • All in all, the 90s in Denmark is a case of a successful balancing act that
turned out to deliver growth in employment, increasing income and high flexibility on the Danish labour market.
7.1 Capacity problems ahead
However, the balancing act of the 90s seems not to be sustainable in the coming decade. This is primarily due to the fact that the labour market reserves seem to be depleted.
First of all, the demographic trend is that of a greyer labour market, - fewer young people will be entering the labour force and the average age of the labour force is increasing. Many older workers are expected to leave the labour market for early retirement thus creating the need for qualified workers in still more jobs and

38
professions. The risk of bottlenecks on the labour market is growing, creating a situation where one may expect increasing wage pressure.
Our examination of what motivates people in Denmark to work reveals a picture of a complex set of sociological factors in action. Generally, the results of many surveys tend to point in the direction that people do not want to work more hours. That seems also to be valid even if a tax-reduction is suggested. On the contrary, still more people want to retire early and pay more interest to their family life. In addition to that the unions have succeeded in negotiating the sixth week of holidays taking effect in the next two years.
Furthermore, the present low level of unemployment does not make it feasible to expect the unemployed left will actually work as active labour market reserves. The measured unemployment consists of two distinct groups. On the one hand many short-term unemployed that are in the process of changing jobs (frictional unemployment) and on the other hand a so-called ‘residual group’ of long-term unemployed with heavy employability problems. Many in this group of long-term unemployed are immigrants and refugees from third-world countries that have very limited resources and are often facing discrimination when looking for work.
Our analysis of the inflow into the labour force from the ‘quiet reserve’ was very thorough and left little room for expecting a major reserve just waiting for better times before entering the labour market. The large majority of the group ‘not in labour force’ must be expected never to become an active labour market reserve. The only major labour market potential in the group ‘not in the labour force’ is the immigrants.
The major challenge facing the ALMP in Denmark is the need to modernize the programmes and incentives once again. This time to a future where the problems of meeting the demands for skilled labour and labour with specific skills related to the new economy are greater than the problems of combating long-term unemployment in the 90s. Thus the future focus of ALMP should not be on combating long-term unemployment, but on how to increase the size of the labour force and enhancing the qualifications of the labour force within the framework of the new economy.
This includes55 • Getting the non-active part of the population mobilized and motivated for
entering the labour force • Integrating immigrants into all parts of the labour market by fighting
discrimination • Establishing a structure on the labour market that will increase the
possibilities for older workers to find flexible, part-time employment. • Reducing the absenteeism and improving the quality of the working life • Reforming the unemployment insurance benefit system in order to adapt it to
a labour market with more free agents and more self-employed people.
55 The Danish federation of Trade Unions (2001)
39
In the case of a new recession, Denmark is in danger of encountering heavy ‘mismatch’ problems on the labour market; i.e. increasing long-term unemployment of low qualified labour co-existing with increasing demand for specialized qualified labour.
This will also lead to a need for a modernization of the ALMP, much along the lines already discussed, but the ALMP must also take the problems related to the long-term unemployment into account. This will be a real challenge for the future ALMP in the welfare regime of Denmark.
7.2 Answers to our two key research questions
We started this paper with two key research questions:
• What factors influence the trend in labour market capacity over time within a country and across countries?
• What is the most appropriate concept of labour market capacity?
Based on the argument in this paper there is no doubt that in order to understand the factors that influence the labour market capacity we need to pay attention to the sociological factors behind the rough statistics.
It is important to harmonise our understanding of how to measure hours actually worked, just as Bluestone and others suggest, but when it comes to potential hours worked, we need to include other factor. Based on the Danish case study:
• We need to include considerations on the impact of labour-management relations on wage and salary development
• We need to consider the effectiveness of ALMP on the labour market capacity.
• We also need to include more qualitative and international comparative research on what motivates people to take on paid work.
When it comes to the most appropriate concept of labour market capacity, the Danish case study highlights a situation going from nearly maximum capacity utilization to a situation of a potentially too small labour market capacity.
The fact that the labour market reserves might be depleted in a national economy must be included in our consideration of a proper concept. This conclusion also has relevance for the notion of wellbeing.
Our case study underlines the need for paying specific attention to the ability of national labour markets to handle the immigration balance, as this is the major way to correct for a general lack of labour. This finding seems to be of major relevance for our project.
Thus, when discussing what might be the most appropriate concept of labour market capacity, we must include the aspects of immigration.

40
8. Literature
Bonke, Jens: "Arbejde, tid og køn i udvalgte lande" (Work, time and gender in selected countries), The National Institute of Social Research 1995.
Bonke, Jens and Nanna Therese Meibak: "Danskere på fuldtid - deres faktiske og ønskede arbejdstid" (Danes working full-time - their actual and desired working time), The National Institute of Social Research, 1999.
Bowlus, Audra J.: "A Panel Data Analysis of the US-Canadian Non-Employment Rate Gap among Young, Low Skilled Males". Canadian Public Policy, February 1998, pp. 192-209.
Bluestone, Barry: The U.S. Growth Model and Social Inequality. Paper presented at the Fifth Biennial Conference, Lyon, November 1998.
Bluestone, Barry: Sabotaging Prosperity: The New Political Economy of Growth and Equity. New York, 1999.
Bluestone, Barry: "Mainstreet versus WallStreet", New York, 2000
Commission of the European Communities: Report on Employment Frequency 1998. Employment Rate Development in the Member States. Commission of the European Communities, October 1998.
Council of Chief Economic Advisers, the: "Er økonomien på nye veje" (Is the economy taking new paths). Report from the Council, Spring 1998.
EUROSTAT: "Labour Force Survey", results, various years.
Fitoussi, Jean-Paul et al.: "A Manifesto on Unemployment in the European Union". Unpublished, 1999.
Ford Foundation: "Understanding Unemployment and Working Time: A Cross-Country Comparative Study", 1997-2000.
Gershuny, Jonathan "Changing times", Oxford 2000
Hakim, Catherine "Work-Lifestyle Choices in the 21st Century", Oxford University Press, 2000
Hetrick, Ron L. "Analyzing the recent upward surge in overtime hours" in the Monthly Labour Review, February 2000.
Jensen, Bent "Kan det betale sig at arbejde?" (Does it pay to work?), Rockwool Foundation Research Unit, Spektrum, 1999.
Larsen, Mona and Klaus Langager: "Arbejdsmarkedsreformen og arbejdsmarkedet. Evaluering af arbejdsmarkedsreformen III" (Labour Market Reform and the Labour Market. Evaluation of the Labour Market Reform III), The National Institute of Social Research, 1998:13.
Madsen, Benedicte and Mette Nayberg: "Hvornår vil vi arbejde?" (When do we want to work?), Rockwool Foundation Research Unit, 1992.

41
Ministry of Labour, Arbejdsmarkedsreformerne – et statusbillede (The labour market reforms - a status). The Ministry of Labour, May 1999.
Ministry of Labour, Arbejdsmarkedspolitisk rapport 1996 (Labour market policy report 1996). Ministry of Labour, September 1996.
Ministry of Labour and the Ministry of Economics, The Danish Government: Danmarks nationale handlingsplan for beskæftigelse 1999 (The Danish national action plan for employment 1999). Ministry of Labour and the Ministry of Economics, June 1999.
Mogensen, Gunnar Viby (ed.) with contributions from Peder J. Pedersen, Søren Pedersen and Nina Smith: "Beskæftiget - ledig - på efterløn" (Employed - unemployed - retired). Spektrum, 1998
OECD, Employment Outlook, June 1998.
Pedersen, Peder J. et al: "Beskæftiget – ledig – på efterløn"(Employed - unemployed - retired), Rockwool Foundation Research Unit 1998
Petersen, Lisbeth and Niels Ploug "Hvad får os til at arbejde" (What makes us work?). Rockwool Foundation Research Unit, 1993.
Schor, Juliet B. "The overworked American, the unexpected decline of leisure,"1991
Simonsen, Birgitte and Noemi Katznelson "Unges arbejdsbegreb" (Young people's concept of work) in the journal Arbejdsliv (Working Life), vol. 4, 2000.
Smith, Nina "Arbejde, incitamenter og ledighed"(Work, incentives and unemployment), Rockwool Foundation Research Unit 1998.
Smith, Nina (ed.) with contributions from Peter Jensen, Peder J. Pedersen and Søren Pedersen: "Arbejde, incitamenter og ledighed" (Work, incentives and unemployment), Aarhus Universitetsforlag, 1998
Sorrentino, Constance: "International unemployment rates: how comparable are they?" Monthly Labour Review, June 2000, BLS, 2000
Statistics Denmark, Statistical Information
Zeuner, Lilli: "Unge mellem egne mål og fællesskab" (Young people - goals and community), The National Institute of Social Research, 2000.


![Case: Danish Crown Denmark [EN]](https://static.fdocuments.in/doc/165x107/568ca9a11a28ab186d9e49a6/case-danish-crown-denmark-en.jpg)


![Case: Danish Crown Holsted [DA]](https://static.fdocuments.in/doc/165x107/568ca96f1a28ab186d9d7a51/case-danish-crown-holsted-da.jpg)