Labour and Social Trends in Indonesia 2009 - ilo.org fileconcerning the legal status of any country,...
60
International Labour Organization ILO Office for Indonesia Labour and Social Trends in Indonesia 2009 Recovery and beyond through decent work
Transcript of Labour and Social Trends in Indonesia 2009 - ilo.org fileconcerning the legal status of any country,...
International Labour OrganizationILO Office for Indonesia
Labour and Social Trends in Indonesia 2009Recovery and beyond through decent work
ii
Copyright © International Labour Organization 2009First published 2009
Publications of the International Labour Offi ce enjoy copyright under Protocol 2 of the Universal Copyright Convention. Nevertheless, short excerpts from them may be reproduced without authorization, on condition that the source is indicated. For rights of reproduction or translation, application should be made to ILO Publications (Rights and Permissions), International Labour Offi ce, CH-1211 Geneva 22, Switzerland, or by email: [email protected]. The International Labour Offi ce welcomes such applications.
Libraries, institutions and other users registered with reproduction rights organizations may make copies in accordance with the licences issued to them for this purpose. Visit www.ifrro.org to fi nd the reproduction rights organization in your country.
ISBN 978-92-2-022753-4 (print)ISBN 978-92-2-022754-1 (web pdf)
ILOLabour and social trends in Indonesia 2009: recovery and beyond through decent work / International Labour Offi ce – Jakarta: ILO, 2009vi, 54 p.
Also available in Bahasa Indonesia: Tren ketenagakerjaan dan sosial di Indonesia 2009: pemulihan dan langkah-langkah selanjutnya melalui pekerjaan yang layak / Kantor Perburuhan Internasional – Jakarta: ILO, 2009vi, 59 p
ILO Cataloguing in Publication Data
The designations employed in ILO publications, which are in conformity with United Nations practice, and the presentation of material therein do not imply the expression of any opinion whatsoever on the part of the International Labour Offi ce concerning the legal status of any country, area or territory or of its authorities, or concerning the delimitation of its frontiers.
The responsibility for opinions expressed in signed articles, studies and other contributions rests solely with their authors, and publication does not constitute an endorsement by the International Labour Offi ce of the opinions expressed in them.
Reference to names of fi rms and commercial products and processes does not imply their endorsement by the International Labour Offi ce, and any failure to mention a particular fi rm, commercial product or process is not a sign of disapproval.
ILO publications and electronic products can be obtained through major booksellers or ILO local offi ces in many countries, or direct from ILO Publications, International Labour Offi ce, CH-1211 Geneva 22, Switzerland. Catalogues or lists of new publications are available free of charge from the above address, or by email: [email protected]
Visit our website: www.ilo.org/publns
Printed in Indonesia
Foreword
The second issue of the Labour and Social Trends in Indonesia report analyses the impact of the global fi nancial, economic and jobs crisis on Indonesia’s labour market and draws attention to some key policy challenges posed by the crisis. In many respects, Indonesia has weathered the crisis better, in relative terms, than many countries around Asia and across the world. Nonetheless, it has not escaped the crisis. We are, for example, already seeing an expansion in informal employment, where earnings and productivity are low, there is little or no social protection, and channels for representation and voice are limited. The impact of the crisis is manifesting itself in Indonesia not in a quantitative decline in employment, but rather in the deterioration of employment quality.
At the same time, the crisis provides an opportunity to undertake necessary reforms not only as immediate crisis responses but also for other, longer-term needs. Building on last year’s report, the present report also examines some of the key opportunities and challenges present in Indonesia’s labour market even before the crisis. Such an analysis is aimed at informing the development and implementation of the next Medium Term Development Plan (2010–2014) and the roadmap for achieving the Millennium Development Goals (MDGs).
The report was produced by Kazutoshi Chatani and Kee Beom Kim. It draws in part on a working paper co-authored by one of the authors of this report.1 The report benefi ted substantially from technical support and valuable comments provided by ILO Jakarta colleagues; the Regional Economic and Social Analysis Unit of the ILO Regional Offi ce for Asia and the Pacifi c; and ILO Headquarters in Geneva.
We hope that the report will contribute to informing both a recovery path and Indonesia’s sustainable and inclusive development, based on decent work.
Alan BoultonDirectorILO Jakarta Offi ce
iii
1 P. Huynh, S. Kapsos, K. B. Kim and G. Sziraczki : “Impacts of the Current Global Economic Crisis on Asia’s Labour market”, Asian Development Bank Institute Working Paper (ADBI, forthcoming).

List of Acronyms and Indonesian Terms
ADB Asian Development BankApindo Asociasi Pengusaha Indonesia (The Employers’ Association of Indonesia )
ASEAN Association of Southeast Asian NationsBAPPENAS Badan Perencanaan Pembangunan Nasional (National Development Planning Agency)
BI Bank Indonesia
BNP2TKI Badan Nasional Penempatan dan Perlindungan Tenaga Kerja Indonesia (National Agency for the Placement and Protection of Indonesian Overseas Workers)BOS Bantuan Operasional Sekolah (School Operational Assistance Programme)BPS Badan Pusat Statistik (Statistics Indonesia)EB Equipment-basedEU European UnionGDP Gross Domestic Product ILO International Labour Organization IMF International Monetary FundJamsostek Jaminan Sosial Tenaga Kerja (National Social Insurance Fund)KADIN Kamar Dagang Dan Industri Indonesia (The Indonesian Chambers of Commerce and Industry)KILM Key Indicators of the Labour MarketLFS Labour Force SurveyLRB Local resource-basedMDG Millennium Development GoalOAW Own-account worker
OECD Organisation for Economic Co-operation and DevelopmentPNPM Program Nasional Pemberdayaan Masyarakat( National Programme for Community Empowerment)PPP Purchasing power parityRp. Rupiah
SMEs Small and medium enterprises
UN United Nations
UNESCO United Nations Educational, Scientifi c and Cultural Organization
Note: Throughout the report the following exchange rate is applied: 1 USD=Rp. 10,000
iv
Contents
Foreword iiiList of Acronyms and Indonesian Terms ivOverview 1 1. Trends in the labour market 51.1 Economic trends 51.2 Labour market impacts of the global crisis 71.3 Vulnerable groups 121.4 A protracted recovery in the labour market 151.5 Policy responses 181.6 Policy implications 21 2. Beyond the crisis: Strengthening the foundations for job-rich development 272.1 A social fl oor 272.2 Structural shifts in employment 322.3 Improving workforce quality 362.4 Ensuring gender equality 392.5 Greening the economy for sustainable development and job creation 42 Annex I BPS disaggregation of employment in the formal and informal economy 43Annex II Statistical appendix 44 List of Tables 1.1 Economic growth forecasts (as of 25 May 2009) 51.2 Percentage Distribution of Gross Domestic Product at Current Market Prices 61.3 Trends in employment status, 2008–2009 91.4 Employment by sector and gender, 1997–1998 181.5 Components of the stimulus package 192.1 Share of informal employment by gender 282.2 Distribution of working poor by sector, geographical area and gender 312.3 Growth rate and shares in GDP by sector 332.4 Key education indicators 372.5 Share of labour force by age group and educational attainment 392.6 Labour force participation rates 402.7 Female wage as percentage of male counterpart by main occupation 402.8 MDG Target 1b 41
v
List of Figures 1.1 Infl ation and interest rates 61.2 Unemployment rate, 2005–2009 81.3 Employment by status, 1997–2007 161.4 Output per worker (1990 USD), Thailand and Indonesia, 1993–2003 172.1 Share in employment by status in employment 292.2 Incidence of working poor by employment status 322.3 Employment-to-population ratio 332.4 Changes in share of total employment 342.5 Output and employment growth 352.6 Hourly nominal wages by educational attainment 382.7 Energy use effi ciency 42 List of Text Boxes 1.1 Impact of the crisis on informal workers: Cases from Jakarta 91.2 Investing for the recovery: Workers and productivity 111.3 Indonesian overseas migrant workers 121.4 Human stories: Returned overseas migrant workers 131.5 Labour market response during the Asian fi nancial crisis 171.6 Employment-intensive approaches to infrastructure development 191.7 A Global Jobs Pact 242.1 Flexicurity 292.2 Social Protection in Indonesia: A glimpse 302.3 The working poor in Indonesia 312.4 Sectoral approaches to employment 352.5 MDG Target 1b 41
vi

The fi rst part of the report examines key economic trends, the impacts of the current global economic crisis on the labour market and on vulnerable groups, the likely protracted recovery of the labour market and the policy responses and implications.
Indonesia’s economy has continued to grow despite the crisis, achieving 6.1 per cent growth in 2008. The economy has been cushioned by, among other factors, strengthened macroeconomic management and oversight of the fi nancial sector; the large share of household consumption in GDP compared to exports; and the boost to domestic consumption brought by the 2009 legislative and presidential elections.
Although growth has slowed in 2009, it is nevertheless expected to reach 3 to 5 percent. However, this subdued expansion may not be suffi cient to absorb all the new entrants to the labour force.
The crisis has impacted Indonesia most severely through falling exports, with oil and gas exports declining by 55.4 per cent and manufactured goods by 26.9 per cent. While investment has continued, credit availability for SMEs has been restricted due to conservative sentiment in the lending sector. Given the important role of SMEs in the labour market, this could hamper a stronger economic rebound and labour absorption.
Slowing economic growth has prompted a steep fall in the growth of wage employment, which grew just 1.4 percent between February 2008 and February 2009, compared to 6.1 percent in the previous period. The global crisis has also resulted in widespread job losses, with subcontracted, casual and temporary workers in export-orientated industries being hardest hit. However, the downward trending unemployment rate suggests that many of the displaced workers have been absorbed into other jobs, including in the informal economy, which has seen a marked expansion, in contrast to previous years. This growth of employment in the informal economy has been the most signifi cant impact of the crisis on Indonesia’s labour market.
Overview
1
Labour and Social Trends in Indonesia 2009
The crisis has increased vulnerability for many in the labour market. With a large number of persons clustered around the poverty line, even small impacts on incomes can drive some households into poverty, forcing them to cut back on long-term investments such as education. Overseas migrant workers are also facing increasing vulnerability as they are often the most expendable in times of crisis. Some destination countries have reduced their quotas for foreign workers, while many of those already abroad have been laid off. Youth employment is also likely to have been severely hit by the crisis. Women, who are already at a disadvantage in the labour market, are in some cases increasingly under pressure to shoulder the double burden of family care and income generating activities to compensate for men’s reduced wages.
While urban labour markets have been the most severely affected, the loss of jobs has also prompted a reverse migration to rural areas, where many of the returnees are likely to be engaged in the informal economy.
The global recession is showing early signs of bottoming out. However, the consequences for Indonesia’s labour market may be protracted; following the Asian fi nancial crisis of 1997-98, it took several years for indicators such as unemployment, productivity, poverty and numbers of workers in vulnerable employment to return to pre-crisis levels.
Indonesia’s government has responded rapidly and strongly with a USD 7.3 billion stimulus package aimed at boosting aggregate demand. However, the bulk of this is in the form of tax rebates, which, given Indonesia’s large informal economy, may have limited reach. The government has also invested in labour-intensive infrastructure development, poverty alleviation and in programmes to improve labour skills and competitiveness, as well as measures to green the economy.
The trends outlined above highlight a number of policy implications, including the need to place decent and productive jobs at the centre of the crisis response: the critical need for unemployment insurance, especially for those who do not quite qualify for social assistance schemes for the poor; and the need for social dialogue between the tripartite partners in designing policy responses. The crisis has also highlighted the importance of labour market information and statistics in detecting early signs of change and informing appropriate policy responses.
The second part of the report looks beyond the crisis to examining how the foundations for job-rich development can be strengthened—by establishing a social fl oor, assessing the structural shifts that have taken place in employment, improving the quality of the workforce, ensuring gender equality and ensuring that job creation is pursued in parallel with sustainable development.
The crisis has highlighted the need for a social protection fl oor that includes improved access to employment opportunities; basic health care;
2
Labour and Social Trends in Indonesia 2009
protection and education for children, the elderly and people with disabilities; and social assistance for the poor, the unemployed and those engaged in the informal economy. The 2004 National Social Security System Law represents progress but is still awaiting implementation.
Strong economic growth between 2004 and 2008 allowed employment growth to surpass labour force growth. The same period also saw a signifi cant drop in youth unemployment, partly as a result of increased enrolment in secondary and tertiary education. The economic expansion was supported in particular by service sector growth, which now employs the majority of Indonesia’s population.
This shift to higher productivity, value-added activities—which can drive poverty reduction and higher living standards—highlights the need for investment in agriculture to boost productivity in this sector as well. This in turn will call for investment in high-growth-potential industries to absorb excess agricultural labour, as well as investment in training and skills development to facilitate labour mobility across sectors.
Education and training play a critical role in preparing the workforce to effectively adjust to structural shifts, changing technologies and volatile economic landscapes. Although the primary net enrolment rate now exceeds 95 per cent, at secondary level it is only 59 per cent and only 6.5 per cent attain any tertiary education. Rising returns to education could provide an incentive to stay in school: the wage ratio between workers with a primary education and those with a degree was 1 to 4.4 in 2008. However, educational quality is still a key concern. Better collaboration between government, social partners, educational institutions and training providers would ensure a better match between workers’ skills and jobs.
Signifi cant progress has been made in the last fi ve years towards gender equality in terms of labour market participation, employment and wages. Female employment grew by 16.6 per cent between 2004 and 2008, supported by the growth in the service sector and progress in women’s educational attainment, among others. Gender wage gaps narrowed between 2004 and 2008 in most sectors, but widened in others (professional, technical and related workers). While women in administrative and managerial jobs are now actually earning more than their male counterparts, they are still under-represented at the managerial level. However, continued support is required to ensure equal opportunities to access education and training, labour markets and benefi ts.
In the long term, the sustainability of Indonesia’s development will depend on the country’s ability to protect its diverse environment and effectively address the challenges posed by climate change. There is still considerable scope for improvement in terms of energy use effi ciency. This will not only conserve resources but also reduce vulnerability to commodity price volatility and provide opportunities to create “green” jobs. Achieving the transition to a green economy, however, will require
3

Labour and Social Trends in Indonesia 2009
4
investment in skills development and new technologies as well as tripartite dialogue and action.
1.1 Economic trends
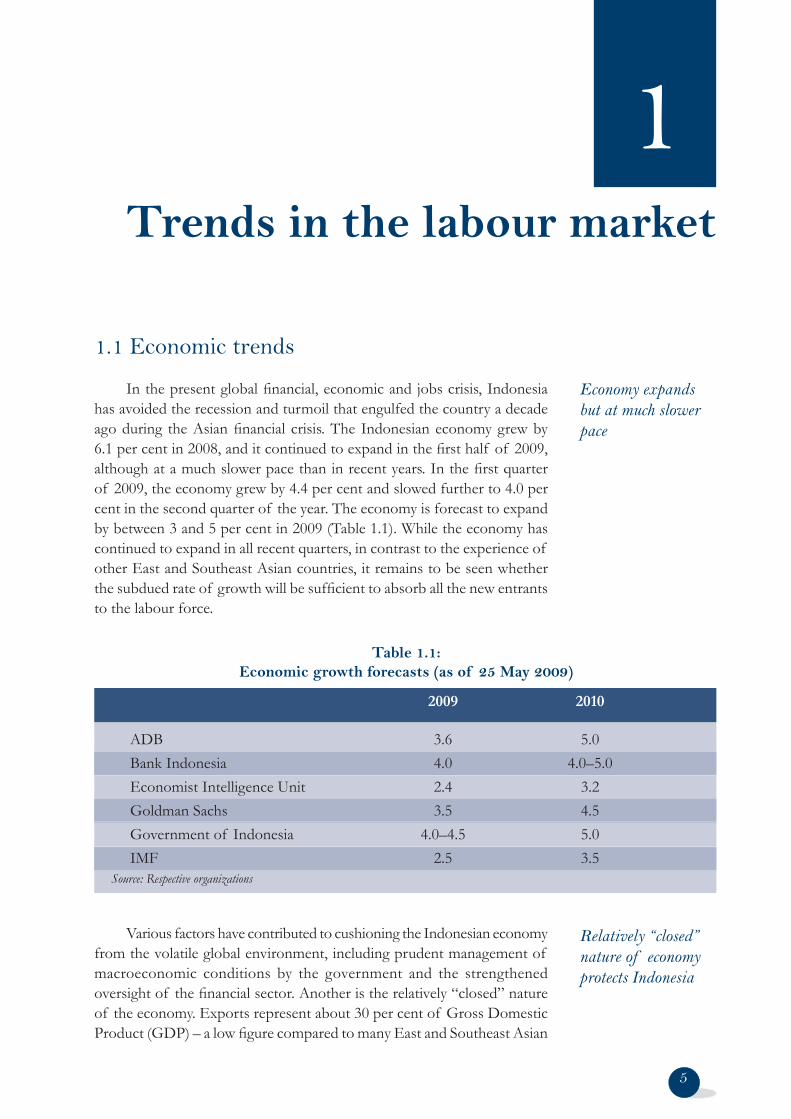
In the present global fi nancial, economic and jobs crisis, Indonesia has avoided the recession and turmoil that engulfed the country a decade ago during the Asian fi nancial crisis. The Indonesian economy grew by 6.1 per cent in 2008, and it continued to expand in the fi rst half of 2009, although at a much slower pace than in recent years. In the fi rst quarter of 2009, the economy grew by 4.4 per cent and slowed further to 4.0 per cent in the second quarter of the year. The economy is forecast to expand by between 3 and 5 per cent in 2009 (Table 1.1). While the economy has continued to expand in all recent quarters, in contrast to the experience of other East and Southeast Asian countries, it remains to be seen whether the subdued rate of growth will be suffi cient to absorb all the new entrants to the labour force.
Trends in the labour market
1
Economy expands but at much slower pace
Various factors have contributed to cushioning the Indonesian economy from the volatile global environment, including prudent management of macroeconomic conditions by the government and the strengthened oversight of the fi nancial sector. Another is the relatively “closed” nature of the economy. Exports represent about 30 per cent of Gross Domestic Product (GDP) – a low fi gure compared to many East and Southeast Asian
Relatively “closed” nature of economy protects Indonesia
5
Table 1.1: Economic growth forecasts (as of 25 May 2009)
2009 2010
ADB 3.6 5.0 Bank Indonesia 4.0 4.0–5.0Economist Intelligence Unit 2.4 3.2 Goldman Sachs 3.5 4.5 Government of Indonesia 4.0–4.5 5.0 IMF 2.5 3.5
Source: Respective organizations
Labour and Social Trends in Indonesia 2009
economies. With a population of over 225 million, household consumption, on the other hand, accounts for about 60 per cent of GDP (Table 1.2).
6
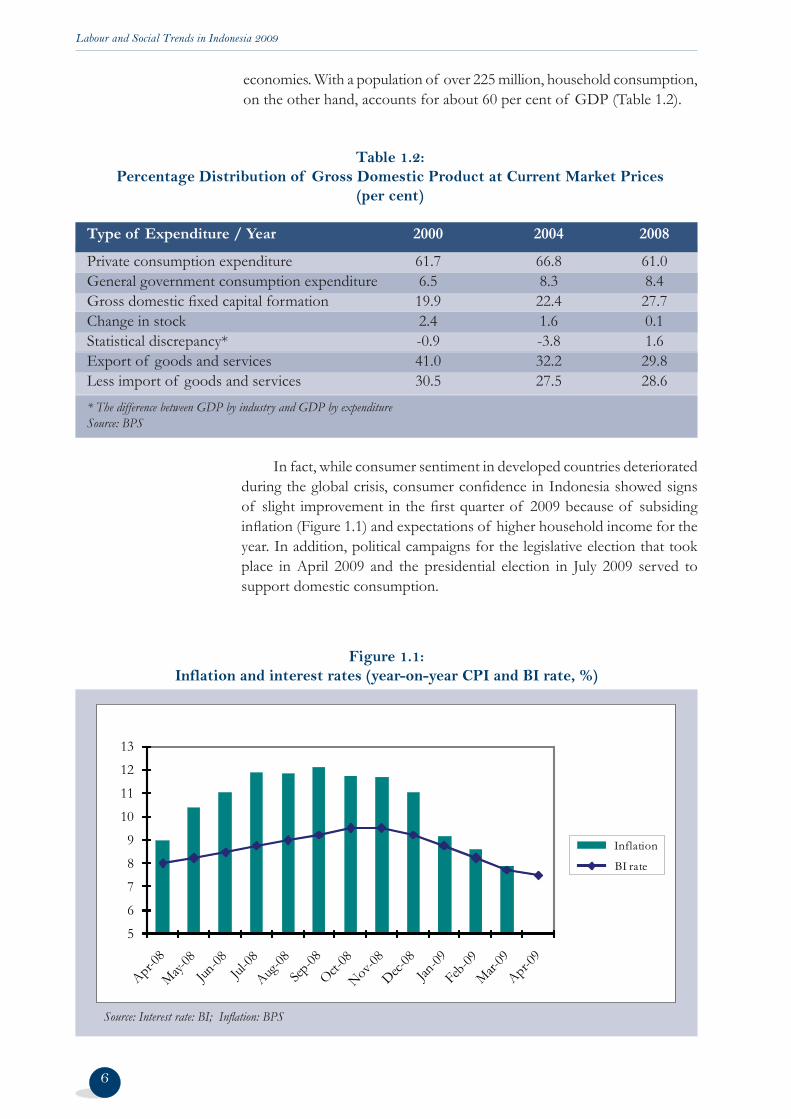
Figure 1.1: Inflation and interest rates (year-on-year CPI and BI rate, %)
Source: Interest rate: BI; Infl ation: BPS
In fact, while consumer sentiment in developed countries deteriorated during the global crisis, consumer confi dence in Indonesia showed signs of slight improvement in the fi rst quarter of 2009 because of subsiding infl ation (Figure 1.1) and expectations of higher household income for the year. In addition, political campaigns for the legislative election that took place in April 2009 and the presidential election in July 2009 served to support domestic consumption.
Table 1.2: Percentage Distribution of Gross Domestic Product at Current Market Prices
(per cent)
Type of Expenditure / Year 2000 2004 2008
Private consumption expenditure 61.7 66.8 61.0General government consumption expenditure 6.5 8.3 8.4Gross domestic fi xed capital formation 19.9 22.4 27.7Change in stock 2.4 1.6 0.1Statistical discrepancy* -0.9 -3.8 1.6Export of goods and services 41.0 32.2 29.8Less import of goods and services 30.5 27.5 28.6* The difference between GDP by industry and GDP by expenditureSource: BPS
5
6
7
8
9
10
11
12
13
Inflation
BI rate
Labour and Social Trends in Indonesia 2009
One of the key mechanisms through which the current global crisis has been transmitted to Indonesia is tumbling exports. Exports declined by 28.9 per cent in the fi rst half of 2009 compared to the fi rst half of 2008. While oil and gas exports saw the largest decline (down 55.4 per cent) during this period, manufactured exports also declined by 26.9 per cent. Exports of electronic equipment, for example, fell by 30.9 per cent in the fi rst half of 2009 compared to the same period in 2008, vehicles by 57.0 per cent and iron and steel by 61.8 per cent.
Investment (gross domestic fi xed capital formation) managed to maintain a fi rm tone between 2000 and 2008 and increased its share of the contribution to GDP. Investment also held up reasonably well in 2009, expanding by 6.5 per cent in the second quarter compared to the previous quarter. Nonetheless, small and medium-sized enterprises, which play an important role in the economy and in the labour market, are being adversely impacted and credit-rationed. With 70 per cent of commercial fi nancing relying on bank lending, credit availability is vital for the survival and growth of SMEs2. Although Bank Indonesia lowered the policy rate to 7.25 per cent from its recent peak of 9.5 per cent in October 2008 (Figure 1.1) in an attempt to reduce the cost of capital in support of business, average bank lending rates remained as high as 14.5 per cent at the end of March.3 Moreover, banks are being extremely conservative in lending due to the perception of higher risks of nonperforming loans amid the adverse business environment.4 Although Bank Indonesia has eased loan approval criteria to boost lending, continued low credit availability to SMEs could hamper a stronger economic rebound and labour absorption.5
1.2 Labour market impacts of the global crisis
The declining pace of economic growth has manifested itself in the labour market in various ways. The fi rst has been a steep fall in the rate of growth of wage employment compared to previous years. Wage employment grew by 1.4 per cent between February 2008 and February 2009, compared to 6.1 per cent in the previous period (February 2007 to 2008). Refl ecting the fact that falling exports have been one of key transmission mechanisms of the crisis in Indonesia, employment in the tradable sectors grew by a mere 1.1 per cent between February 2008 and February 2009. In comparison, employment in the non-tradable sectors grew by 4.0 per cent. Given that the economy still expanded by 5.2 per cent in the last quarter of 2008 and by 4.4 per cent in the fi rst quarter of 2009, during which the labour force survey
Export sector tumbles
SMEs are hurting
2 The Jakarta Globe: “Banks’ stubborn rate freeze will stall growth: BI”, 13 May 2009.3 ibid. 4 See Bank Indonesia: Financial stability review, No.12, March 2009.5 The Jakarta Post: “BI eases ruling to boost lending”, 02 February 2009.
7
Employment expands but the rate of growth in wage employment falls sharply
Labour and Social Trends in Indonesia 2009
was conducted, and subsequently fell to 4.0 per cent growth in the second quarter of 2009, wage employment growth and/or employment growth in the tradable sector may have declined further or even contracted.
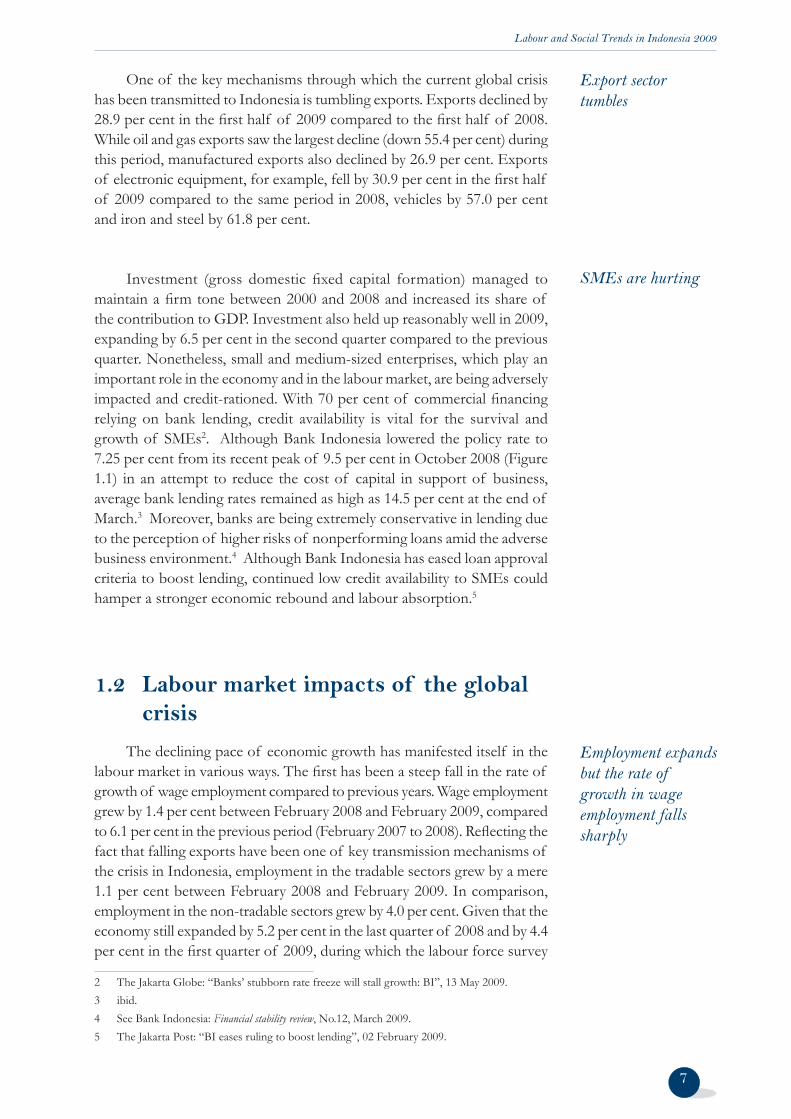
The second means through which the global crisis is manifesting itself in Indonesia’s labour market is through job losses. The Ministry of Manpower and Transmigration reported that job reductions exceeded 51,000, while the Indonesian Employers Association (APINDO) reported over 237,000 layoffs between October 2008 and March 2009, with the textile and garments sector accounting for 100,000 of the retrenchments; palm oil plantations 50,000; the automotive and spare parts industry 40,000; construction 30,000; and the footwear sector, 14,000. Subcontracted, casual and temporary workers in export-orientated industries have borne the brunt of the initial job cuts as shedding these workers is often easier and less costly than laying off permanent staff. According to APINDO, 90 to 95 per cent of those who lost jobs were casual or subcontract workers.6 Nonetheless, despite the job losses, many of the displaced workers appear to have been absorbed into other jobs as the unemployment rate continued its downward trend, falling to 8.1 per cent in February 2009 from 8.4 per cent in August 2008 (Figure 1.2).
Job losses particularly for
subcontract workers but unemployment
rate falls
6 The Jakarta Post: “Total workers laid off reach over 200,000: Apindo”, 12 March 2009.
8
Figure 1.2: Unemployment rate, 2005–2009 (percentages)
Source: BPS
10.311.2
10.5 10.39.8
9.18.5 8.4 8.1
0.0
2.0
4.0
6.0
8.0
10.0
12.0
Feb 2005 Nov 2005 Feb 2006 Aug 2006 Feb 2007 Aug 2007 Feb 2008 Aug 2008 Feb 2009
Labour and Social Trends in Indonesia 2009
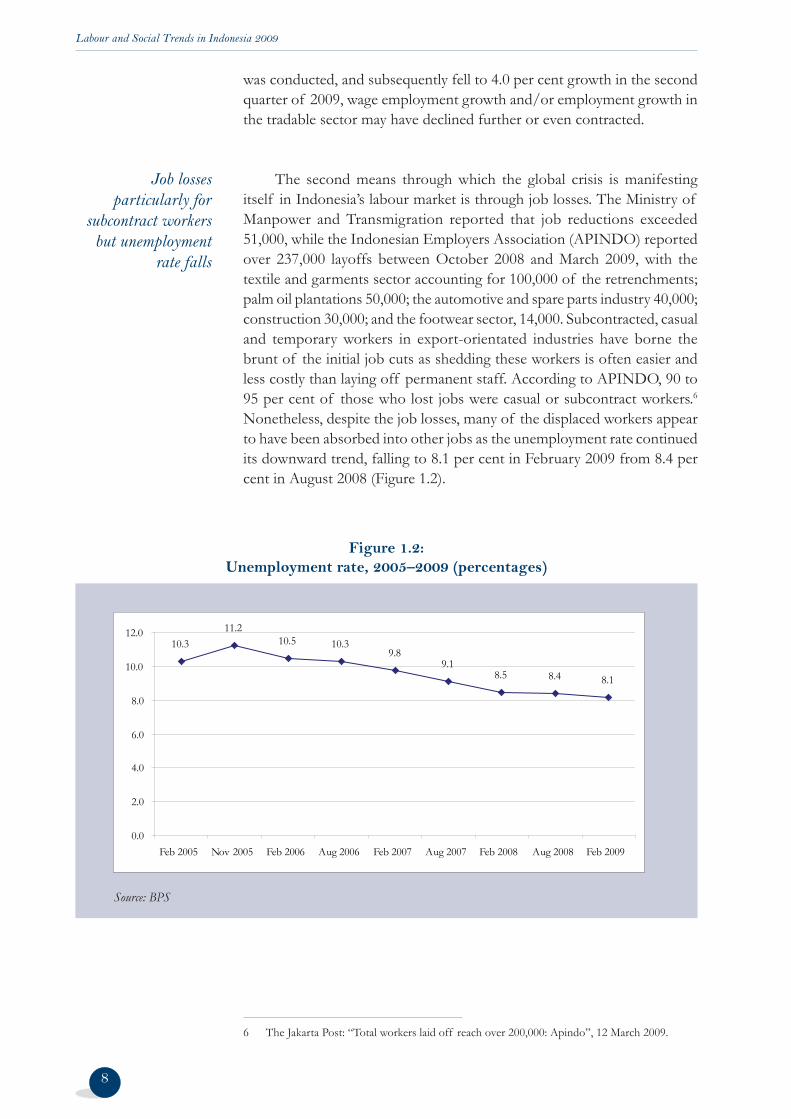
While the unemployment rate fell in February 2009, employment in the informal economy expanded, reversing precious gains made in recent years. This is the third and most salient impact of the crisis on the Indonesian labour market. The number of casual workers, for example, increased by 5.2% between February 2008 and February 2009, the number of unpaid workers increased by 4.0 per cent and the number of own-account workers increased by 3.6% (Table 1.3). This compares to the growth in wage employment of 1.4% over the same period and a 0.1 per cent growth in the number of employers.
9
More salient is the rise of informal employment
The seemingly paradoxical fall in unemployment corresponding with a rise in informal employment is not surprising. In situations of high levels of poverty and inadequate social safety nets, workers who are cut from formal wage employment or other employment are frequently left with few alternatives except to turn to lower productivity and informal economic activities.
Box 1.1 Impact of the crisis on informal workers: Cases from Jakarta
A 25-year-old male worker with high school education was one of the 3,000 employees dismissed from a Greek company in September 2008. He lost a stable income, social security (Jamsostek), overtime pay and his holiday bonus. With his small severance pay, he moved to Jakarta and started his own business as a street food vendor in order to support his father, his wife and his 4-year-old child. He works 10 hours a day, seven days a week. His net income is around USD 4 a day. There is no affordable social insurance for low income earners. Since he was not recognized as a citizen of Jakarta, his access to the direct cash transfer programme (BLT) and to the health insurance facility for the poor (Jamkeskin) was denied by the sub-district government. Sickness and medical bills are emergencies for his family.
Table 1.3: Trends in employment status, 2008–2009
Feb. 2008 (millions) Feb. 2009 (millions) % change
Employees 28.52 28.91 1.4Employers 24.58 24.61 0.1 with permanent workers 2.98 2.97 -0.3 with temporary workers 21.60 21.64 0.2Own account workers 20.08 20.81 3.6Casual workers 10.93 11.50 5.2 In agriculture 6.13 6.35 3.6 Not in agriculture 4.80 5.15 7.3Unpaid workers 17.94 18.66 4.0Total 102.05 104.49 2.4Source: BPS
Labour and Social Trends in Indonesia 2009
Alternative cost-cutting measures
implemented
7 Information obtained through discussions with employer organizations. For example, the Business Tendency Survey (BTS) of the last quarter of 2008 revealed a declining trend in working hours among large and medium-sized enterprises in manufacturing and mining/quarrying sectors.
10
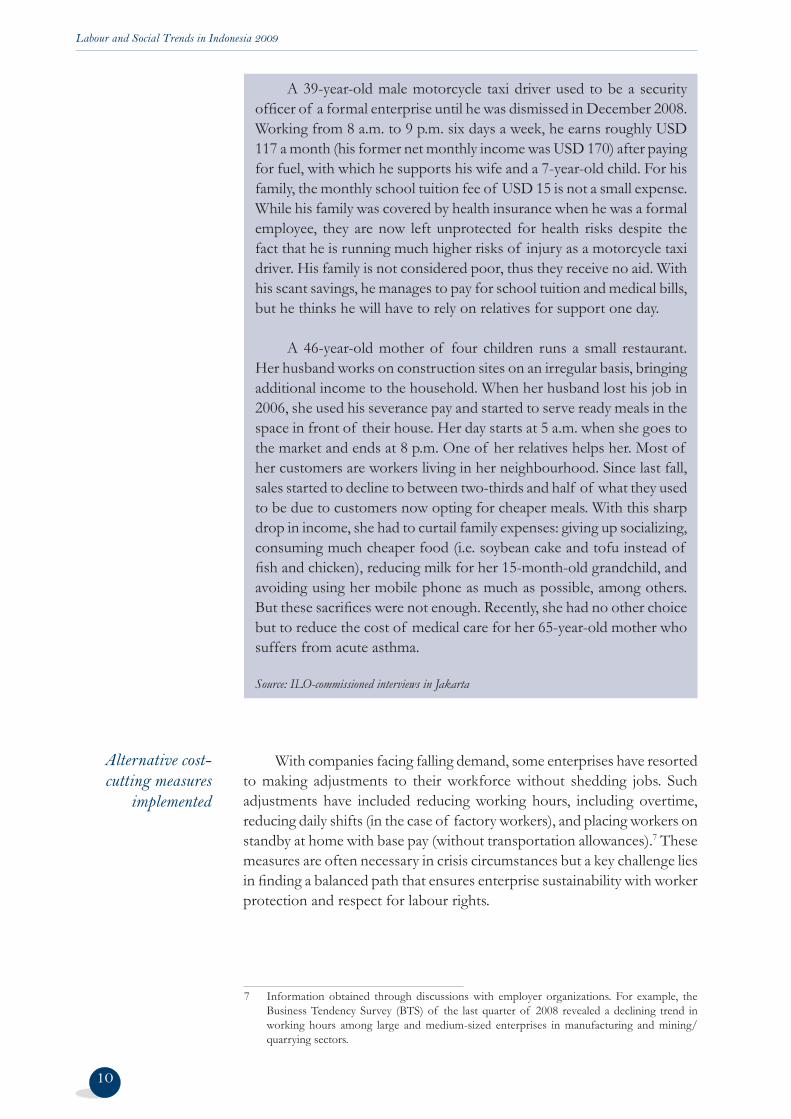
A 39-year-old male motorcycle taxi driver used to be a security offi cer of a formal enterprise until he was dismissed in December 2008. Working from 8 a.m. to 9 p.m. six days a week, he earns roughly USD 117 a month (his former net monthly income was USD 170) after paying for fuel, with which he supports his wife and a 7-year-old child. For his family, the monthly school tuition fee of USD 15 is not a small expense. While his family was covered by health insurance when he was a formal employee, they are now left unprotected for health risks despite the fact that he is running much higher risks of injury as a motorcycle taxi driver. His family is not considered poor, thus they receive no aid. With his scant savings, he manages to pay for school tuition and medical bills, but he thinks he will have to rely on relatives for support one day.
A 46-year-old mother of four children runs a small restaurant. Her husband works on construction sites on an irregular basis, bringing additional income to the household. When her husband lost his job in 2006, she used his severance pay and started to serve ready meals in the space in front of their house. Her day starts at 5 a.m. when she goes to the market and ends at 8 p.m. One of her relatives helps her. Most of her customers are workers living in her neighbourhood. Since last fall, sales started to decline to between two-thirds and half of what they used to be due to customers now opting for cheaper meals. With this sharp drop in income, she had to curtail family expenses: giving up socializing, consuming much cheaper food (i.e. soybean cake and tofu instead of fi sh and chicken), reducing milk for her 15-month-old grandchild, and avoiding using her mobile phone as much as possible, among others. But these sacrifi ces were not enough. Recently, she had no other choice but to reduce the cost of medical care for her 65-year-old mother who suffers from acute asthma.
Source: ILO-commissioned interviews in Jakarta
With companies facing falling demand, some enterprises have resorted to making adjustments to their workforce without shedding jobs. Such adjustments have included reducing working hours, including overtime, reducing daily shifts (in the case of factory workers), and placing workers on standby at home with base pay (without transportation allowances).7 These measures are often necessary in crisis circumstances but a key challenge lies in fi nding a balanced path that ensures enterprise sustainability with worker protection and respect for labour rights.
Labour and Social Trends in Indonesia 2009
11
Box 1.2Investing for the recovery: Workers and productivity
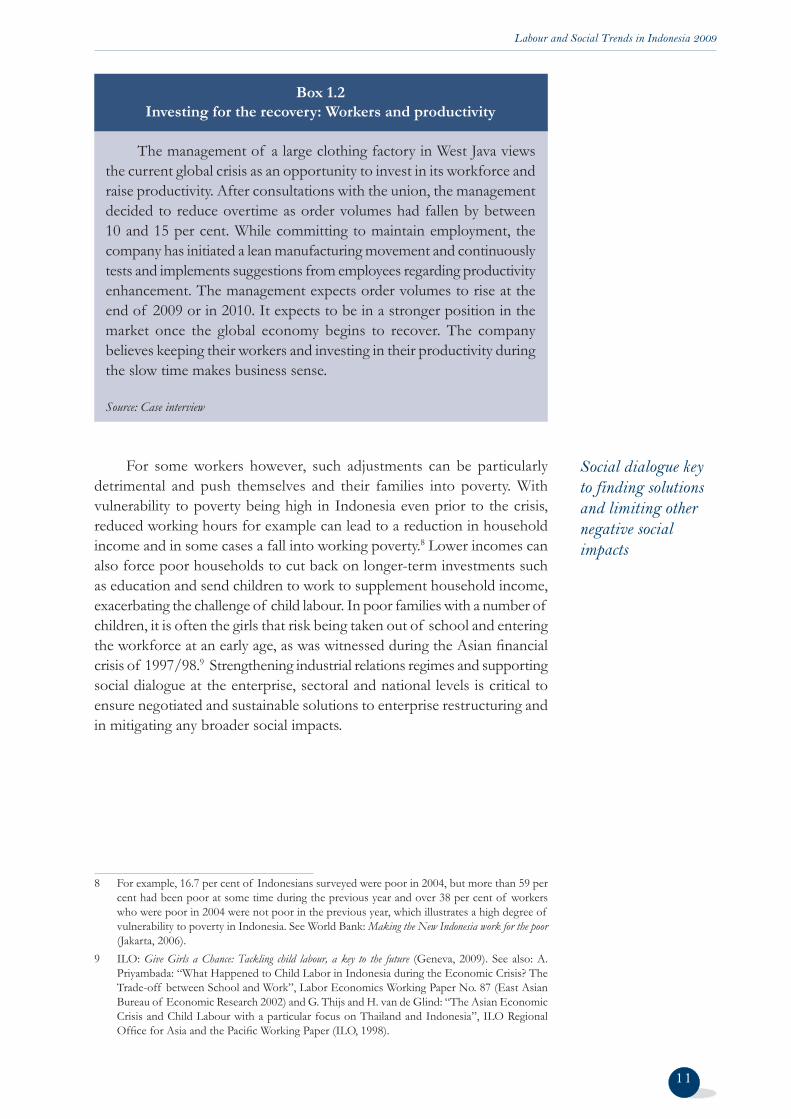
The management of a large clothing factory in West Java views the current global crisis as an opportunity to invest in its workforce and raise productivity. After consultations with the union, the management decided to reduce overtime as order volumes had fallen by between 10 and 15 per cent. While committing to maintain employment, the company has initiated a lean manufacturing movement and continuously tests and implements suggestions from employees regarding productivity enhancement. The management expects order volumes to rise at the end of 2009 or in 2010. It expects to be in a stronger position in the market once the global economy begins to recover. The company believes keeping their workers and investing in their productivity during the slow time makes business sense.
Source: Case interview
Social dialogue key to finding solutions and limiting other negative social impacts
For some workers however, such adjustments can be particularly detrimental and push themselves and their families into poverty. With vulnerability to poverty being high in Indonesia even prior to the crisis, reduced working hours for example can lead to a reduction in household income and in some cases a fall into working poverty.8 Lower incomes can also force poor households to cut back on longer-term investments such as education and send children to work to supplement household income, exacerbating the challenge of child labour. In poor families with a number of children, it is often the girls that risk being taken out of school and entering the workforce at an early age, as was witnessed during the Asian fi nancial crisis of 1997/98.9 Strengthening industrial relations regimes and supporting social dialogue at the enterprise, sectoral and national levels is critical to ensure negotiated and sustainable solutions to enterprise restructuring and in mitigating any broader social impacts.
8 For example, 16.7 per cent of Indonesians surveyed were poor in 2004, but more than 59 per cent had been poor at some time during the previous year and over 38 per cent of workers who were poor in 2004 were not poor in the previous year, which illustrates a high degree of vulnerability to poverty in Indonesia. See World Bank: Making the New Indonesia work for the poor (Jakarta, 2006).
9 ILO: Give Girls a Chance: Tackling child labour, a key to the future (Geneva, 2009). See also: A. Priyambada: “What Happened to Child Labor in Indonesia during the Economic Crisis? The Trade-off between School and Work”, Labor Economics Working Paper No. 87 (East Asian Bureau of Economic Research 2002) and G. Thijs and H. van de Glind: “The Asian Economic Crisis and Child Labour with a particular focus on Thailand and Indonesia”, ILO Regional Offi ce for Asia and the Pacifi c Working Paper (ILO, 1998).

Labour and Social Trends in Indonesia 2009
10 The Jakarta Post: “250,000 migrant workers sent home”, 18 December 2009.11 ibid12 ibid13 Indonesia Trade and Investment News, 6 October 2008. Available at: http://www.indonesia.
go.id/en/index.php?option=com_content&task=view&id=7713&Itemid=718).
1.3 Vulnerable groups
It is important to bear in mind that the impacts of the crisis on Indonesia’s labour market have differed by households, groups and localities. One group whose vulnerability has increased as a result of the current crisis is overseas migrant workers. This group of workers is often among the fi rst to be dismissed during downturns. The Indonesian Minister of Manpower and Transmigration indicated in December 2008 that 250,000 overseas migrant workers had been laid off and had returned home before their contracts had expired.10 On the other hand, newly arrived migrants in particular have invested heavily in getting recruited, travelling and establishing themselves in a foreign country. Returning to Indonesia is often not an option and they may accept almost any condition in order to retain their jobs. At the same time, potential migrant workers see their hopes diminishing as various foreign countries have stopped issuing work permits to foreign workers or have reduced quotas.
Many overseas migrants have returned home
12
Box 1.3Indonesian overseas migrant workers
The number of Indonesian workers abroad had been on an upward trend until the global crisis deepened. In 2007, 697,000 workers legally emigrated in search of employment, while there may have been at least twice that number of undocumented migrants. With geographical proximity, cultural and linguistic similarities, and existing Indonesian migrant networks, Malaysia hosts a sizable number of undocumented Indonesian workers. The National Agency for the Placement and Protection of Indonesian Overseas Workers (BNP2TKI) estimated that the number of Indonesian overseas migrant workers, including undocumented migrant workers, stood at 5.8 million11 in December 2008. Around 65 per cent of the Indonesian overseas migrant workers, including many of the female migrants, were domestic workers, deployed in 41 countries.12 About half of overseas migrant workers are employed in Malaysia. The others work in the Middle East, Singapore, Hong Kong (China) and Taiwan (China). Plantations and construction sites are common workplaces for Indonesian migrant workers. Some Indonesian workers are employed in the manufacturing sectors in other Asian countries. Remittances by Indonesian workers abroad have increased in the past few years and are estimated to have reached USD 12 billion in 2008.13
Labour and Social Trends in Indonesia 2009
13
Enhanced regulation of recruitment agencies and a more effi cient labour migration administration would serve to ensure better management of labour migration and protection of the rights of migrant workers. Furthermore, it will be necessary for the government to negotiate new migration channels through bilateral agreements, while also providing safeguards of labour rights, ensuring consular protection, and reducing the cost of migration. Another challenge is to maximize the impact of remittances on sustainable poverty alleviation and development by reducing the cost of sending remittances and by encouraging productive investment. This could be organized by sector, for example, with the active participation of relevant employers’ and workers’ organisations.
Box 1.4Human stories: Returned overseas migrant workers
Returned migrant worker #1
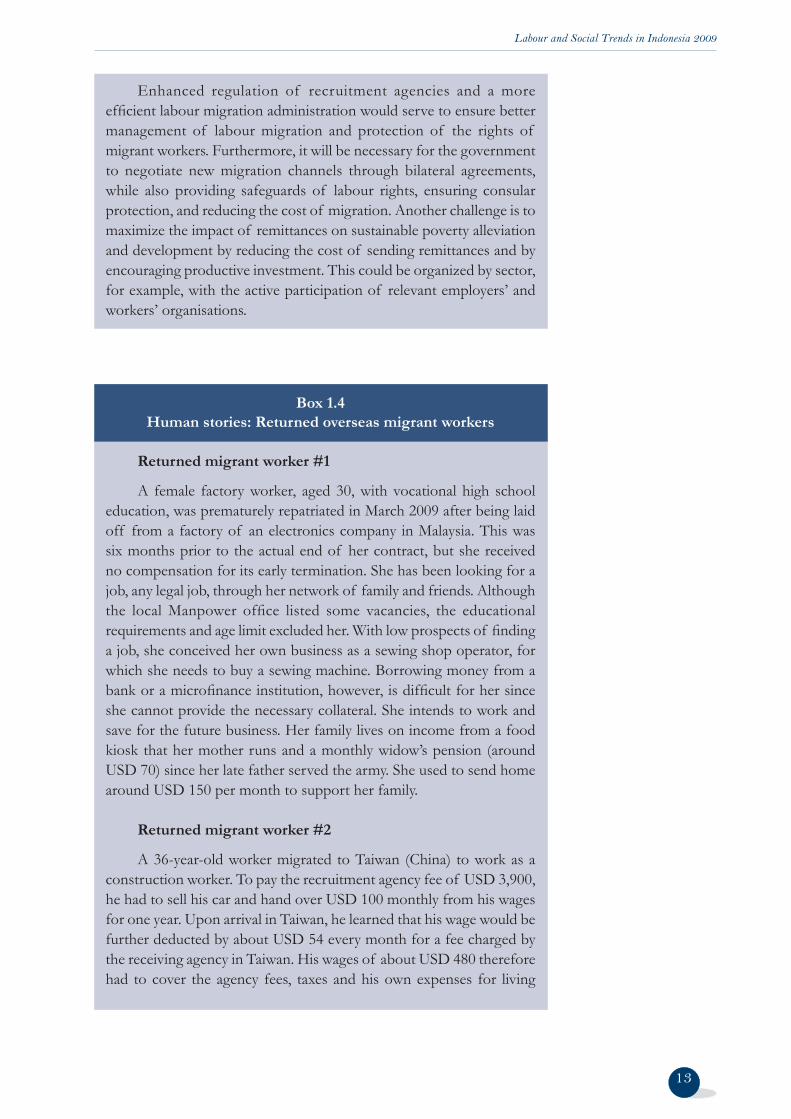
A female factory worker, aged 30, with vocational high school education, was prematurely repatriated in March 2009 after being laid off from a factory of an electronics company in Malaysia. This was six months prior to the actual end of her contract, but she received no compensation for its early termination. She has been looking for a job, any legal job, through her network of family and friends. Although the local Manpower offi ce listed some vacancies, the educational requirements and age limit excluded her. With low prospects of fi nding a job, she conceived her own business as a sewing shop operator, for which she needs to buy a sewing machine. Borrowing money from a bank or a microfi nance institution, however, is diffi cult for her since she cannot provide the necessary collateral. She intends to work and save for the future business. Her family lives on income from a food kiosk that her mother runs and a monthly widow’s pension (around USD 70) since her late father served the army. She used to send home around USD 150 per month to support her family.
Returned migrant worker #2
A 36-year-old worker migrated to Taiwan (China) to work as a construction worker. To pay the recruitment agency fee of USD 3,900, he had to sell his car and hand over USD 100 monthly from his wages for one year. Upon arrival in Taiwan, he learned that his wage would be further deducted by about USD 54 every month for a fee charged by the receiving agency in Taiwan. His wages of about USD 480 therefore had to cover the agency fees, taxes and his own expenses for living
Labour and Social Trends in Indonesia 2009
14
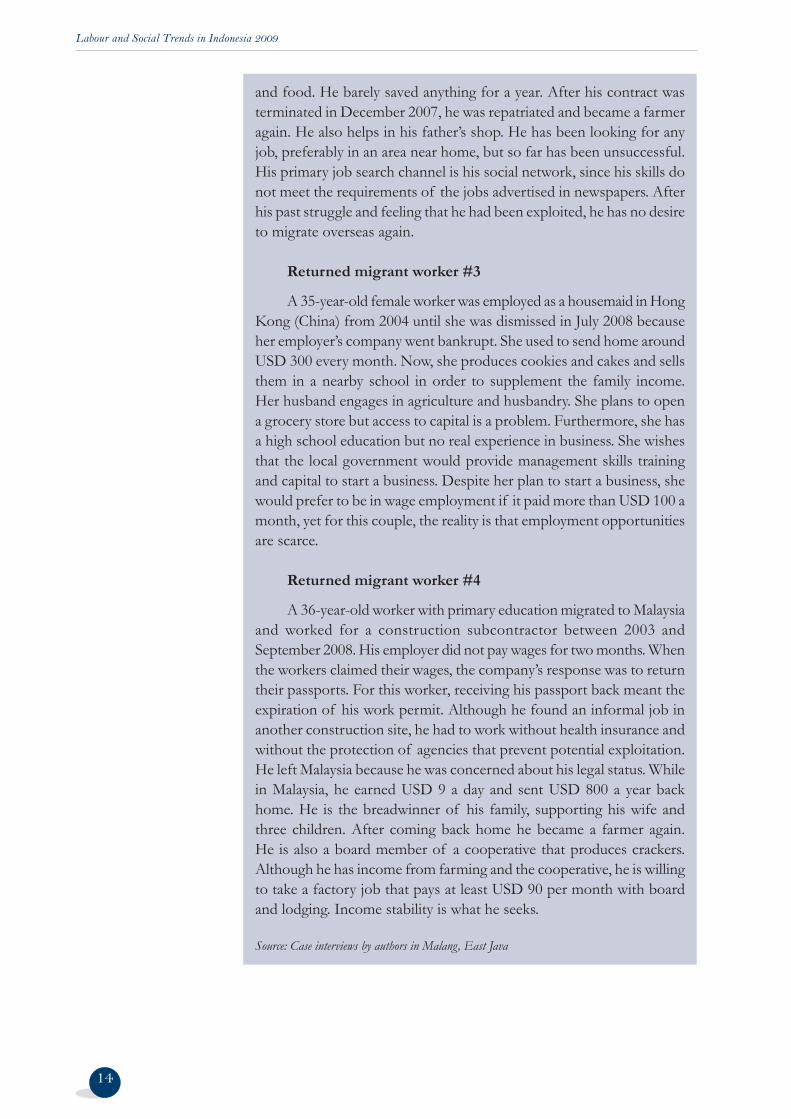
and food. He barely saved anything for a year. After his contract was terminated in December 2007, he was repatriated and became a farmer again. He also helps in his father’s shop. He has been looking for any job, preferably in an area near home, but so far has been unsuccessful. His primary job search channel is his social network, since his skills do not meet the requirements of the jobs advertised in newspapers. After his past struggle and feeling that he had been exploited, he has no desire to migrate overseas again.
Returned migrant worker #3
A 35-year-old female worker was employed as a housemaid in Hong Kong (China) from 2004 until she was dismissed in July 2008 because her employer’s company went bankrupt. She used to send home around USD 300 every month. Now, she produces cookies and cakes and sells them in a nearby school in order to supplement the family income. Her husband engages in agriculture and husbandry. She plans to open a grocery store but access to capital is a problem. Furthermore, she has a high school education but no real experience in business. She wishes that the local government would provide management skills training and capital to start a business. Despite her plan to start a business, she would prefer to be in wage employment if it paid more than USD 100 a month, yet for this couple, the reality is that employment opportunities are scarce.
Returned migrant worker #4
A 36-year-old worker with primary education migrated to Malaysia and worked for a construction subcontractor between 2003 and September 2008. His employer did not pay wages for two months. When the workers claimed their wages, the company’s response was to return their passports. For this worker, receiving his passport back meant the expiration of his work permit. Although he found an informal job in another construction site, he had to work without health insurance and without the protection of agencies that prevent potential exploitation. He left Malaysia because he was concerned about his legal status. While in Malaysia, he earned USD 9 a day and sent USD 800 a year back home. He is the breadwinner of his family, supporting his wife and three children. After coming back home he became a farmer again. He is also a board member of a cooperative that produces crackers. Although he has income from farming and the cooperative, he is willing to take a factory job that pays at least USD 90 per month with board and lodging. Income stability is what he seeks.
Source: Case interviews by authors in Malang, East Java

Labour and Social Trends in Indonesia 2009
The impacts of the global crisis on Indonesia also raise additional concerns for youth and women. Even before the crisis, young women and men in Indonesia (aged 15–24) were almost 4.9 times likely as adults to be without work, and the youth unemployment rate stood at 23.3 per cent in 2008. The global crisis is likely to have exacerbated the already severe youth employment problems in Indonesia, as inexperienced young workers are likely to be among the fi rst to be let go by fi rms and among the last to be recruited.
Women also faced a diffi cult situation in the labour market previous to the crisis: not only was the female unemployment rate—at 9.7 per cent in 2008—signifi cantly higher than for men (7.6 per cent), but women were also more likely to be in vulnerable employment than men. Furthermore, they are likely to shoulder the intensifi ed double burden of family care and income-generating activities, as was experienced in the Asian fi nancial crisis. For example, women’s labour participation in the agriculture sector increased between 1997 and 1998, either as own-account workers (an increase of 803,600) or as unpaid family workers (670,700). This was to compensate for men’s reduced take-home wages and high infl ation during the crisis. While men’s working hours were reduced, women recorded a net increase in working hours, since they worked overtime and took on side jobs.14
With exports being one of the key transmission channels of the crisis in Indonesia, urban labour markets have been most severely affected. Nonetheless, the impact on the rural economy cannot be understated. Job losses in urban areas have contributed to a process of reverse migration and many of these returnees are likely to be involved in lower-productivity, informal activities. Such urban-to-rural migration was also already being witnessed in 2008 as the global food and fuel crisis likely induced some migrants to return to rural areas as the cost of living is often lower there.
1.4 A protracted recovery in the labour market
At the time of writing, the global economy was showing some early signs of “bottoming out.” While this is a welcome development for Indonesia, it is important to bear in mind that the full impact of the global recession in Indonesia’s labour market may have yet to be realized and that the consequences for its workers could be deep and protracted. In the previous Asian fi nancial crisis, it took a long time for various labour market
14 R. Islam et al: “The economic crisis: labour market challenges and policies in Indonesia”, in G. Betcherman and R. Islam, eds: East Asian labour markets and the economic crisis: Impacts, responses and lessons (The World Bank and the International Labour Offi ce, 2001).
Situation of young women and men in the labour market has likely worsened
Many women bearing an increased double burden of family care and work
15
Primary impact is on urban labour markets but impacts on rural areas cannot be understated
Labour market indicators take many years to return to pre-crisis levels
Labour and Social Trends in Indonesia 2009
indicators to return to pre-crisis levels. For example, the unemployment rate in Indonesia in 1996 was 4.9 per cent, which increased subsequently as a result of the crisis and only fell to a near pre-crisis level of 5.1 per cent in 2001.15
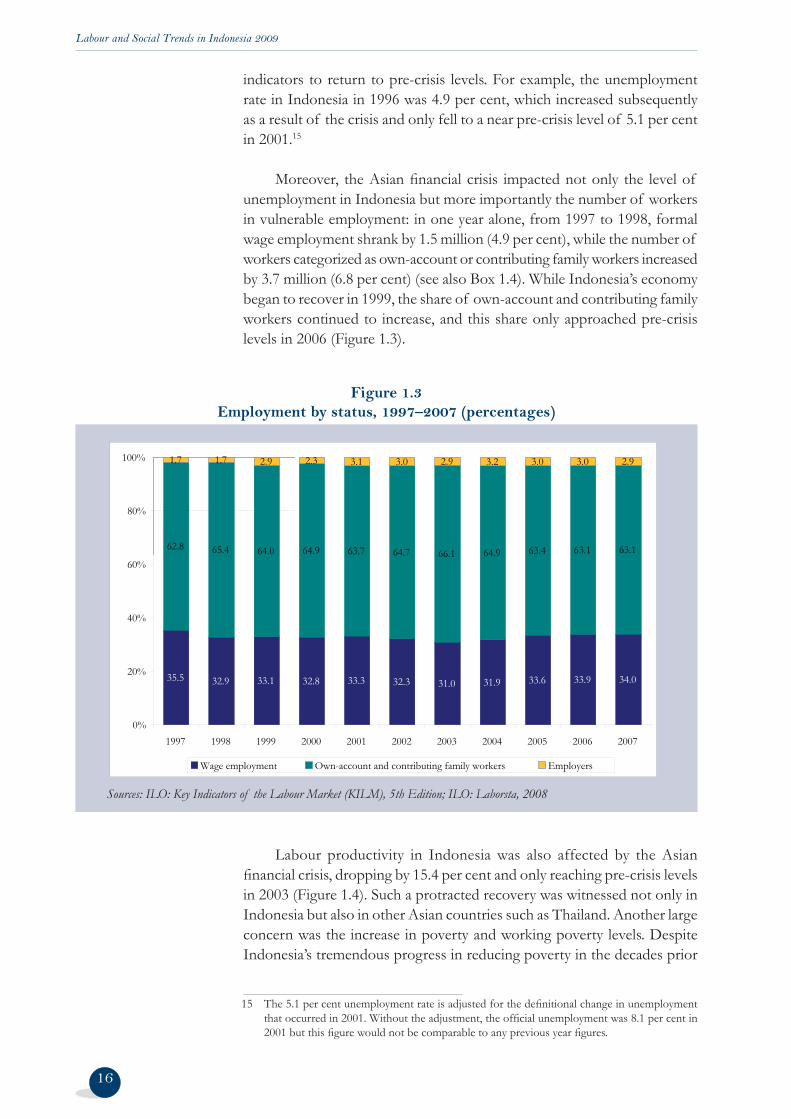
Moreover, the Asian fi nancial crisis impacted not only the level of unemployment in Indonesia but more importantly the number of workers in vulnerable employment: in one year alone, from 1997 to 1998, formal wage employment shrank by 1.5 million (4.9 per cent), while the number of workers categorized as own-account or contributing family workers increased by 3.7 million (6.8 per cent) (see also Box 1.4). While Indonesia’s economy began to recover in 1999, the share of own-account and contributing family workers continued to increase, and this share only approached pre-crisis levels in 2006 (Figure 1.3).
16
15 The 5.1 per cent unemployment rate is adjusted for the defi nitional change in unemployment that occurred in 2001. Without the adjustment, the offi cial unemployment was 8.1 per cent in 2001 but this fi gure would not be comparable to any previous year fi gures.
Figure 1.3Employment by status, 1997–2007 (percentages)
Sources: ILO: Key Indicators of the Labour Market (KILM), 5th Edition; ILO: Laborsta, 2008
35.5 32.9 33.1 32.8 33.3 32.3 31.0 31.9 33.6 33.9 34.0
62.8 65.4 64.0 64.9 63.7 64.7 66.1 64.9 63.4 63.1 63.1
1.7 1.7 2.9 2.3 3.1 3.0 2.9 3.2 3.0 3.0 2.9
0%
20%
40%
60%
80%
100%
1997 1998 1999 2000 2001 2002 2003 2004 2005 2006 2007
Wage employment Own-account and contributing family workers Employers
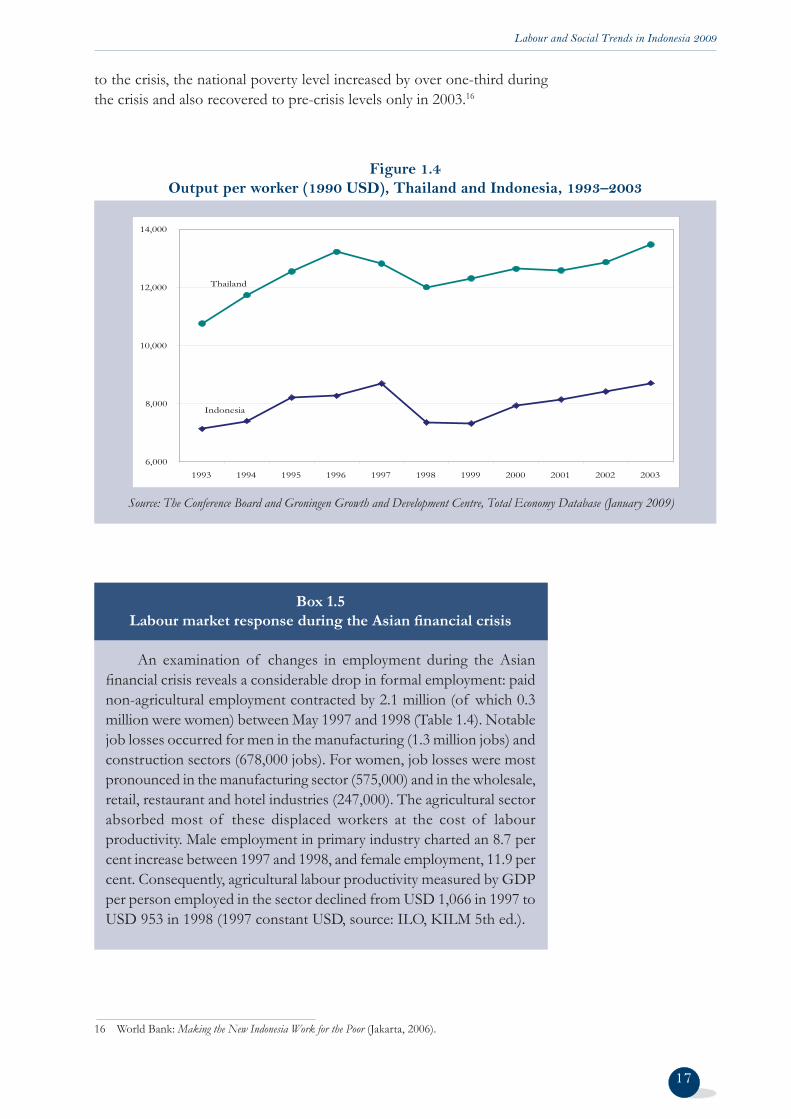
Labour productivity in Indonesia was also affected by the Asian fi nancial crisis, dropping by 15.4 per cent and only reaching pre-crisis levels in 2003 (Figure 1.4). Such a protracted recovery was witnessed not only in Indonesia but also in other Asian countries such as Thailand. Another large concern was the increase in poverty and working poverty levels. Despite Indonesia’s tremendous progress in reducing poverty in the decades prior
Labour and Social Trends in Indonesia 2009
17
to the crisis, the national poverty level increased by over one-third during the crisis and also recovered to pre-crisis levels only in 2003.16
16 World Bank: Making the New Indonesia Work for the Poor (Jakarta, 2006).
Figure 1.4Output per worker (1990 USD), Thailand and Indonesia, 1993–2003
Source: The Conference Board and Groningen Growth and Development Centre, Total Economy Database (January 2009)
Indonesia
Thailand
6,000
8,000
10,000
12,000
14,000
1993 1994 1995 1996 1997 1998 1999 2000 2001 2002 2003
Box 1.5Labour market response during the Asian fi nancial crisis
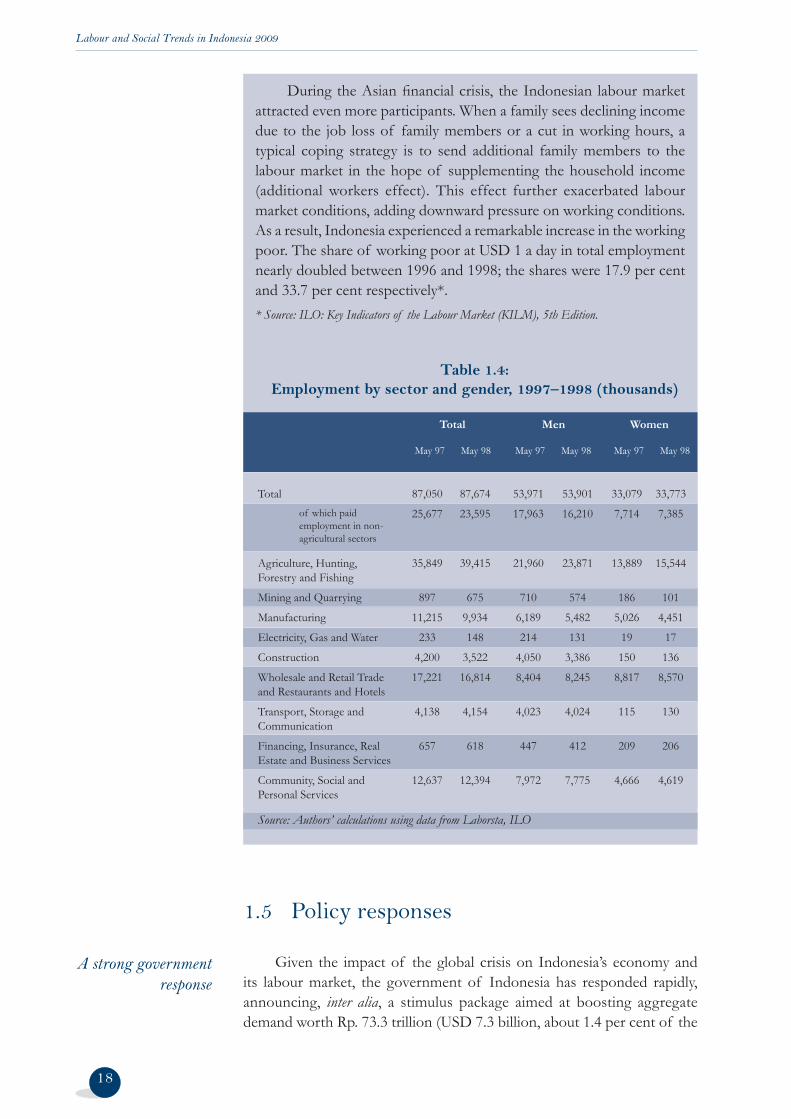
An examination of changes in employment during the Asian fi nancial crisis reveals a considerable drop in formal employment: paid non-agricultural employment contracted by 2.1 million (of which 0.3 million were women) between May 1997 and 1998 (Table 1.4). Notable job losses occurred for men in the manufacturing (1.3 million jobs) and construction sectors (678,000 jobs). For women, job losses were most pronounced in the manufacturing sector (575,000) and in the wholesale, retail, restaurant and hotel industries (247,000). The agricultural sector absorbed most of these displaced workers at the cost of labour productivity. Male employment in primary industry charted an 8.7 per cent increase between 1997 and 1998, and female employment, 11.9 per cent. Consequently, agricultural labour productivity measured by GDP per person employed in the sector declined from USD 1,066 in 1997 to USD 953 in 1998 (1997 constant USD, source: ILO, KILM 5th ed.).
Labour and Social Trends in Indonesia 2009
18
During the Asian fi nancial crisis, the Indonesian labour market attracted even more participants. When a family sees declining income due to the job loss of family members or a cut in working hours, a typical coping strategy is to send additional family members to the labour market in the hope of supplementing the household income (additional workers effect). This effect further exacerbated labour market conditions, adding downward pressure on working conditions. As a result, Indonesia experienced a remarkable increase in the working poor. The share of working poor at USD 1 a day in total employment nearly doubled between 1996 and 1998; the shares were 17.9 per cent and 33.7 per cent respectively*.* Source: ILO: Key Indicators of the Labour Market (KILM), 5th Edition.
1.5 Policy responses
Given the impact of the global crisis on Indonesia’s economy and its labour market, the government of Indonesia has responded rapidly, announcing, inter alia, a stimulus package aimed at boosting aggregate demand worth Rp. 73.3 trillion (USD 7.3 billion, about 1.4 per cent of the
A strong government response
May 97 May 98 May 97 May 98 May 97 May 98
of which paid employment in non-agricultural sectors
Table 1.4: Employment by sector and gender, 1997–1998 (thousands)
Total Men Women
Total 87,050 87,674 53,971 53,901 33,079 33,773
25,677 23,595 17,963 16,210 7,714 7,385
Agriculture, Hunting, 35,849 39,415 21,960 23,871 13,889 15,544 Forestry and Fishing
Mining and Quarrying 897 675 710 574 186 101
Manufacturing 11,215 9,934 6,189 5,482 5,026 4,451
Electricity, Gas and Water 233 148 214 131 19 17
Construction 4,200 3,522 4,050 3,386 150 136
Wholesale and Retail Trade 17,221 16,814 8,404 8,245 8,817 8,570 and Restaurants and Hotels
Transport, Storage and 4,138 4,154 4,023 4,024 115 130 Communication
Financing, Insurance, Real 657 618 447 412 209 206 Estate and Business Services
Community, Social and 12,637 12,394 7,972 7,775 4,666 4,619 Personal Services
Source: Authors’ calculations using data from Laborsta, ILO
Labour and Social Trends in Indonesia 2009
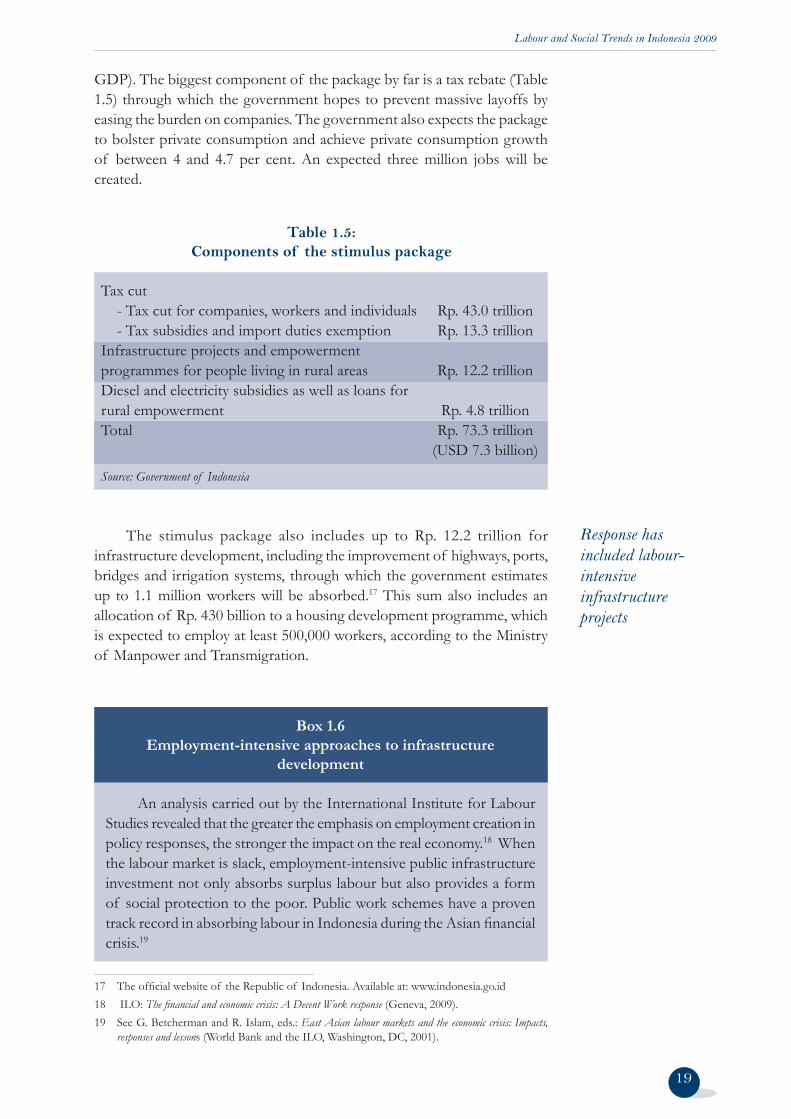
GDP). The biggest component of the package by far is a tax rebate (Table 1.5) through which the government hopes to prevent massive layoffs by easing the burden on companies. The government also expects the package to bolster private consumption and achieve private consumption growth of between 4 and 4.7 per cent. An expected three million jobs will be created.
17 The offi cial website of the Republic of Indonesia. Available at: www.indonesia.go.id18 ILO: The fi nancial and economic crisis: A Decent Work response (Geneva, 2009).19 See G. Betcherman and R. Islam, eds.: East Asian labour markets and the economic crisis: Impacts,
responses and lessons (World Bank and the ILO, Washington, DC, 2001).
19
Response has included labour-intensive infrastructure projects
The stimulus package also includes up to Rp. 12.2 trillion for infrastructure development, including the improvement of highways, ports, bridges and irrigation systems, through which the government estimates up to 1.1 million workers will be absorbed.17 This sum also includes an allocation of Rp. 430 billion to a housing development programme, which is expected to employ at least 500,000 workers, according to the Ministry of Manpower and Transmigration.
Box 1.6Employment-intensive approaches to infrastructure
development
An analysis carried out by the International Institute for Labour Studies revealed that the greater the emphasis on employment creation in policy responses, the stronger the impact on the real economy.18 When the labour market is slack, employment-intensive public infrastructure investment not only absorbs surplus labour but also provides a form of social protection to the poor. Public work schemes have a proven track record in absorbing labour in Indonesia during the Asian fi nancial crisis.19
Table 1.5: Components of the stimulus package
Tax cut - Tax cut for companies, workers and individuals Rp. 43.0 trillion - Tax subsidies and import duties exemption Rp. 13.3 trillionInfrastructure projects and empowerment programmes for people living in rural areas Rp. 12.2 trillionDiesel and electricity subsidies as well as loans for rural empowerment Rp. 4.8 trillionTotal Rp. 73.3 trillion (USD 7.3 billion)Source: Government of Indonesia
Labour and Social Trends in Indonesia 2009
20
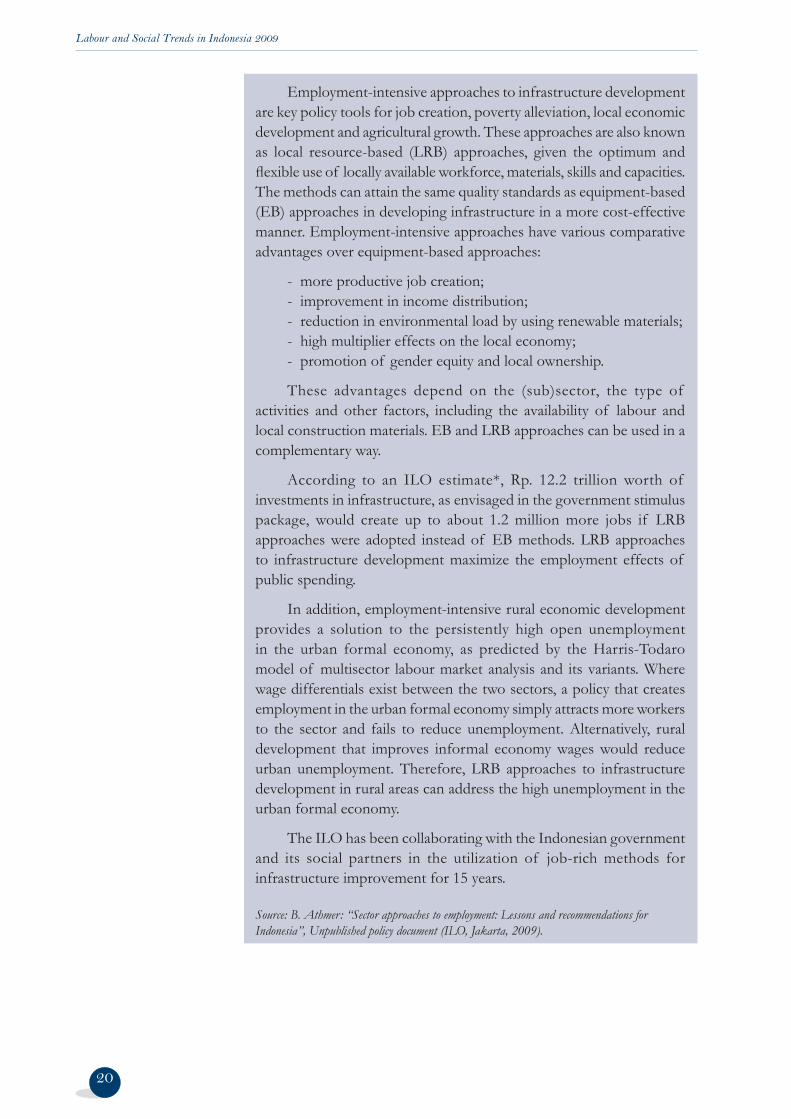
Employment-intensive approaches to infrastructure development are key policy tools for job creation, poverty alleviation, local economic development and agricultural growth. These approaches are also known as local resource-based (LRB) approaches, given the optimum and fl exible use of locally available workforce, materials, skills and capacities. The methods can attain the same quality standards as equipment-based (EB) approaches in developing infrastructure in a more cost-effective manner. Employment-intensive approaches have various comparative advantages over equipment-based approaches:
- more productive job creation;- improvement in income distribution;- reduction in environmental load by using renewable materials; - high multiplier effects on the local economy;- promotion of gender equity and local ownership.
These advantages depend on the (sub)sector, the type of activities and other factors, including the availability of labour and local construction materials. EB and LRB approaches can be used in a complementary way.
According to an ILO estimate*, Rp. 12.2 trillion worth of investments in infrastructure, as envisaged in the government stimulus package, would create up to about 1.2 million more jobs if LRB approaches were adopted instead of EB methods. LRB approaches to infrastructure development maximize the employment effects of public spending.
In addition, employment-intensive rural economic development provides a solution to the persistently high open unemployment in the urban formal economy, as predicted by the Harris-Todaro model of multisector labour market analysis and its variants. Where wage differentials exist between the two sectors, a policy that creates employment in the urban formal economy simply attracts more workers to the sector and fails to reduce unemployment. Alternatively, rural development that improves informal economy wages would reduce urban unemployment. Therefore, LRB approaches to infrastructure development in rural areas can address the high unemployment in the urban formal economy.
The ILO has been collaborating with the Indonesian government and its social partners in the utilization of job-rich methods for infrastructure improvement for 15 years.
Source: B. Athmer: “Sector approaches to employment: Lessons and recommendations for Indonesia”, Unpublished policy document (ILO, Jakarta, 2009).
Labour and Social Trends in Indonesia 2009
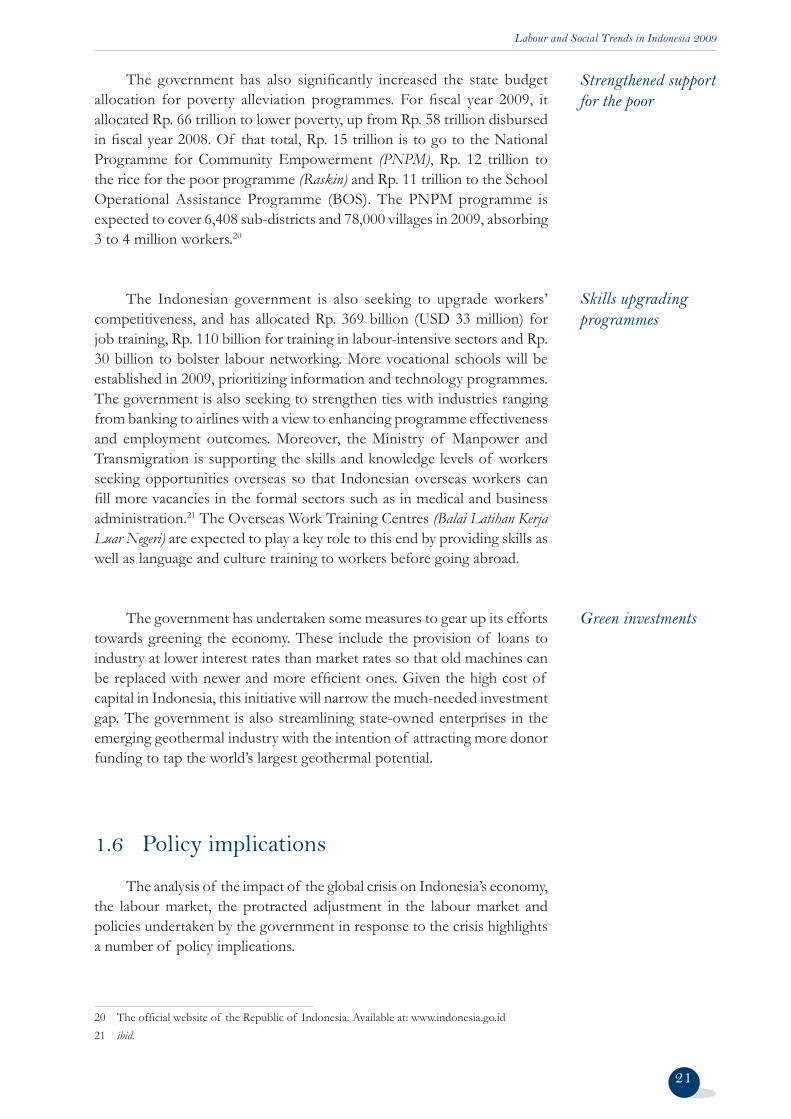
The government has also signifi cantly increased the state budget allocation for poverty alleviation programmes. For fi scal year 2009, it allocated Rp. 66 trillion to lower poverty, up from Rp. 58 trillion disbursed in fi scal year 2008. Of that total, Rp. 15 trillion is to go to the National Programme for Community Empowerment (PNPM), Rp. 12 trillion to the rice for the poor programme (Raskin) and Rp. 11 trillion to the School Operational Assistance Programme (BOS). The PNPM programme is expected to cover 6,408 sub-districts and 78,000 villages in 2009, absorbing 3 to 4 million workers.20
The Indonesian government is also seeking to upgrade workers’ competitiveness, and has allocated Rp. 369 billion (USD 33 million) for job training, Rp. 110 billion for training in labour-intensive sectors and Rp. 30 billion to bolster labour networking. More vocational schools will be established in 2009, prioritizing information and technology programmes. The government is also seeking to strengthen ties with industries ranging from banking to airlines with a view to enhancing programme effectiveness and employment outcomes. Moreover, the Ministry of Manpower and Transmigration is supporting the skills and knowledge levels of workers seeking opportunities overseas so that Indonesian overseas workers can fi ll more vacancies in the formal sectors such as in medical and business administration.21 The Overseas Work Training Centres (Balai Latihan Kerja Luar Negeri) are expected to play a key role to this end by providing skills as well as language and culture training to workers before going abroad.
The government has undertaken some measures to gear up its efforts towards greening the economy. These include the provision of loans to industry at lower interest rates than market rates so that old machines can be replaced with newer and more effi cient ones. Given the high cost of capital in Indonesia, this initiative will narrow the much-needed investment gap. The government is also streamlining state-owned enterprises in the emerging geothermal industry with the intention of attracting more donor funding to tap the world’s largest geothermal potential.
1.6 Policy implications
The analysis of the impact of the global crisis on Indonesia’s economy, the labour market, the protracted adjustment in the labour market and policies undertaken by the government in response to the crisis highlights a number of policy implications.
21
20 The offi cial website of the Republic of Indonesia. Available at: www.indonesia.go.id21 ibid.
Strengthened support for the poor
Skills upgrading programmes
Green investments
Labour and Social Trends in Indonesia 2009
The fi rst of these is a need to place decent and productive jobs at the centre of the crisis response and in day-to-day economic and social policies. A recent assessment of the estimated employment effects of different fi scal measures, for example, has revealed that “the greater the employment orientation of the measure, the stronger the stimulus for the real economy”.22 Indonesia’s stimulus package has been a strong response but the large share of tax breaks in the stimulus package (around 60 per cent) suggests that a greater focus on liquidity-constrained SMEs and vulnerable groups such as the unemployed, poor and near poor would have an even greater effect in raising aggregate demand and enhancing the country’s growth potential in the medium and long term. This is because tax reductions often have no direct output or employment effect, and their indirect impact depends on how fi rms and households react to an increase in their income. In the current environment, fi rms face not only a sharp fall in demand, but also unprecedented uncertainty in the future. In such a situation, they often take a ‘wait-and-see’ attitude with respect to their investments, and households are likely to exhibit similar behaviour in their consumption decisions.23 Therefore, across-the-board incentives aimed at businesses or households (such as subsidies to fi rms, reductions in corporate and income tax rates) are likely to have only a moderate short-term effect on growth and jobs. Moreover, in countries with a large informal economy, such as Indonesia, the benefi ts of tax breaks will have limited reach and are likely to be captured by the relatively well-off, who have lower propensities to spend than liquidity-constrained businesses, poor households and unemployed individuals. On the other hand, if fi scal stimulus measures target such liquidity-constrained groups who are likely to spend more, then the short-term multiplier effect of the stimulus is likely to be higher.
Furthermore, in undertaking fi scal stimulus policy measures, it is also critical to take into account both the short-term impact on aggregate demand and measures to enhance economies’ growth potential in the medium and long term. In this respect, a focus on maintaining productive employment, income and household purchasing power combined with supply-side measures including education and skills training and other active labour market policies crisis provide for more comprehensive crisis response and recovery measures.
The second key policy implication is the critical need for unemployment insurance in Indonesia. The government’s strong policy response has included infrastructure development, which is critical for providing jobs, in particular for the unskilled. The government has also put in place various social assistance programmes for the poor, which have been strengthened as a result of the crisis. What is missing, however, is protection for the semi-skilled, in particular for women and the near-poor.24 They do not
22
22 ILO: The Financial and Economic Crisis: A Decent Work Response (Geneva, 2009), pp. 30-31.23 Antonio Spilimbergo et al: Fiscal Policy for the Crisis, IMF Staff Position Note SPN/08/2008
(Washington, DC, IMF, December 2008).24 Job creation through infrastructure works might result in a gender-specifi c job creation effect
as they traditionally attract male workers.
A stronger focus on productive and decent employment
A critical need for unemployment
insurance

Labour and Social Trends in Indonesia 2009
qualify for the social assistance programmes for the poor and, given their relatively higher skill levels, the lower skilled jobs in infrastructure often do not represent appealing alternatives. Furthermore, as infrastructure works typically attract mainly male workers, they cannot suffi ciently absorb the large number of women who have been laid off in export-oriented industries. For these groups, unemployment insurance can function as an automatic stabilizer that may cushion the impact of the economic shock and help maintain aggregate demand. Unemployment insurance could also slow down the transmission of the crisis from urban to rural areas, especially in countries where large numbers of rural migrants have lost jobs in export-oriented industries.
The initial introduction of a basic unemployment insurance scheme in Indonesia would be an important step both toward protecting workers and supporting domestic demand during crisis. Progressively, the basic system could be strengthened and its responsiveness strengthened during downturns and unemployment peaks, for example by extending the period of cover, or relaxing the qualifying requirements on a temporary basis. Furthermore, linking unemployment insurance with active labour market policies including training, job search assistance and career guidance can provide both a cushion and a bounce to vulnerable groups.
Indonesia has instead relied on severance payments for providing income security in case of job loss. Severance payments, however, may fail to provide suffi cient income security, especially when companies become insolvent, and are seldom linked with active labour market policies.25 Furthermore, severance payments are often not honoured. Unemployment insurance is an important element of a social fl oor, an issue that is discussed in the next chapter.
The third key policy implication is the critical need for social dialogue in designing policy responses. During a crisis, social dialogue can help improve the design of the crisis response measures at enterprise, industry and national levels, as well as provide political support for the fi scal packages and other government policies. Dialogue between the tripartite partners can also serve to identify negotiated solutions to key challenges for the long term. Such dialogue and collective bargaining can help avoid social unrest, steer clear of damaging industrial disputes, reduce inequalities in income distribution, and forge social cohesion.
Article 107 of Act No. 13 of 2003 concerning Manpower calls for the formation of Tripartite Cooperation Institutions (LKS Tripartit) at the district, provincial, and national levels. These institutions serve as the forum for communication, consultation, and deliberation between the government
25 D. MacIsaac and M. Rama: Mandatory Severance Pay in Peru: An Assessment of its Coverage Using Panel Data (World Bank, Washington, DC, 2006).
Social dialogue is essential
23
Labour and Social Trends in Indonesia 2009
and social partners. As of May 2009 there were 29 such institutions at the national level and 195 at the district level. However, both the Tripartite Cooperation Institutions and the industrial relations regime in general require further support and strengthening.
The crisis has also highlighted the importance of labour market information and statistics. Such up-to-date and gender- and age- specifi c information is critical for informed decision making and in social dialogue between the government, employers and workers. They serve in the close monitoring of the labour market, in detecting early signs of changes and in adequately designing and allocating resources for policy responses. Furthermore, they assist employers in their operational decisions and job seekers in their labour market choices.
Better labour market information and statistics needed
Box 1.7A Global Jobs Pact
In the wake of the global fi nancial, economic and jobs crisis, the tripartite constituents of the ILO in June 2009 adopted a Global Jobs Pact, designed to guide national and international policies aimed at stimulating economic recovery, job preservation and creation and providing protection to workers and their families. The Global Jobs Pact provides for a range of crisis response measures that countries can adapt to their specifi c needs and situations. Such measures include:
1. Devoting priority attention to protecting and growing employment through sustainable enterprises, quality public services and building adequate social protection for all as part of ongoing international and national action to aid recovery and development;
2. Enhancing support to vulnerable women and men hit hard by the crisis, including youth at risk, and low-wage, low-skilled, informal economy and migrant workers;
3. Focusing on measures to maintain employment and facilitate transitions from one job to another as well as to support access to the labour market for those without a job;
4. Establishing or strengthening effective public employment services and other labour market institutions;
5. Increasing equal access and opportunities for skills development, quality training and education to prepare for recovery;
6. Avoiding protectionist solutions as well as the damaging consequences of defl ationary wage spirals and worsening working conditions;
24

Labour and Social Trends in Indonesia 2009
7. Promoting core labour standards and other international labour standards that support the economic and jobs recovery and reduce gender inequality;
8. Engaging in social dialogue, such as tripartism and collective bargaining between employers and workers, as constructive processes to maximize the impact of crisis responses to the needs of the real economy;
9. Ensuring that short-term actions are coherent with economic, social and environmental sustainability;
10. Ensuring synergies between the state and the market and the effective and effi cient regulation of market economies, including a legal and regulatory environment that enables enterprise creation, sustainable enterprises and promotes employment generation across sectors; and
11. The ILO engaging with other international agencies, international fi nancial institutions and developed countries to strengthen policy coherence and to deepen development assistance and support for least developed, developing and transition countries with restricted fi scal and policy space to respond to the crisis.
For further information, see: ILO: Recovering from the crisis: A Global Jobs Pact (Geneva, 2009)
25

Labour and Social Trends in Indonesia 2009
26
Beyond the crisis: Strengthening the
foundations for job-rich development
2
Progressively building a social floor
26 See ILO: Labour and Social Trends in Indonesia: Progress and Pathways to Job-rich Development (Jakarta, 2008).
The current global crisis has accentuated some of the labour and social opportunities and challenges identifi ed in last year’s Labour and Social Trends in Indonesia report.26 It has also revealed a number of other emerging drivers of a more inclusive, sustainable and job-rich growth in Indonesia. This section takes a look at these issues.
2.1 A social floor
The impacts of the global crisis in Indonesia have highlighted the importance of supporting workers and their families through well-designed social protection policies. Section 1.5 examined the immediate need for unemployment insurance, and this section looks at other aspects of social protection mechanisms with a view to gradually developing an effective social protection fl oor over time. Such a social protection fl oor includes improved access to employment opportunities; affordable access to basic health care, protection and education for children, the elderly and people with disabilities; social assistance for the poor or the unemployed and other features that vary according to country needs and stages of development.
27
Labour and Social Trends in Indonesia 2009
Protection for those in the informal
economy
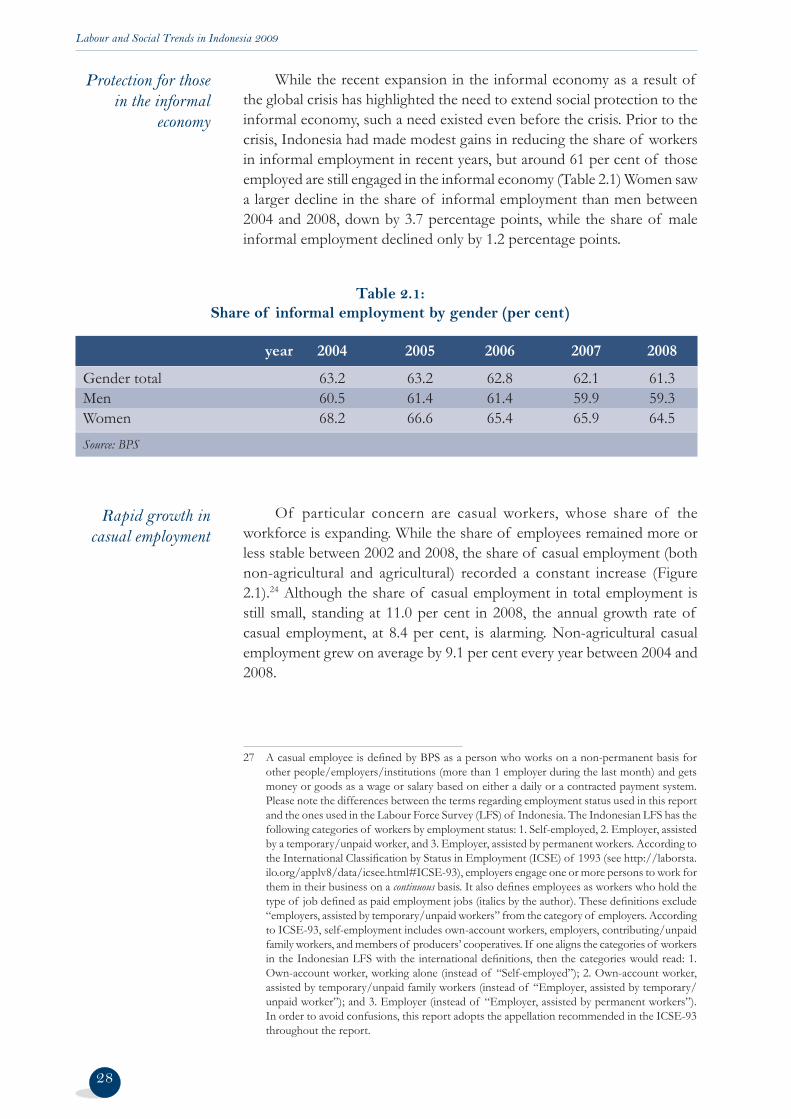
While the recent expansion in the informal economy as a result of the global crisis has highlighted the need to extend social protection to the informal economy, such a need existed even before the crisis. Prior to the crisis, Indonesia had made modest gains in reducing the share of workers in informal employment in recent years, but around 61 per cent of those employed are still engaged in the informal economy (Table 2.1) Women saw a larger decline in the share of informal employment than men between 2004 and 2008, down by 3.7 percentage points, while the share of male informal employment declined only by 1.2 percentage points.
Rapid growth in casual employment
Of particular concern are casual workers, whose share of the workforce is expanding. While the share of employees remained more or less stable between 2002 and 2008, the share of casual employment (both non-agricultural and agricultural) recorded a constant increase (Figure 2.1).24 Although the share of casual employment in total employment is still small, standing at 11.0 per cent in 2008, the annual growth rate of casual employment, at 8.4 per cent, is alarming. Non-agricultural casual employment grew on average by 9.1 per cent every year between 2004 and 2008.
27 A casual employee is defi ned by BPS as a person who works on a non-permanent basis for other people/employers/institutions (more than 1 employer during the last month) and gets money or goods as a wage or salary based on either a daily or a contracted payment system. Please note the differences between the terms regarding employment status used in this report and the ones used in the Labour Force Survey (LFS) of Indonesia. The Indonesian LFS has the following categories of workers by employment status: 1. Self-employed, 2. Employer, assisted by a temporary/unpaid worker, and 3. Employer, assisted by permanent workers. According to the International Classifi cation by Status in Employment (ICSE) of 1993 (see http://laborsta.ilo.org/applv8/data/icsee.html#ICSE-93), employers engage one or more persons to work for them in their business on a continuous basis. It also defi nes employees as workers who hold the type of job defi ned as paid employment jobs (italics by the author). These defi nitions exclude “employers, assisted by temporary/unpaid workers” from the category of employers. According to ICSE-93, self-employment includes own-account workers, employers, contributing/unpaid family workers, and members of producers’ cooperatives. If one aligns the categories of workers in the Indonesian LFS with the international defi nitions, then the categories would read: 1. Own-account worker, working alone (instead of “Self-employed”); 2. Own-account worker, assisted by temporary/unpaid family workers (instead of “Employer, assisted by temporary/unpaid worker”); and 3. Employer (instead of “Employer, assisted by permanent workers”). In order to avoid confusions, this report adopts the appellation recommended in the ICSE-93 throughout the report.
28
Table 2.1: Share of informal employment by gender (per cent)
year 2004 2005 2006 2007 2008
Gender total 63.2 63.2 62.8 62.1 61.3Men 60.5 61.4 61.4 59.9 59.3Women 68.2 66.6 65.4 65.9 64.5Source: BPS

Labour and Social Trends in Indonesia 2009
Figure 2.1 Share in employment by status in employment
Source: BPS
0
5
10
15
20
25
30
Own-account worker (OAW), working alone
OAW, assisted by
temporary or unpaid worker
Employee Casual worker
Unpaid worker
Employer
Per c
ent
200220062008
Some progress has been achieved in building a social fl oor in Indonesia. The National Social Security System Law (Law No. 40/2004) in particular represents a landmark milestone. The Law overhauls the existing social protection programmes in view of creating a universal coverage social security system and seeks to protect against risks associated with old age, illness, work-related injury and death. The Law, however, is awaiting elaboration and implementation. Its implementation, particularly for workers in the informal economy, coupled with other elements of a social fl oor, including social assistance programmes for the vulnerable, employment-intensive approaches for infrastructure development and unemployment insurance and/or employment guarantee schemes, will play a vital role in providing the necessary reassurance for innovation and the foundation for productivity growth in Indonesia.
Box 2.1Flexicurity
The debate on the balance between security and flexibility has a long history, and mainstream views have vacillated between the ‘institutionalist’ view and the ‘(neo-)liberalist’ view. The former emphasizes the role of the state and social partners in correcting market failures, while the latter underscores the market mechanism. The post-war welfare states were built on the former view and developed labour market institutions. Corporatism supported the function of welfare states. As the welfare state model stumbled over high unemployment and
29
Labour and Social Trends in Indonesia 2009
rising public expenditure after the two oil crises, neo-liberalism gradually dominated the mainstream economic ideology. Indeed, the OECD’s Job Study was motivated by the conviction that labour market rigidity reduced labour market performance. Deregulation of the labour market became a popular line of policy. The strong economic performance of the United States was often used as evidence in advocating greater reliance on the market mechanism. After a decade-long debate over employment protection legislation, researchers—including the OECD itself—came to the conclusion that labour market rigidity had little to do with the overall unemployment.
Flexicurity is a concept that promotes an optimal balance between the two demands; security for workers against various risks in the labour market and fl exibility of the labour market that fosters an enabling business environment. The question is where the equilibrium lies. The ILO, the European Union (EU) and academia have already initiated research on the balance. Research fi ndings unanimously pointed out that constructive social dialogue can seek an optimal balance of security and fl exibility in the labour market since the equilibrium is country-specifi c, depending on existing labour market institutions, tax regimes, and other factors. In fact, cooperative industrial relations and higher coverage of collective bargaining are conducive to fl exicurity. European countries aim to combine social security and active labour market policies (e.g. employment services and training) with dynamic labour markets, which entails the shift from job/employment protection to labour market protection that relies on a broader shoulder of the society. Denmark and the Netherlands are often cited as model countries for fl exicurity.
Source: P. Auer and K. Chatani: “Negotiating fl exicurity” in S. Hayter, ed.: Negotiating for Social Justice (ILO, forthcoming).
Box 2.2Social Protection in Indonesia: A glimpse28
The employees’ social insurance fund (Jamsostek), launched in 1992, covers the risks of old age, work-related disability and injury, sickness and death.29 The scheme is intended to cover employees in companies with more than 10 employees or employees earning more than Rp. 1 million (USD 100) in the private sector. Nonetheless, it covers only a small proportion of workers in the formal economy. Similar but obligatory arrangements were installed for public sector employees (Taspen) and the police and personnel in the armed forces (Asabri).
28 See GTZ: Options for Social Protection Reform in Indonesia (Jakarta, 2008) for a comprehensive overview of the social protection system in Indonesia.
29 For details see: Act No. 3 of 1992 concerning employees’ social security.
30
Labour and Social Trends in Indonesia 2009
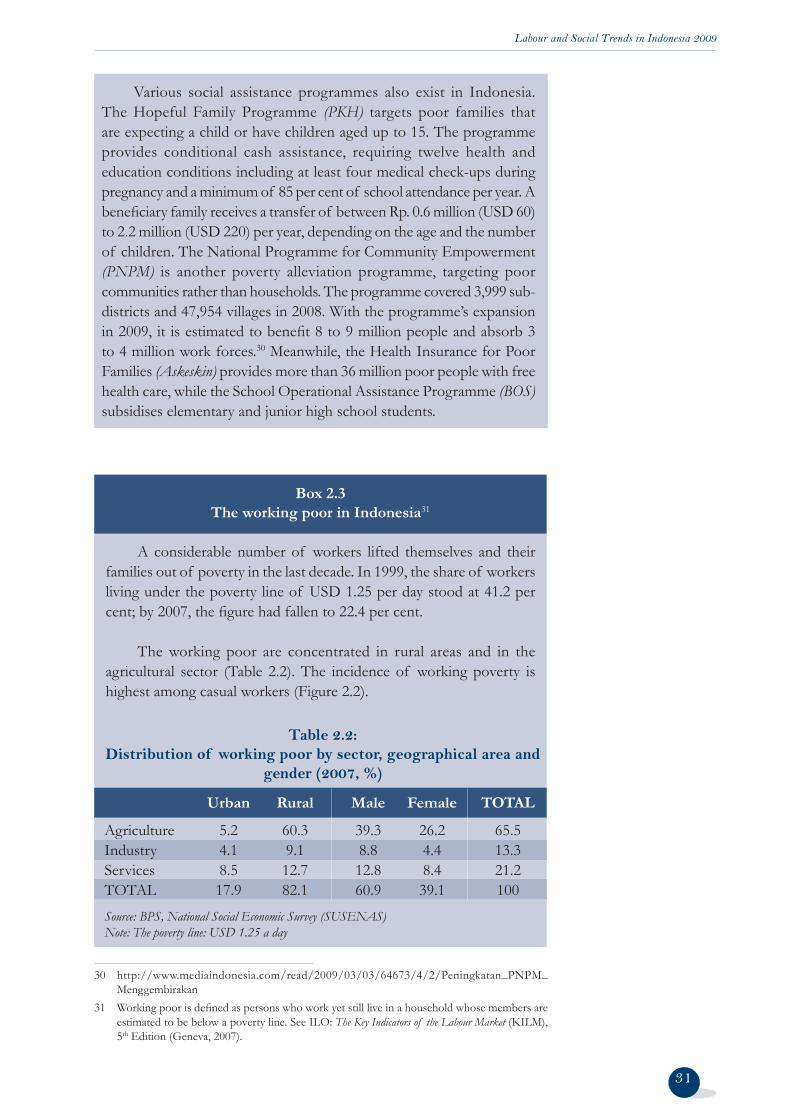
Various social assistance programmes also exist in Indonesia. The Hopeful Family Programme (PKH) targets poor families that are expecting a child or have children aged up to 15. The programme provides conditional cash assistance, requiring twelve health and education conditions including at least four medical check-ups during pregnancy and a minimum of 85 per cent of school attendance per year. A benefi ciary family receives a transfer of between Rp. 0.6 million (USD 60) to 2.2 million (USD 220) per year, depending on the age and the number of children. The National Programme for Community Empowerment (PNPM) is another poverty alleviation programme, targeting poor communities rather than households. The programme covered 3,999 sub-districts and 47,954 villages in 2008. With the programme’s expansion in 2009, it is estimated to benefi t 8 to 9 million people and absorb 3 to 4 million work forces.30 Meanwhile, the Health Insurance for Poor Families (Askeskin) provides more than 36 million poor people with free health care, while the School Operational Assistance Programme (BOS) subsidises elementary and junior high school students.
30 http://www.mediaindonesia.com/read/2009/03/03/64673/4/2/Peningkatan_PNPM_Menggembirakan
31 Working poor is defi ned as persons who work yet still live in a household whose members are estimated to be below a poverty line. See ILO: The Key Indicators of the Labour Market (KILM), 5th Edition (Geneva, 2007).
Box 2.3The working poor in Indonesia31
A considerable number of workers lifted themselves and their families out of poverty in the last decade. In 1999, the share of workers living under the poverty line of USD 1.25 per day stood at 41.2 per cent; by 2007, the fi gure had fallen to 22.4 per cent.
The working poor are concentrated in rural areas and in the agricultural sector (Table 2.2). The incidence of working poverty is highest among casual workers (Figure 2.2).
Table 2.2: Distribution of working poor by sector, geographical area and
gender (2007, %)
Urban Rural Male Female TOTAL
Agriculture 5.2 60.3 39.3 26.2 65.5 Industry 4.1 9.1 8.8 4.4 13.3 Services 8.5 12.7 12.8 8.4 21.2 TOTAL 17.9 82.1 60.9 39.1 100Source: BPS, National Social Economic Survey (SUSENAS)Note: The poverty line: USD 1.25 a day
31

Labour and Social Trends in Indonesia 2009
Figure 2.2 Incidence of working poor by employment status
(poverty line: USD1.25 per day, 2007)
Source: BPS, SUSENAS
2.2 Structural shifts in employment
Favourable economic conditions fostered employment growth between 2004 and 2008. During this period, employment growth (total 9.4, men 5.5 and women 16.6 per cent) surpassed labour force growth (total 7.7, men 4.9 and women 12.5 per cent), creating room for the absorption of new labour market entrants and lowering the open unemployment rate (Annex II).32 Recent years have also seen success in creating jobs for youth (aged 15 to 24 years). The youth unemployment rate charted a remarkable drop between 2004 and 2008, from 29.6 per cent to 23.3 per cent (men 26.9 to 21.8, women 33.5 to 25.5). This success was partly due to an increase in the enrolment rate in secondary and tertiary education.33 Had the labour participation rate in 2008 been the same as it was in 2004, the drop in the youth unemployment rate would have been modest.34 Overall, the youth employment-to-population ratio remained largely stable (Figure 2.3).
32 Unemployment represents only one aspect of labour market performance. Attention should be paid to multiple facets of the underperforming labour market (e.g. long working hours, low female labour participation, high underemployment, the large share of informal employment in total employment). See I. Islam and A. Chowdhury: “Enunciating a national employment strategy for Indonesia – what do we know and what should we do?” ILO Jakarta Working Paper (Jakarta, 2008).
33 See ILO: Labour and Social Trends in Indonesia: Progress and Pathways to Job-rich Development (Jakarta, 2008).
34 If one assumes the same labour participation rates in 2004 and 2008, youth unemployment rates in 2008 would have been as follows: gender total 27.9, men 26.9 and women 30.0 per cent.
Employment boosted by economic growth
32
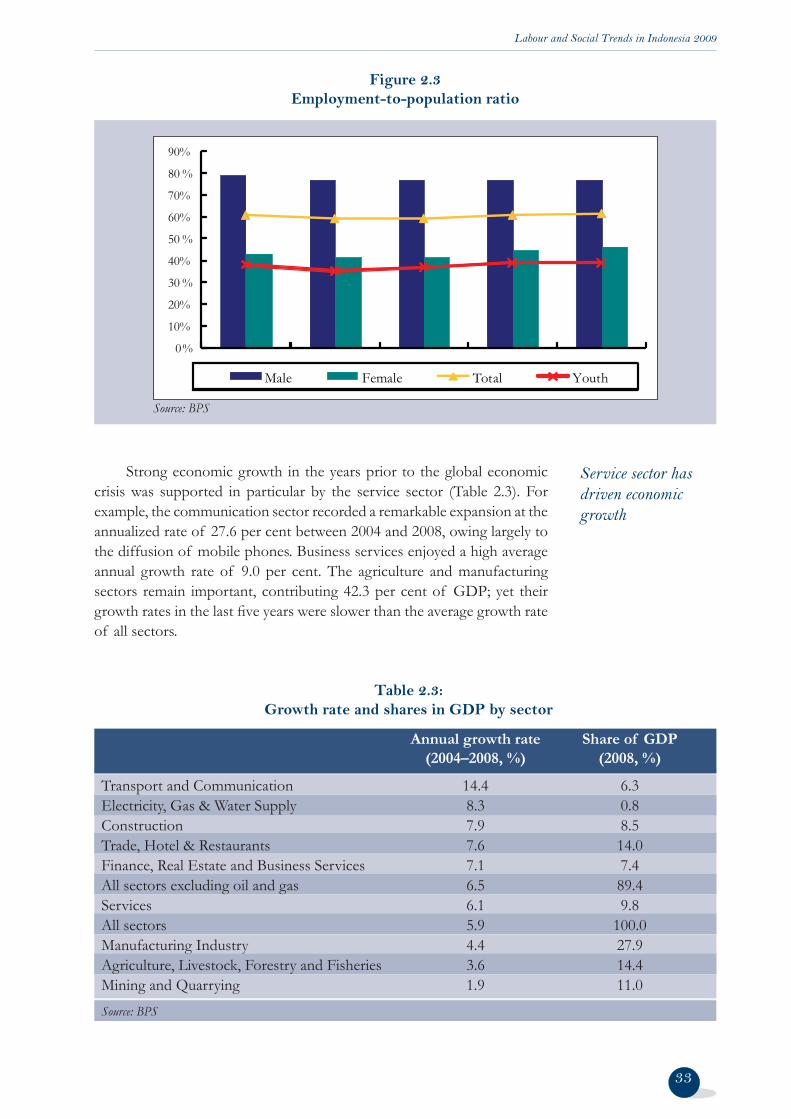
Labour and Social Trends in Indonesia 2009
Service sector has driven economic growth
Source: BPS
Figure 2.3 Employment-to-population ratio
0%
10%
20%
30 %
40%
50 %
60%
70%
80 %
90%
2004 2005 2006 2007 2008Male Female Total Youth
Strong economic growth in the years prior to the global economic crisis was supported in particular by the service sector (Table 2.3). For example, the communication sector recorded a remarkable expansion at the annualized rate of 27.6 per cent between 2004 and 2008, owing largely to the diffusion of mobile phones. Business services enjoyed a high average annual growth rate of 9.0 per cent. The agriculture and manufacturing sectors remain important, contributing 42.3 per cent of GDP; yet their growth rates in the last fi ve years were slower than the average growth rate of all sectors.
33
Table 2.3: Growth rate and shares in GDP by sector
Annual growth rate Share of GDP (2004–2008, %) (2008, %)
Transport and Communication 14.4 6.3 Electricity, Gas & Water Supply 8.3 0.8 Construction 7.9 8.5 Trade, Hotel & Restaurants 7.6 14.0 Finance, Real Estate and Business Services 7.1 7.4 All sectors excluding oil and gas 6.5 89.4 Services 6.1 9.8 All sectors 5.9 100.0 Manufacturing Industry 4.4 27.9 Agriculture, Livestock, Forestry and Fisheries 3.6 14.4 Mining and Quarrying 1.9 11.0 Source: BPS
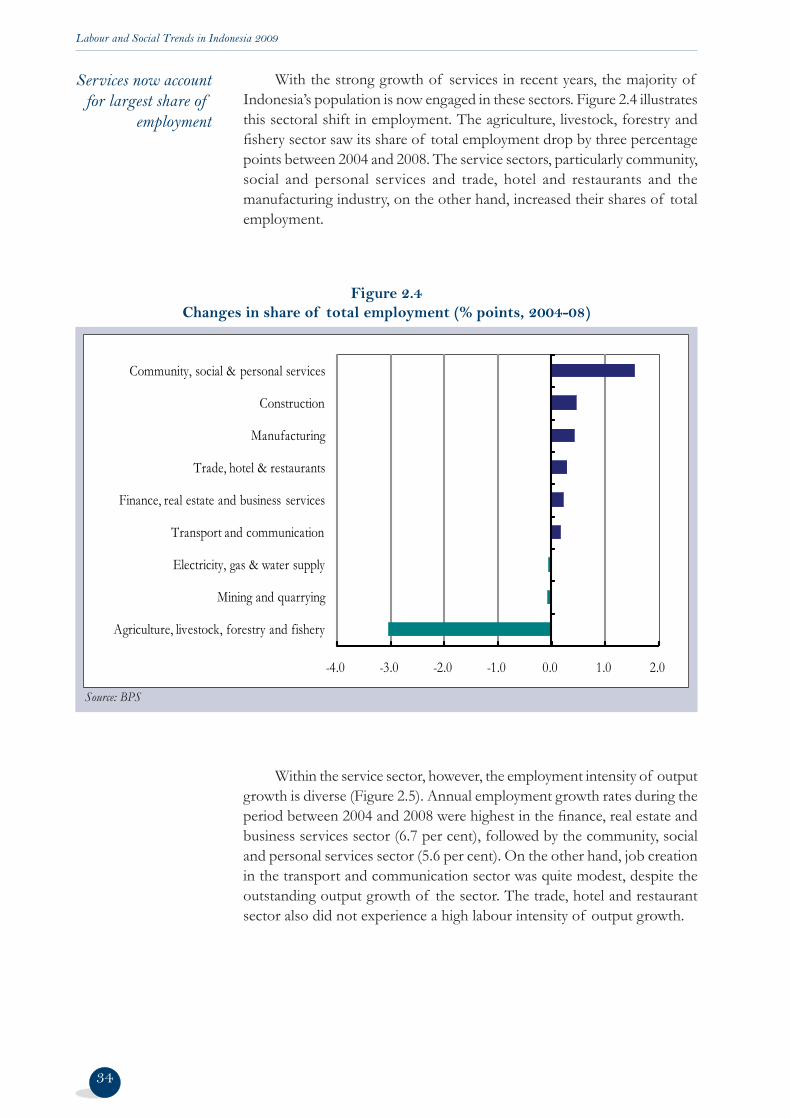
Labour and Social Trends in Indonesia 2009
Services now account for largest share of
employment
34
With the strong growth of services in recent years, the majority of Indonesia’s population is now engaged in these sectors. Figure 2.4 illustrates this sectoral shift in employment. The agriculture, livestock, forestry and fi shery sector saw its share of total employment drop by three percentage points between 2004 and 2008. The service sectors, particularly community, social and personal services and trade, hotel and restaurants and the manufacturing industry, on the other hand, increased their shares of total employment.
Figure 2.4 Changes in share of total employment (% points, 2004-08)
Source: BPS
-4.0 -3.0 -2.0 -1.0 0.0 1.0 2.0
Agriculture, livestock, forestry and fishery
Mining and quarrying
Electricity, gas & water supply
Transport and communication
Finance, real estate and business services
Trade, hotel & restaurants
Manufacturing
Construction
Community, social & personal services
Within the service sector, however, the employment intensity of output growth is diverse (Figure 2.5). Annual employment growth rates during the period between 2004 and 2008 were highest in the fi nance, real estate and business services sector (6.7 per cent), followed by the community, social and personal services sector (5.6 per cent). On the other hand, job creation in the transport and communication sector was quite modest, despite the outstanding output growth of the sector. The trade, hotel and restaurant sector also did not experience a high labour intensity of output growth.
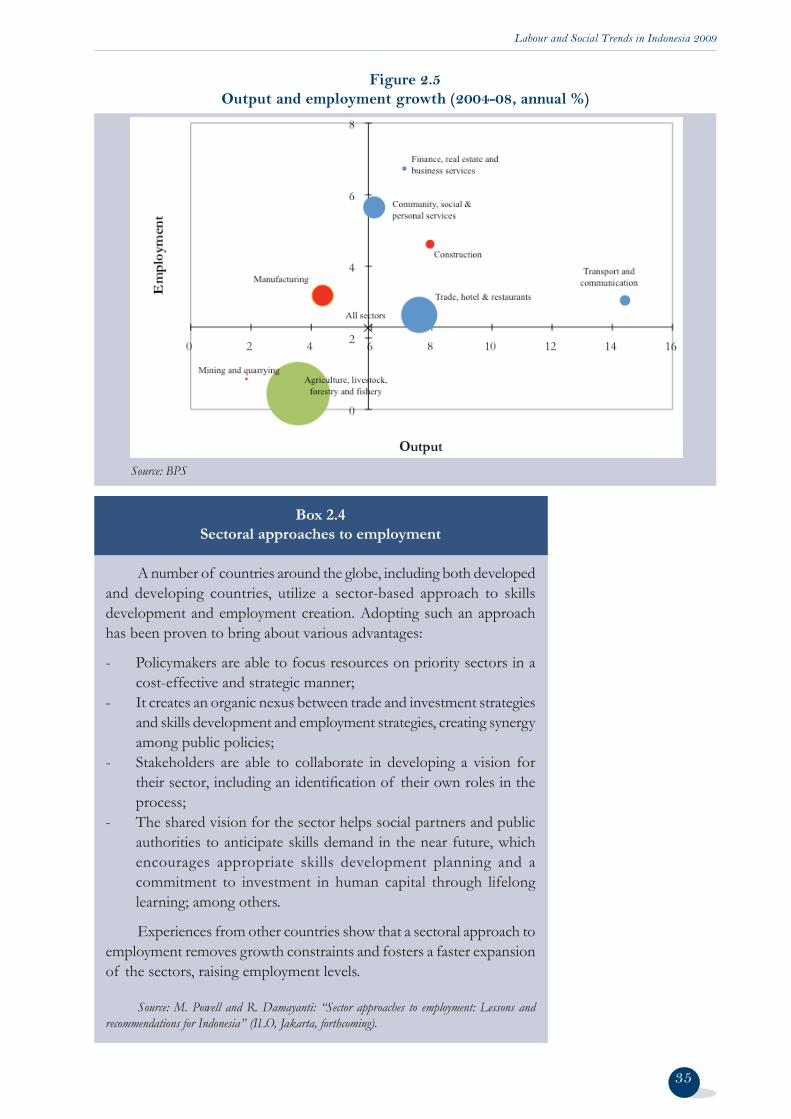
Labour and Social Trends in Indonesia 2009
35
Figure 2.5 Output and employment growth (2004-08, annual %)
Source: BPS
Box 2.4Sectoral approaches to employment
A number of countries around the globe, including both developed and developing countries, utilize a sector-based approach to skills development and employment creation. Adopting such an approach has been proven to bring about various advantages:
- Policymakers are able to focus resources on priority sectors in a cost-effective and strategic manner;
- It creates an organic nexus between trade and investment strategies and skills development and employment strategies, creating synergy among public policies;
- Stakeholders are able to collaborate in developing a vision for their sector, including an identifi cation of their own roles in the process;
- The shared vision for the sector helps social partners and public authorities to anticipate skills demand in the near future, which encourages appropriate skills development planning and a commitment to investment in human capital through lifelong learning; among others.
Experiences from other countries show that a sectoral approach to employment removes growth constraints and fosters a faster expansion of the sectors, raising employment levels.
Source: M. Powell and R. Damayanti: “Sector approaches to employment: Lessons and recommendations for Indonesia” (ILO, Jakarta, forthcoming).

Labour and Social Trends in Indonesia 2009
Investment in agriculture and
growth sectors is required to drive structural change and productivity
growth
35 “Fuel subsidies overseas take a toll on US”, in The New York Times, 28 July 2008.36 For example, the hourly labour cost in the garment sector: Indonesia USD 0.50, Vietnam USD
0.38, Pakistan USD 0.37 and Cambodia USD 0.33. Source: The Jakarta Post “Radical changes needed in RI garment industry”, 06 May 2009.
36
The structural shift in employment away from agriculture to higher value-added services can be a key driver in increasing labour productivity, raising living standards and poverty reduction. In this regard, facilitating labour mobility across sectors should be a key policy concern. This can be accomplished through increased investment in the agriculture sector with a view to raising productivity in agriculture. Government expenditures on energy subsidies in Indonesia are approximately six times larger than public investment in agriculture, indicating scope for reallocation of investment that could promote agricultural productivity and benefi cial structural change.35 At the same time, even if increased investment in agriculture leads to increased productivity, freeing up additional agricultural labour, structural change will not take place unless there are employment opportunities in higher productivity industries. As such, policies to channel domestic savings and attract investment into industries with high potential for economic growth and employment generation are also required. Furthermore, such structural change can only take place if the workforce is equipped with the relevant skills to move across sectors, an issue that is examined next.
2.3 Improving workforce quality
As the sectoral composition of employment changes, the skills demanded in the labour market are shifting accordingly. For example, the growing service sectors demand specifi c sets of skills such as computer literacy and customer-oriented mindsets. In addition, as a middle-income economy, Indonesia is losing its labour cost advantage, and industries are requiring an increasingly skilled workforce to perform more capital-intensive and value-added production.36 Matching the skills of the workforce to the needs of these industries has emerged as both an opportunity and a challenge in the labour market. In this regard, the education and vocational training system play a critical role in preparing the workforce to effectively adjust to structural shifts, changing technologies and volatile economic landscapes.
Skills development critical in supporting
a structural shift

Labour and Social Trends in Indonesia 2009
Rising returns to education
37 ILO: Labour and Social Trends in ASEAN 2008: Driving Competitiveness and Prosperity with Decent Work (ILO, Bangkok, 2008).
38 Ibid.
37
Focus on retention, secondary school and beyond required
Signifi cant progress has been made in enhancing access to primary education (Table 2.4), with the primary net enrolment rate now exceeding 95 per cent. There is, however, much scope to ensure that children remain in primary school and then subsequently make the transition to secondary school. Furthermore, the net enrolment rate at the secondary level is only around 59 per cent. This raises concerns as it is at this point in the education system that young people can acquire the skills, training and knowledge required to meet the demands of a labour market shorting towards services-based employment.37 Tertiary education is also critical in ensuring a workforce with the advanced and specialized skills needed for a knowledge economy. In Indonesia, however, only 6.5 per cent had attained some level of tertiary education. This compares to 14.2 per cent in Thailand and 33.6 per cent in the Republic of Korea.38
Educational attainment is becoming all the more essential as the returns on education are on the rise. This is evidenced by the widening gap in hourly average wages between workers with a primary education and those with a university degree (Figure 2.5). The wage ratio between the two categories of workers was 1 to 3.5 in 1998; it reached 4.4 in 2008. Such a trend can provide a strong incentive to pursue higher education, but can also be a potential threat to social cohesion if income inequality expands further.
Table 2.4: Key education indicators (percentages)
Source: UNESCO Institute for Statistics
Net enrolment rate, primary(2006)
95.5
Survival rate to grade 5(2005)
84.4
Transition from primary to lower secondary(2005)
88.5
Net enrolment rate, secondary (2006)
59.0
Technical vocational enrolment as share of secondary enrolment(2005)
13.6

Labour and Social Trends in Indonesia 2009
39 For a discussion on learning outcomes in Indonesia based on the Programme for International Student Assessment (PISA) surveys of the Organization for Economic Cooperation and Development (OECD), see ILO: Labour and Social Trends in Indonesia 2008: Progress and Pathways to job-rich development (Jakarta, 2008).
40 ILO: Labour and Social Trends in ASEAN 2008: Driving Competitiveness and Prosperity with Decent Work (ILO, Bangkok, 2008).
38
Figure 2.6 Hourly nominal wages by educational attainment
Source: BPS
Quality of education is also key
While increasing educational attainment at all levels is essential, it is also critical to improve the quality of education and training. In this regard, as highlighted in last year’s report, a substantial number of Indonesian students may not be acquiring the knowledge and skills needed in adult life and for the labour market.39 Among those who enrol in secondary education in Indonesia, around 14 per cent are estimated to be pursuing technical and vocational training. The vocational education and training (TVET) system, however, is also struggling with the problems of ineffective curriculums, weak capacity, shortage of qualifi ed training instructors, outdated training equipment and inadequate links between training providers and private-sector demand for skilled labour.40 With weak competency standards and an inadequate national qualifi cation framework in Indonesia, employers are fi nding it diffi cult to assess the competencies and skill levels of job seekers. Effective employment services backed by modern and effi cient labour market information systems would also serve to better match the workers’ skills with jobs.
With collaboration between the government, social partners, educational institutions and training providers, there is scope for further support to education and vocational training systems in Indonesia in order to unleash the country’s growth potential.
0
2,000
4,000
6,000
8,000
10,000
12,000
14,000
16,000
1998 2000 2002 2004 2006 2008
Rp.
Primary school
Junior high school(General)
(Senior) high school(Generall)
(Senior) high school(vocational)
University
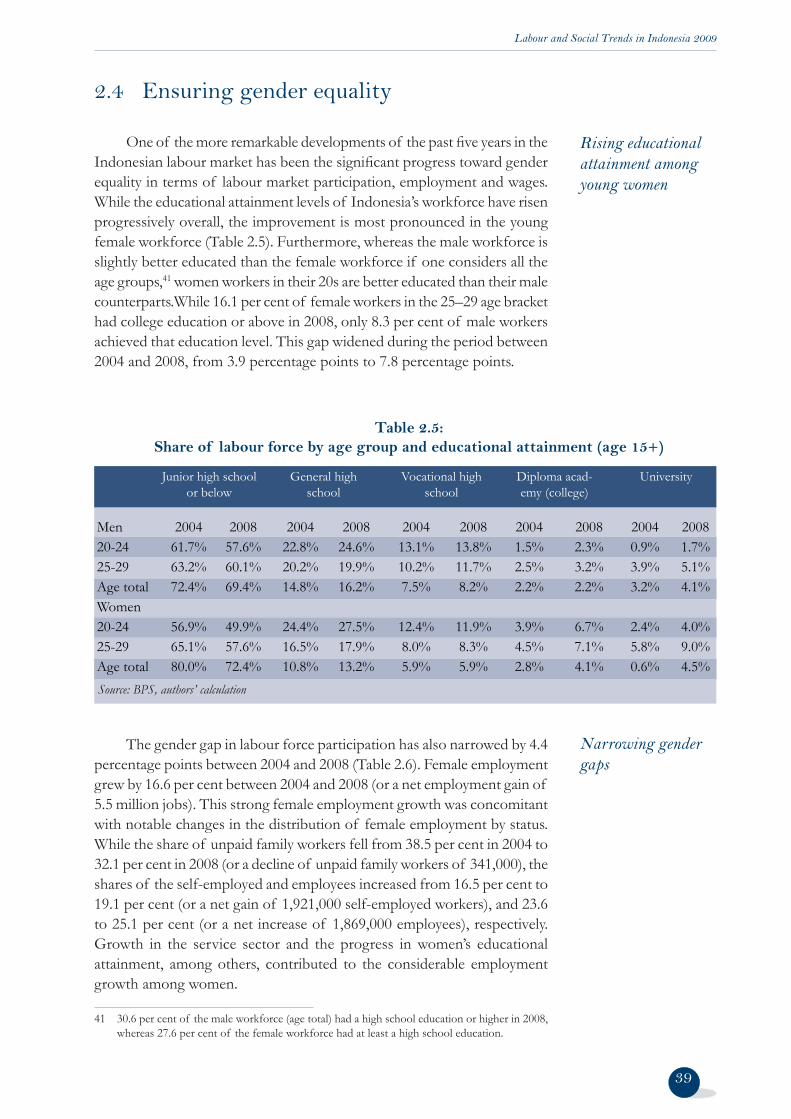
Labour and Social Trends in Indonesia 2009
Rising educational attainment among young women
41 30.6 per cent of the male workforce (age total) had a high school education or higher in 2008, whereas 27.6 per cent of the female workforce had at least a high school education.
39
2.4 Ensuring gender equality
One of the more remarkable developments of the past fi ve years in the Indonesian labour market has been the signifi cant progress toward gender equality in terms of labour market participation, employment and wages. While the educational attainment levels of Indonesia’s workforce have risen progressively overall, the improvement is most pronounced in the young female workforce (Table 2.5). Furthermore, whereas the male workforce is slightly better educated than the female workforce if one considers all the age groups,41 women workers in their 20s are better educated than their male counterparts.While 16.1 per cent of female workers in the 25–29 age bracket had college education or above in 2008, only 8.3 per cent of male workers achieved that education level. This gap widened during the period between 2004 and 2008, from 3.9 percentage points to 7.8 percentage points.
Narrowing gender gaps
The gender gap in labour force participation has also narrowed by 4.4 percentage points between 2004 and 2008 (Table 2.6). Female employment grew by 16.6 per cent between 2004 and 2008 (or a net employment gain of 5.5 million jobs). This strong female employment growth was concomitant with notable changes in the distribution of female employment by status. While the share of unpaid family workers fell from 38.5 per cent in 2004 to 32.1 per cent in 2008 (or a decline of unpaid family workers of 341,000), the shares of the self-employed and employees increased from 16.5 per cent to 19.1 per cent (or a net gain of 1,921,000 self-employed workers), and 23.6 to 25.1 per cent (or a net increase of 1,869,000 employees), respectively. Growth in the service sector and the progress in women’s educational attainment, among others, contributed to the considerable employment growth among women.
Source: BPS, authors’ calculation
Table 2.5: Share of labour force by age group and educational attainment (age 15+)
Men 2004 2008 2004 2008 2004 2008 2004 2008 2004 200820-24 61.7% 57.6% 22.8% 24.6% 13.1% 13.8% 1.5% 2.3% 0.9% 1.7%25-29 63.2% 60.1% 20.2% 19.9% 10.2% 11.7% 2.5% 3.2% 3.9% 5.1%Age total 72.4% 69.4% 14.8% 16.2% 7.5% 8.2% 2.2% 2.2% 3.2% 4.1%Women 20-24 56.9% 49.9% 24.4% 27.5% 12.4% 11.9% 3.9% 6.7% 2.4% 4.0%25-29 65.1% 57.6% 16.5% 17.9% 8.0% 8.3% 4.5% 7.1% 5.8% 9.0%Age total 80.0% 72.4% 10.8% 13.2% 5.9% 5.9% 2.8% 4.1% 0.6% 4.5%
Junior high school or below
General high school
Vocational high school
Diploma acad-emy (college)
University
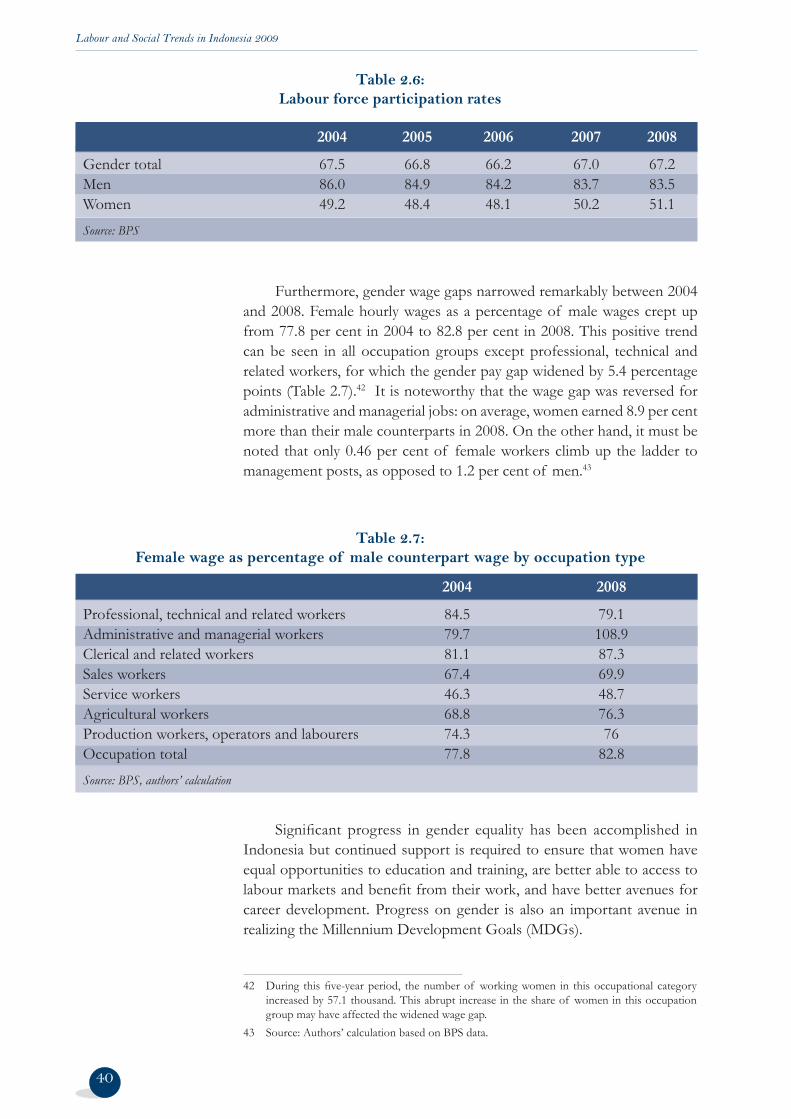
Labour and Social Trends in Indonesia 2009
40
Table 2.6: Labour force participation rates
2004 2005 2006 2007 2008
Gender total 67.5 66.8 66.2 67.0 67.2 Men 86.0 84.9 84.2 83.7 83.5 Women 49.2 48.4 48.1 50.2 51.1 Source: BPS
Furthermore, gender wage gaps narrowed remarkably between 2004 and 2008. Female hourly wages as a percentage of male wages crept up from 77.8 per cent in 2004 to 82.8 per cent in 2008. This positive trend can be seen in all occupation groups except professional, technical and related workers, for which the gender pay gap widened by 5.4 percentage points (Table 2.7).42 It is noteworthy that the wage gap was reversed for administrative and managerial jobs: on average, women earned 8.9 per cent more than their male counterparts in 2008. On the other hand, it must be noted that only 0.46 per cent of female workers climb up the ladder to management posts, as opposed to 1.2 per cent of men.43
42 During this fi ve-year period, the number of working women in this occupational category increased by 57.1 thousand. This abrupt increase in the share of women in this occupation group may have affected the widened wage gap.
43 Source: Authors’ calculation based on BPS data.
Table 2.7: Female wage as percentage of male counterpart wage by occupation type
2004 2008
Professional, technical and related workers 84.5 79.1Administrative and managerial workers 79.7 108.9Clerical and related workers 81.1 87.3Sales workers 67.4 69.9Service workers 46.3 48.7Agricultural workers 68.8 76.3Production workers, operators and labourers 74.3 76Occupation total 77.8 82.8 Source: BPS, authors’ calculation
Signifi cant progress in gender equality has been accomplished in Indonesia but continued support is required to ensure that women have equal opportunities to education and training, are better able to access to labour markets and benefi t from their work, and have better avenues for career development. Progress on gender is also an important avenue in realizing the Millennium Development Goals (MDGs).
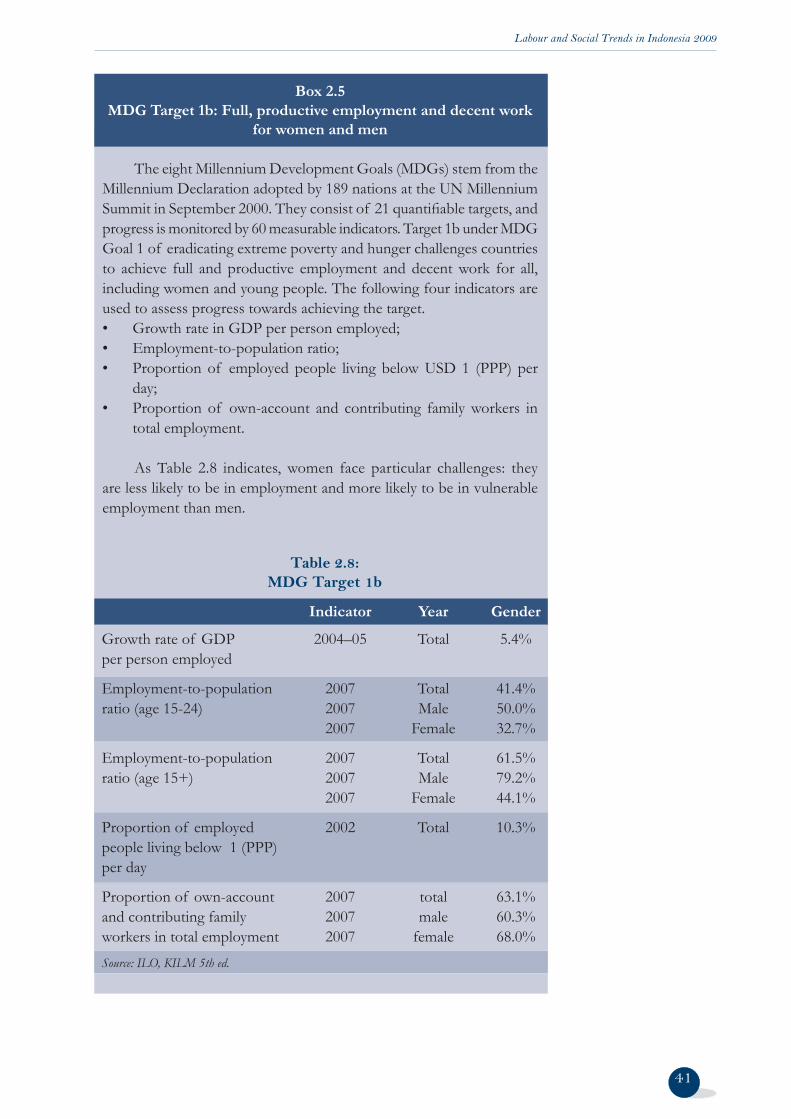
Labour and Social Trends in Indonesia 2009
41
Box 2.5MDG Target 1b: Full, productive employment and decent work
for women and men
The eight Millennium Development Goals (MDGs) stem from the Millennium Declaration adopted by 189 nations at the UN Millennium Summit in September 2000. They consist of 21 quantifi able targets, and progress is monitored by 60 measurable indicators. Target 1b under MDG Goal 1 of eradicating extreme poverty and hunger challenges countries to achieve full and productive employment and decent work for all, including women and young people. The following four indicators are used to assess progress towards achieving the target.• Growth rate in GDP per person employed;• Employment-to-population ratio;• Proportion of employed people living below USD 1 (PPP) per
day;• Proportion of own-account and contributing family workers in
total employment.
As Table 2.8 indicates, women face particular challenges: they are less likely to be in employment and more likely to be in vulnerable employment than men.
Table 2.8: MDG Target 1b
Indicator Year Gender
Growth rate of GDP 2004–05 Total 5.4%per person employed
Employment-to-population 2007 Total 41.4%ratio (age 15-24) 2007 Male 50.0% 2007 Female 32.7%
Employment-to-population 2007 Total 61.5%ratio (age 15+) 2007 Male 79.2% 2007 Female 44.1%
Proportion of employed 2002 Total 10.3%people living below 1 (PPP)per day
Proportion of own-account 2007 total 63.1%and contributing family 2007 male 60.3%workers in total employment 2007 female 68.0%Source: ILO, KILM 5th ed.
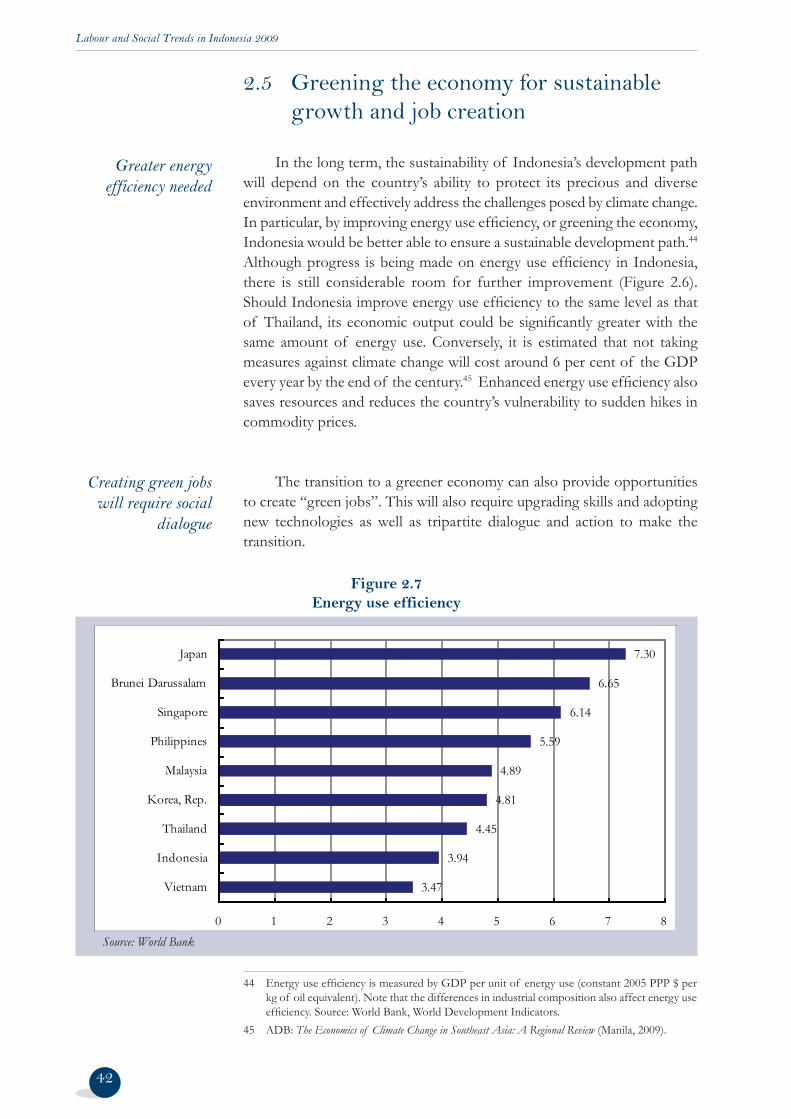
Labour and Social Trends in Indonesia 2009
44 Energy use effi ciency is measured by GDP per unit of energy use (constant 2005 PPP $ per kg of oil equivalent). Note that the differences in industrial composition also affect energy use effi ciency. Source: World Bank, World Development Indicators.
45 ADB: The Economics of Climate Change in Southeast Asia: A Regional Review (Manila, 2009).
2.5 Greening the economy for sustainable growth and job creation
In the long term, the sustainability of Indonesia’s development path will depend on the country’s ability to protect its precious and diverse environment and effectively address the challenges posed by climate change. In particular, by improving energy use effi ciency, or greening the economy, Indonesia would be better able to ensure a sustainable development path.44 Although progress is being made on energy use effi ciency in Indonesia, there is still considerable room for further improvement (Figure 2.6). Should Indonesia improve energy use effi ciency to the same level as that of Thailand, its economic output could be signifi cantly greater with the same amount of energy use. Conversely, it is estimated that not taking measures against climate change will cost around 6 per cent of the GDP every year by the end of the century.45 Enhanced energy use effi ciency also saves resources and reduces the country’s vulnerability to sudden hikes in commodity prices.
The transition to a greener economy can also provide opportunities to create “green jobs”. This will also require upgrading skills and adopting new technologies as well as tripartite dialogue and action to make the transition.
Greater energy efficiency needed
Creating green jobs will require social
dialogue
Figure 2.7 Energy use efficiency
3.47
3.94
4.45
4.81
4.89
5.59
6.14
6.65
7.30
0 1 2 3 4 5 6 7 8
Vietnam
Indonesia
Thailand
Korea, Rep.
Malaysia
Philippines
Singapore
Brunei Darussalam
Japan
42
Source: World Bank
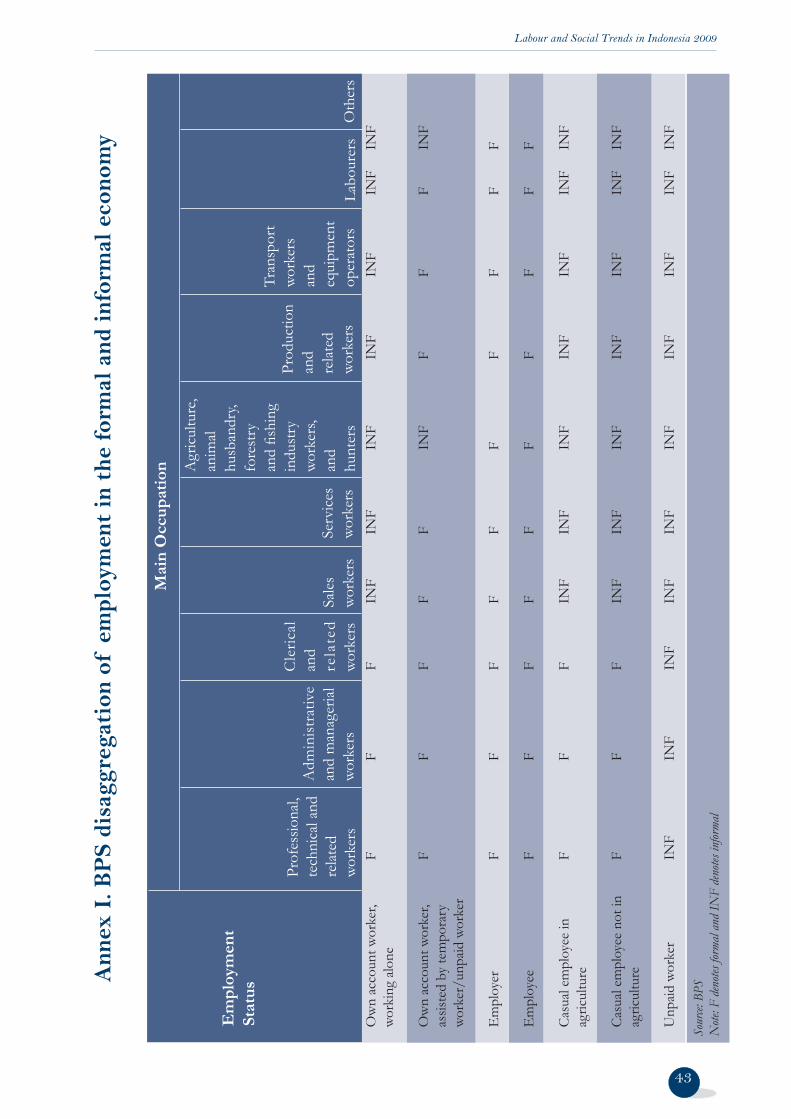
Labour and Social Trends in Indonesia 2009
Ann
ex I
. BP
S di
sagg
rega
tion
of
empl
oym
ent
in t
he fo
rmal
and
info
rmal
eco
nom
y
Em
plo
ymen
t St
atu
s
Prof
essio
nal,
tech
nica
l and
re
lated
wo
rker
s
Mai
n O
ccu
pat
ion
Ow
n ac
coun
t wor
ker,
work
ing
alone
Ow
n ac
coun
t wor
ker,
assis
ted
by te
mpo
rary
wo
rker
/unp
aid w
orke
r
Em
ploy
er
Em
ploy
ee
Casu
al em
ploy
ee in
ag
ricul
ture
Casu
al em
ploy
ee n
ot in
ag
ricul
ture
Unp
aid w
orke
r
Adm
inist
rativ
e an
d m
anag
erial
wo
rker
s
Cle
rical
an
d re
late
d wo
rker
sSa
les
work
ers
Serv
ices
work
ers
Agr
icultu
re,
anim
al hu
sban
dry,
fore
stry
an
d fi s
hing
in
dust
ry
work
ers,
and
hunt
ers
Prod
uctio
n an
d re
lated
wo
rker
s
Tran
spor
t wo
rker
s an
deq
uipm
ent
oper
ator
sLa
bour
ers
Oth
ers
F F F F F F INF
F F F F F F INF
F F F F F F INF
INF
F F F INF
INF
INF
INF
F F F INF
INF
INF
INF
INF
F F INF
INF
INF
INF
F F F INF
INF
INF
INF
F F F INF
INF
INF
INF
F F F INF
INF
INF
INF
INF
F F INF
INF
INF
Sour
ce: B
PSN
ote: F
den
otes f
orma
l and
INF
deno
tes in
forma
l
43
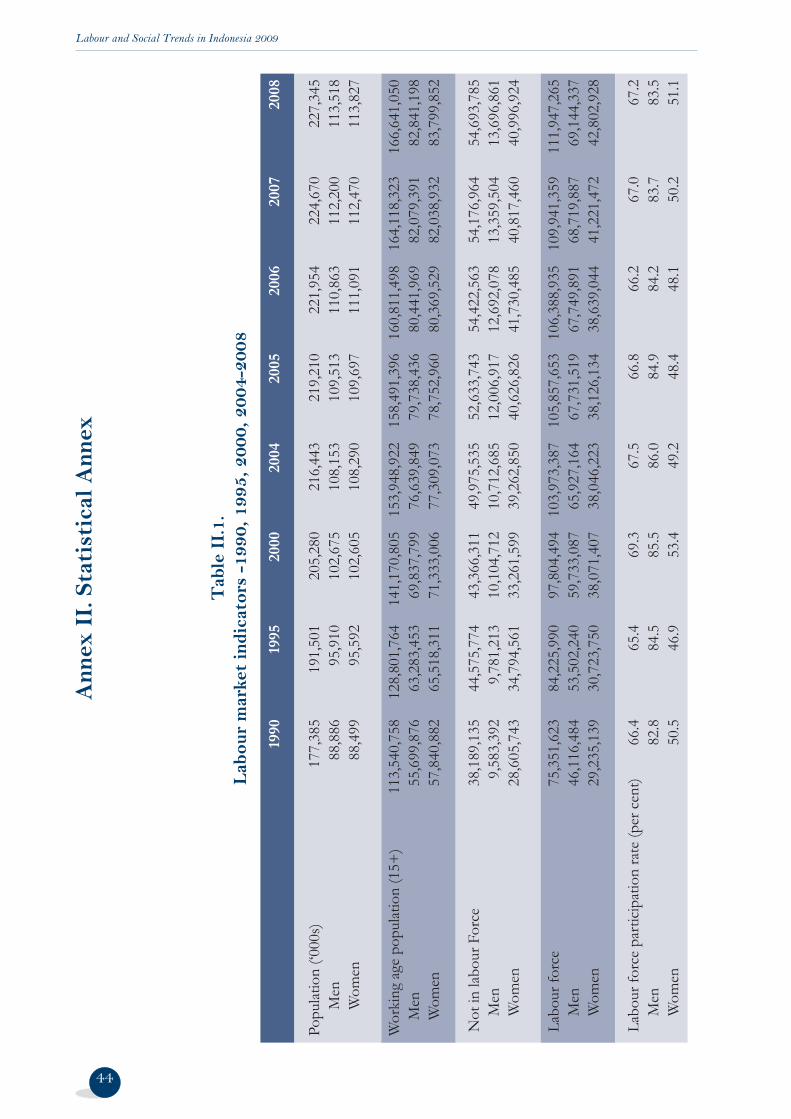
Labour and Social Trends in Indonesia 2009
44
Ann
ex I
I. S
tati
stic
al A
nnex
Tab
le I
I.1.
L
abou
r m
arke
t in
dica
tors
-19
90, 1
995,
200
0, 2
004-
2008
1990
19
95
2000
20
04
2005
20
06
2007
20
08
Popu
latio
n (‘0
00s)
1
77,3
85
191
,501
2
05,2
80
216
,443
2
19,2
10
221
,954
2
24,6
70
227
,345
Men
88,
886
9
5,91
0
102
,675
1
08,1
53
109
,513
1
10,8
63
112
,200
1
13,5
18
W
omen
88,4
99
95,
592
1
02,6
05
108
,290
1
09,6
97
111
,091
1
12,4
70
113
,827
Wor
king
age
pop
ulat
ion
(15+
) 1
13,5
40,7
58
128
,801
,764
1
41,1
70,8
05
153
,948
,922
1
58,4
91,3
96
160,
811,
498
16
4,11
8,32
3
166
,641
,050
Men
5
5,69
9,87
6
63,
283,
453
6
9,83
7,79
9
76,
639,
849
7
9,73
8,43
6
80,
441,
969
8
2,07
9,39
1
82,
841,
198
W
omen
5
7,84
0,88
2
65,
518,
311
7
1,33
3,00
6
77,
309,
073
7
8,75
2,96
0
80,
369,
529
8
2,03
8,93
2
83,
799,
852
Not
in la
bour
For
ce
38,
189,
135
4
4,57
5,77
4
43,
366,
311
4
9,97
5,53
5
52,
633,
743
5
4,42
2,56
3
54,
176,
964
5
4,69
3,78
5
Men
9
,583
,392
9
,781
,213
1
0,10
4,71
2
10,
712,
685
1
2,00
6,91
7
12,
692,
078
1
3,35
9,50
4
13,
696,
861
W
omen
2
8,60
5,74
3
34,
794,
561
3
3,26
1,59
9
39,
262,
850
4
0,62
6,82
6
41,
730,
485
4
0,81
7,46
0
40,
996,
924
Lab
our f
orce
7
5,35
1,62
3
84,
225,
990
9
7,80
4,49
4
103,
973,
387
10
5,85
7,65
3 1
06,3
88,9
35
109
,941
,359
1
11,9
47,2
65
M
en
46,
116,
484
5
3,50
2,24
0
59,
733,
087
6
5,92
7,16
4
67,
731,
519
6
7,74
9,89
1
68,
719,
887
6
9,14
4,33
7
Wom
en
29,
235,
139
3
0,72
3,75
0
38,
071,
407
3
8,04
6,22
3
38,
126,
134
3
8,63
9,04
4
41,
221,
472
4
2,80
2,92
8
L
abou
r for
ce p
artic
ipat
ion
rate
(per
cen
t)
66.4
65
.4
69.3
67
.5
66.8
66
.2
67.0
67
.2
Men
82
.8
84.5
85
.5
86.0
84
.9
84.2
83
.7
83.5
W
omen
50
.5
46.9
53
.4
49.2
48
.4
48.1
50
.2
51.1
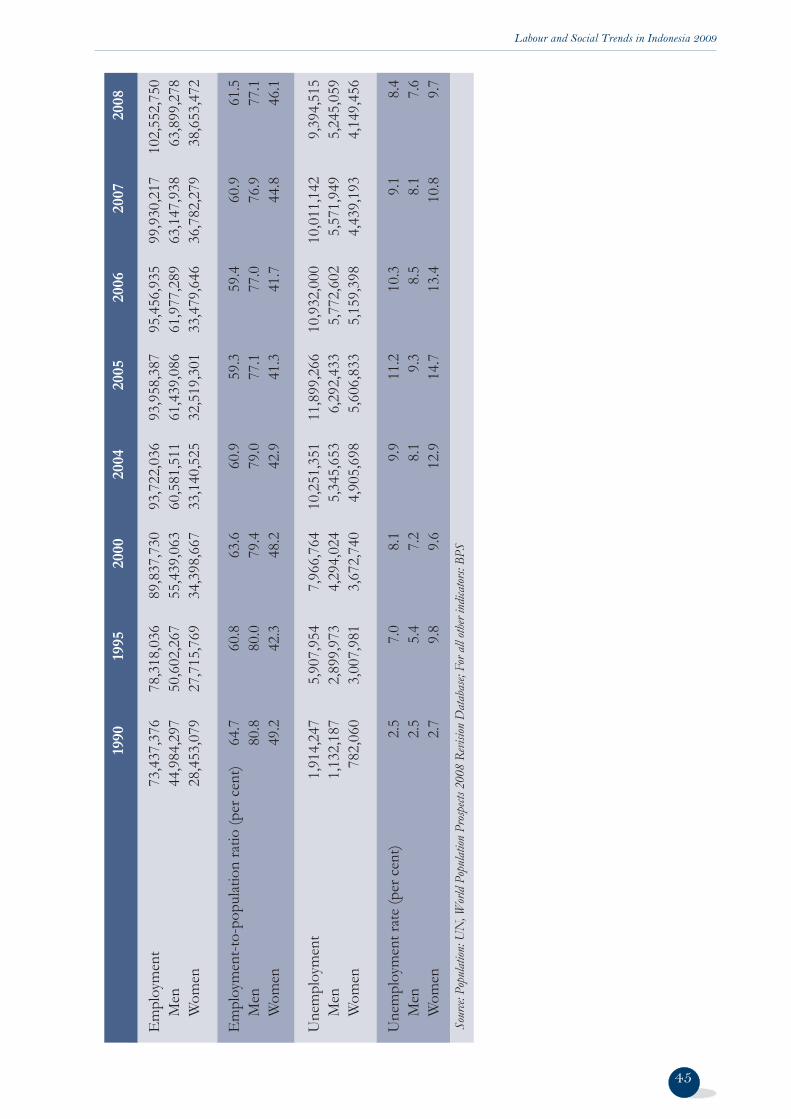
Labour and Social Trends in Indonesia 2009
Em
ploy
men
t 7
3,43
7,37
6
78,
318,
036
8
9,83
7,73
0
93,
722,
036
9
3,95
8,38
7
95,
456,
935
9
9,93
0,21
7
102
,552
,750
Men
4
4,98
4,29
7
50,
602,
267
5
5,43
9,06
3
60,
581,
511
6
1,43
9,08
6
61,
977,
289
6
3,14
7,93
8
63,
899,
278
W
omen
2
8,45
3,07
9
27,
715,
769
3
4,39
8,66
7
33,
140,
525
3
2,51
9,30
1
33,
479,
646
3
6,78
2,27
9
38,
653,
472
Em
ploy
men
t-to-
popu
latio
n ra
tio (p
er c
ent)
64
.7
60.8
63
.6
60.9
59
.3
59.4
60
.9
61.5
M
en
80.8
80
.0
79.4
79
.0
77.1
77
.0
76.9
77
.1
Wom
en
49.2
42
.3
48.2
42
.9
41.3
41
.7
44.8
46
.1
U
nem
ploy
men
t 1
,914
,247
5
,907
,954
7
,966
,764
1
0,25
1,35
1
11,
899,
266
1
0,93
2,00
0
10,
011,
142
9
,394
,515
Men
1
,132
,187
2
,899
,973
4
,294
,024
5
,345
,653
6
,292
,433
5
,772
,602
5
,571
,949
5
,245
,059
Wom
en
782
,060
3
,007
,981
3
,672
,740
4
,905
,698
5
,606
,833
5
,159
,398
4
,439
,193
4
,149
,456
U
nem
ploy
men
t rat
e (p
er c
ent)
2.
5 7.
0 8.
1 9.
9 11
.2
10.3
9.
1 8.
4
Men
2.
5 5.
4 7.
2 8.
1 9.
3 8.
5 8.
1 7.
6
Wom
en
2.7
9.8
9.6
12.9
14
.7
13.4
10
.8
9.7
Sou
rce: P
opula
tion:
UN
, Wor
ld Po
pulat
ion P
rosp
ects 2
008
Revis
ion D
atab
ase;
For a
ll oth
er in
dicat
ors:
BPS
1990
19
95
2000
20
04
2005
20
06
2007
20
08
45
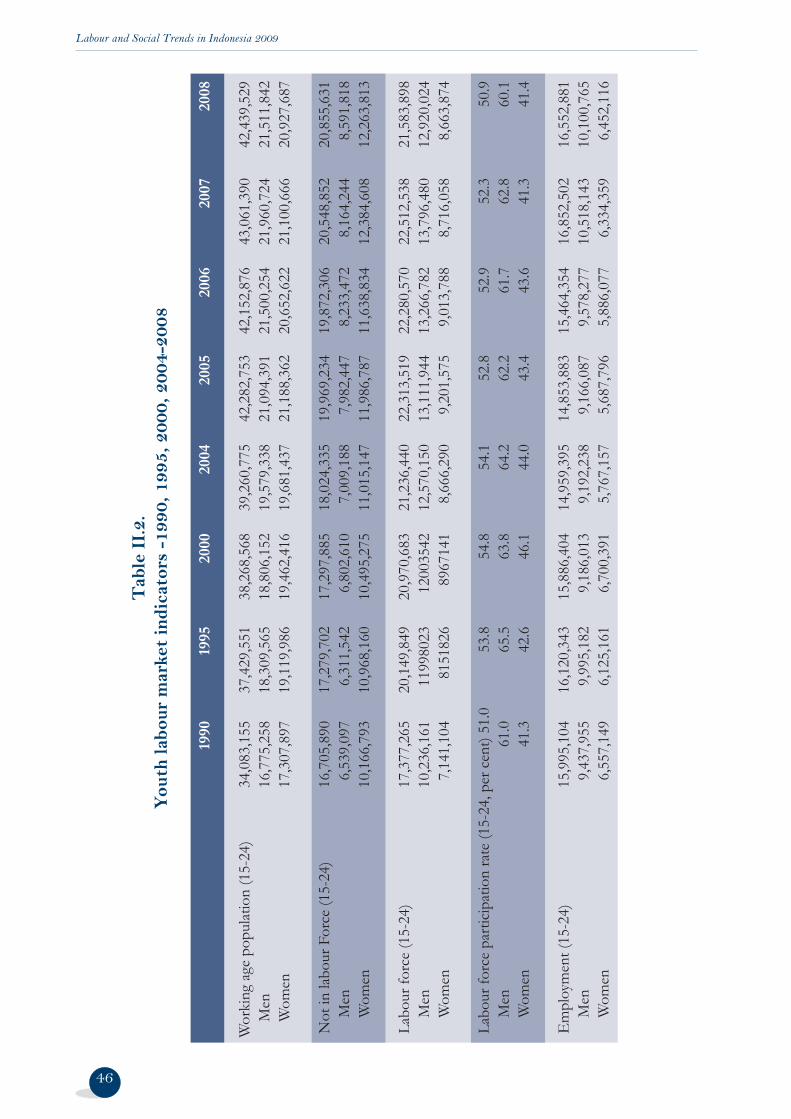
Labour and Social Trends in Indonesia 2009
46
Tab
le I
I.2.
Y
outh
labo
ur m
arke
t in
dica
tors
-19
90, 1
995,
200
0, 2
004-
2008
1990
19
95
2000
20
04
2005
20
06
2007
20
08
Wor
king
age
pop
ulat
ion
(15-
24)
34,
083,
155
3
7,42
9,55
1
38,
268,
568
3
9,26
0,77
5
42,
282,
753
4
2,15
2,87
6
43,
061,
390
4
2,43
9,52
9
Men
1
6,77
5,25
8
18,
309,
565
1
8,80
6,15
2
19,
579,
338
2
1,09
4,39
1
21,
500,
254
2
1,96
0,72
4
21,
511,
842
W
omen
1
7,30
7,89
7
19,
119,
986
1
9,46
2,41
6
19,
681,
437
2
1,18
8,36
2
20,
652,
622
2
1,10
0,66
6
20,
927,
687
Not
in la
bour
For
ce (1
5-24
) 1
6,70
5,89
0
17,
279,
702
1
7,29
7,88
5
18,
024,
335
1
9,96
9,23
4
19,
872,
306
2
0,54
8,85
2
20,
855,
631
M
en
6,5
39,0
97
6,3
11,5
42
6,8
02,6
10
7,0
09,1
88
7,9
82,4
47
8,2
33,4
72
8,1
64,2
44
8,5
91,8
18
W
omen
1
0,16
6,79
3
10,
968,
160
1
0,49
5,27
5
11,
015,
147
1
1,98
6,78
7
11,
638,
834
1
2,38
4,60
8
12,
263,
813
Lab
our f
orce
(15-
24)
17,
377,
265
2
0,14
9,84
9
20,
970,
683
2
1,23
6,44
0
22,
313,
519
2
2,28
0,57
0
22,
512,
538
2
1,58
3,89
8
Men
1
0,23
6,16
1
1199
8023
12
0035
42
12,
570,
150
1
3,11
1,94
4
13,
266,
782
1
3,79
6,48
0
12,
920,
024
W
omen
7
,141
,104
81
5182
6 89
6714
1 8
,666
,290
9
,201
,575
9
,013
,788
8
,716
,058
8
,663
,874
L
abou
r for
ce p
artic
ipat
ion
rate
(15-
24, p
er c
ent)
51.0
53
.8
54.8
54
.1
52.8
52
.9
52.3
50
.9
Men
61
.0
65.5
63
.8
64.2
62
.2
61.7
62
.8
60.1
W
omen
41
.3
42.6
46
.1
44.0
43
.4
43.6
41
.3
41.4
Em
ploy
men
t (15
-24)
1
5,99
5,10
4
16,
120,
343
1
5,88
6,40
4
14,
959,
395
1
4,85
3,88
3
15,
464,
354
1
6,85
2,50
2
16,
552,
881
M
en
9,4
37,9
55
9,9
95,1
82
9,1
86,0
13
9,1
92,2
38
9,1
66,0
87
9,5
78,2
77
10,
518,
143
1
0,10
0,76
5
Wom
en
6,5
57,1
49
6,1
25,1
61
6,7
00,3
91
5,7
67,1
57
5,6
87,7
96
5,8
86,0
77
6,3
34,3
59
6,4
52,1
16
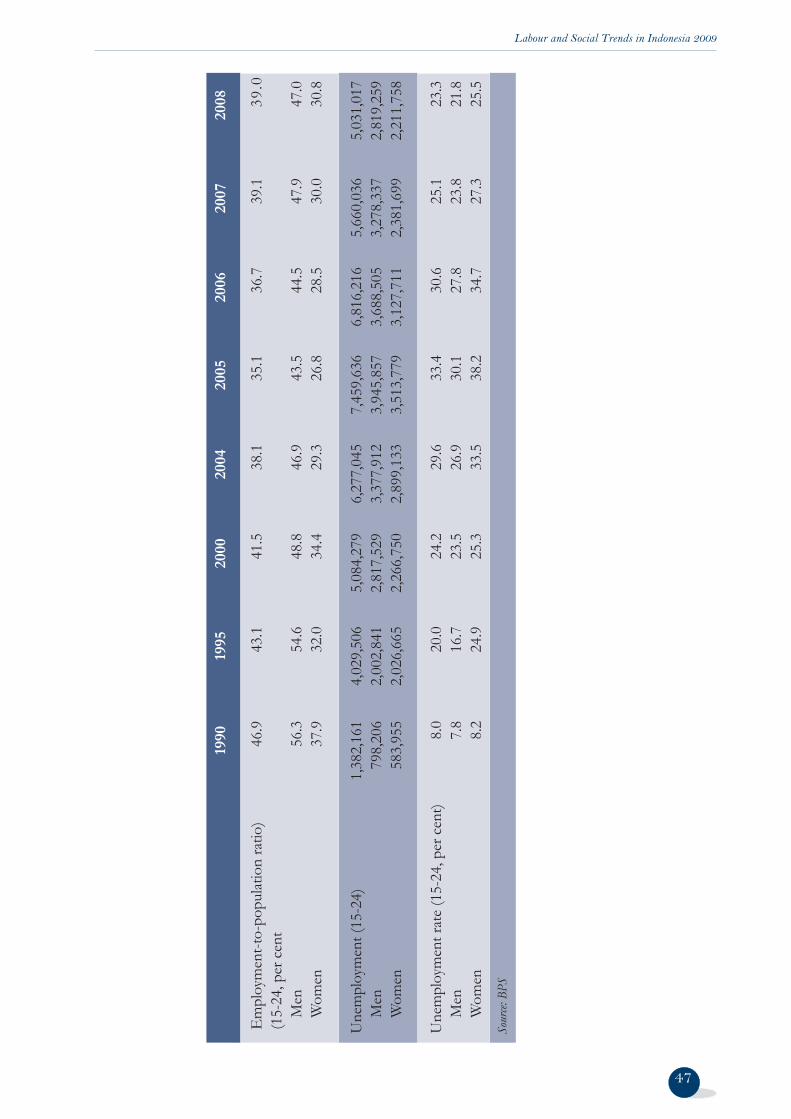
Labour and Social Trends in Indonesia 2009
47
1990
19
95
2000
20
04
2005
20
06
2007
20
08
Em
ploy
men
t-to-
popu
latio
n ra
tio)
46.9
43
.1
41.5
38
.1
35.1
36
.7
39.1
39
.0 (
15-2
4, p
er c
ent
M
en
56.3
54
.6
48.8
46
.9
43.5
44
.5
47.9
47
.0
Wom
en
37.9
32
.0
34.4
29
.3
26.8
28
.5
30.0
30
.8
U
nem
ploy
men
t (15
-24)
1
,382
,161
4
,029
,506
5
,084
,279
6
,277
,045
7
,459
,636
6
,816
,216
5
,660
,036
5
,031
,017
Men
7
98,2
06
2,0
02,8
41
2,8
17,5
29
3,3
77,9
12
3,9
45,8
57
3,6
88,5
05
3,2
78,3
37
2,8
19,2
59
W
omen
5
83,9
55
2,0
26,6
65
2,2
66,7
50
2,8
99,1
33
3,5
13,7
79
3,1
27,7
11
2,3
81,6
99
2,2
11,7
58
Une
mpl
oym
ent r
ate
(15-
24, p
er c
ent)
8
.0
20.
0
24.
2
29.
6
33.
4
30.
6
25.
1
23.
3
Men
7
.8
16.
7
23.
5
26.
9
30.
1
27.
8
23.
8
21.
8
Wom
en
8.2
2
4.9
2
5.3
3
3.5
3
8.2
3
4.7
2
7.3
2
5.5
Sou
rce: B
PS
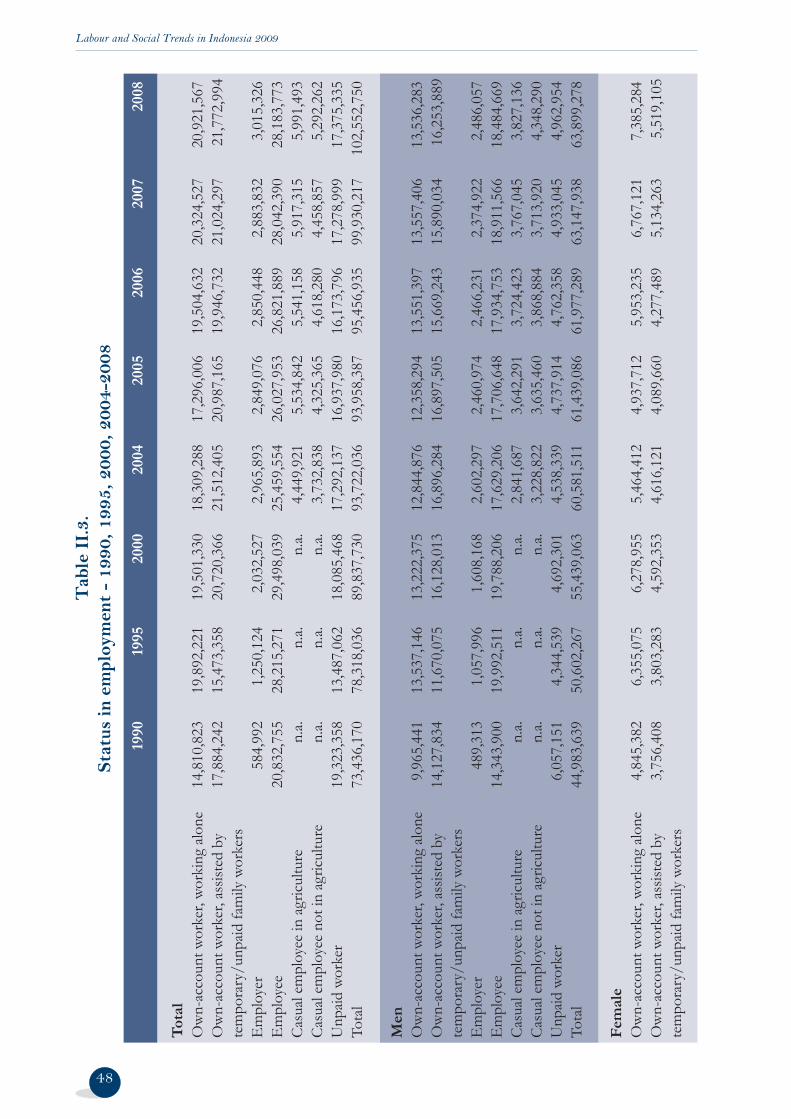
Labour and Social Trends in Indonesia 2009
48
Tab
le I
I.3.
St
atus
in e
mpl
oym
ent
- 19
90, 1
995,
200
0, 2
004-
2008
1990
19
95
2000
20
04
2005
20
06
2007
20
08
Tot
al
O
wn-
acco
unt w
orke
r, wo
rkin
g alo
ne
14,
810,
823
1
9,89
2,22
1
19,
501,
330
1
8,30
9,28
8
17,
296,
006
1
9,50
4,63
2
20,
324,
527
2
0,92
1,56
7 O
wn-
acco
unt w
orke
r, as
siste
d by
1
7,88
4,24
2
15,
473,
358
2
0,72
0,36
6
21,
512,
405
2
0,98
7,16
5
19,
946,
732
2
1,02
4,29
7
21,
772,
994
tem
pora
ry/u
npaid
fam
ily w
orke
rsE
mpl
oyer
5
84,9
92
1,2
50,1
24
2,0
32,5
27
2,9
65,8
93
2,8
49,0
76
2,8
50,4
48
2,8
83,8
32
3,0
15,3
26
Em
ploy
ee
20,
832,
755
2
8,21
5,27
1
29,
498,
039
2
5,45
9,55
4
26,
027,
953
2
6,82
1,88
9
28,
042,
390
2
8,18
3,77
3 Ca
sual
empl
oyee
in a
gricu
lture
n
.a.
n.a.
n
.a.
4,4
49,9
21
5,5
34,8
42
5,5
41,1
58
5,9
17,3
15
5,9
91,4
93
Casu
al em
ploy
ee n
ot in
agr
icultu
re
n.a.
n
.a.
n.a.
3
,732
,838
4
,325
,365
4
,618
,280
4
,458
,857
5
,292
,262
U
npaid
wor
ker
19,
323,
358
1
3,48
7,06
2
18,
085,
468
1
7,29
2,13
7
16,
937,
980
1
6,17
3,79
6
17,
278,
999
1
7,37
5,33
5 To
tal
73,
436,
170
7
8,31
8,03
6
89,
837,
730
9
3,72
2,03
6
93,
958,
387
9
5,45
6,93
5
99,
930,
217
1
02,5
52,7
50
Men
Ow
n-ac
coun
t wor
ker,
work
ing
alone
9
,965
,441
1
3,53
7,14
6
13,
222,
375
1
2,84
4,87
6
12,
358,
294
1
3,55
1,39
7
13,
557,
406
1
3,53
6,28
3 O
wn-
acco
unt w
orke
r, as
siste
d by
1
4,12
7,83
4
11,
670,
075
1
6,12
8,01
3
16,
896,
284
1
6,89
7,50
5
15,
669,
243
1
5,89
0,03
4
16,
253,
889
tem
pora
ry/u
npaid
fam
ily w
orke
rsE
mpl
oyer
4
89,3
13
1,0
57,9
96
1,6
08,1
68
2,6
02,2
97
2,4
60,9
74
2,4
66,2
31
2,3
74,9
22
2,4
86,0
57
Em
ploy
ee
14,
343,
900
1
9,99
2,51
1
19,
788,
206
1
7,62
9,20
6
17,
706,
648
1
7,93
4,75
3
18,
911,
566
1
8,48
4,66
9 Ca
sual
empl
oyee
in a
gricu
lture
n
.a.
n.a.
n
.a.
2,8
41,6
87
3,6
42,2
91
3,7
24,4
23
3,7
67,0
45
3,8
27,1
36
Casu
al em
ploy
ee n
ot in
agr
icultu
re
n.a.
n
.a.
n.a.
3
,228
,822
3
,635
,460
3
,868
,884
3
,713
,920
4
,348
,290
U
npaid
wor
ker
6,0
57,1
51
4,3
44,5
39
4,6
92,3
01
4,5
38,3
39
4,7
37,9
14
4,7
62,3
58
4,9
33,0
45
4,9
62,9
54
Tota
l 4
4,98
3,63
9
50,
602,
267
5
5,43
9,06
3
60,
581,
511
6
1,43
9,08
6
61,
977,
289
6
3,14
7,93
8
63,
899,
278
Fem
ale
O
wn-
acco
unt w
orke
r, wo
rkin
g alo
ne
4,8
45,3
82
6,3
55,0
75
6,2
78,9
55
5,4
64,4
12
4,9
37,7
12
5,9
53,2
35
6,7
67,1
21
7,3
85,2
84
Ow
n-ac
coun
t wor
ker,
assis
ted
by
3,7
56,4
08
3,8
03,2
83
4,5
92,3
53
4,6
16,1
21
4,0
89,6
60
4,2
77,4
89
5,1
34,2
63
5,5
19,1
05
tem
pora
ry/u
npaid
fam
ily w
orke
rs
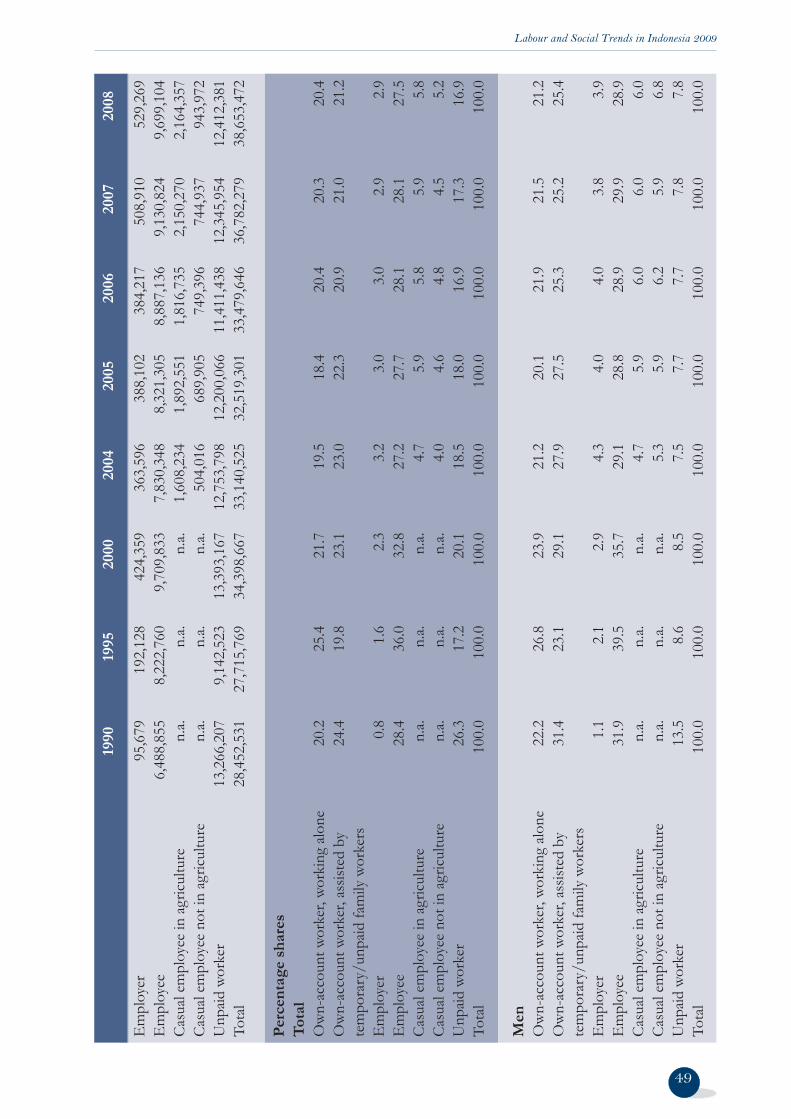
Labour and Social Trends in Indonesia 2009
Em
ploy
er
95,
679
1
92,1
28
424
,359
3
63,5
96
388
,102
3
84,2
17
508
,910
5
29,2
69
Em
ploy
ee
6,4
88,8
55
8,2
22,7
60
9,7
09,8
33
7,8
30,3
48
8,3
21,3
05
8,8
87,1
36
9,1
30,8
24
9,6
99,1
04
Casu
al em
ploy
ee in
agr
icultu
re
n.a.
n
.a.
n.a.
1
,608
,234
1
,892
,551
1
,816
,735
2
,150
,270
2
,164
,357
Ca
sual
empl
oyee
not
in a
gricu
lture
n
.a.
n.a.
n
.a.
504
,016
6
89,9
05
749
,396
7
44,9
37
943
,972
U
npaid
wor
ker
13,
266,
207
9
,142
,523
1
3,39
3,16
7
12,
753,
798
1
2,20
0,06
6
11,
411,
438
1
2,34
5,95
4
12,
412,
381
Tota
l 2
8,45
2,53
1
27,
715,
769
3
4,39
8,66
7
33,
140,
525
3
2,51
9,30
1
33,
479,
646
3
6,78
2,27
9
38,
653,
472
Per
cen
tage
sh
ares
Tot
al
O
wn-
acco
unt w
orke
r, wo
rkin
g alo
ne
20.
2
25.
4
21.
7
19.
5
18.
4
20.
4
20.
3
20.
4 O
wn-
acco
unt w
orke
r, as
siste
d by
2
4.4
1
9.8
2
3.1
2
3.0
2
2.3
2
0.9
2
1.0
2
1.2
tem
pora
ry/u
npaid
fam
ily w
orke
rsE
mpl
oyer
0
.8
1.6
2
.3
3.2
3
.0
3.0
2
.9
2.9
E
mpl
oyee
2
8.4
3
6.0
3
2.8
2
7.2
2
7.7
2
8.1
2
8.1
2
7.5
Casu
al em
ploy
ee in
agr
icultu
re
n.a.
n
.a.
n.a.
4
.7
5.9
5
.8
5.9
5
.8
Casu
al em
ploy
ee n
ot in
agr
icultu
re
n.a.
n
.a.
n.a.
4
.0
4.6
4
.8
4.5
5
.2
Unp
aid w
orke
r 2
6.3
1
7.2
2
0.1
1
8.5
1
8.0
1
6.9
1
7.3
1
6.9
Tota
l 1
00.0
1
00.0
1
00.0
1
00.0
1
00.0
1
00.0
1
00.0
1
00.0
M
en
O
wn-
acco
unt w
orke
r, wo
rkin
g alo
ne
22.2
26
.8
23.9
21
.2
20.1
21
.9
21.5
21
.2O
wn-
acco
unt w
orke
r, as
siste
d by
31
.4
23.1
29
.1
27.9
27
.5
25.3
25
.2
25.4
tem
pora
ry/u
npaid
fam
ily w
orke
rsE
mpl
oyer
1.
1 2.
1 2.
9 4.
3 4.
0 4.
0 3.
8 3.
9E
mpl
oyee
31
.9
39.5
35
.7
29.1
28
.8
28.9
29
.9
28.9
Casu
al em
ploy
ee in
agr
icultu
re
n.a.
n
.a.
n.a.
4.
7 5.
9 6.
0 6.
0 6.
0Ca
sual
empl
oyee
not
in a
gricu
lture
n
.a.
n.a.
n
.a.
5.3
5.9
6.2
5.9
6.8
Unp
aid w
orke
r 13
.5
8.6
8.5
7.5
7.7
7.7
7.8
7.8
Tota
l 10
0.0
100.
0 10
0.0
100.
0 10
0.0
100.
0 10
0.0
100.
0
1990
19
95
2000
20
04
2005
20
06
2007
20
08
49

Labour and Social Trends in Indonesia 2009
Fem
ale
O
wn-
acco
unt w
orke
r, wo
rkin
g alo
ne
17.0
22
.9
18.3
16
.5
15.2
17
.8
18.4
19
.1O
wn-
acco
unt w
orke
r, as
siste
d by
tem
pora
ry/
13.2
13
.7
13.4
13
.9
12.6
12
.8
14.0
14
.3un
paid
fam
ily w
orke
rsE
mpl
oyer
0.
3 0.
7 1.
2 1.
1 1.
2 1.
1 1.
4 1.
4E
mpl
oyee
22
.8
29.7
28
.2
23.6
25
.6
26.5
24
.8
25.1
Casu
al em
ploy
ee in
agr
icultu
re
n.a.
n
.a.
n.a.
4.
9 5.
8 5.
4 5.
8 5.
6Ca
sual
empl
oyee
not
in a
gricu
lture
n
.a.
n.a.
n
.a.
1.5
2.1
2.2
2.0
2.4
Unp
aid w
orke
r 46
.6
33.0
38
.9
38.5
37
.5
34.1
33
.6
32.1
Tota
l 10
0.0
100.
0 10
0.0
100.
0 10
0.0
100.
0 10
0.0
100.
0
So
urce:
BPS
1990
19
95
2000
20
04
2005
20
06
2007
20
08
50
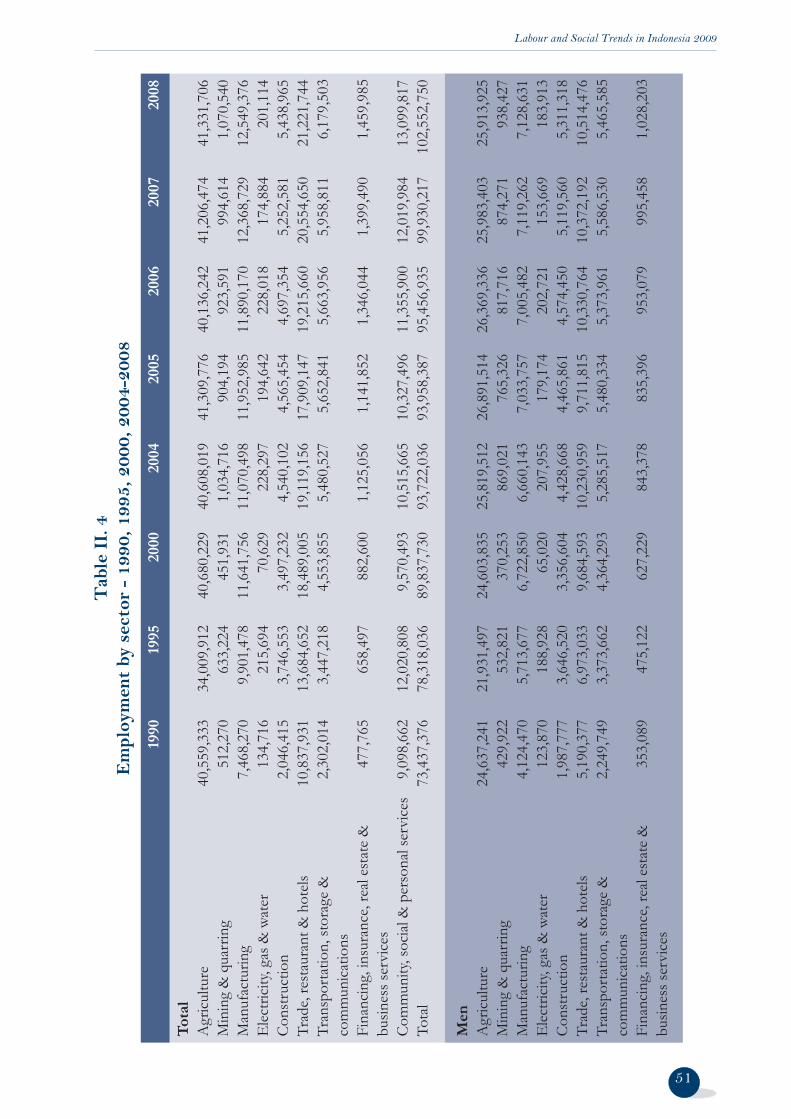
Labour and Social Trends in Indonesia 2009
Tab
le I
I. 4
E
mpl
oym
ent
by s
ecto
r -
1990
, 199
5, 2
000,
200
4-20
08
1990
19
95
2000
20
04
2005
20
06
2007
20
08
Tot
al
A
gricu
lture
40
,559
,333
34
,009
,912
40
,680
,229
40
,608
,019
41
,309
,776
40
,136
,242
41
,206
,474
41
,331
,706
M
inin
g &
qua
rrin
g 51
2,27
0
633,
224
45
1,93
1
1,03
4,71
6
904,
194
92
3,59
1
994,
614
1,
070,
540
Man
ufac
turin
g 7,
468,
270
9,
901,
478
11
,641
,756
11
,070
,498
11
,952
,985
11
,890
,170
12
,368
,729
12
,549
,376
E
lectri
city,
gas &
wat
er
134,
716
21
5,69
4
70,6
29
228,
297
19
4,64
2
228,
018
17
4,88
4
201,
114
Cons
truc
tion
2,04
6,41
5
3,74
6,55
3
3,49
7,23
2
4,54
0,10
2
4,56
5,45
4
4,69
7,35
4
5,25
2,58
1
5,43
8,96
5 Tr
ade,
rest
aura
nt &
hot
els
10,8
37,9
31
13,6
84,6
52
18,4
89,0
05
19,1
19,1
56
17,9
09,1
47
19,2
15,6
60
20,5
54,6
50
21,2
21,7
44
Tran
spor
tatio
n, st
orag
e &
2,
302,
014
3,
447,
218
4,
553,
855
5,
480,
527
5,
652,
841
5,
663,
956
5,
958,
811
6,
179,
503
com
mun
icatio
nsFi
nanc
ing,
insu
ranc
e, re
al es
tate
&
477,
765
65
8,49
7
882,
600
1,
125,
056
1,
141,
852
1,
346,
044
1,
399,
490
1,
459,
985
busin
ess s
ervi
ces
Com
mun
ity, s
ocial
& p
erso
nal s
ervi
ces
9,09
8,66
2
12,0
20,8
08
9,57
0,49
3
10,5
15,6
65
10,3
27,4
96
11,3
55,9
00
12,0
19,9
84
13,0
99,8
17
Tota
l 73
,437
,376
78
,318
,036
89
,837
,730
93
,722
,036
93
,958
,387
95
,456
,935
99
,930
,217
10
2,55
2,75
0
M
en
A
gricu
lture
24
,637
,241
21
,931
,497
24
,603
,835
25
,819
,512
26
,891
,514
26
,369
,336
25
,983
,403
25
,913
,925
M
inin
g &
qua
rrin
g 42
9,92
2
532,
821
37
0,25
3
869,
021
76
5,32
6
817,
716
87
4,27
1
938,
427
Man
ufac
turin
g 4,
124,
470
5,
713,
677
6,
722,
850
6,
660,
143
7,
033,
757
7,
005,
482
7,
119,
262
7,
128,
631
Elec
tricit
y, ga
s & w
ater
12
3,87
0
188,
928
65
,020
20
7,95
5
179,
174
20
2,72
1
153,
669
18
3,91
3 Co
nstr
uctio
n 1,
987,
777
3,
646,
520
3,
356,
604
4,
428,
668
4,
465,
861
4,
574,
450
5,
119,
560
5,
311,
318
Trad
e, re
stau
rant
& h
otels
5,
190,
377
6,
973,
033
9,
684,
593
10
,230
,959
9,
711,
815
10
,330
,764
10
,372
,192
10
,514
,476
Tr
ansp
orta
tion,
stor
age
&
2,24
9,74
9
3,37
3,66
2
4,36
4,29
3
5,28
5,51
7
5,48
0,33
4
5,37
3,96
1
5,58
6,53
0
5,46
5,58
5 co
mm
unica
tions
Fina
ncin
g, in
sura
nce,
real
esta
te &
35
3,08
9
475,
122
62
7,22
9
843,
378
83
5,39
6
953,
079
99
5,45
8
1,02
8,20
3 bu
sines
s ser
vice
s
51
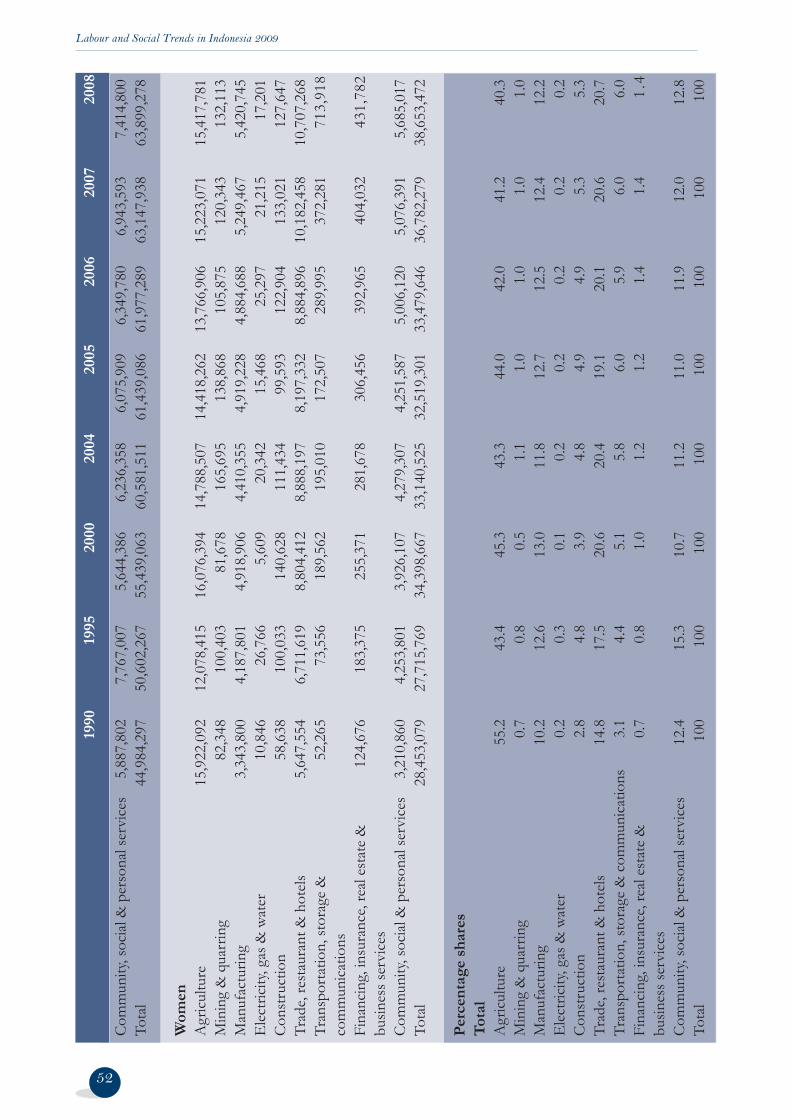
Labour and Social Trends in Indonesia 2009
52
1990
19
95
2000
20
04
2005
20
06
2007
20
08
Com
mun
ity, s
ocial
& p
erso
nal s
ervi
ces
5,88
7,80
2
7,76
7,00
7
5,64
4,38
6
6,23
6,35
8
6,07
5,90
9
6,34
9,78
0
6,94
3,59
3
7,41
4,80
0 To
tal
44,9
84,2
97
50,6
02,2
67
55,4
39,0
63
60,5
81,5
11
61,4
39,0
86
61,9
77,2
89
63,1
47,9
38
63,8
99,2
78
Wom
en
A
gricu
lture
15
,922
,092
12
,078
,415
16
,076
,394
14
,788
,507
14
,418
,262
13
,766
,906
15
,223
,071
15
,417
,781
M
inin
g &
qua
rrin
g 82
,348
10
0,40
3
81,6
78
165,
695
13
8,86
8
105,
875
12
0,34
3
132,
113
Man
ufac
turin
g 3,
343,
800
4,
187,
801
4,
918,
906
4,
410,
355
4,
919,
228
4,
884,
688
5,
249,
467
5,
420,
745
Elec
tricit
y, ga
s & w
ater
10
,846
26
,766
5,
609
20
,342
15
,468
25
,297
21
,215
17
,201
Co
nstr
uctio
n 58
,638
10
0,03
3
140,
628
11
1,43
4
99,5
93
122,
904
13
3,02
1
127,
647
Trad
e, re
stau
rant
& h
otels
5,
647,
554
6,
711,
619
8,
804,
412
8,
888,
197
8,
197,
332
8,
884,
896
10
,182
,458
10
,707
,268
Tr
ansp
orta
tion,
stor
age
&
52,2
65
73,5
56
189,
562
19
5,01
0
172,
507
28
9,99
5
372,
281
71
3,91
8 co
mm
unica
tions
Fina
ncin
g, in
sura
nce,
real
esta
te &
12
4,67
6
183,
375
25
5,37
1
281,
678
30
6,45
6
392,
965
40
4,03
2
431,
782
busin
ess s
ervi
ces
Com
mun
ity, s
ocial
& p
erso
nal s
ervi
ces
3,21
0,86
0
4,25
3,80
1
3,92
6,10
7
4,27
9,30
7
4,25
1,58
7
5,00
6,12
0
5,07
6,39
1
5,68
5,01
7 To
tal
28,4
53,0
79
27,7
15,7
69
34,3
98,6
67
33,1
40,5
25
32,5
19,3
01
33,4
79,6
46
36,7
82,2
79
38,6
53,4
72
Per
cen
tage
sh
ares
Tot
al
A
gricu
lture
55
.2
43.4
45
.3
43.3
44
.0
42.0
41
.2
40.3
Min
ing
& q
uarr
ing
0.7
0.8
0.5
1.1
1.0
1.0
1.0
1.0
Man
ufac
turin
g 10
.2
12.6
13
.0
11.8
12
.7
12.5
12
.4
12.2
Elec
tricit
y, ga
s & w
ater
0.
2 0.
3 0.
1 0.
2 0.
2 0.
2 0.
2 0.
2Co
nstr
uctio
n 2.
8 4.
8 3.
9 4.
8 4.
9 4.
9 5.
3 5.
3Tr
ade,
rest
aura
nt &
hot
els
14.8
17
.5
20.6
20
.4
19.1
20
.1
20.6
20
.7Tr
ansp
orta
tion,
stor
age
& c
omm
unica
tions
3.
1 4.
4 5.
1 5.
8 6.
0 5.
9 6.
0 6.
0Fi
nanc
ing,
insu
ranc
e, re
al es
tate
&
0.7
0.8
1.0
1.2
1.2
1.4
1.4
1.4
busin
ess s
ervi
ces
Com
mun
ity, s
ocial
& p
erso
nal s
ervi
ces
12.4
15
.3
10.7
11
.2
11.0
11
.9
12.0
12
.8To
tal
100
100
100
100
100
100
100
100
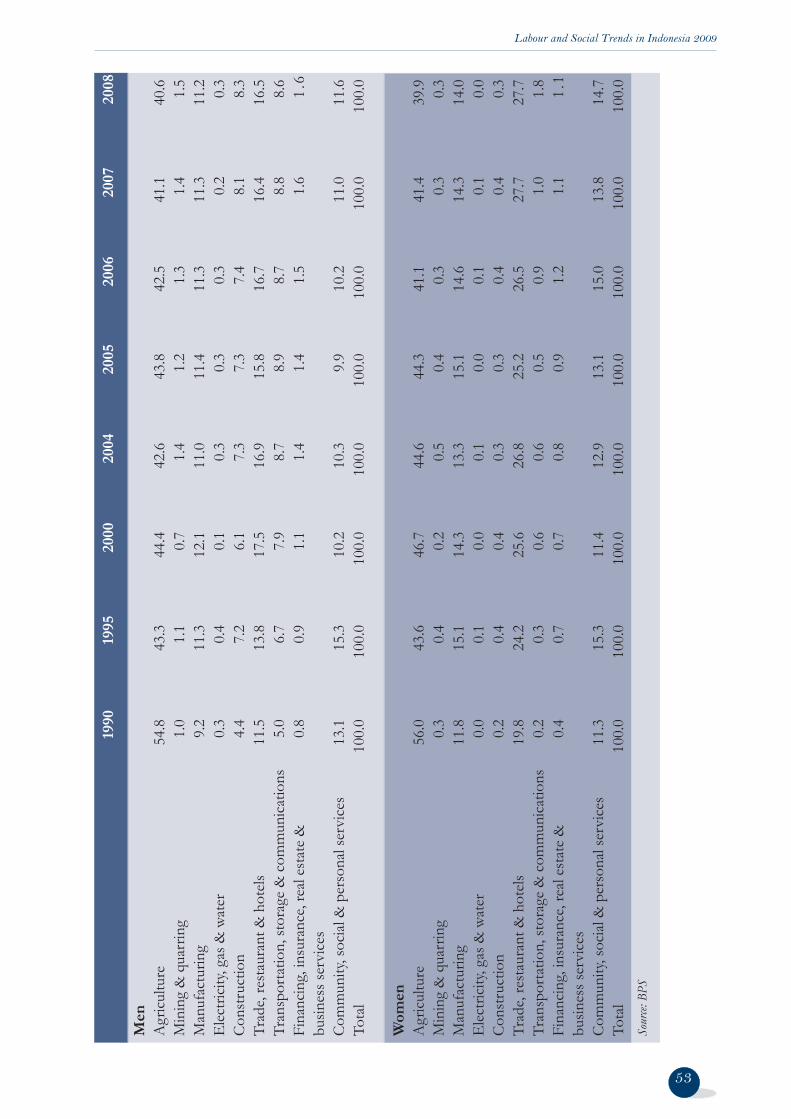
Labour and Social Trends in Indonesia 2009
53
1990
19
95
2000
20
04
2005
20
06
2007
20
08
Men
Agr
icultu
re
54.8
43
.3
44.4
42
.6
43.8
42
.5
41.1
40
.6M
inin
g &
qua
rrin
g 1.
0 1.
1 0.
7 1.
4 1.
2 1.
3 1.
4 1.
5M
anuf
actu
ring
9.2
11.3
12
.1
11.0
11
.4
11.3
11
.3
11.2
Elec
tricit
y, ga
s & w
ater
0.
3 0.
4 0.
1 0.
3 0.
3 0.
3 0.
2 0.
3Co
nstr
uctio
n 4.
4 7.
2 6.
1 7.
3 7.
3 7.
4 8.
1 8.
3Tr
ade,
rest
aura
nt &
hot
els
11.5
13
.8
17.5
16
.9
15.8
16
.7
16.4
16
.5Tr
ansp
orta
tion,
stor
age
& c
omm
unica
tions
5.
0 6.
7 7.
9 8.
7 8.
9 8.
7 8.
8 8.
6Fi
nanc
ing,
insu
ranc
e, re
al es
tate
&
0.8
0.9
1.1
1.4
1.4
1.5
1.6
1.6
busin
ess s
ervi
ces
Com
mun
ity, s
ocial
& p
erso
nal s
ervi
ces
13.1
15
.3
10.2
10
.3
9.9
10.2
11
.0
11.6
Tota
l 10
0.0
100.
0 10
0.0
100.
0 10
0.0
100.
0 10
0.0
100.
0
W
omen
Agr
icultu
re
56.0
43
.6
46.7
44
.6
44.3
41
.1
41.4
39
.9M
inin
g &
qua
rrin
g 0.
3 0.
4 0.
2 0.
5 0.
4 0.
3 0.
3 0.
3M
anuf
actu
ring
11.8
15
.1
14.3
13
.3
15.1
14
.6
14.3
14
.0E
lectri
city,
gas &
wat
er
0.0
0.1
0.0
0.1
0.0
0.1
0.1
0.0
Cons
truc
tion
0.2
0.4
0.4
0.3
0.3
0.4
0.4
0.3
Trad
e, re
stau
rant
& h
otels
19
.8
24.2
25
.6
26.8
25
.2
26.5
27
.7
27.7
Tran
spor
tatio
n, st
orag
e &
com
mun
icatio
ns
0.2
0.3
0.6
0.6
0.5
0.9
1.0
1.8
Fina
ncin
g, in
sura
nce,
real
esta
te &
0.
4 0.
7 0.
7 0.
8 0.
9 1.
2 1.
1 1.
1bu
sines
s ser
vice
sCo
mm
unity
, soc
ial &
per
sona
l ser
vice
s 11
.3
15.3
11
.4
12.9
13
.1
15.0
13
.8
14.7
Tota
l 10
0.0
100.
0 10
0.0
100.
0 10
0.0
100.
0 10
0.0
100.
0So
urce:
BPS
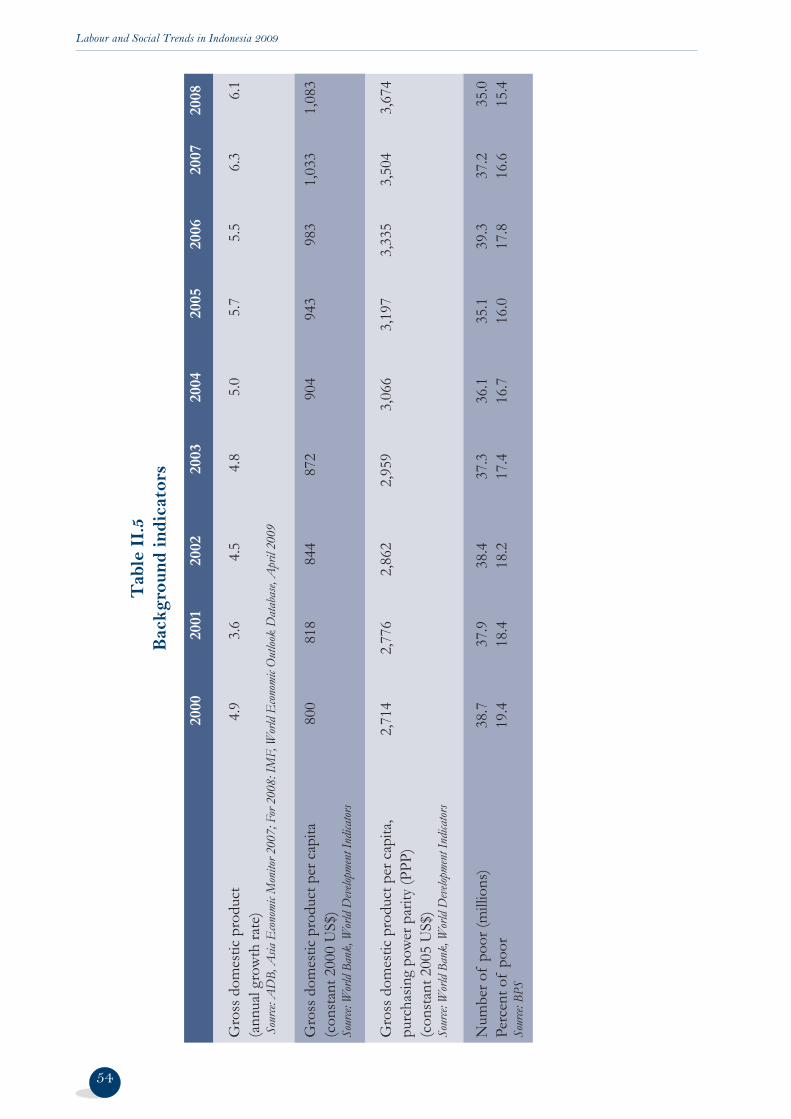
Labour and Social Trends in Indonesia 2009
Tab
le I
I.5
Bac
kgro
und
indi
cato
rs
20
00
2001
20
02
2003
20
04
2005
20
06
2007
20
08
Gro
ss d
omes
tic p
rodu
ct
4.9
3.6
4.5
4.8
5.0
5.7
5.5
6.3
6.1
(ann
ual g
row
th ra
te)
Sou
rce: A
DB,
Asia
Econ
omic
Mon
itor 2
007;
For
200
8: IM
F, W
orld
Econ
omic
Out
look
Dat
abas
e, A
pril
2009
Gro
ss d
omes
tic p
rodu
ct p
er c
apita
80
0 81
8 84
4 87
2 90
4 94
3 98
3 1,
033
1,08
3(c
onst
ant 2
000
US$
)So
urce:
Wor
ld Ba
nk, W
orld
Deve
lopme
nt In
dicat
ors
G
ross
dom
estic
pro
duct
per
cap
ita,
2,71
4 2,
776
2,86
2 2,
959
3,06
6 3,
197
3,33
5 3,
504
3,67
4pu
rcha
sing
pow
er p
arity
(PPP
) (c
onst
ant 2
005
US$
)So
urce:
Wor
ld Ba
nk, W
orld
Deve
lopme
nt In
dicat
ors
N
umbe
r of
poor
(mill
ions
) 38
.7
37.9
38
.4
37.3
36
.1
35.1
39
.3
37.2
35
.0
Perc
ent o
f po
or
19.4
18
.4
18.2
17
.4
16.7
16
.0
17.8
16
.6
15.4
So
urce:
BPS
54