White Dwarf Magazine - Classic Traveller - White Dwarf Articles
Upload
truongcongCategory
view
214download
0
Sandia National Laboratories is a multi-program laboratory managed and operated by Sandia Corporation, a wholly owned subsidiary of Lockheed Martin Corporation, for the U.S. Department of Energy’s National Nuclear Security Administration under contract DE-AC04-94AL85000. SAND NO. 2011-XXXXP
Laboratory White Dwarf PhotospheresRoss E. Falcon
Current Challenges on the Physics of White Dwarf StarsSanta Fe, NM
2017.06.15
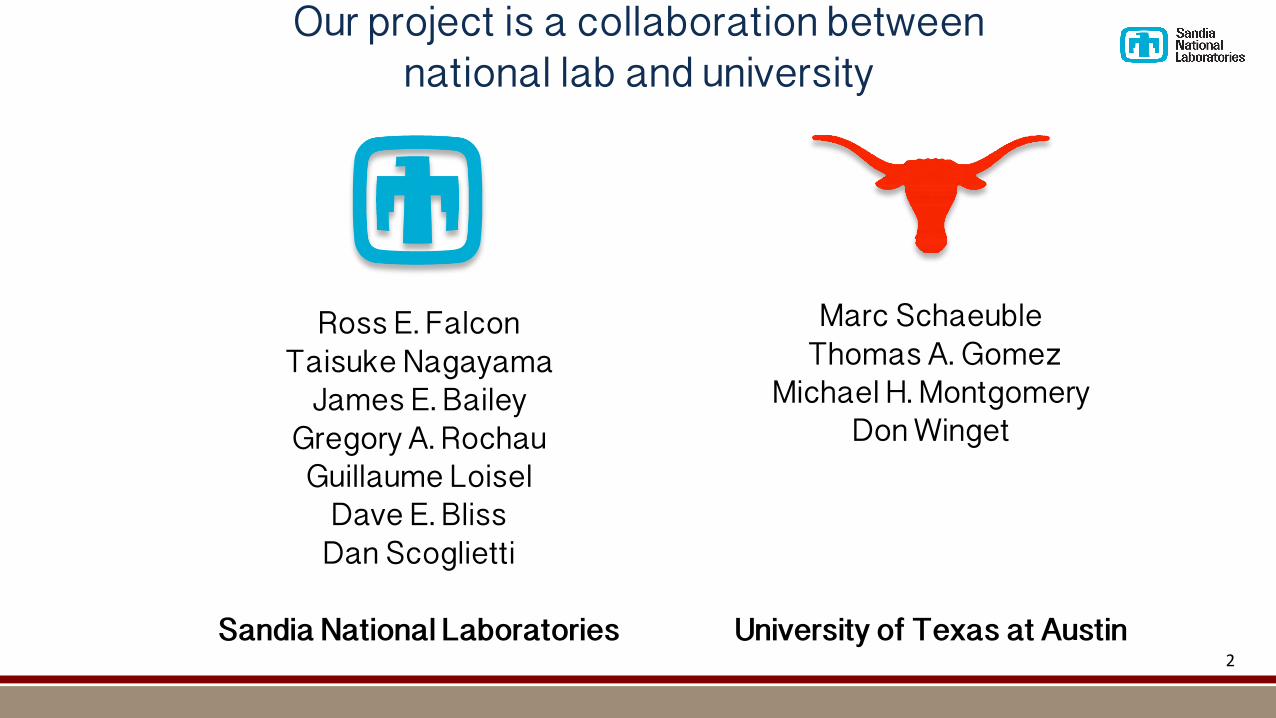
Our project is a collaboration between national lab and university
Ross E. FalconTaisuke Nagayama
James E. BaileyGregory A. Rochau
Guillaume LoiselDave E. Bliss
Dan Scoglietti
Sandia National Laboratories
Marc SchaeubleThomas A. Gomez
Michael H. MontgomeryDon Winget
University of Texas at Austin2

Summary: our experimental platform to measure white dwarf (WD) photospheric plasmas has provided unprecedented laboratory tests
• At higher electron densities than previously measured, Hβ as a diagnostic now disagrees between theories
• Fits to our measured line profiles of Hγ and Hβ show relative disagreement with the theoretical profiles• Shape• Strength (occupation probability)
3

Line profiles used in WD atmosphere models are very precise, but are they accurate?
• Precision of the spectroscopic method (see, e.g., Bergeron et al. 1992):
• Effective temperature (δTeff/Teff) ~ 5%• Surface gravity (δlog g/log g) ~ 1%
• Used for 10,000s of WDs
• In WD community, Stark-broadened H line profiles by Tremblay & Bergeron (2009; TB) now replace Vidal, Cooper, & Smith (1973; VCS) profiles as tabulated by Lemke (1997)• Initially resulted in systematic increases:
• ΔTeff ~ 200—1000 K• Δlog g ~ 0.04—0.1• ΔM ~ 0.034 MSun (up from 0.614 MSun)• For 250 WDs from the Palomar-Green
Survey (Liebert et al. 2005)
• VCS and TB profiles differ with increasing principal quantum number, n, and with increasing electron density, ne
4
VCSTB
CalculatedatTe =1eVandne =1017 cm−3

• Measure multiple H Balmer lines simultaneously at a range of electron density, ne• Use Hβ to diagnose plasma conditions; experimentally validated (Kellerher et al. 1993)• Include up to at least Hδ
• Use Wiese et al. (1972) to validate (ne < 1017 cm-3)• Arc-discharge experiment• Benchmark for H line shapes for >40 years• Only experiment to measure multiple H Balmer lines at these conditions
• We now extend to higher ne (> 1017 cm-3)
5
We can test these line shapes in the laboratory

J
BJ x B
Prad ≲ 330 TW, Yrad ≲ 2 MJ
4 cm
Sandford et al. (2002), PoP, 9, 3573; Bailey et al. (2006), PoP, 13, 056301; Slutz et al. (2006), PoP, 13, 102701
Z Accelerator uses 27 million Amperes to create x-rays

7
Rochau et al. (2014), PoP, 21, 056308
X-ray source simultaneously drives multiple experiments inside vacuum chamber

8
Rochau et al. (2014), PoP, 21, 056308
X-ray source simultaneously drives multiple experiments inside vacuum chamber
9
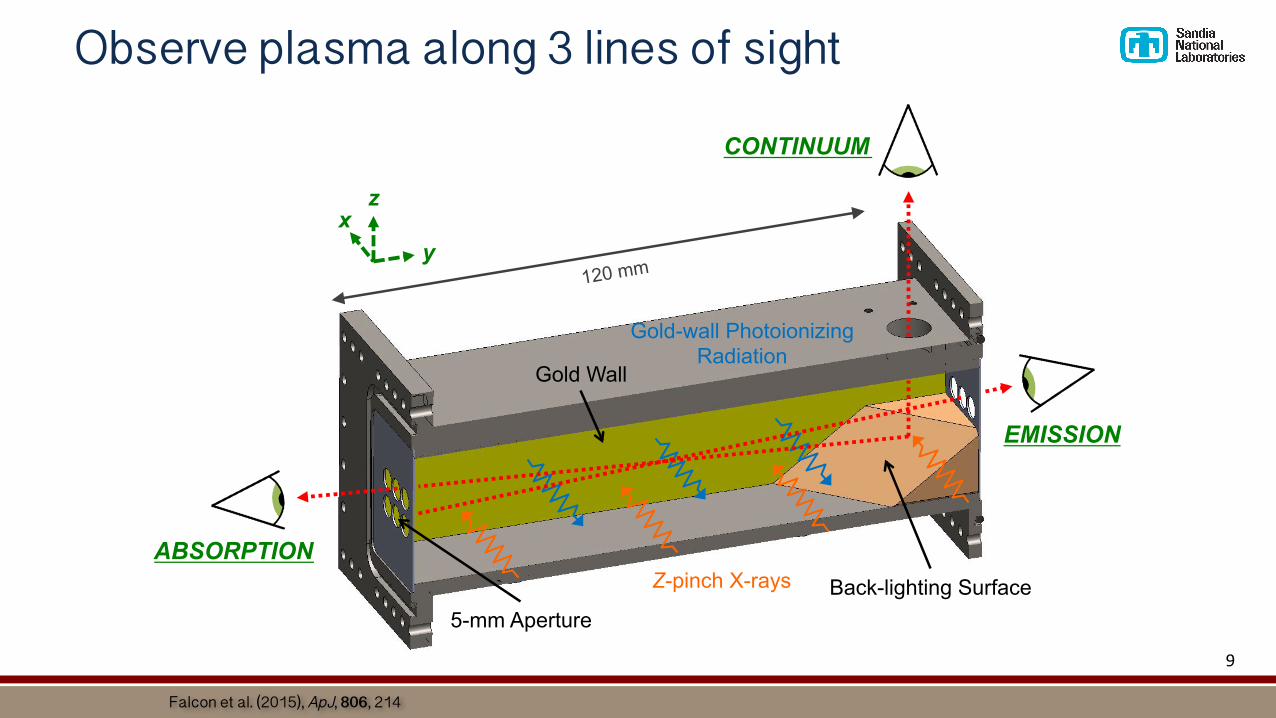
Back-lighting Surface
ABSORPTION
EMISSION
CONTINUUM
z
y x
Gold Wall
Z-pinch X-rays
Gold-wall Photoionizing Radiation
5-mm Aperture
120 mm
Falcon et al. (2015), ApJ, 806, 214
Observe plasma along 3 lines of sight
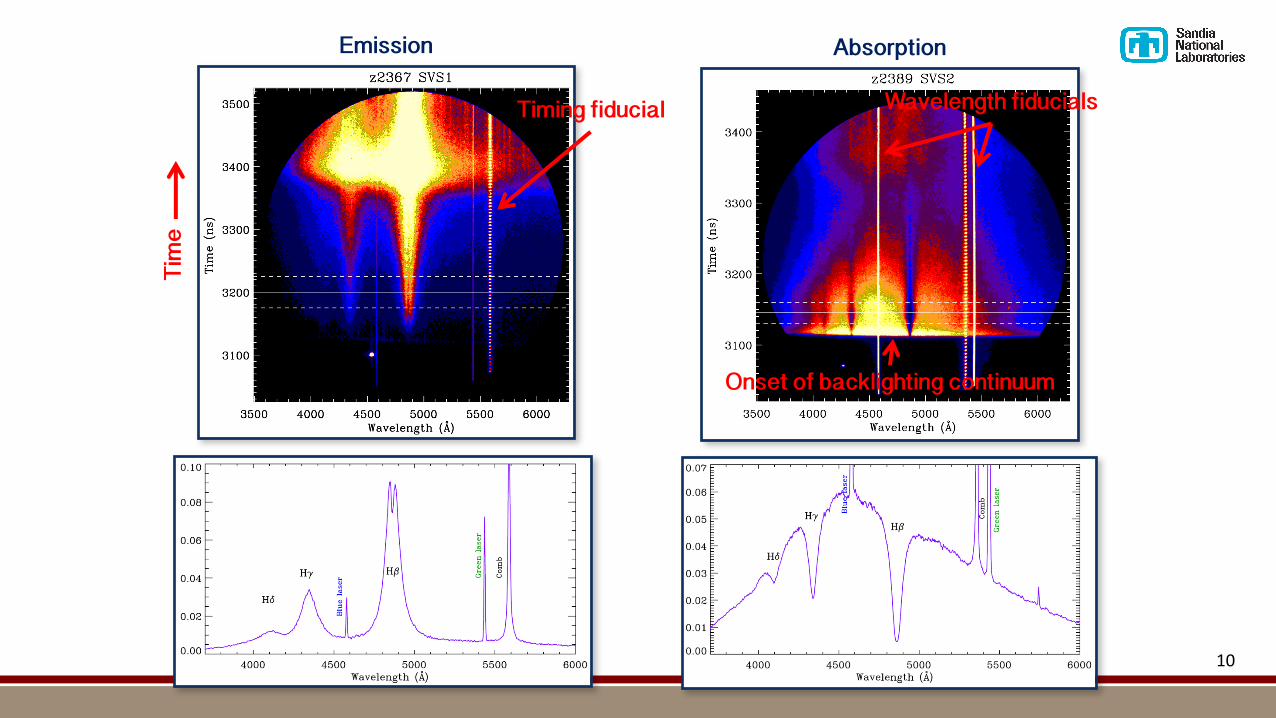
10
Emission Absorption
Timing fiducial
Tim
e
Onset of backlighting continuum
Wavelength fiducials

11
We measure and fit the Hβ transmission line throughout the duration of our experiment
Measured profile widens and develops more structure with time

12
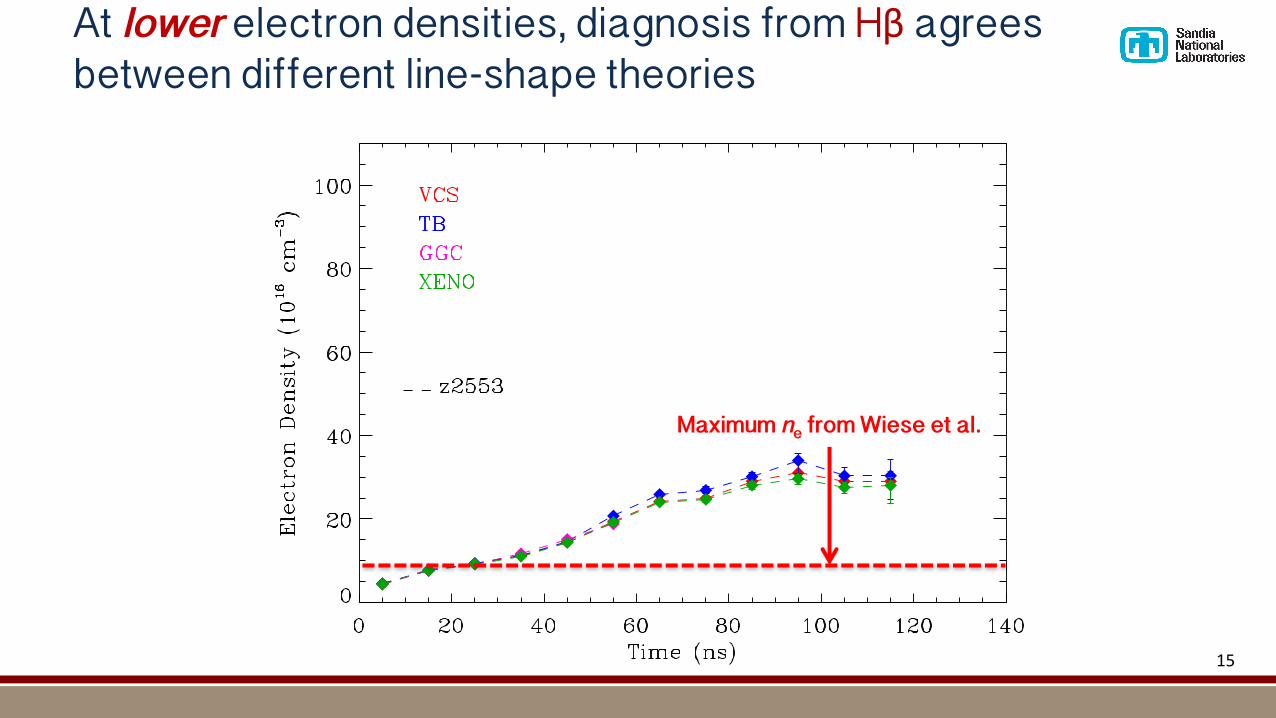
• Theoretical line-profile theories used• Vidal, Cooper & Smith (1973, VCS)• Tremblay & Bergeron (2009, TB)• Gigosos et al. (2003, GGC)• Gomez et al. (Xenomorph or XENO)
We measure and fit the Hβ transmission line throughout the duration of our experiment
Measured profile widens and develops more structure with time

13
Falcon et al. (2015), ApJ, 806, 214
Theoretical line profiles used by WD astronomers do not fit as well as others
• VCS and now TB used in WD astronomy community• What else is there?
• Computer-simulated calculations• i.e., Gigosos et al. (2003, GGC), Gomez et al. (Xenomorph)

14
Falcon et al. (2015), ApJ, 806, 214
Maximum ne from Wiese et al.
• VCS and now TB used in WD astronomy community• What else is there?
• Computer-simulated calculations• i.e., Gigosos et al. (2003, GGC), Gomez et al. (Xenomorph)
• Agreement over a range of electron density (analogous to surface gravity) not previously tested
BUT, the inferred conditions agree!
15
Maximum ne from Wiese et al.
At lower electron densities, diagnosis from Hβ agrees between different line-shape theories

16
• Same gas cell
• Decreased LOS distance from radiating gold wall
Falcon et al. (2017), ASPC, 509, 149
At higher electron densities, diagnosis from Hβ diverges between different line-shape theories
Maximum ne from Wiese et al.

17
• Same gas cell
• Decreased LOS distance from radiating gold wall
• We can increase temperature by moving gas cell closer to x-rays
• Recent experiments measure helium
Falcon et al. (2017), ASPC, 509, 149
At higher electron densities, diagnosis from Hβ diverges between different line-shape theories
Maximum ne from Wiese et al.

18
• Same gas cell
• Decreased LOS distance from radiating gold wall
• We can increase temperature by moving gas cell closer to x-rays
• Recent experiments measure helium
Falcon et al. (2017), ASPC, 509, 149
At higher electron densities, diagnosis from Hβ diverges between different line-shape theories
Maximum ne from Wiese et al.
See Marc Schaeuble’sposter!

19
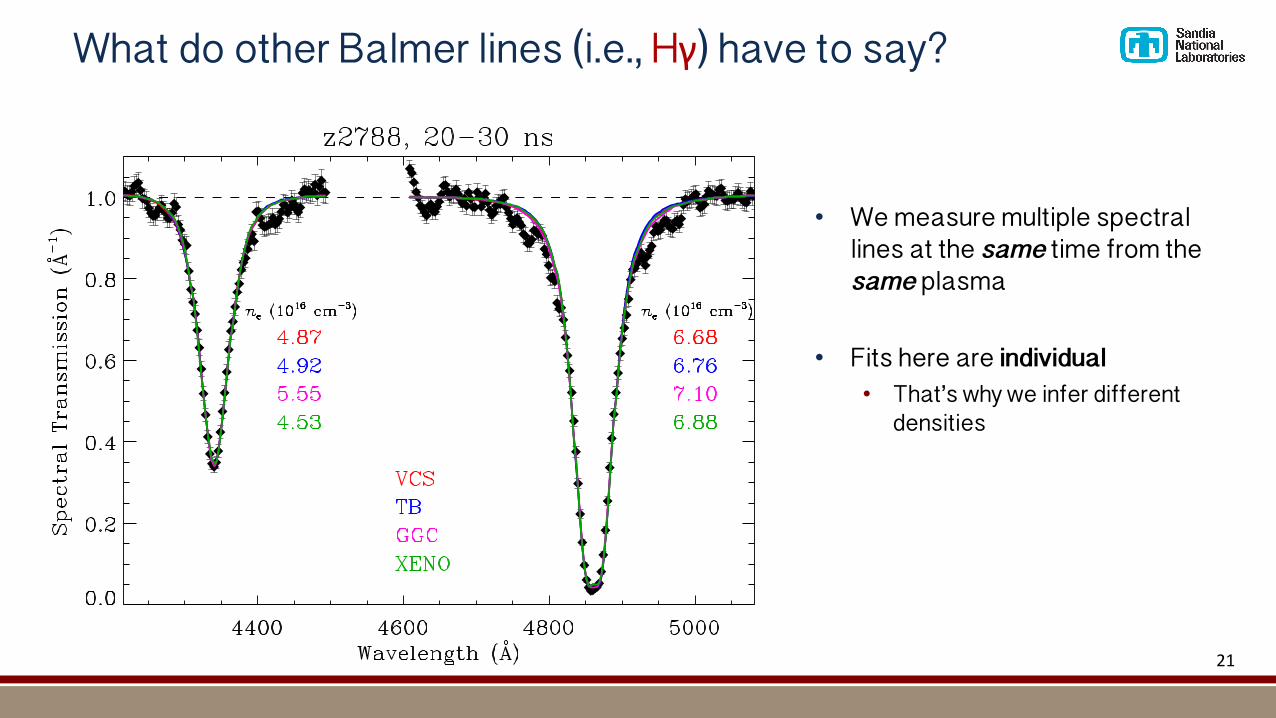
• We measure multiple spectral lines at the same time from the same plasma
What do other Balmer lines (i.e., Hγ) have to say?

20
• We measure multiple spectral lines at the same time from the same plasma
• Fits here are simultaneous• Not weighted• Simultaneous fit did not converge
What do other Balmer lines (i.e., Hγ) have to say?
VCSTBGGCXENO
21
• We measure multiple spectral lines at the same time from the same plasma
• Fits here are individual• That’s why we infer different
densities
What do other Balmer lines (i.e., Hγ) have to say?

22
Transmission fits for Hγ infer different electron densities than for Hβ
• BUT data are poorer for Hγ than for Hβ• Less signal (especially for emission data)• Fewer spectral points
• Besides this shot experiment, we see this behavior during multiple shots (z2553, z2835, z2873)
• Currently investigating this discrepancy
• Experimental?• Theoretical?

• Including higher-order lines in fits infers lower surface gravity• Tremblay & Bergeron provide
consistency, but trend still exists
• If Hβ is indeed more accurate, then WD surface gravities (and masses) are underestimated
• Implies masses should be larger, as suggested by gravitational-redshift masses (Falcon et al. 2010)
23Figure from Tremblay & Bergeron (2009)
TB
Intriguing trend seen in spectroscopic fits to observed WD spectra

We witness our plasma relax into local thermodynamic equilibrium (LTE)
§ Lower (n = 2) level population, n2, allows us to infer electron temperature, Te§ Measured line strength includes a measurement of occupation probabilities!
24
Falcon et al. (2015), ApJ, 806, 214

By measuring line strengths, our data provide new, unique tests of occupation probabilities
25
Falcon et al. (2015), ApJ, 806, 214
• Measured curve falls off with nemore steeply than predicted by Seaton (1990)• Preliminary analysis neglects
instrumental broadening
𝜅"#
𝜅"$=𝑔5𝑓)→+𝑤+(𝑛/)𝑔4𝑓)→2𝑤2(𝑛/)
Use published oscillator strengths (Baker 2008)
Occupation probabilities
Opacities

By measuring line strengths, our data provide new, unique tests of occupation probabilities
26
Falcon et al. (2015), ApJ, 806, 214
• Measured curve falls off with nemore steeply than predicted by Seaton (1990)• Preliminary analysis neglects
instrumental broadening
𝜅"#
𝜅"$=𝑔5𝑓)→+𝑤+(𝑛/)𝑔4𝑓)→2𝑤2(𝑛/)
Use published oscillator strengths (Baker 2008)
Occupation probabilities
Opacities
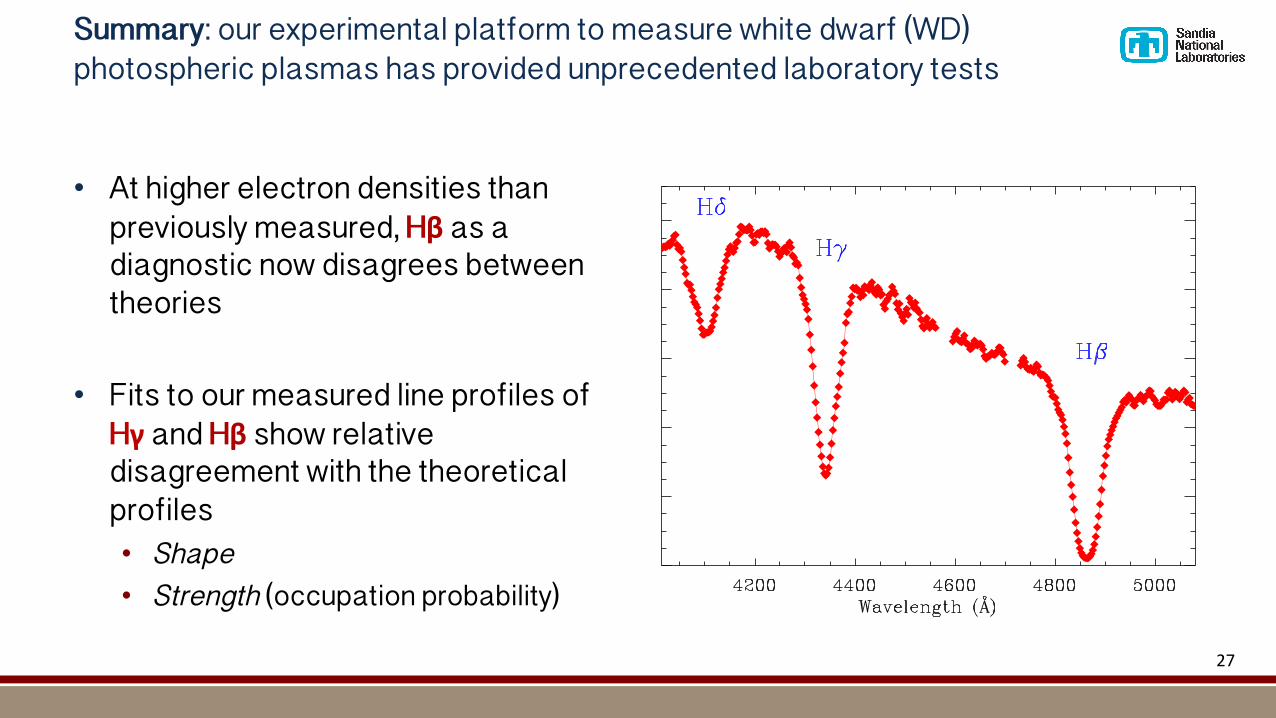
Summary: our experimental platform to measure white dwarf (WD) photospheric plasmas has provided unprecedented laboratory tests
• At higher electron densities than previously measured, Hβ as a diagnostic now disagrees between theories
• Fits to our measured line profiles of Hγ and Hβ show relative disagreement with the theoretical profiles• Shape• Strength (occupation probability)
27