Laboratory investigation of using foam grout as micro ...
12
1 Laboratory investigation of using foam grout as micro-trench backfilling material in cold regions Authors: Vinicius Afonso Velasco Rios MSc Student, University of Alberta 7-130 Markin/CNRL Natural Resources Engineering Facility 9105 116th St. Edmonton, AB Canada T6G 2W2 (e-mail) [email protected] Thomas W. Johnson MSc Student, University of Alberta 1-060 Markin/CNRL Natural Resources Engineering Facility 9105 116th St. Edmonton, AB Canada T6G 2W2 (e-mail) [email protected] Leila Hashemian, Ph.D. Assistant Professor, University of Alberta 7-255, Donadeo Innovation Centre for Engineering 9211 116th St., University of Alberta Edmonton, AB, Canada T6G 1H9 (e-mail) [email protected] 780-492-8934 Paper prepared for presentation at the SES - Testing and Modeling of Road and Embankment Materials Session of the 2018 Conference of the Transportation Association of Canada Saskatoon, SK
Transcript of Laboratory investigation of using foam grout as micro ...

1
Laboratory investigation of using foam grout as micro-trench backfilling
material in cold regions
Authors:
Vinicius Afonso Velasco Rios MSc Student, University of Alberta
7-130 Markin/CNRL Natural Resources Engineering Facility 9105 116th St.
Edmonton, AB Canada T6G 2W2 (e-mail) [email protected]
Thomas W. Johnson
MSc Student, University of Alberta 1-060 Markin/CNRL Natural Resources Engineering Facility
9105 116th St. Edmonton, AB Canada T6G 2W2 (e-mail) [email protected]
Leila Hashemian, Ph.D.
Assistant Professor, University of Alberta 7-255, Donadeo Innovation Centre for Engineering
9211 116th St., University of Alberta Edmonton, AB, Canada T6G 1H9 (e-mail) [email protected]
780-492-8934
Paper prepared for presentation at the SES - Testing and Modeling of Road and Embankment Materials
Session of the 2018 Conference of the Transportation Association of Canada
Saskatoon, SK

2
Abstract
Micro-trenching, an innovative method for fiber optic cables installation, involves creating a narrow
trench in the road pavement to place a cable or conduit; the trench is normally narrower than 40 mm
wide and shallower than 300 mm deep, depending on the size of the used conduit and trencher. After
cutting the pavement, the next step is cleaning the area and placing the cable or conduit inside the
trench, followed by backfilling. The quality of the backfilling plays an important role in both the
sustainability of the installed cable or conduit and the cut pavement; using unsuitable materials or
improperly installing cable or conduit can significantly decrease pavement life. The trench dimensions
are very small, so for a successful procedure the backfilling material should be self-compacted and
flowable enough to penetrate and completely fill the whole trench depth. As it has been investigated
before, using traditional backfilling material such as play sand is not appropriate for Canadian cold
regions; hence, it is recommended to stabilize the conduit inside the pavement’s granular layer using a
material similar to a cement grout. Alternatively, foam grout is a mixture of cement, water, and pre-
formed foam; the foam considerably reduces the density of the blend by adding air, which consists of
more than 25% of the mix. As a result, using this foam grout technology reduces the amount of cement
required significantly and could be a cost effective solution for backfilling. The objective of this paper is
to assess foam grout as a backfilling material for micro-trenching in cold climates. For this purpose, foam
grout samples were prepared in a laboratory and their compressive strengths before and after several
freeze and thaw cycles were investigated. Different mix-proportioning ratios were also studied in an
attempt to create a more reliable method and assess variations in compressive strength and cost along
with density.
Key Words: foam grout, freeze and thaw conditioning, compressive strength, mix proportioning.

3
INTRODUCTION AND BACKGROUND
Micro-trenching is a cable installation method that presents a reliable technique to the
telecommunication industry due to its low cost, fast-paced execution, and more environmentally
friendly aspects [1]. This cable-installation method is a cost-effective solution to time-consuming and
disruptive traditional trenching methods, like open-cut [2], especially when considering the logistics of
the last 200 meters of fiber optic deployment, known to service providers as fiber-to-the-home (FTTH)
[3]. Using this technique, a trench no wider than 40 mm and between 120-300 mm deep is created
alongside the edge of the road; trenching closer to the curb is preferable in order to avoid direct load
caused by vehicles in their wheel path [4]. The trench is then cleaned and cables are laid inside. The
most important step of this method is backfilling. The pavement must be – as much as possible –
reinstated to its original condition. However, the size of the trench poses a great challenge to this
process. Materials used as backfill must secure the cable inside the trench and be self-compact,
flowable, stable, properly bond with the existing structure, and prevent water penetration [5]. It is
important to note that the cut normally affects more than one layer of the pavement. Therefore, more
than one material is usually applied as backfill. Figure 1 presents the three-step procedure for micro-
trenching including cutting the trench (a), laying the cable (b) and backfilling (c).
Figure 1: Micro-trenching Procedure. (a) Cutting the trench. (b) Laying cable. (c) Backfilling
Micro-trench backfilling in cold regions presents a new challenge due to the unpredictable freeze and
thaw cycles during changing seasons. With these extreme conditions, traditional materials like sand may
not be suitable for backfilling purposes; for example, a pilot study investigation located in Edmonton,
Alberta, Canada, used sand as a backfilling material in two different micro-trench techniques, and
discovered that the cables had moved significantly [6]. With the first method, the 9 mm wide and 80
mm deep trench was completely filled with sand after the cable installation and covered with a hot
sealant. With the second method, a 15 mm wide and 23 mm deep trench was filled with sand from the
bottom to the interface of soil and pavement layers, and cold mix asphalt added on top. Monitoring the
micro-trenches using ground penetrating radar (GPR) revealed considerable movements in the cables
after a few months of installation [6]. Alternatively, in order to stabilize and protect the conduit inside
the soil layer, cement grout was suggested as a replacement for sand. The setting time of the cement
grout can be adjusted by changing the water temperature; additionally, the use of fast-setting cement
will accelerate curing to less than 1 hour [7]. The use of cement grout as backfilling material has some
drawbacks, as grout compressive strength can be as high as 28 MPa after the first day of curing and may
increase to 40 MPa after 28 days. These high compressive strength values compared to soil may lead to
stress development on the interface of the existing material and the reinstatement product. In addition,

4
the high cost of cement may make this solution uneconomical. To decrease the strength and lower the
price of backfilling material, foam grout can be presented as reliable substitute.
Foam grout
Foam or aerated grout is basically a mix of cement, water, and foam. In foam grout, the air bubbles
produced will act as a temporary wrapping material for the mortar [8]. Foam can be generated by
directly adding a foaming agent to the mix or it can be pre-formed in a separated recipient. In the dry
method, a solution of water and foaming agent is forced through a series of high density restrictions by
injecting compressed air into the mix recipient. The result is a thick foam similar to shaving foam [9]. The
density of the mortar can be controlled by the amount of foam added. Density ranges from 300 to 1,800
kg/m3 can be obtained [8, 10]. However, care should be taken towards the material specification, as any
decrease in density will directly decrease the compressive strength of the grout after curing [8, 10, 11,
12, 13]. There is no defined mix proportioning for foam grout [8, 11, 12, 13]. The material specification is
determined by collecting samples after each foam addition and controlling the density or strength [14].
The material is also very fluid, which provides an excellent load spreading and the ability to fill
inaccessible areas without any compaction requirements [8]. Other advantages of foam grout are that it
does not settle, can be produced in-situ, and has great thermal insulation properties. All listed
advantages guarantee successful applications for different purposes such as trench reinstatement, void
filling, road sub-base, building construction, and roofing insulation [8, 11].
Many projects have been conducted using foamed concrete as a construction material. In July 2006,
13,379 m3 were used as a fill to elevate the playing field of the Mets Stadium in New York about 1.5 to
1.8 m above the grade of the old parking lot. A 465 kg/m3 and 0.55 MPa mix was applied at productivity
rate of 765 m3 per shift, which provided a fast paced solution and direct savings of more than $500,000
[15]. In 2003, 7,951 m3 of wet cast foamed concrete was applied in a full depth reconstruction – along
with drainage improvements and curb installation – of the 3 km, four-lane Central Road in Schaumburg,
Illinois, USA. The area was facing ongoing settlement due to a soft organic underlying soil (peat) located
3 to 5 m under the roadway. The 480 kg/m3 material was produced onsite at a rate of 600-650 cm/day
and resulted in a cost and time effective solution to the problem in the area [16]. In a similar manner,
both a 500 mm and a 650 mm layer of material was applied in an intersection of the City of Victoria in
2007-2008 and in a 120 m rural highway in 2009, respectively, to solve differential settlement caused by
peat sub grade [17, 18].
OBJECTIVES AND SCOPES
The objective of this paper is to complete and review a laboratory evaluation of foam grout minimum
requirements for use as micro-trench backfilling material in cold regions. For this purpose, a mix design
was prepared considering the material density and compressive strength. To evaluate the resistance of
foam grout to freeze and thaw cycles, samples were conditioned and their compressive strength
measured. To further prove the benefits of using foam grout as compared to regular cement grout, a
cost analysis was prepared along with research and laboratory results.

5
Foam grout mix design
The mix proportioning method was developed by mixing 20 kg of Portland Cement Type GU at 1:2
water/cement ratio. Pre-formed foam with 5% protein-based foaming agent was added to the grout in
small batches of 2 L (150 g). This value represents 0.17% in mass of the entire mix. After each addition,
density was measured and three cylindrical samples were collected for compressive strength tests. The
molds used have a 75 mm diameter and 150 mm height. Before the samples could be measured for
density and tested for compressive strength, they were cured for 28 days inside a humidity chamber and
the end grinded off. The procedure of preparing foam (a), mixing (b) and pouring (c) is shown in Figure
2.
Figure 2: Sample Preparation. (a) Pre-formed dry foam. (b) Mixing. (c) Pouring in the molds
The recommended grout strength after curing is 1-3 MPa [19]; in this research, to be on the safe side,
the target compressive strength was selected between 3 and 5 MPa. After several tests, the
corresponding density to this strength was calculated as 850 kg/m3. The density values obtained after
each foam increment are presented in Figure 3.
Figure 3: Mix Proportioning Curve
Figure 4 demonstrates the decrease in compressive strength obtained after decreasing the density of
the foam grout mixture. As mentioned before, in foamed grout the air bubbles formed by the foam
behave as aggregates in the mortar. Any increase in foam volume means more air inside the mortar and
0.00%
0.50%
1.00%
1.50%
2.00%
2.50%
3.00%
0.400 0.600 0.800 1.000 1.200 1.400 1.600 1.800 2.000
Am
ou
nt
of
Fo
am
(%
in
M
ass
)
Density (g/cm3)

6
consequently, a lower density; that fact alone explains the compressive strength behaviour as air has no
measurable strength.
Figure 4: Compressive Strength Variations with Density
Another interesting observation is that the simple addition of foam in any amount results in a plunge in
compressive strength. For this experiment, adding 0.17% of foam in mass to regular grout caused the
compressive strength to drop from 30 MPa to 14 MPa. Note that this reduction becomes way less steep
after the first increment.
Freeze and thaw testing on foam grout
To evaluate the effects of density and freeze and thaw cycles in compressive strength, ASTM C39 [20]
procedure was followed. For the test, 62 foam grout samples with the density of 850 kg/m3 were
prepared. Samples were cured in a moist room for 3, 7, 14, 28, and 56 days and submitted to freeze and
thaw cycles. According to Kearsley and Mostert [12], foam concrete continues to gain strength after 28
days of curing. Therefore, this curing period was added to investigate if the same happens for foam
grout. Freezing cycles consisted of wrapping the samples in a plastic bag to prevent moisture loss and
placing them inside an environmental chamber at -18˚C for 24 hours. For thawing, frozen samples were
removed from plastic bags and submerged under water at 20˚C for 24 hours. Samples were conditioned
to 0, 7, 14, and 25 freeze and thaw cycles for each curing period. After conditioning, samples were
leveled using ASTM C 617 - 98 [21] method and crushed in the compressive strength machine.
Figure 5 shows the compressive strength results after exposure to multiple freeze and thaw cycles. After
3 days of curing, the ideal target of 3 MPa for compressive strength was obtained. A steady increase in
0
5
10
15
20
25
30
35
0.5 0.7 0.9 1.1 1.3 1.5 1.7
Co
mp
ress
ive
Str
en
gth
(M
Pa
)
Density (g/m3)
Min Limit Max Limit
7
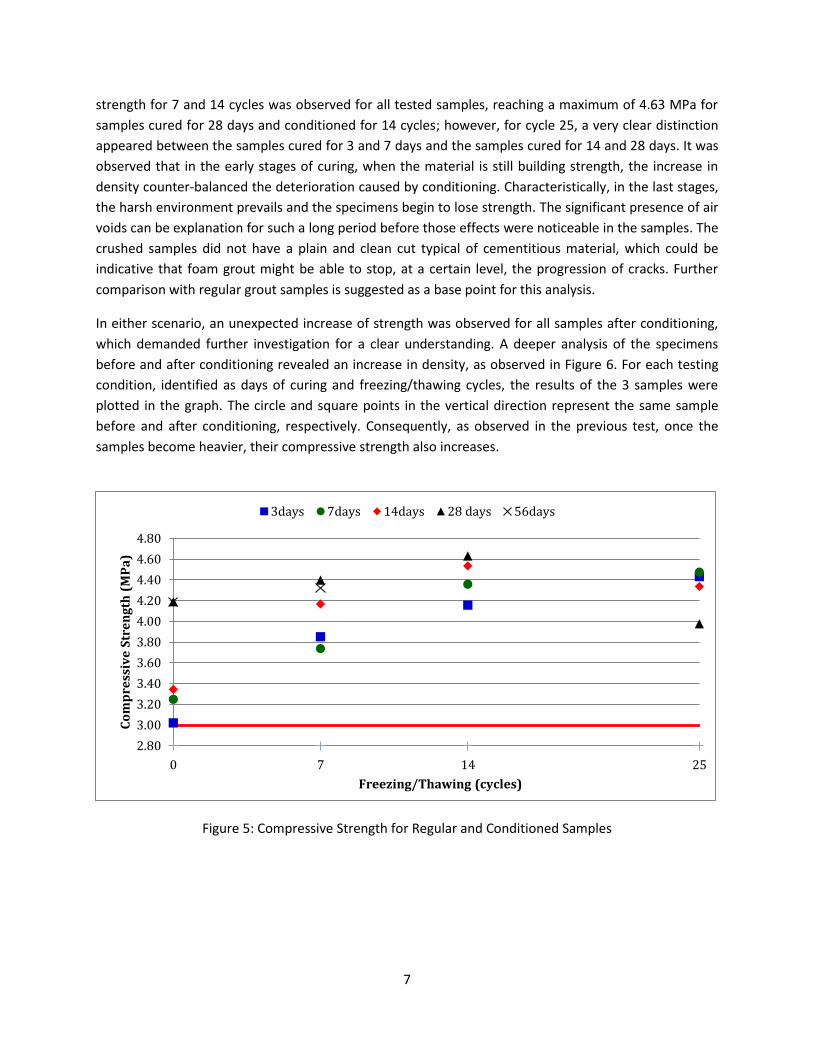
strength for 7 and 14 cycles was observed for all tested samples, reaching a maximum of 4.63 MPa for
samples cured for 28 days and conditioned for 14 cycles; however, for cycle 25, a very clear distinction
appeared between the samples cured for 3 and 7 days and the samples cured for 14 and 28 days. It was
observed that in the early stages of curing, when the material is still building strength, the increase in
density counter-balanced the deterioration caused by conditioning. Characteristically, in the last stages,
the harsh environment prevails and the specimens begin to lose strength. The significant presence of air
voids can be explanation for such a long period before those effects were noticeable in the samples. The
crushed samples did not have a plain and clean cut typical of cementitious material, which could be
indicative that foam grout might be able to stop, at a certain level, the progression of cracks. Further
comparison with regular grout samples is suggested as a base point for this analysis.
In either scenario, an unexpected increase of strength was observed for all samples after conditioning,
which demanded further investigation for a clear understanding. A deeper analysis of the specimens
before and after conditioning revealed an increase in density, as observed in Figure 6. For each testing
condition, identified as days of curing and freezing/thawing cycles, the results of the 3 samples were
plotted in the graph. The circle and square points in the vertical direction represent the same sample
before and after conditioning, respectively. Consequently, as observed in the previous test, once the
samples become heavier, their compressive strength also increases.
Figure 5: Compressive Strength for Regular and Conditioned Samples
0 7 14 25
2.80
3.00
3.20
3.40
3.60
3.80
4.00
4.20
4.40
4.60
4.80
Co
mp
ress
ive
Str
en
gth
(M
Pa
)
Freezing/Thawing (cycles)
3days 7days 14days 28 days 56days

8
Figure 6: Sample Density
Future tests need to be conducted to closely evaluate the reasons behind this increase in density.
Considering that every specimen was measured before and after conditioning and no difference was
observed, the logical assumption would be that water is being absorbed by the samples and replacing
the air within them. If water absorption is the sole test done to explain this density effect, then the
results create a rather uniform pattern with the sample characterization. Figure 7 shows the percentage
increase in mass of each group of conditioned samples. These groups were selected based on the
number of days the sample was cured (first number, e.g.: 3D) and the number of freezing/thawing
cycles (second number, e.g.: 1C).
Figure 7: Water Absorption
Corroborating with this theory, Figure 8 presents a distinct color difference between a sample that was
submitted to freeze/thaw cycles (on the left) and one that was not (on the right). The darker gray shade
0.0%
2.0%
4.0%
6.0%
8.0%
10.0%
Incr
ea
se i
n M
ass
(%
)
Sample ID

9
clearly indicates the presence of water within the conditioned sample, despite the fact that the outside
surface is bare dry. Additionally, the dimensions of each sample were measured before and after they
were conditioned and no apparent differences were detected; hence, density increment could be a
result of the sample’s water absorption.
Figure 8: Water Absorption Samples Before (right) and After Conditioning (left).
Cost analysis of using foam grout
To prove the benefits of using foam grout, a cost effectiveness analysis of the material was conducted.
Table 1 presents the savings obtained in regards to material cost with the foam addition and the
corresponding density of the sample piece. For backfilling applications, the target compressive strength
of 3 MPa can be obtained with a density range between 0.8 g/cm3 (6th increment) and 0.9 g/cm3 (5th
increment). In this range, around 50% of cement costs can be reduced by foamed grout utilization in
comparison with regular grout (blank).
TABLE 1: Cement Cost Saving with Foam Addition
Foam content (% in mass)
0 0.17% 0.37% 0.62% 0.90% 1.24% 1.64% 2.26% 2.82%
Average Density (g/cm3)
1.780 1.596 1.369 1.174 1.039 0.913 0.834 0.694 0.596
Average Cost Savings (%)
0.0% 10.3% 23.1% 34.0% 41.6% 48.7% 53.1% 61.0% 66.5%

10
The results of this study prove that the foaming agent is inexpensive when compared to the cost of
cement. In order to produce the first 2 L of foam, 1.25 g of the water/foaming agent mix was used.
Considering the 5% ratio applied, the total amount of foaming agent was 62.5 mg. In other words, 1 L of
foaming agent is enough to produce 20 L of water/agent mix, 800 L of foam and, consequently, 1.2 t of
foam grout at 850 kg/m3 density. For perspective, foaming agent can be purchased in North America for
an average of $10 USD/L [22].
CONCLUSIONS AND FUTURE STEPS
Conclusions obtained from the study are summarized as follows:
1- As previous literature stated, there is a direct proportional relationship between density and
compressive strength.
2- The simple addition of foam causes a considerable decrease in compressive strength that
becomes less evident as the quantity of foam increases.
3- The addition of foam can significantly decrease the cost of other materials in any application.
4- Regarding foamed grout, freezing and thawing conditioning results in an increase in density,
followed by a compressive strength increase after each cycle.
5- For short curing ages, this same increase in strength overcomes the deterioration of the
material when submitted to freezing/thawing conditions.
Based on the above conclusions, it is advisable as next steps for the research to further investigate the
reasons behind the increase of density after freeze/thaw cycles. Water absorption can be considered as
a reasonable start point to conduct observations. In order to draw a comprehensive cost effectiveness
study of the technique, production costs and productivity analysis can be conducted in field applications.
Additionally, the existence of test sections like the one in Edmonton, Alberta represent a great source of
information to assess long term performance of the application.
REFERENCES
[1] DCMS. (2011). “Microtrenching and Street Works: An advice note for Local Authorities and
Communications Providers.” Department for Culture, Media and Sport.
[2] Atalah, A., Chang-Jin, C., and Osburn, K. (2002). Comparison Study of Installing Fiber Optic Cable in
University Campuses Using Trenchless Techniques Relative to Open Cut, Pipelines 2002, American
Society of Civil Engineers (ASCE), August 4–7, pp. 1–17. https://doi.org/10.1061/40641(2002)70
[3] Duraline Technical Report. (2016). Recommended Procedures for Conduit Microtrenching and
Restoration. Technical Bulletin: DCEB-10002, pp. 1–21.
[4] Network Strategies. (2008). Micro-trenching: can it cut the cost of fibre to the home? Network
Strategies, Auckland, New Zealand [online]: Available from: http://strategies.nzl.com/industry-
comment/micro-trenching-can-it-cut-the-cost-of-fibre-to-the-home/

11
[5] Stirling Lloyd Polychem Ltd. (2011). Highway maintenance, micro-trenching product in action:
Shetland fiber optic network. Stirling Lloyd Polychem Ltd., Knutsford, UK.
[6] Hediyeh, V. (2015). Application of Micro-Trenching for Fiber to the Home.
[7] Hashemian, L., Rezaei, M., & Bayat, A. (2017). Field and laboratory investigations on pavement
backfilling material for micro-trenching in cold regions. International Journal of Pavement Research and
Technology, 10(4), 333–342. https://doi.org/10.1016/j.ijprt.2017.03.010
[8] Liew, A. C. M. (2005). New innovative lightweight foam concrete technology. In R. K. Dhir, M. D.
Newlands, & A. McCarthy (Eds.), Use of Foamed Concrete in Construction(p. 6). Thomas Telford.
[9] Aldridge, D. (2005). Introduction to foamed concrete: What, why, how? In Proceedings of the
International Conference on the Use of Foamed Concrete in Construction (pp. 1–14). Retrieved from:
http://www.scopus.com/inward/record.url?eid=2-s2.0-33645301321&partnerID=tZOtx3y1
[10] Narayanan, N., and Ramamurthy, K. (2000). Structure and properties of aerated concrete: A review.
Cement and Concrete Composites, 22(5), 321–329. https://doi.org/10.1016/S0958-9465(00)00016-0
[11] Jones, M. R., and McCarthy, A. (2005). Behaviour and assessment of foamed concrete for
construction applications. In R. K. Dhir, M. D. Newlands, & A. McCarthy (Eds.), Use of Foamed Concrete
in Construction: Proceedings of the International Conference held at the University of Dundee, Scotland,
UK (pp. 61–88). London: Thomas Telford.
[12] Kearsley, E. P., and Mostert, H. F. (2005). OPPORTUNITIES FOR EXPANDING THE USE OF FOAMED
CONCRETE IN THE CONSTRUCTION INDUSTRY. In Use of Foamed Concrete in Construction (pp. 143–
154). https://doi.org/10.1680/uofcic.34068.0015
[13] Ramamurthy, K., Kunhanandan Nambiar, E. K., & Indu Siva Ranjani, G. (2009). A classification of
studies on properties of foam concrete. Cement and Concrete Composites, 31(6), 388–396.
https://doi.org/10.1016/j.cemconcomp.2009.04.006
[14] Tikalsky, P. J., Pospisil, J., & MacDonald, W. (2004). A method for assessment of the freeze-thaw
resistance of preformed foam cellular concrete. Cement and Concrete Research, 34(5), 889–893.
https://doi.org/10.1016/j.cemconres.2003.11.005
[15] MixonSite. (2006). Foam Concrete Alternative for Lightweight Aggregate. Retrieved from:
https://mixonsite.com/case_studies/new_mets_stadium/
[16] Cematrix. (2003). Road Sub Base. Retrieved from: http://www.cematrix.com/_resources/case-
studies/cs-central-road.pdf
[17] Cematrix. (2008). Case Study - Road Base over Peat - Urban Road. Retrieved from:
http://www.cematrix.com/_resources/case-studies/cs-vancouver.pdf

12
[18] Cematrix. (2009). Case Study - Road Base over Peat - Rural Road. Retrieved from:
http://www.cematrix.com/_resources/case-studies/cs-dixie-road.pdf
[19] Chorus. (2011). Deployment Standards Initiative Kelson Micro & Mini Trenching Pilot. Retrieved
from: http://www.mbie.govt.nz/info-services/sectors-industries/technology-
communications/communications/broadband-mobile-initiatives/documents-image-library/dsi-kelson-
pilot-report-april-2011.pdf
[20] ASTM International. (2017). ASTM C39/C39M – 17b: Standard Practice for Compressive Strength of
Cylindrical Concrete Specimens.
[21] ASTM International. (2003). ASTM C 617-98: Standard Practice for Capping Cylindrical Concrete
Specimens.
[22] Cematrix. (2018). Leightweigth backfill applications. Retrieved from:
http://www.cematrix.com/applications/lightweight-backfill/