Laboratory Determination of Hydraulic Conductivity Functions · 2011-08-12 · Laboratory...
229
Laboratory Determination of Hydraulic Conductivity Functions for Unsaturated Cracked Fine Grained Soil by Sean C. Jacquemin A Thesis Presented in Partial Fulfillment of the Requirements for the Degree Masters of Science Approved March 2011 by the Graduate Supervisory Committee: Claudia Zapata, Co-Chair Sandra Houston, Co-Chair Edward Kavazanjian ARIZONA STATE UNIVERSITY May 2011
Transcript of Laboratory Determination of Hydraulic Conductivity Functions · 2011-08-12 · Laboratory...
Laboratory Determination of Hydraulic Conductivity Functions
for Unsaturated Cracked Fine Grained Soil
by
Sean C. Jacquemin
A Thesis Presented in Partial Fulfillment of the Requirements for the Degree
Masters of Science
Approved March 2011 by the Graduate Supervisory Committee:
Claudia Zapata, Co-Chair Sandra Houston, Co-Chair
Edward Kavazanjian
ARIZONA STATE UNIVERSITY
May 2011

ii
ABSTRACT
In geotechnical engineering, measuring the unsaturated hydraulic conductivity of
fine grained soils can be time consuming and tedious. The various applications that
require knowledge of the unsaturated hydraulic conductivity function are great, and in
geotechnical engineering, they range from modeling seepage through landfill covers to
determining infiltration of water under a building slab. The unsaturated hydraulic
conductivity function can be measured using various direct and indirect techniques. The
instantaneous profile method has been found to be the most promising unsteady state
method for measuring the unsaturated hydraulic conductivity function for fine grained
soils over a wide range of suction values. The instantaneous profile method can be
modified by using different techniques to measure suction and water content and also
through the way water is introduced or removed from the soil profile. In this study, the
instantaneous profile method was modified by creating duplicate soil samples compacted
into cylindrical tubes at two different water contents. The techniques used in the
duplicate method to measure the water content and matric suction included volumetric
moisture probes, manual water content measurements, and filter paper tests. The
experimental testing conducted in this study provided insight into determining the
unsaturated hydraulic conductivity using the instantaneous profile method for a sandy
clay soil and recommendations are provided for further evaluation.
Overall, this study has demonstrated that the presence of cracks has no
significant impact on the hydraulic behavior of soil in high suction ranges. The results of
this study do not examine the behavior of cracked soil unsaturated hydraulic conductivity
at low suction and at moisture contents near saturation.

iii
ACKNOWLEDGMENTS
This work was supported by the National Science Foundation. I would like to
thank all those who made this thesis possible. I owe my deepest gratitude to Dr. Claudia
Zapata and Dr. Sandra L. Houston for their valuable inputs regarding my research. I
would also like to thank Dr. Edward Kavazanjian for serving on my committee and
providing guidance, Dr. Bruno Welfert for his mathematic skills, Mr. Peter Goguen for
his assistance in the laboratory, and my colleges Sam Abbaszadeh, Brad Kuna, Anushree
Bharadwaj, Daniel Rosenbalm, Kanyembo Katapa, and David Czupak for their much
appreciated support. Finally, I owe my parents the most thanks for supporting me
throughout my academics studies at ASU.

iv
TABLE OF CONTENTS
Page
LIST OF TABLES ........................................................................................................... viii
LIST OF FIGURES ............................................................................................................ x
CHAPTER
1 INTRODUCTION ................................................................................................. 1
Background ............................................................................................... 1
Objectives ................................................................................................. 6
Scope and Limitations .............................................................................. 6
Organization ............................................................................................. 7
2 LITERATURE REVIEW ...................................................................................... 8
Introduction ............................................................................................... 8
Models of Unsaturated Hydraulic Conductivity ....................................... 8
Measurement of the Unsaturated Hydraulic Conductivity ..................... 15
Effects of Cracks to the Unsaturated Hydraulic Conductivity ................ 31
3 SOIL PROPERTIES AND EXPERIMENTAL DESIGN ................................... 36
Soil Characterization ............................................................................... 36
Experimental Design ............................................................................... 46
Intact Instantaneous Profile Experiments .................................. 47
Cracked Instantaneous Profile Experiments .............................. 50

v
CHAPTER Page
4 LABORATORY TESTING OF THE UNSATURATED HYDRAULIC
CONDUCTIVITY FOR THE INTACT AND CRACKED
CONDITION .......................................................................................... 55
Introduction ............................................................................................. 55
Computations for Instantaneous Profile Experiments ............................ 56
Matric Suction Measurements ................................................................ 63
Ec-5 Volumetric Moisture Probes .......................................................... 65
Intact Instantaneous Profile Results ........................................................ 67
Cracked Instantaneous Profile Results .................................................. 109
5 CONSIDERATIONS AND METHODS FOR DETERMINING THE
UNSATURATED HYDRAULIC CONDUCTIVITY FOR
INTACT AND CRACKED CLAYS .................................................... 156
Introduction ........................................................................................... 156
Considerations of Methods for Determining the Unsaturated
Hydraulic Conductivity by the Instantaneous Profile
Test .......................................................................................... 157
Analysis of Results ............................................................................... 164
Unsaturated Hydraulic Conductivity Models ...................................... .171
Proposed Unsaturated Hydraulic Conductivity Model ......................... 173
Comparison and Analysis of Intact and Cracked Unsaturated
Hydraulic Conductivity Results ............................................... 178

vi
CHAPTER Page
6 CONCLUSIONS AND RECOMMENDATIONS ............................................ 184
Summary ............................................................................................... 184
Conclusions ........................................................................................... 192
Recommendations for Future Research ................................................ 195
REFERENCES ............................................................................................................... 197

vii
APPENDIX Page
A INTACT UNSATURATED HYDRAULIC CONDUCTIVITY
DATA ...................................................................................... 201
B CRACKED UNSATURATED HYDRAULIC CONDUCTIVITY
DATA ...................................................................................... 207

viii
LIST OF TABLES
Table Page
2.1 Apparatus Length to Width Ratios of Published Instantaneous
Profile Experiments ................................................................................ 31
3.1 ASTM Standards for Soil Tests Performed ......................................................... 36
3.2 San Diego Soil Atterberg Limits .......................................................................... 37
3.3 Expansion Index Results for San Diego Soil ....................................................... 40
3.4 Free Swell Results for San Diego Soil ................................................................. 41
3.5 Swell Pressure from Free Swell Method ............................................................. 42
3.6 Swell Pressures from Constant Volume Method ................................................. 42
3.7 Saturated Hydraulic Conductivity Values ........................................................... 43
3.8 SWCC van Genuchten Fitting Parameters ........................................................... 44
3.9 Summary of Instantaneous Profile Experiments .................................................. 47
4.1 Test Nos. 1 and 2 Initial Soil Conditions ............................................................. 69
4.2 Test No. 1 Sampling Times and Dates ................................................................. 73
4.3 Test No. 2 Sampling Times and Dates ................................................................. 80
4.4 Test No. 3 Initial Soil Conditions ........................................................................ 86
4.5 Test No. 3 Sample Run Time and Sampling Event Dates ................................... 90
4.6 Test No. 6 I Initial Soil Conditions ...................................................................... 95
4.7 Test No. 7 Initial Soil Conditions ...................................................................... 102
4.8 Test No. 7 Sample Run Times and Sampling Event Dates ................................ 105
4.9 Test No. 4 Initial Soil Conditions ...................................................................... 111
4.10 Test No. 4 Sample Run Times and Sampling Dates .......................................... 119
4.11 Test No. 5 Initial Soil Conditions ...................................................................... 131
4.12 Test No. 5 Sample Run Times and Sampling Dates .......................................... 135

ix
Table Page
4.13 Test No. 6 C Initial Soil Conditions ................................................................... 146
4.14 Test No. 6 C Crack Measurements and Crack Volume ..................................... 150
5.1 Common Laboratory Techniques for Measuring Soil Suction .......................... 163
5.2 Ksat Measurement at Different Compacted Water Contents ............................. 168
5.3 Fitting Parameters for Various Kunsat Functions Used ..................................... 172
5.4 Input Parameters to Proposed Kunsat Function ................................................. 178
5.5 Fitting parameters Used for Proposed Kunsat Function and
Comparison to Other Kunsat Models ................................................... 178

x
LIST OF FIGURES
Figure Page
2.1 λ Values for Various Soils ................................................................................... 10
2.2 Hydraulic Conductivity Function of a Goose Lake Clay ..................................... 18
2.3 Hydraulic Conductivity Function for Various Soil .............................................. 19
2.4 K Function Calculated by McCartney vs. Measured Data ................................... 21
2.5 Hydraulic Conductivity Function fit by Zhang and Fredlund .............................. 23
2.6 Trend of Hydraulic Conductivity Data for Wetting and Drying .......................... 24
2.7 Hydraulic Conductivity Functions for a Wenatchee and Live Oak Soil .............. 25
2.8 Hydraulic Conductivities at Various Compacted Water Contents ....................... 26
2.9 Hydraulic Conductivity at Various Compaction Conditions ............................... 27
2.10 Hydraulic Conductivities by Meerdink et al. for Wetting and Drying ................ 27
2.11 Average Error of Water Content Measurements Made by TDR Probes .............. 29
2.12 Hydraulic Conductivity records for Different Cycles of Drying
and Wetting ............................................................................................. 33
3.1 Gradation Plot for the San Diego Soil ................................................................. 38
3.2 Compaction Curve for the Sand Diego Soil ........................................................ 39
3.3 Stress Strain Curve for the San Diego Clay ......................................................... 40
3.4 Correlation between ASTM EI and AZ EI .......................................................... 41
3.5 SWCC for the San Diego Soil ............................................................................. 44
3.6 Method Flow Directions ...................................................................................... 51
3.7 Method B Crack Configuration ........................................................................... 52
3.8 Method C Configuration ...................................................................................... 54
4.1 Example of Position Location, P6 ....................................................................... 57
4.2 Volumetric Water Content Profile ....................................................................... 57

xi
Figure Page
4.3 Typical Instantaneous Profile Results for Clay ................................................... .58
4.4 Two Point Sampling Event ................................................................................. .59
4.5 Suction Profile ..................................................................................................... 60
4.6 Volumetric Water Content Profile and ........................................................ 61
4.7 Volume of Water Calculation Plot ....................................................................... 62
4.8 Volumetric Moisture Probe (Decagon) ................................................................ 65
4.9 Volumetric Probe Calibration .............................................................................. 66
4.10 Volumetric Probe Calibration Plot ....................................................................... 67
4.11 Test No. 1 Initial Soil Conditions and Sampling Locations ................................ 69
4.12 Test No. 1 Compacted Sample............................................................................. 71
4.13 Test No. 1 Sample Tube ...................................................................................... 72
4.14 Test No. 1 Matric Suction versus Time ............................................................... 74
4.15 Test No. 1 Soil Gravimetric Water Content versus Time .................................... 74
4.16 Test No. 1 Corrected Water Content versus Time ............................................... 75
4.17 Test No. 1 Corrected Suction versus Time .......................................................... 75
4.18 Test No. 1 Water Content Profile ........................................................................ 76
4.19 Test No. 1 Unsaturated Hydraulic Conductivity Plot over
Various Intervals ..................................................................................... 77
4.20 Test No. 1 Unsaturated Hydraulic Conductivity Plot .......................................... 78
4.21 Test No. 2 Initial Soil Conditions and Sampling Locations ................................ 79
4.22 Test No. 2 Matric Suction versus Time ............................................................... 81
4.23 Test No. 2 Soil Gravimetric Water Content versus Time .................................... 81
4.24 Test No. 2 Corrected Water Content versus Time ............................................... 82
4.25 Test No. 2 Corrected Matric Suction versus Time ............................................... 82

xii
Figure Page
4.26 Test No. 2 Water Content Profile ........................................................................ 83
4.27 Test No. 2 Unsaturated Hydraulic Conductivity Plot over
Various Intervals ..................................................................................... 84
4.28 Test No. 2 Unsaturated Hydraulic Conductivity Plot .......................................... 84
4.29 Test No. 3 Initial Soil Conditions ........................................................................ 85
4.30 Sample Set-up and Compaction of Dry Section .................................................. 87
4.31 Test No. 3 Filter Paper Sandwich Locations........................................................ 87
4.32 Test No. 3 Finished Compacted Samples ............................................................ 88
4.33 Test No. 3 Extruding Process............................................................................... 89
4.34 Obtaining Filter Paper Sandwich from Soil Sample ............................................ 89
4.35 Test No. 3 Extruded Sample on Day 305 of Run Time ....................................... 90
4.36 Test No. 3 Matric Suction vs. Time ..................................................................... 91
4.37 Test No. 3 Water Content over Time ................................................................... 91
4.38 Test No. 3 Soil Water Content Profile ................................................................. 92
4.39 Test No. 3 Soil Suction Profile ............................................................................ 93
4.40 Test No. 3 Kunsat Plot ......................................................................................... 94
4.41 Locations of Kunsat Computation Intervals ........................................................ 94
4.42 Orientation of Vol. Moisture Probe for Test No. 6 .............................................. 96
4.43 Location of Vol. Moisture Probes for Test No. 6 ................................................ 96
4.44 Test No. 6 I Compacted Sample with Vol. Probes Installed ................................ 97
4.45 Test No. 6 I Completed Sample in Environmental Chamber .............................. 98
4.46 Test No .6 I Water Content Profile ...................................................................... 99
4.47 Test No. 6 I Soil Suction Profile ........................................................................ 100
4.48 Test No. 6 I Infiltration Data.............................................................................. 100

xiii
Figure Page
4.49 Test No. 6 I Coefficients of Unsaturated Hydraulic Conductivity..................... 101
4.50 Test No. 7 Initial Soil Conditions and Apparatus .............................................. 102
4.51 Test No. 7 Sample Creation and Placement of Filter Paper Sandwich .............. 103
4.52 Test No. 7 Filter Paper Sandwich Locations...................................................... 104
4.53 Test No. 7 Finished Compacted Sample ............................................................ 104
4.54 Test No. 7 Extruded Sample on Day 200 of Run Time ..................................... 105
4.55 Test No. 7 Matric Suction over Time ................................................................ 106
4.56 Test No. 7 Water Content over Time ................................................................. 106
4.57 Test No. 7 Soil Water Content Profile ............................................................... 107
4.58 Test No. 7 Soil Suction Profile .......................................................................... 108
4.59 Test No. 7 Kunsat Plot ....................................................................................... 109
4.60 Test No 4 Initial Soil Conditions and Test Apparatus ....................................... 110
4.61 Test No. 4 Sample Creation ............................................................................... 112
4.62 Test No. 4 Sample Compaction ......................................................................... 112
4.63 Test No. 4 Filter Paper Sandwich Placement and Soil Scarification ................. 112
4.64 Test No. 4 Filter Paper Sandwich Locations...................................................... 113
4.65 Dimension of Crack Cut ..........................................................................................
4.66 Test No. 4 Cracks Locations for Sets 1 and 2 .................................................... 115
4.67 Test No. 4 Completed Samples .......................................................................... 115
4.68 Test No. 4 Set 1 Cut Sample .............................................................................. 116
4.69 Test No. 4 Set 2 Cut Sample .............................................................................. 117
4.70 Test No. 4 Sample Damage ............................................................................... 117
4.71 Test No. 4 Sealed Samples................................................................................. 118
4.72 Test No. 4 Extruded sample ............................................................................... 118

xiv
Figure Page
4.73 Test No. 4 Extruded Samples on Day 300 ......................................................... 119
4.74 Test No. 4, Set 1, Matric Suction over Time ..................................................... 120
4.75 Test No. 4, Set 2, Matric Suction over Time ..................................................... 120
4.76 Test No. 4 Matric Suction over Time Sample Set Comparison ......................... 121
4.77 Test No. 4, Set 1, Water Content over Time ...................................................... 121
4.78 Test No. 4, Set 2, Water Content over Time ...................................................... 122
4.79 Test No. 4 Water Content over Time Sample Set Comparison ......................... 122
4.80 Test No. 4 Corrected Water Contents over Time for Both Sample Sets ............ 123
4.81 Test No. 4 Corrected Suction over Time for Both Sample Sets ........................ 124
4.82 Test No. 4, Set 1, Water Content Profile ........................................................... 124
4.83 Test No. 4 Set 2, Water Content Profile ............................................................ 125
4.84 Test No. 4 Water Content Profile Set Comparison ............................................ 125
4.85 Test No. 4, Set 1, Matric Suction Profile ........................................................... 126
4.86 Test No. 4, Set 2, Matric Suction Profile ........................................................... 126
4.87 Test No. 4 Matric Suction Profile Set Comparison ........................................... 127
4.88 Test No. 4, Set 1, Kunsat Plot ............................................................................ 128
4.89 Test No. 4, Set 2, Kunsat Plot ............................................................................ 128
4.90 Test No. 4. Kunsat Plot of Both Sample Sets .................................................... 129
4.91 Test No. 5 Initial Soil Conditions and Test Apparatus ...................................... 130
4.92 Test No. 5 Soil Sections Compacted in Sample Tubes ...................................... 131
4.93 Test No. 5 Filter Paper Sandwich Locations...................................................... 132
4.94 Test No. 5 Sample Creation Extruding Process ................................................. 133
4.95 Test No. 5 Sample after Sample Extrusion ........................................................ 133
4.96 Test No. 5 Set 3 Air Gap .................................................................................... 134

xv
Figure Page
4.97 Test No. 5 Set 4 Air Gap .................................................................................... 134
4.98 Test No. 5 Specimen Conditions at Day 250 of Run Time ................................ 135
4.99 Test No. 5 Extruded Sample on Day 250 of Run Time ..................................... 135
4.100 Test No. 5, Set 3, Matric Suction over Time ..................................................... 136
4.101 Test No. 5, Set 4, Matric Suction over Time ..................................................... 137
4.102 Test No. 5 Matric Suction over Time Sample Set Comparison ......................... 137
4.103 Test No. 5, Set 3, Water Content over Time ...................................................... 138
4.104 Test No. 5, Set 4, Water Content over Time ...................................................... 138
4.105 Test No. 5 Water Content over Time Sample Set Comparison ......................... 139
4.106 Test No. 5, Set 3, Water Content Profile ........................................................... 140
4.107 Test No. 5, Set 4, Water Content Profile ........................................................... 140
4.108 Test No. 5 Water Content Profile Set Comparison ............................................ 141
4.109 Test No. 5, Set 3, Matric Suction Profile ........................................................... 141
4.110 Test No. 5, Set 4, Matric Suction Profile ........................................................... 142
4.111 Test No. 5 Matric Suction Profile Set Comparison ........................................... 142
4.112 Test No. 5, Set 3, Kunsat Plot ............................................................................ 143
4.113 Test No. 5, Set 4, Kunsat Plot ............................................................................ 144
4.114 Test No. 5, Kunsat Plot of Both Sample Sets .................................................... 145
4.115 Test No. 6 C Crack Pattern ................................................................................ 147
4.116 Creating Crack Formation for Test No. 6 C (1) ................................................. 148
4.117 Creating Crack Formation for Test No. 6 C (2) ................................................. 148
4.118 Creating Crack Formation for Test No. 6 C (3) ................................................. 148
4.119 Creating Crack Formation for Test No. 6 C (4) ................................................. 149
4.120 Completed Sample for Test No. 6 C .................................................................. 150

xvi
Figure Page
4.121 Test No. 6 C Crack Number Locations .............................................................. 151
4.122 Test No. 6 C Sample Stored in Environmental Chamber .................................. 152
4.123 Test No. 6 C Water Content Profile ................................................................... 153
4.124 Test No. 6 C Soil Suction Profile ....................................................................... 153
4.125 Test No. 6 C Infiltration Data ............................................................................ 154
4.126 Test No. 6 C Coefficients of Unsaturated Hydraulic Conductivity ................... 155
5.1 Test No. 1 and Test No. 2 Soil Fabric Sample Disturbance .............................. 158
5.2 Kunsat Plot from Various Intact Experiments ................................................... 165
5.3 Kunsat Plot for All Intact Instantaneous Profile Experiments ........................... 166
5.4 Kunsat Plot from Various Cracked Experiments ............................................... 167
5.5 Example of Permeability Function for an Anisotropic Soil ............................... 168
5.6 Comparison of Kunsat Values for Test No. 4 .................................................... 169
5.7 Comparison of Kunsat Values for Test No.5 ..................................................... 170
5.8 Kunsat Curves Fit to Intact Unsaturated Conductivity Data .............................. 171
5.9 Desaturation Zones Defined by a SWCC .......................................................... 173
5.10 Variation of Liquid Water, Vapor, and Overall Permeability Coefficient
with Soil Suction ................................................................................... 174
5.11 Example of Hyperbolic Profile and Parameters ................................................. 175
5.12 Proposed Kunsat Function Fit the Data ............................................................. 177
5.13 Kunsat Comparison of Test No. 4 to Intact Data ............................................... 179
5.14 Kunsat Comparison of Test No. 4 to Intact Data ............................................... 180
5.15 Air Gap Conductivities Compared to Intact Data .............................................. 181
5.16 Kunsat Comparison of Cracked and Intact Data from Test No. 6 ..................... 182
5.17 Permeability of Cracked and Intact Soil ............................................................ 183

xvii
Figure Page
5.18 Kunsat Plot Comparison of All Cracked and Intact Data Points ....................... 183

1
CHAPTER 1: INTRODUCTION
Background In recent years, the number of professionals and researchers working in the field
of unsaturated soils has vastly increased. With the increasing interest in unsaturated soil
mechanics, focus on the unsaturated hydraulic conductivity, Kunsat, has become of
interest to geotechnical engineers. The unsaturated hydraulic conductivity is a difficult
and time consuming function to determine for a fine grained soil. Methods have been
proposed by other researchers to determine the unsaturated hydraulic conductivity for an
intact soil, but little information is available for this parameter for cracked soils. There
may be significant differences between the hydraulic conductivities for intact and cracked
soils. To observe these differences methods for determining the hydraulic conductivities
for cracks soils will be presented in this study.
The hydraulic conductivity is the parameter used to assess the infiltration rate of
water through soil. The hydraulic conductivity is a measure of the rate at which moisture
passes through a soil as first postulated by Darcy’s law. The unsaturated hydraulic
conductivity is a function of the soil negative pore water pressure or suction, and changes
with water content. The maximum value of hydraulic conductivity, Ksat, for a given soil
occurs when the soil is completely saturated, and this maximum value is usually used in
design as a conservative measure. When a soil is completely saturated, the pore pressures
are positive and the hydraulic conductivity is constant, assuming steady flow, constant
temperature, and no changes in the water or soil chemistry (McCartney, Villar and
Zornberg, 2007). When soils are unsaturated, the hydraulic conductivity is less than the
saturated hydraulic conductivity and can vary by multiple orders of magnitude. The
unsaturated hydraulic conductivity of a soil is defined by its relationship between the
saturated hydraulic conductivity and the soil suction or volumetric water content (Li,

2
Zhang and Fredlund, 2009). Since the unsaturated hydraulic conductivity of soils can be
a function of saturation, water content, matric suction or other parameters, measuring this
parameter is done through intricate experiments such as the instantaneous profile method.
Numerous environmental and physical factors affect the measurement of the unsaturated
hydraulic conductivity. These measurements involve careful consideration of the
procedures and techniques used in laboratory experiments. The unsaturated hydraulic
conductivity is also one of the most difficult parameters to measure when dealing with
fine-grained soils because of the time involved in performing the experiment and the
limited suction measurement range provided by various measurement methods
(McCartney, Villar and Zornberg, 2007).
Fine-grained soil exhibit different properties when compared to other coarser
grained soil types. Fine-grained soils such as clays have unique properties including
extremely small particle sizes resulting from different chemical weathering processes
from which clay minerals were formed (Mitchell and Soga, 2005). Clays are made up of
plate like shapes, which provide these soils with a greater surface area- to- mass ratio
than compared to other soils. Clayey fine-grained soils, due to their physical and
chemical constituents, have the potential for somewhat unique problems such as swelling,
cracking, sliding, and consolidation.
Fine-grained soil typically has low saturated hydraulic conductivities ranging
from 10-12 to 10-8 m/s (Coduto, 1999). The hydraulic conductivity is a significant
parameter for fine-grained soil since their ability to retard movement of liquids makes
them ideally suited for use as hydraulic barriers either for landfill sites, contaminant
remediation, and impermeable fluid barriers. Because of the low hydraulic conductivity
of fine-grained soil their infiltration rate is very slow. This low infiltration rate has
implications on the measurement of the unsaturated hydraulic conductivity.

3
Measurement of this unsaturated parameter can be done by the instantaneous profile
method, but requires special considerations for precise and accurate measurement.
Fine-grained materials, such as clays, have high plasticity and variability in shear
strength due to wetting that makes them susceptible to cracking. When clay soils are
exposed on the ground surface, they can encounter cycles of wet and dry periods due to
rainfall patterns, irrigation in a given area and evaporation. The cracks and fissures that
form due to the cyclical periods of wet and dry conditions, allow for water to slowly
absorb into the clay, causing shrink-swell behavior deepening in the cracked clay zone
(Rayhani, Yanful and Fakher, 2007). This type of crack formation is called desiccation
cracking, which is a common phenomenon in clay materials and can change the hydraulic
conductivity of the soil (Rayhani, Yanful and Fakher, 2007). The phenomenon of self-
healing, which occurs in some types of clays, can also affect the hydraulic properties of
the soil and is a result of this shrink-swell behavior. Current studies have shown that the
presence of cracks or fissures in soils decrease the amount of surface runoff by increasing
the total infiltration rate (Noval, Simunek, and van Genuchten, 2000). The cracks result
in an increase the infiltration rate by allowing more water to seep into deeper portions of
the soil profile, thus increasing the efficiency for which water can infiltrate the soil. The
formations of cracks typically occurs when the soil is unsaturated, therefore
understanding and determining the unsaturated hydraulic properties is crucial when
dealing with these materials for geotechnical applications.
In geotechnical engineering, cracked fine-grained soils present implications to
various design parameters for construction of infrastructure and foundations. In some
situations, desiccation cracking may not be of concern, but when cracks and fissures are
anticipated, understanding the effects of the cracks on the engineering properties of the
soil becomes of great importance. The anisotropy effects of the crack orientation to the

4
direction of flow may also present considerations to the effects of cracks on the hydraulic
conductivity. Cracked fine-grained soils present special considerations when performing
seepage analyses for saturated and unsaturated soil systems. In the analysis of these
systems, the unsaturated hydraulic conductivity is of great significance since is can be
used to model water flow, infiltration, volume change and the triggering of landslides (Li,
Zhang and Fredlund, 2009). There has been little research conducted on the implication
of cracks and fissure to the saturated and unsaturated hydraulic conductivity. This
provides the opportunity to assess the effects of cracks on the hydraulic conductivity and
to evaluate laboratory methods used to measure conductivity functions for cracked fine-
grained soils.
There are geotechnical applications that would benefit from the analysis of
cracked fine-grained soil and their hydraulic conductivity. Cracked and fissured soils are
present in landfill caps, sloped structures, and foundations embankments. Fine-grained
soils are sometimes used as fill materials and could experience cracking around and near
foundations for structures such as bridges and buildings. Cracks present in all of the
applications above could be affected by the infiltration rate of water into the subsurface.
In the design of these types of structures, time and money could be saved by an accurate
analysis of the cracked materials that may be encountered. For landfill applications,
landfill caps are designed as barriers systems which typically incorporate compacted clay
layers on the surface to prevent seepage of fluids in and out of the landfill waste mass.
The compacted clay caps are exposed to the environment and could encounter desiccation
cracking, in turn affecting the hydraulic conductivity of the clay layer. The design done
for landfill caps requires a seepage analysis and the unsaturated hydraulic conductivity is
the primary soil parameter required (Li, Zhang and Fredlund, 2009). The hydraulic
conductivity of this clay soil may change due to the presence of cracks and fissures that

5
may form over time. Thus, understanding the effects of infiltration through cracked soil
systems and accurately measuring the hydraulic conductivity can aid in achieving an
effective design.
It is important to model the hydraulic properties of cracked soils to investigate
the effect on the infiltration rate. Cracks can be present throughout the entire saturation
range of a given soil. The saturated hydraulic conductivity can be measured through a
relatively simple experiment and may be quantified by comparing the hydraulic
conductivity of the crack to intact conditions. The unsaturated hydraulic conductivity is a
function of the matric soil suction, which gives rise to the challenge in determining the
unsaturated hydraulic conductivity function for an unsaturated soil. This is typically
done for an intact soil by the instantaneous profile method, which is an unsteady-state
method used in the laboratory to measure the unsaturated hydraulic conductivity. There
are several variations of this method which primarily differ in the measurement of the
water content, soil suction, hydraulic gradient, flow rate and the way water is introduced
to the system. For the cracked condition, measuring the unsaturated hydraulic
conductivity can be done in a same manner but by incorporating a cracked formation into
the soil profile and the effects of the cracks can be analyzed by comparing the results of
the cracked and intact conditions. When measuring the unsaturated hydraulic
conductivity for intact and cracked fine-grained soils, one should also consider
calculating the unsaturated hydraulic conductivity and the measurement of various
experimental soil parameters.

6
Objectives The objectives of this study anticipate a difference in hydraulic properties for soil
with cracks as compared with soil that do not have cracks. The condition that cracks
create presents the anticipation of extremely different conditions for which infiltration
occurs. The introduction of cracks should increase matric suction around the wall of the
crack, allowing for soils to become less pervious and decrease the overall permeability of
the entire soil mass (Rahman, Fredlund, Fredlund, Pham and Nguyen, 2004). The
objectives of this study are to i) analyze the effects of air voids or cracks on the
unsaturated hydraulic conductivity; ii) research and summarize the methods used for
measuring the unsaturated hydraulic conductivity for cracked soils, and iii) propose
special considerations for measuring the unsaturated hydraulic conductivity by the
instantaneous profile method, including recommendations that deal with the prediction of
the unsaturated hydraulic conductivity.
Scope and Limitations The scope of this study is limited to comparison of values for unsaturated
hydraulic conductivities for fine-grained soils in the cracked condition and in the intact
and un-cracked condition. A review of literature is included to supplement the study with
current knowledge of the unsaturated hydraulic conductivity of soils. Experiments done
by other researchers on the unsaturated hydraulic conductivity for fine grained soil and
infiltration tests on cracked soils will be analyzed to aid in the development of a useful
laboratory testing program. Through the experiments conducted, various factors that may
impact the testing and measurement of the unsaturated hydraulic conductivity for intact
and cracked soil will be identified. To analyze the impact of air voids and cracks on the
hydraulic conductivity, laboratory experiments using the instantaneous profile method

7
will be performed, which will be modified to incorporate cracks in the soil profile. These
methods will be used to analyze the unsaturated hydraulic conductivity. Also, the
anisotropy effects of the crack orientation within the soil profile will be evaluated. Using
the results from laboratory testing as part of this study and research results from current
literature, the effects of the cracks to the hydraulic properties of fine-grained soils will be
examined. Conclusions and observations will be discussed to answer the objectives of
this study.
Organization The organization of this report is as follows: Chapter 1 includes an introduction
and identifies the importance of the work and the scope and limitations. Chapter 2
presents the literature review. Chapter 3 includes information and data on soil properties
and experimental design. Chapter 4 includes description of the laboratory testing of the
unsaturated hydraulic conductivity for the cracked and intact conditions. Chapter 5
includes a discussion of the results and other test methods that can be used for
determining the permeability for intact and cracked clays. Chapter 6 includes
conclusions and identifies the need for future research.

8
CHAPTER 2: LITERATURE REVIEW
Introduction In geotechnical engineering, unsaturated soil mechanics is commonly been a
specialized topic. The subject of unsaturated hydraulic conductivity for soil has only
been studied on a limited basis by researchers. In order to determine suitable methods of
determining the unsaturated hydraulic conductivity functions for fine grained soils, a
review of studies and experiments done by previous researchers is presented. This
review of literature includes functions used to model unsaturated hydraulic conductivity,
measuring the unsaturated hydraulic conductivity, and the effects of cracks to the
unsaturated hydraulic conductivity.
Models of Unsaturated Hydraulic Conductivity Currently there are numerous models that describe and predict the unsaturated
hydraulic conductivity for fine grained soils. Models of the unsaturated hydraulic
conductivity functions generally involve two of the following properties; soil saturation,
void ratio, or water content. In an unsaturated soil, the hydraulic conductivity is
significantly affected by combined changes in the void ratio and the degree of saturation
or water content (Fredlund and Rahardjo, 1993). However, the effect of changes in void
ratio is usually small and secondary to the soil saturation or water content. As a result,
the unsaturated hydraulic conductivity is often described as a singular function related to
the degree of saturation or volumetric water content (Fredlund and Rahardjo, 1993). A
change in matric suction can produce a more significant change in the soil saturation or
water content than can be produced by a change in net normal stress (Fredlund and
Rahardjo, 1993). Because of this, the hydraulic conductivity of a given soil is commonly
described as a function of matric suction.

9
In literature there are various functions that can be used to predict the unsaturated
conductivity. Most accurate models may depend on soil type. The hydraulic
conductivity functions that will be presented are those that are best suited for fine grained
soil. The various equations for determining the conductivity function of unsaturated soils
are presented below. These equations are empirical, having been formed from statistical
analysis, and are used to model the conductivity functions of soils. When the number of
measurements exceeds the number of fitting parameters, a curve fitting procedure can be
used to determine the fitting parameters (Fredlund, Xing and Huang 1994). This fitting
procedure involves using a spreadsheet such as Excel and the Solver application. The
equations presented by Broods and Corey (1964), Gardner (1958), van Genuchten et al.
(1980), Arbhabhirama and Kridakorn (1968), and the Leong and Rahardjo (1997) are
equations that use semi empirical fits to model the unsaturated hydraulic conductivity
function. All of these functions include empirical constants that may relate to specific
soil properties such as the air entry value and the slope at the deflection point. The
Gardner (1958) and van Genuchten (1980) equations are the most common equation used
to model the unsaturated conductivity function. Some of these equations are:

B
G
Brooks and Co
Gardner (1958
orey (1964) -
for
: :
Fi
8) - (Fredlund
(Fredlund an
: Unsaturated Saturated hy
: Ai: Soi
Empirical co2
: Pore
gure 2.1: λ V
and Rahardjo
: Un: Satu
: Func: Slop
: De: Grav
10
d Rahardjo, 1
for
d hydraulic coydraulic condir entry value l matric sucti
onstant. 3
e size distribut
Values for Var
o, 1993)
nsaturated hydurated hydrau
: Soil matction breakingpe function consity of watervity force.
1993)
onductivity.ductivity. of the soil. on.
tion index (R
rious Soils.
draulic conduulic conductivtric suction. g point constaonstant. r.
(Eqn.
(Eqn.
Refer to Figure
(Eqn.
uctivity. vity.
ant.
2.1)
2.2)
e 2.1).
2.3)

11
Van Genuchten and Mualem (1980) – (Dye, 2008)
(Eqn. 2.4)
: Unsaturated hydraulic conductivity. : Saturated hydraulic conductivity. : Soil matric suction. : Constant. : Constant. : Diffusion Coefficient constant.
Van Genuchten et al. (1980) - (Mitchell and Soga, 2005)
1 1 (Eqn. 2.5)
: Unsaturated hydraulic conductivity. : Volumetric water content of soil. : Residual volumetric water content. : Volumetric water content at S=1. : Constant that describes the degree of connectivity between the water conducting pores. Mualem (1964) recommends 0.5. : Constant.
1 (Assumed)
: Porosity. Arbhabhirama and Kridakorn (1968) - (Fredlund and Rahardjo, 1993)
(Eqn. 2.6)
: Unsaturated hydraulic conductivity. : Saturated hydraulic conductivity. : Air entry value of the soil. : Soil matric suction. ′: Empirical constant.

12
Leong and Rahardjo (1997) - (Dye, 2008)
(Eqn. 2.7)
: Unsaturated hydraulic conductivity. : Saturated hydraulic conductivity. : Air entry value of the soil. : Soil matric suction. : Empirical constant. : Empirical constant. : Empirical constant. The two models presented by S. Huang, S.L. Barbour, and D.G. Fredlund (1997)
and Kunze et al. (1968) are the most sophisticated efforts to predict the unsaturated
hydraulic conductivity function. The S. Huang, S.L. Barbour, and D.G. Fredlund (1997)
equation uses empirical constants and includes input for a given void ratio or stress state.
This model also includes the air entry values which make this correlation more closely
related to the soil being modeled.
The Kunze et al. (1968) equation is based on the soil water characteristic curve of
the soil. This model has been proposed to be fairly accurate in predicting unsaturated
conductivity values over a wide suction range (Fredlund, Xing and Huang, 1994). Both
of these two models presented are stochastic models.

13
S. Huang, S.L. Barbour, and D.G. Fredlund (1997) - (Huang, Barbour and Fredlund,
1998)
10 for (Eqn. 2.8)
10 for
(Eqn. 2.9) : Unsaturated hydraulic conductivity. : Saturated hydraulic conductivity at . : Void ratio of soil. : Initial void ratio. : Matric suction of soil. : Suction corresponding to the air entry value. : Air entry value at a void ratio at . : Empirical constant. : Empirical constant. : Pore size distribution index. 2 2 : Porosity. The Kunze et al equation is a statistical model that can be used to determine the
unsaturated hydraulic conductivity function for an unsaturated soil using the soil water
characteristic curve. This method is based on the fact that both the hydraulic
conductivity function and the soil water characteristic curve are primarily determined by
the pore size distribution of the soil (Fredlund, Xing and Huang, 1994). Childs and
Collis-George were the first to propose this model for predicting the permeability based
on the random variation of pore size (Childs and Collis-George, 1950). Marshall
improved the model and it was then further modified by Kunze et al (Marshall, 1958, and
Kunze, Vehara and Graham, 1968). This analysis is performed by dividing the soil water
characteristic curve into equal intervals of volumetric water content. The calculation is
then performed on the suction values corresponding to the midpoints of these intervals.

14
Kunze et al. (1968) - (Marshall, 1958)(Kunze, Vehara and Graham, 1968)
∑ 2 1 2 ∑ 2 1 2
1,2, … . , (Eqn. 2.10)
(Eqn. 2.11)
∑ 2 1 (Eqn. 2.12) : Predicted hydraulic conductivity for a given volumetric water content (m/s). : Interval number which increases as the volumetric water content decreases. : Total number of intervals between the saturated vol. water content and the lowest volumetric water content. : Measured saturated hydraulic conductivity (m/s). : Saturated hydraulic conductivity or scaling factor (m/s). : Adjusting constant. : Surface tension of water (kN/m). : Water density (kg/m3). : Gravitational acceleration (m/s2). : Absolute viscosity of water (N s/m2). : Volumetric water content at S=1.0. : Pore size factor = 2 (Green and Corey) N: Total number of intervals computed between the saturated volumetric water content and the lowest water content. : Matric suction corresponding to the jth interval (kPa)

15
Measurement of the Unsaturated Hydraulic Conductivity In geotechnical engineering there are numerous methods to measure the
hydraulic conductivity of a soil, including direct or indirect techniques (Fredlund and
Rahardjo, 1993). Direct measurements are referred to as permeability tests which are
commonly done in the laboratory using a permeameter. Indirect methods include using
the soil-water characteristic curve and volume-mass properties to predict the
permeability. This study will focus on both direct and indirect methods of measurement
of the hydraulic conductivity.
Most laboratory test methods used to determine the coefficient of permeability
assume the validity of Darcy's Law which is stated below. Darcy’s Law states that the
hydraulic conductivity is the ratio of the flow rate to the hydraulic head gradient
(Fredlund and Rahardjo, 1993).
(Eqn. 2.13) : Flow rate [V/T] : Coefficient of hydraulic conductivity [L/T] : Hydraulic gradient : Cross-sectional area of flow [L2] Thus the variables measured during permeability tests are the flow rate and the
hydraulic head gradient. These two variables can either be held constant with time or
varied with time during the test. The independence of these variables categorizes testing
procedures into groups, steady state methods where the quantity of flow is time
independent and unsteady state methods where the quantity of flow is time dependent.
Steady state methods are commonly not used due to their limited narrow measurement
range and sometimes long equilibrium times (Fredlund and Rahardjo, 1993).
The most practical and promising method for determining the unsaturated
coefficient of permeability is the instantaneous profile method. The instantaneous profile
method is an unsteady state method that can use direct or indirect measurements. The

16
method uses a cylindrical specimen of soil that is subjected to a continuous flow of water.
The flow can be a wetting or drying process depending on the way water is introduced to
the specimen. There are several variations in measurement procedures for determining
the hydraulic gradient and water flow from the test. The first procedure involves
measuring the water content and pore water pressures independently. The second
procedure involves measuring only the water content and determines the pore water
pressures from the soil-water characteristic curve. The third procedure involves only
recording the pore water pressures and then determining the water content from the soil-
water characteristic curve.
The instantaneous profile method was first described by Richards and Weeks,
and has been incorporated by others over time to determine the unsaturated hydraulic
conductivity (Richards and Weeks, 1953). In 1981, Hamilton et al. further describes this
procedure and provided suggestions for experiment set up and the calculations of the
unsaturated hydraulic conductivity from the test. Since then, numerous researchers have
performed permeability tests to determine the unsaturated hydraulic conductivity. The
work done in previous research will supplement this study through the conclusions and
considerations made in their research. The focus of this literature review will be on
studies done that relate to the instantaneous profile experiment and the measurement of
the unsaturated hydraulic conductivity for fine grained soils.
In 1953, Richards and Weeks developed one of the first methods for determining
the unsaturated hydraulic conductivity in the article titled "Capillary Conductivity Values
from Moisture Yield and Tension Measurements on Soil Columns" (1953). Their
experiment involved compacting soil into tubes 5.7cm in diameter and 35 cm long. The
two soil types that were tested were Ramona loam and Yolo loam. The soil samples
experienced wetting and then drying in order to gain changes in the moisture content in

17
the soil profile over time. The suction was measured by tensiometer cups and glass
manometers using mercury along the length of the sample apparatus. The research also
included information regarding the calculation of the capillary conductivity and
unsaturated permeability. The work done by Richards and Weeks was one of the first
instantaneous profile methods, and has been used and referenced by other researchers.
However, with the development of new measurement technologies numerous
advancements in this method have occurred.
A study done by Hamilton, Daniel, and Olson in 1981 focused on the problem of
measuring the hydraulic conductivity of partially saturated soils in the laboratory
(Hamilton, Daniel, and Olson, 2006). The authors discussed the general problems
involved, defined relevant terms, discussed the methods used, and provided experimental
data for one soil. The instantaneous profile method was used to perform the experiment,
and authors described conditions, apparatus and procedures used for the experiment. In
the instantaneous profile experiment, cylindrical samples were confined in an impervious
tube that is set in a horizontal position. Suctions were measured at locations along the
length of the tube using tensiometers or psychrometers. The pore air pressure was
maintained at a suitable value which is typically atmospheric pressure. Water flow is
introduced from one end of the sample tube. The opposite end of the tube is left
impervious and open to the atmosphere. Suction measurements are taken as a function of
time and measurements are taken until water has advanced through the sample to the
opposite end. Water contents were determined from suction measurements using a soil
water characteristic curve. The authors note that the accuracy of this method depends on
the accuracy of the soil water characteristic curve and the measurements of suction from
the test.

co
P
se
of
lo
in
co
hy
un
be
va
cl
an
From t
ompacted into
sychrometers
everal disks o
f 0.7cm3/day
ow plasticity.
nto the sample
omplete test f
ydraulic cond
Figu
The m
nsaturated hy
e measured.
ariety of soil
lays with deg
nd predicted v
the conductiv
o plastic tube
s were installe
of filter paper
was typically
The soil was
e tubes with 8
for the Goose
ductivity for th
ure 2.2: Hydr
method present
ydraulic condu
The method i
types. The au
rees of satura
values was fo
vity tests perfo
s with a 50mm
ed along the l
to uniformly
y used. The s
s prepared at
88% relative c
Lake clay to
he Goose Lak
raulic Conduc
ted in the stud
uctivity and s
is proven to b
uthors conclu
ated between
ound to be goo
18
ormed by Ham
m diameter an
ength of the t
distribute the
oil tested was
5% gravimetr
compaction e
ok about 20 d
ke clay are sh
ctivity Functi
dy showed th
uction for the
be convenient
ude that this m
30 and 90 per
od. This goo
milton et al.,
nd 144mm in
tubes. A need
e flow across
s a Goose Lak
ric water cont
effort from the
days. The cal
hown below in
ion of a Goos
hat the relation
e wetting of a
t and could be
method will w
rcent. Compa
d agreement h
soil samples
n length.
dle was used
the soil. A f
ke clay which
tent and comp
e standard pro
lculated coeff
n Figure 2.2.
se Lake Clay.
nship between
an unsaturated
e performed o
work reasonab
arison of the
has influence
were
with
flow rate
h had a
pacted
octor. A
ficients of
n
d soil can
on a
bly for
measured
ed the use
of
co
an
th
le
un
w
m
1
di
us
su
w
f this method
onductivity.
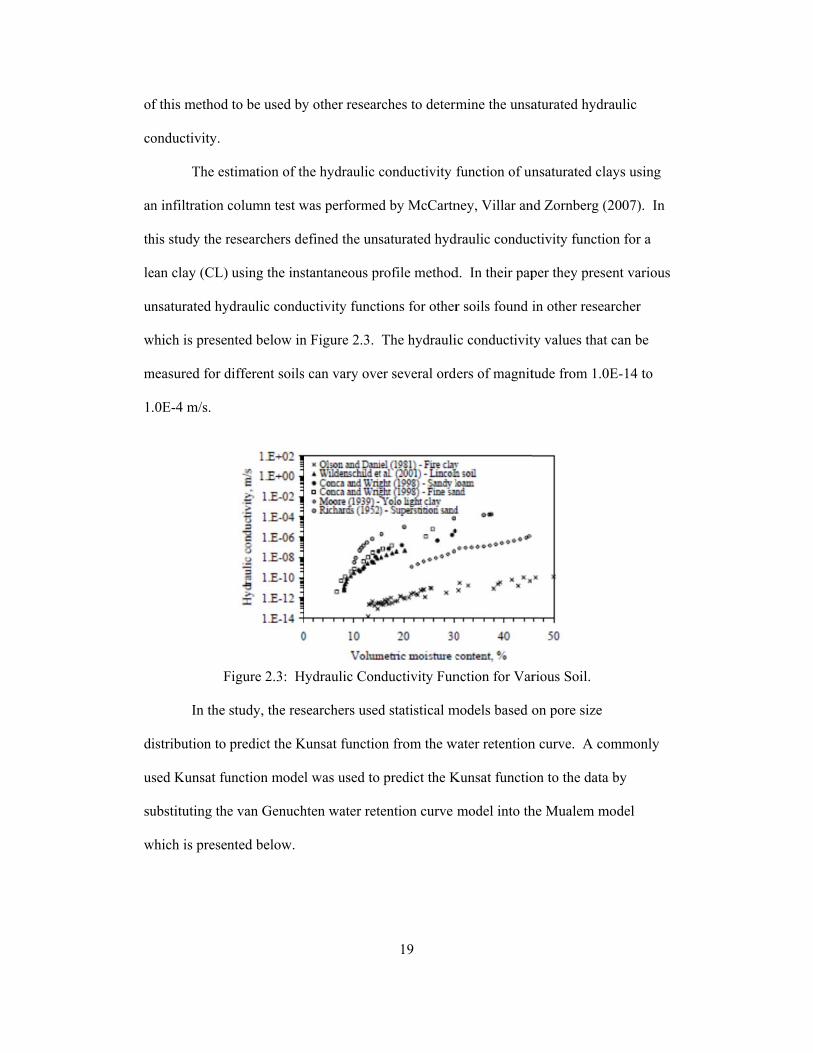
The es
n infiltration c
his study the r
ean clay (CL)
nsaturated hy
which is presen
measured for d
.0E-4 m/s.
F
In the
istribution to
sed Kunsat fu
ubstituting the
which is presen
to be used by
stimation of th
column test w
researchers de
using the ins
ydraulic condu
nted below in
different soils
Figure 2.3: H
study, the res
predict the K
unction mode
e van Genuch
nted below.
y other resear
he hydraulic c
was performed
efined the uns
stantaneous pr
uctivity funct
n Figure 2.3.
can vary ove
Hydraulic Con
searchers used
Kunsat functio
l was used to
hten water ret
19
rches to determ
conductivity f
d by McCartn
saturated hyd
rofile method
tions for other
The hydrauli
er several ord
nductivity Fun
d statistical m
on from the w
predict the K
ention curve
mine the unsa
function of un
ney, Villar an
draulic conduc
d. In their pap
r soils found i
ic conductivit
ders of magnit
nction for Var
models based o
water retention
Kunsat functio
model into th
aturated hydr
nsaturated cla
nd Zornberg (2
ctivity functio
per they prese
in other resea
ty values that
tude from 1.0
rious Soil.
on pore size
n curve. A co
on to the data
he Mualem m
raulic
ays using
2007). In
on for a
ent various
archer
can be
0E-14 to
ommonly
a by
model

un
ex
an
ga
w
0
sp
PV
cl
fl
m
w
va
F
In the
nsaturated hy
xperiment con
n infiltration o
ain moisture c
were interpolat
.75m long an
pecific gravity
VC tube at a
lay was found
low rate was a
m/s until stead
In the
with the steady
alues only fits
igure 2.4.
paper, the aut
ydraulic condu
nducted. The
or wetting pro
content measu
ted from the w
d 203mm dia
y of 2.71 and
70% relative
d to be 6.6E-6
applied to the
dy state seepag
experiment, t
y state data be
s the infiltrati
thor outlines
uctivity funct
e instantaneou
ocess. Time
urements dur
water retentio
ameter PVC tu
PI approxim
compaction.
6 m/s using a
e top surface o
ge was observ
the instantane
ecause the wa
ion data at hig
20
the calculatio
tion from the
us profile exp
domain reflec
ring the test. T
on curve. The
ube. The soil
ately equal to
The saturate
flexible wall
of the soil wit
ved.
eous profile m
ater retention
gh suctions. T
ons for the de
results of the
periment perfo
ctometry (TD
The gradient
e experiment
l tested was a
o 12. The soi
ed hydraulic c
permeameter
th an inflow r
method data d
curve used to
This plot is p
(Eqn.
etermination o
instantaneou
ormed in the s
DR) probes we
and suctions
was set up us
a lean clay (CL
l was compac
conductivity f
r. A constant
rate of 8E-8 a
did not align p
o calculate the
resented belo
2.14)
of the
us profile
study was
ere used to
values
sing a
L) with a
cted in the
for the
t water
and 1.5E-7
perfectly
e suction
ow in

ca
T
cu
ca
T
no
pr
pa
so
m
th
hy
co
re
co
an
Figu
Some
alculation of t
The calculation
urve to calcul
alculation of t
The boundarie
oted that the o
rofile for the
articularly sen
ome error in t
Resear
measurement o
heir paper title
ydraulic cond
olumn test to
esearchers out
onductivities
nd the parame
ure 2.4: K Fun
significant co
the Kunsat fu
n of the Kuns
late suction va
the gradient t
s of the soil p
only moisture
steady state K
nsitive to fluc
the gradient.
rch by Zhang
of the unsatur
ed "Wetting f
ductivity" they
simulate the
tline the main
which includ
eter estimatio
nction Calcul
onclusions rep
unction from t
sat function ca
alues from m
terms, and the
profile can ha
e measuremen
Kunsat functio
ctuations in th
and Fredlund
rated hydrauli
front advancin
y developed a
flow of water
n method used
de the steady s
on method. T
21
lated by McC
ported by the
the transient a
an be affected
measured volum
e fitting of the
ve an effect o
nts used exclu
on calculation
he suction and
d was done to
ic conductivit
ng column tes
an experimen
r in an unsatu
d for measuri
state method,
he steady stat
Cartney vs. Me
authors invol
and steady sta
d by the use o
metric moistu
e time series w
on the Kunsat
uded the lowe
ns. Also the K
d moisture co
o develop a di
ties (Zhang an
st for measuri
ntal method us
urated soil col
ing the unsatu
the instantan
te method is p
easured Data
lved with the
ate infiltration
of the water re
ure content va
with smooth c
t function. Th
er 500mm of
Kunsat functi
ontent, which
irect method
nd Fredlund,
ing unsaturate
sing a large sc
lumn. In the
urated hydrau
neous profile m
performed by
.
n data.
etention
alues, the
curves.
he authors
the soil
ion is
can cause
for the
2009). In
ed
cale soil
paper the
ulic
method,
y applying

22
constant boundary conditions and has a limited measurement range. The parameter
estimation method is performed by experimentally simulating and modeling the soil
hydraulic conductivity curves or soil water characteristic curves. The experiment
conducted in the study was the instantaneous profile experiment and the authors list some
significant disadvantages to the test which are list below.
The instantaneous profile test is often time consuming depending on the type of
soil being testing, sample size, and suction range.
A proper flow rate for soil wetting is difficult to choose. If the flow rate is too
high, the gradually changing suction and water content profiles cannot be
discerned. Recommended flow rates are from 0.2 to 5.0 cm3/day.
The accuracy of the test is related to the space between water content or suction
measurement points. Theoretically, the closer the water content or section
monitoring points are, the more accurate are the calculated unsaturated hydraulic
conductivity values are.
The soil column test device was 120mm in diameter and 1000mm in height.
Four theta probes where installed to measure the soil water content and four tensiometers
were installed to measure the soil matric suction. The tensiometers used have a limited
suction range of 0-90kPa. Various soil types were tested ranging from gravels (GW-
GM), to sands (SC and SM), silts (ML) and clays (CL). Two types of tests were
performed, a capillary rise test and an infiltration test. For the capillary rise test the water
was ponded at the bottom of the sample and allowed to seep up into the soil profile. For
the infiltration test, a constant water head was applied at the top of the soil column and
allowed to seep down into the soil profile. These two experiments were performed on the
soil types specified and the hydraulic conductivity curves are presented. The hydraulic

co
(1
pr
in
of
Fr
at
onductivity cu
1958) curve fi
Figure
The au
rocess of wet
nfiltration pro
f wetting and
redlund show
t the same suc
urve for the le
fit was applied
e 2.5: Hydrau
uthor also ma
ting and dryin
ocess and capi
drying to the
w that the infil
ction value.
ean clay (CL)
d to the measu
ulic Conductiv
de a comparis
ng of the soil
illary process
e hydraulic co
ltration proce
23
) is presented
ured data.
vity Function
son of the uns
. Since two e
the data set w
onductivity. I
ss produces lo
d below in Fig
n Fit by Zhang
saturated con
experiments w
were plotted t
In Figure 2.6
ower hydraul
gure 2.5. The
g and Fredlun
nductivity data
were conducte
to observe the
below, Zhang
lic conductivi
e Gardner
nd.
a to the
ed by the
e impact
g and
ity values

fe
lo
tim
of
di
au
10
in
of
fi
in
ex
2
so
Figure
Throug
eatures from t
og-linear hydr
mes greater th
f 400 to 600m
isturbance, th
uthors note se
0 days using
The hy
n landfill cove
f their study w
ine grained so
nstantaneous p
xperiments. T
1.3cm in leng
oil profile, ten
2.6: Trend o
gh the experim
the tests. The
raulic conduc
han the lower
m is recomme
he wetting fro
everal series o
such a soil co
ydraulic prope
ers were analy
was to measur
oils (CL-ML a
profile metho
The soils wer
gth. To measu
nsiometers, th
f Hydraulic C
ments conduc
e unsaturated
ctivity band. T
r hydraulic co
ended, taking
nt advancing
of unsaturated
olumn test.
erties of two
yzed by Meer
re the unsatur
and MH) und
od was used to
re compacted
ure suctions a
hermocouples
24
Conductivity D
cted, the resea
hydraulic con
The upper hy
onductivity at
into consider
process, testi
d hydraulic co
fine grained s
rdink, Benson
rated hydraul
der different c
o conduct the
in a apparatu
and the water
s psychromete
Data for Wett
archers note t
nductivities o
ydraulic condu
t the same suc
ration factors
ing time, and
onductivities
soils, similar
n and Khire (
lic conductivi
ompaction co
e unsaturated h
us device of 1
content at va
ers, and time-
ting and Dryi
the some sign
obtained are lo
uctivity is abo
ction. A colu
such as samp
data sufficien
can be obtain
to the soil typ
1996). One o
ity functions f
onditions. Th
hydraulic con
0.2cm in diam
arious points a
-domain refle
ing.
nificant
ocated in a
out 5 to 10
umn length
ple
ncy. The
ned within
pes used
objective
for two
he
nductivity
meter and
along the
ctometry
(T
pr
ex
co
2
th
st
be
th
op
co
co
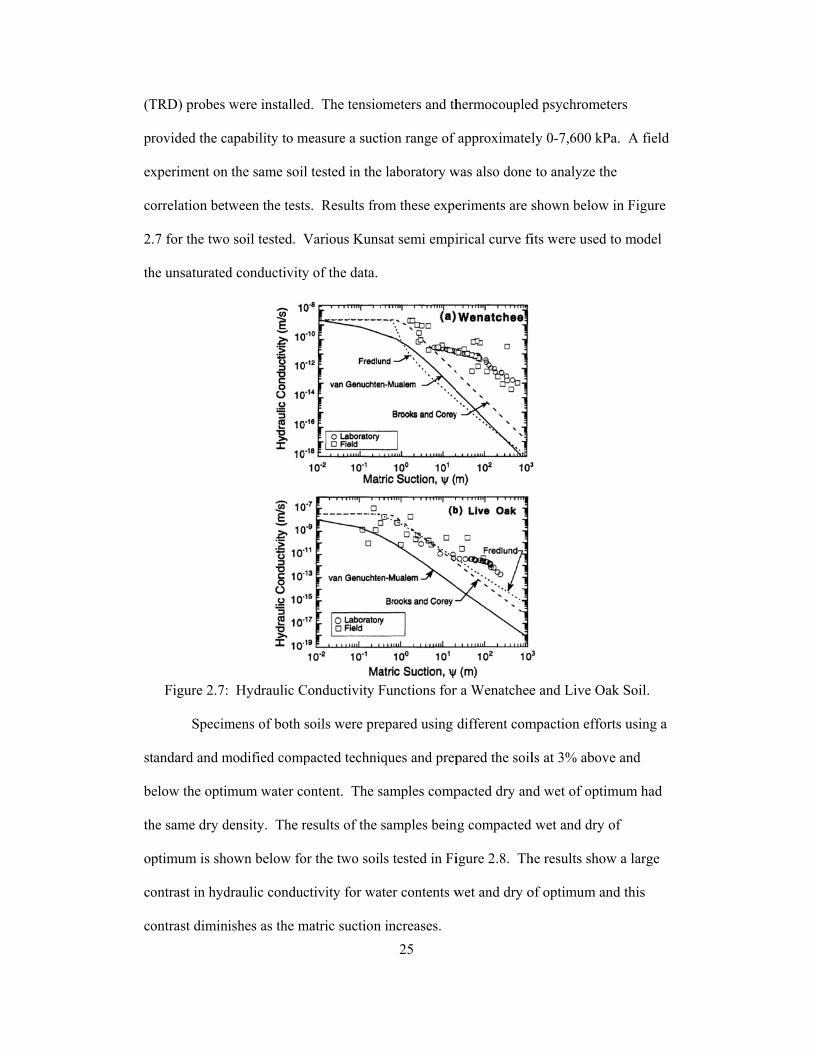
TRD) probes
rovided the ca
xperiment on
orrelation bet
.7 for the two
he unsaturated
Figure 2.7:
Specim
tandard and m
elow the optim
he same dry d
ptimum is sho
ontrast in hyd
ontrast dimin
were installed
apability to m
the same soil
tween the test
o soil tested. V
d conductivity
Hydraulic C
mens of both
modified comp
mum water co
density. The r
own below fo
draulic conduc
ishes as the m
d. The tensio
measure a suct
l tested in the
ts. Results fro
Various Kuns
y of the data.
Conductivity F
soils were pre
pacted techni
ontent. The s
results of the
or the two soil
ctivity for wa
matric suction
25
ometers and th
tion range of
e laboratory w
om these expe
sat semi empi
Functions for
epared using
ques and prep
samples comp
samples bein
ls tested in Fi
ater contents w
n increases.
hermocoupled
approximatel
was also done
eriments are s
irical curve fi
r a Wenatchee
different com
pared the soil
pacted dry an
ng compacted
igure 2.8. Th
wet and dry o
d psychromet
ly 0-7,600 kP
to analyze th
shown below
its were used
e and Live Oa
mpaction effor
ls at 3% abov
nd wet of optim
wet and dry
he results show
of optimum an
ters
Pa. A field
he
w in Figure
to model
ak Soil.
rts using a
ve and
mum had
of
w a large
nd this

sa
sp
ap
st
m
ef
lo
Figure 2
The ef
aturated and u
pecimens com
pproximately
tandard procto
modified effor
ffort reduces
ower hydrauli
2.8: Hydrauli
ffect of compa
unsaturated hy
mpacted with
one order of
or effort. The
rt had a lower
the frequency
ic conductivit
c Conductivit
action effort c
ydraulic cond
the modified
f magnitude lo
e authors beli
r hydraulic co
y of large por
ty.
26
ties at Variou
can be seen in
ductivities for
proctor effor
ower than the
ieve that the s
nductivities b
es, reducing t
us Compacted
n the plot belo
r nearly all su
rt had hydraul
specimens co
specimens com
because comp
the void ratio
d Water Conte
ow in Figure
uctions for the
lic conductivi
ompacted wit
mpacted with
paction with h
o and thus resu
ents.
2.9. The
e
ities
th the
h the
higher
ulting in a

so
fu
ch
th
w
un
sh
pr
G
Figur
The re
orption (wetti
unction of suc
haracteristic c
han a soil und
water content,
nsaturated hy
howing the ef
resented belo
Figure 2.10
An exp
Garga and Bris
e 2.9: Hydra
esearch found
ing) curves w
ction. This sa
curves. A soi
dergoing sorpt
a larger cross
ydraulic condu
ffects the hyd
w titled Figur
0: Hydraulic
periment usin
sson (2007).
aulic Conducti
d a distinct dif
when the unsat
ame type of h
il undergoing
tion thus a so
s-sectional ar
uctivity at the
draulic conduc
re 2.10.
Conductiviti
ng the instanta
There experi
27
ivity at Vario
fference betw
turated hydrau
ysteresis effe
desorption g
il undergoing
ea for flow, le
e same suction
ctivity to the w
es by Meerdin
aneous profile
ment showed
ous Compactio
ween the desor
ulic conductiv
ect can be seen
generally has a
g desorption h
ess tortuous f
n. The result
wetting and d
nk et al. for W
e method was
d the limitatio
on Condition
rption (drying
vity is expres
n in soil wate
a high water c
has a higher v
flow paths, an
ts from the stu
drying process
Wetting and D
s done by Van
ons of certain
ns.
g) and
ssed as a
er
content
volumetric
nd higher
udy
s is
Drying.
napalli,

28
measurement devices which they used in their experiment. In their research, they
developed a modified permeameter that was design and developed to determine the
hydraulic conductivity for unsaturated nickel tailings using large size samples. In the
study they were able to determine values for the unsaturated hydraulic conductivity with
little scatter over a low suction range using the instantaneous profile method. This is
largely due to the soil chemistry and the devices used to measure the water flow and
hydraulic gradient. The flow was determined using Time Deflection Reflectometry
(TDR) probes and manual water contents. The pore water pressures were measured by
tensiometers. One reason why the unsaturated hydraulic conductivities are only limited
to a low suction range may be due to the limitations of the measurement sensors. The
tensiometers used could only measure with in a suction range of 0 to 85 kPa.
A study done by Krisdani, Rahrdjo, and Leong, compared direct measurement
through the instantaneous profile method to current statistical models (2009). The
objective of the study was to illustrate the applications of both direct and indirect
methods in the determination of the unsaturated hydraulic conductivity. The soil types
tested in the experiment were a sandy silt (ML) and a silty sand (SM). The instantaneous
profile experiment conducted was a drying process that was performed on a sloped
model. Tensiometers were used to measure the soil suction and the soil water
characteristic curve was used to determine the soil water content. Conclusions of the
study were that the instantaneous profile method and statistical methods could be used to
obtain Kunsat function for the soils tested. They stated that these methods could be
adopted if there is no direct measurement of the saturated coefficient of permeability. In
the statically model used in the study the saturated hydraulic conductivity was off by an
order of magnitude.

in
m
of
un
ar
co
m
fr
ca
er
w
th
w
re
go
In Pola
nstantaneous p
measurement b
f four differen
nsaturated hy
rticle also inc
onductivity. I
measurements
rom the TDR
alibration of t
rror on the hy
which were san
Figure 2.11
The in
he unsaturated
work reviewed
easonably wel
ood agreemen
and a study w
profile metho
by instantaneo
nt soil types i
ydraulic condu
cludes equatio
In their analy
at low water
probes used t
these sensors
ydraulic condu
nd and silts.
: Average Er
nstantaneous p
d hydraulic co
d the instantan
ll for clays w
nt with predic
was done by S
od titled "Erro
ous profiles m
including a cl
uctivity for a
ons for the det
ysis, they foun
contents whi
to measure w
to increase th
uctivity for cl
This plot is p
rror of Water
profile metho
onductivity fo
neous profile
ith degrees of
cted values (H
29
Salwinski, Wa
or analysis of
method" (2006
ay. The analy
range of suct
termination o
nd that there w
ich can be ref
water content.
he accuracy. A
lays was high
presented belo
Content Mea
d is the most
or fine grained
method is mo
f saturation b
Hamilton, Dan
alczak and Sk
water conduc
6). The study
ysis included
tion values of
of the unsatura
was greater er
flected by the
The study re
Also, the aver
her than the ot
ow in Figure 2
asurements m
preferred me
d soils. Base
ostly used. T
etween 30 an
niel and Olso
kiefucha on th
ctivity coeffic
y included the
d the average v
f 9.81 to 981 k
ated hydrauli
rror from wat
measuremen
ecommended
rage relative m
ther soil type
2.11.
made by TDR
ethod for dete
ed on the publ
This method w
nd 90 percent
n, 1979). Th
he
cient
e testing
values of
kPa. The
c
ter content
nts taken
individual
maximum
s tested,
probes.
ermining
lished
works
and has
he

30
experiments done by other researchers have used various methods for measuring either
the soil water content or matric suction or both over time. In some of the experiments
reviewed TDR probes were used along with manual water contents. Suction was
measured using tensiometers or thermocouples psychrometers. The use of measuring the
water content and matric suction using TDR probes, tensiometers, or thermocouples is
prone to limitations on their range of measurement and accuracy.
Many of the instantaneous profile experiments previously conducted used the soil
water characteristic curve to interpolate water content and suction measurements. This
method is performed frequently in unsaturated soil testing and is an acceptable means of
interpretation. When the water content or suction was indirectly measured from direct
measurements these measurements are made from empirical correlations. In some
experiments such as the one performed by McCartney, Vilar, and Zornberg, their
instantaneous profile method data did not align perfectly with the predicted results due to
the use of the water retention curve. The authors noted that the Kunsat function can be
affected by the use of the water retention curve to calculate suction and the calculation of
gradient terms. This suggests that the indirect measurement made should be made from a
well-established and accurate soil water characteristic curve.
The research done by Meerdink, Benson and Khireshowed showed that
the unsaturated hydraulic conductivity can be affected significantly by its compaction
conditions (1996). In the review of their research it can be concluded that when
performing conductivity experiments for comparison that the entire sample be created
and compacted at the same dry density and water content and using the same amount and
type of compaction energy. The apparatus used for most instantaneous profile
experiment is a rigid form and is typically cylindrical. PVC and clear Plexiglas tubing
was the most common apparatus material probably due to the impermeability and

31
rigidity. Data was compiled of the length and size of the apparatus used in each
instantaneous profile experiment reviewed. This is presented in Table 2.1 below which
also presents the length to width ratios. The average length to width ratio ranges from 2.5
to 5.
Table 2.1: Apparatus Length to Width Ratios of Published Instantaneous Profile Experiments.
Effects of Cracks to the Unsaturated Hydraulic Conductivity The effects of cracks on the unsaturated hydraulic conductivity are still not fully
understood. There is very limited research available on the behavior of soils with cracks.
Cracks are also called tensile cracks (or soil fracturing) and desiccation cracking. Tensile
cracks develop when there are external loads that result in tensile stresses in the exposed
soil surface, such as those that can occur on the crest of a landslide or a vertical cut.
When these cracks filled with water, it can lead to further instability (Mitchell and Soga,
2005).
Crack formations in fine grained soils caused by the evaporation process are
called desiccation cracks. Evaporation causes a reduction in the pore water pressure and
an increase in effective stress (Mitchell and Soga, 2005). Throughout the evaporation
process the soil grains get pulled closer together and from this process the crack is
formed. The size of the crack depends of the tensile strength of the soil, the type and
Researcher Length(cm)Width or
Diameter (cm)L/W Ratio
Richards and Weeks (1953) 35 5.7 6.14Hamilton, Daniel, and Olson (1979) 14.4 5 2.88McCartney, Vllar, and Zornberg 75 20.3 3.69Li, Zhang, and Fredlund (2009) 100 12 8.33Li, Zhang, and Fredlund (2009) Recommended 50 12 4.17Meerdink, Benson, and Khire (1996) 21.3 10.2 2.09Vanapalli, Garga, and Brisson (2007) 40 20 2.00Krisdani, Rahardjo, and Leong (2009) 200 40 5.00Slawinski, Walczak, and Skierucha (2006) 5 5.5 0.91

32
amount of fine grained material, water content, soil density, and elastic properties. The
physics and mechanics behind the process of crack formation will not be discussed in this
study.
Understanding hydraulic conductivity behavior for cracked fine grained soils
could be beneficial when evaluating soil used for contaminant barrier systems in
landfills, and for sloped structures. In these type of engineered systems, advanced
analysis typically incorporates parameters or functions of the soil unsaturated hydraulic
conductivity. To develop a good understanding of the hydraulic conductivity for cracked
soils, a review of current literature on the hydraulic conductivity and the effect of cracks
is conducted. This review will also aid in the experimental design for cracked
instantaneous profile test that are conducted in this study.
An article titled “Desiccation Induced Cracking and its Effect on the Hydraulic
Conductivity of Clayey Soil from Iran” by Rayhani, Ynaful and Fakher pertains heavily
to this study (2007). The article describes the effect of desiccation induced cracking on
the hydraulic conductivity of clay soils involving the testing of four different clay soils.
Each soil was compacted into sample tubes using a standard proctor mold at 95% of the
maximum compaction, at a moisture content of 2% above optimum. The samples were
initially tested for the saturated hydraulic conductivity and cycled through periods of wet
and dry conditions. The conditions for the wet and dry periods were taken from typical
atmospheric conditions in Iran. The researchers provide an analysis of the effects of the
cracking to the hydraulic conductivity, volume change, and self-healing.
The results of the tests indicated that the effects of the cracks in fine grained soils
affected the hydraulic conductivity of the soil. The authors found that the hydraulic
conductivity increased with an increase in number of wet and dry conditions and the
presents of cracks. This variation in hydraulic conductivity was on the order of two

or
re
be
se
F
M
cl
co
so
th
cr
fr
T
5c
un
rders of magn
esearchers con
elieved that th
elf-healing pr
igure 2.12: H
Anoth
McBrayer, Ma
lay fractures d
ompacted clay
oil. Samples
hickness. Thr
racked surfac
rom cycles of
The infiltration
cm of red dye
ntil steady sta
nitude. A plo
ncluded that t
he different c
rocesses that a
Hydraulic Con
er study titled
auldon, Drum
during infiltra
y (1997). In
were compac
ree sample set
es for each se
f wetting and
n tests perform
e solutions on
ate flow cond
ot from the art
this phenome
hanges in hyd
affect the vari
nductivity rec
d "Infiltration
mm, and Wilso
ation tests and
this study, inf
cted into mold
ts were create
et of soil samp
drying, and o
med used a M
n the sample.
ditions were ob
33
ticle is presen
non is genera
draulic condu
ious soil type
cords for Diff
n Tests on Fra
on investigate
d the extent o
filtration tests
ds 10.2 and 15
ed, one uncra
ples were form
or were forme
Mariotte devic
The rate of in
btained. Afte
nted below in
ally referred t
uctivities are a
es by different
ferent Cycles
actured Comp
ed the transien
of preferential
s were perform
5.2cm in diam
acked, and two
med either by
ed by cycles o
ce to maintain
nfiltration wa
er infiltration,
Figure 2.12.
to as self-heal
associated wi
t degrees.
of Drying an
pacted Clay" b
nt hydraulic r
l flow paths in
rmed on a kao
meter and 5.1
o cracked sets
y desiccation
of freezing an
n a constant he
as recorded w
, the samples
The
ling and is
ith the
nd Wetting.
by
esponse of
n
olinite clay
cm in
s. The
cracks
d thawing.
ead of
with time
were

34
allowed to dry and then cut into slices. The slices were then recorded with a camera and
evaluated using the dye to qualitatively evaluate the degree of infiltration.
Some significant findings from this study are as follows. Desiccation and
freeze/thaw induced cracks appear to heal upon rehydration, but re-open on subsequent
cycles of desiccation or freeze/thaw. The infiltration of a cracked clay has an initial
transient stage during which the preferential flow paths play a dominant role. Although
cracks appear to be healed, they still contribute to flow. The authors note that these
considerations could have an effect on judging the quality and integrity of compacted
clay barriers. Due to clay swelling and closing of fractures, flow calculations based on
hydraulic conductivity determined for steady-state conditions may underestimate flow
during the dynamic stages of infiltration.
A study done by Yesiller, Miller, Inci, and Yaldo on desiccation cracking
behavior explained the effects of cracking to characteristics of fine grained soils (2000).
This article indicates that desiccations cracks are formed as a result of water loss to the
atmosphere. The drying causes suction to develop in the soil, increasing the effective
stress. The volume of soil begins to decrease and cracks develop in the soil mass. One
significant finding from their study was that the size of the cracks created from cycles of
wetting and drying was greater when the soil was compacted at moisture contents above
the optimum moisture content as compared with soil compacted at moisture contents less
than the optimum moisture content. The extent of cracking is a function of both the
amount of water in the soil at the onset of drying and the suction attained during drying.
Field studies have also been conducted demonstrating the effects of cracking on
the hydraulic conductivity. In Taiwan, Lui et al. performed infiltration tests on cracked
paddy field soils. These soils became cracked from drainage and exposure to sunlight
after two days of rain fall (2003). Intact laboratory infiltration tests were conducted on

35
paddy soil samples to compare with field observations. The results showed an increase in
crack size when soils are saturated which temporarily increases the infiltration rate.
When the cracks initially fill, the soils swell and this also affects the infiltration rate.
This swelling of the soil closes or heals the cracks. During this healing process the
researchers observed that the clay particles disperse and redeposit themselves on the
surface of cracks. This effect significantly reduces the infiltration rate.
Review of these studies offers many considerations pertinent to the experimental
design for this paper. Experiments performed by Rayhani et al., involving measurements
of the hydraulic conductivity after cycles of wetting and drying showed that an increased
in the number of cycles caused in increase in crack volume and an increase in the
hydraulic conductivity (2007). McBrayer et al. showed evidence that there is an initial
stage of infiltration for cracked soils. During this initial stage, the crack tends to heal,
while it still contributes to flow (1997). The experiments done by Yesiller et al. showed
that the size of the crack created from cycles of wetting and drying was greater when the
soil is compacted wet of optimum (2000).

36
CHAPTER 3: SOIL CHARACTERIZATION AND EXPERIMENTAL DESIGN
Soil Characterization The soil used for the National Science Foundation (NSF) cracked clay research
project and this study is an Otay clay from San Diego, California. A clayey soil was
chosen for this study because these soils are susceptible to cracking which is the focus of
the NSF study. The soil sample was characterized by determining the classical index
properties and the soil type using the tests listed in Table 3.1 below. Other tests were
performed to determine the swell potential, water retention, hydraulic conductivity, and
consolidation characteristics. The soil tests shown in Table 3.1 were performed in
accordance to the ASTM standard specified.
Table 3.1: ASTM Standards for Soil Tests Performed. Soil Test ASTM Specification
Sieve Analysis and Hydrometer
ASTM D 422-63: Standard Test Method for Particle Size Analysis of Soils
Atterberg Limits ASTM D 4318-00: Standard Test Methods for Liquid Limits, Plastic Limit, and Plasticity Index of Soils
USCS Classification ASTM D 2487-00: Standard Practice for Classification of Soils for Engineering Purposes (USCS)
Specific Gravity ASTM D 854-02: Standard Test Methods for Specific Gravity of Soil Solids by Water Pycnometer
Standard Proctor Compaction Test
ASTM D 698-00: Standard Test Methods for Laboratory Compaction Characteristics of Soil Using Standard Effort
Consolidation ASTM D 2435-04: Standard Test Methods for One Dimensional Consolidation Properties of Soils Using Incremental Loading
Saturated Coefficient of Hydraulic Conductivity
ASTM D 5084-03: Standard Test Methods for Measurement of Hydraulic Conductivity of Saturated Porous Materials Using a Flexible Wall Permeameter
Expansion Index ASTM D 4829-03: Standard Test Method for Expansion Index of Soils
Swell Potential ASTM D 4546-03: Standard Test Methods for One Dimensional Swell or Settlement Potential of Cohesive Soils

37
Index Properties:
The gradation plot for the San Diego soil is presented below in Figure 3.1. The
particle gradation was determined by performing a sieve analysis and hydrometer
analysis on the soil. The percentages of Sand, Gravel and Clay are summarized below:
% Gravel = 2% % Sand = 63% % Clay = 35% D10 = 0.0045mm D30 = 0.06mm D60 = 0.18mm
40 (Eqn. 3.1)
∗
4.44 (Eqn. 3.2)
The Atterberg limits were determined for the soil and are presented in Table 3.2
below.
Table 3.2: San Diego Soil Atterberg Limits.
Based on the result of the gradation test and Atterberg limits, the soil is classified
as a Clayey Sand (SC). The soil was described as fine grained and brown in color.
LL 40.85%PL 17.73%PI 23.12%

co
m
The sp
A stan
ontent was als
maximum dry
MaximOptim
Figure 3
pecific gravity
Gs = 2.72
ndard proctor
so performed
density and o
mum Dry Unimum Water Co
3.1: Gradatio
y of the soil s
test to determ
d. The compa
optimum wate
t Weight = 10ontent = 17.4%
38
on Plot for the
olids for the S
mine the maxi
action curve is
er content are
08.7 pcf %
e San Diego S
Sand Diego c
imum density
s presented in
e as follows:
Soil.
clay is 2.72.
y and optimum
n Figure 3.2.
m moisture
The

C
co
W
st
pr
ap
Consolidation
A serie
onsolidation t
With the conso
tress strain cu
reconsolidatio
pproximately
Figure 3.2
Tests:
es of consolid
tests were per
olidation resu
urve for the Sa
on pressure w
220 kPa.
: Compaction
dation tests w
rformed at pre
ults the stress
and Diego cla
was calculated
39
n Curve for th
were performe
essures of 12,
strain curve w
ay is presente
d using the Ca
he Sand Dieg
d on the Sand
, 25, 50, 200,
was determine
ed in Figure 3
asagrande cor
go Soil.
d Diego clay.
400, and 800
ed for the sam
.3 below. Th
rrection meth
The
0 kPa.
mple. The
he
od to be

Sw
te
pr
sa
fo
well Index:
To det
est and variou
resented in Ta
aturation of 4
ollowing.
Figure 3.3
termine the ex
us swell tests w
able 3.3 below
0%. The AZ
Table 3.3: EI mASTEI(A
: Stress Strai
xpansion pote
were perform
w. Note that
expansion in
Expansion InmeasTM EI%AZ) %
40
in Curve for t
ential for the S
med. The resu
the Expansio
ndex was corr
ndex Results
the San Diego
Sand Diego s
ults from the e
on Index (EI)
related from F
for San Dieg
7.7568.0106.8
o Clay.
soil, an expan
expansion ind
test was perfo
Figure 3.4 in t
go Soil.
nsion index
dex are
formed at a
the

41
Figure 3.4: Correlation Between ASTM EI and AZ EI.
Free Swell Tests:
The percent swell presented in Table 3.4 below was found using the free swell
method (Method A ASTM D 4546-03). For some of the sample the swell pressure was
also determined. These swell tests were performed using a consolidometer. Swell
determined using the consolidometer indicated an average swell of 4 to 5 % for relative
compactions greater than 95%.
Table 3.4: Free Swell Results for San Diego Soil.
EIASTM = 0.16EIAZ2 + 6.3EIAZ + 11.7R2 = 0.87N = 100
1
10
100
1000
0.1 1 10 100
AS
TM
Exp
ansi
on
Ind
ex
EI(AZ) [%]
kPa kPa3 89.10 0.18 64.99 3.19 5.078% 64.954 89.55 0.174 63.57 3.22 2.391% 56.465 89.54 0.174 63.54 5.07 2.616% NA6 94.18 0.179 73.90 3.23 6.441% 117.667 94.16 0.179 73.87 3.26 4.062% NA8 94.56 0.177 73.83 3.19 5.281% 108.439 96.88 0.177 78.59 3.29 3.785% 141.95
10 95.85 0.156 67.37 3.19 4.672% NA11 99.24 0.185 87.63 3.23 3.422% NA12 100.37 0.172 84.08 3.23 6.239% NA13 99.02 0.188 88.52 3.23 5.535% NA
Saturation (%)
Initial Loading Pressure % Swell
Swell Pressure
Swell Test No.
Compaction Specification
(%)
Moisture Content

42
The swell pressure was also determined using a direct shear apparatus configured
for a free swell test using the procedures outlined in ASTM D4546-03. The swell
pressures from the free swell method are presented in Table 3.5. The samples for the
swell results in the following were performed at a relative compaction of 98% and at -2%
from the optimum water content.
Table 3.5: Swell Pressure from Free Swell Method.
Constant Volume Swell Tests:
The swell pressure was also determined using the direct shear apparatus
configured for a constant volume swell test using procedures outlined in ASTM D4546-
03. The swell pressures from the constant volume method are presented in Table 3.6.
The samples for the swell results in the following were performed at a relative
compaction of 98% and at -2% from the optimum water content.
Table 3.6: Swell Pressures from Constant Volume Method.
Saturated Hydraulic Conductivity Tests:
The saturated hydraulic conductivity of the San Diego soil was determined by
using a triaxial apparatus to run a saturated hydraulic conductivity test. The soil was
compacted at 98% relative compaction and at optimum water content. The average
Test No. Setting Load (N) Swell Pressure (kPa)14 5 4515 25 4016 145 017 125 0
Average Swell Pressure 42.5
Test No. Swell Pressure, kPa18 1419 1520 18

43
saturated hydraulic conductivity was calculated to be 1.33 10^8 m/s. Table 3.7 below
presents the saturated hydraulic conductivity for the three tests performed.
Table 3.7: Saturated Hydraulic Conductivity Values.
Water Retention Tests (SWCC): The soil water characteristic curve (SWCC) was determined from the San Diego
soil. The SWCC plot for the soil is presented in Figure 3.5 below. The points on this
plot were taken from instantaneous profile experiments where both water content and
matric suction was measured. SWCC curves were fit to the data points using the van
Genuchten (1980) equation (Zapata, 1999). The Fredlund and Xing (1994) and van
Genuchten (1980) SWCC equations along with the description of the fitting parameters is
presented below in Table 3.8. The Fredlund and Xing SWCC model was not used and
not fit to the data.
Test No. Ksat (m/s) Avg. Ksat (m/s)1 1.07E-082 8.68E-093 2.07E-08
1.33E-08
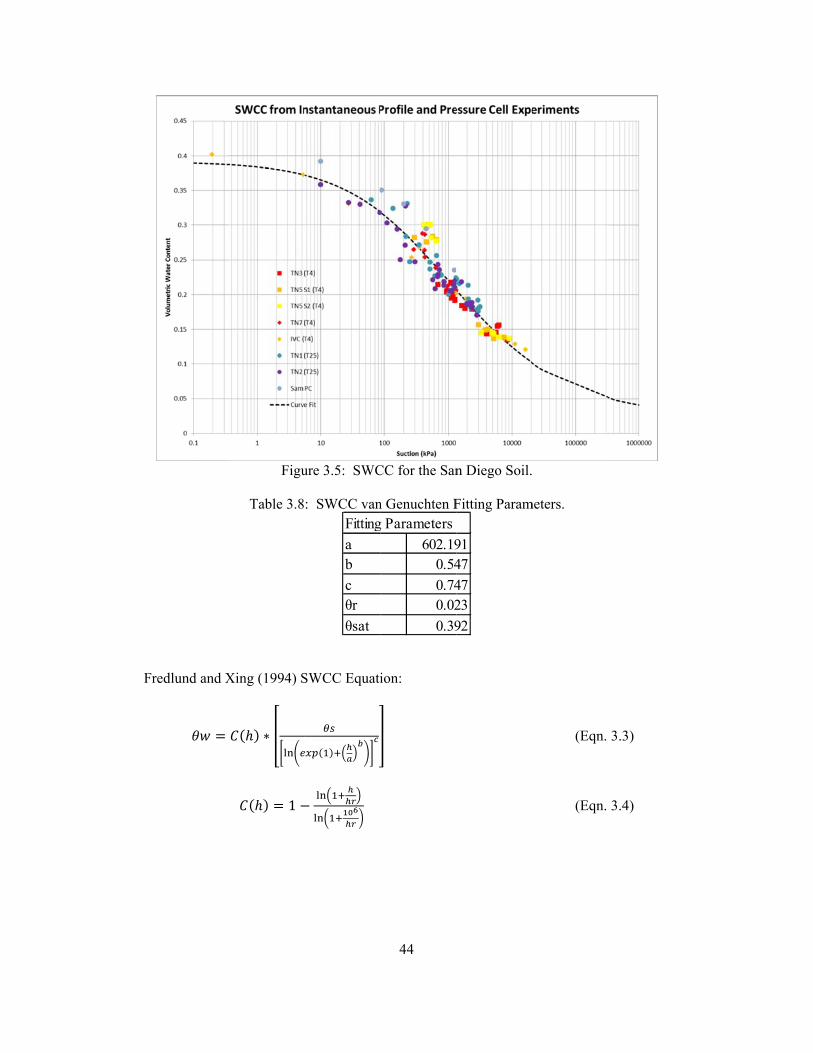
Fr
redlund and X
Figu
Table 3.8
Xing (1994) S
∗
1
ure 3.5: SWC
: SWCC van
SWCC Equati
Fitting
ab
cθr
θsat
44
CC for the San
n Genuchten F
ion:
g Parameters
602.190.54
0.740.02
0.39
n Diego Soil.
Fitting Param
9147
4723
92
meters.
(Eqn.
(Eqn.
3.3)
3.4)

45
Van Genuchten (1980) SWCC Equation:
(Eqn. 3.5)
Variables and parameters: : Volumetric water content. : Saturated volumetric water content. a: Soil parameter related to the air entry value. b: Soil parameter related to the rate of water extraction. c: Soil parameter related to the residual water content. hr: Soil parameter related to the residual water content (kPa). : Residual volumetric water content. h: Height of water in cm. Using the SWCC for the soil sample, the air entry value and residual suction
values were determined. The parameters are provided below.
Air Entry Value = 20 kPa Residual Suction = 20,000 kPa

46
Experimental Design The objective of this experiment is to analyze the effects of air voids and cracks
on the unsaturated hydraulic conductivity. To analyze the hydraulic behavior of the soil,
separate experiments were used to test the intact and cracked conditions using the
instantaneous profile method. This analysis was done by comparing the hydraulic
conductivities of the intact and cracked conditions using similar experiments. Numerous
methods for determining the unsaturated hydraulic conductivity have been presented for
the intact condition. The challenge is determining suitable methods for measuring the
unsaturated coefficients of permeability for the cracked conditions.
The same soil was used for all instantaneous profile experiments and other
experiments performed in this study. The soil used was obtained from San Diego and its
properties were described in the previous section. The soil density was maintained to be
the same for each experiment by using the same compaction of 98% of a standard proctor
test. All instantaneous profile experiment samples were compacted in layers in the
sample tubes to maintain a uniform dry unit weight. The height of each compaction layer
lift was kept at 1.5 inches. The interface between each compaction layer lift was
scarified to allow for good contact between layers in general agreement with procedures
used for standard proctor test sample preparation. Effort was taken to keep the properties
of the soil consistent in order for the results from each experiment to be comparable.
Details for the seven experiments conducted for this study are summarized in
Table 3.9 below. Each individual instantaneous profile experiment was designed to
analyze a different suction range for the intact conductivity function or a different aspect
of the way water infiltrates through a cracked section. Seven experiments titled Test
Numbers 1 through 7 are titled accordingly. Each experiment includes separate samples

47
which vary in each experiment. In Table 3.9, the test number along with a description of
the experiment is presented.
Table 3.9: Summary of Instantaneous Profile Experiments.
Intact Instantaneous Profile Experiments To determine the intact unsaturated hydraulic conductivity the instantaneous
profile experiment was used. The results of the intact experiments were used for
comparison purposes with results for cracked soils. Two different types of experiments
were performed to determine the intact unsaturated hydraulic conductivity for the soil.
The first instantaneous profile experiments are titled Test Number 1 (TN1) and Test
Number 2 (TN2), which were trial experiments used to provide information on the
accuracy and quality of the methods used for measurement and the overall experiment
performance. Test Number 3 (TN3) and Test Number 7 (TN7) were also intact
instantaneous profile experiments. These experiments were designed from observations
and problematic issues encountered in TN1 and TN2 that could be improved. Some
improvements included changes to the sampling methods, testing procedures, and the
general method used. The changes and improvements made for TN3 and TN7 from TN1
and TN2 are discussed in Chapter 5. The changes made were significant. For TN3 and
Test NumberIntact or Cracked
MethodAppratus Length
Number of Soil Sections
Experiment Description
Test No. 1 Intact Trial 36" 4 Volumetric moisture probes installed.
Test No. 2 Intact Trial 36" 4 Duplicate of Test No. 1
Test No. 3 Intact Duplicate 9" 2
Test No. 4 Cracked Method B 9" 2Two sets with different number of horizontal cracks.
Test No. 5 Cracked Method C 9" 2 Two set of different crack widths.
Test No. 6Cracked and
IntactMethod A 9" 1
Test No. 7 Intact Duplicate 9" 2 Lower suction range than TN3

48
TN7, the experiment included duplicate samples that could be sampled at different time
periods. The following sections present the experimental design of the instantaneous
profile experiments for the intact condition.
Test Number 1: Test Number 1 (TN1) was an instantaneous profile experiment using a long soil
column with four different sections of different water content. The test tube was split
into equal sections for which soil was to be compacted at different water contents. Each
water content was chosen for each section based on the overall suction range to be
analyzed and the desired hydraulic gradient. The water contents chosen gave suction
values that varied over a broad range which was desired for this experiment. The test
sample is placed in the horizontal position and the soil is allowed to equilibrate. The
water content was recorded over time by taking manual water content samples from the
soil inside the test tube and from the volumetric moisture probes. The matric suction was
measured at the same locations for which manual water contents are taken and the suction
was measured using filter paper tests. Typically sampling events occur every 28 days
and the results were recorded.
Test Number 2: Test Number 2 (TN2) was a duplicate of TN1. Test conditions for TN2 were the
same as TN1, including the sectional water contents, sampling methods and time periods,
and test set up. The only difference in the TN2 experiment was volumetric moisture
probes were not used. The primary purpose of TN2 was for manipulation/reconfiguration
of the experiments. At the beginning of this experiment it was thought that if the flow in
the samples was too slow, TN2 would be used to accelerate the infiltration process by

49
introducing water into the sample. TN2 was also used to check the reproducibility of the
results from the experiment.
Test Number 3: The instantaneous profile experiments TN1 and TN2 were initiated prior to the
experimental design of Test Number 3 (TN3). Observations from TN1 and TN2 were
based on the results obtained and the method and procedures used. From these results,
some scatter was observed and the movement of water or change in water content at each
measurement points was very slow. To improve the accuracy and reliability of the
results, a new test methodology was used for TN3. The disadvantages of TN1 and TN2
and the improvements of TN3 are presented in Chapter 5.
Test Number 3 was an instantaneous profile experiment that used only two soil
sections of different water content. This allowed for improved control over the suction
gradients. The apparatus for TN3 was shorter than that used for TN1 and TN2 since only
two soil sections were used. The methodology for TN3 involved creating 6 duplicate
samples with the same soil conditions at the same time and then completely destroying
the sample specimens for sampling at different time periods. This duplicate method
allowed for the sample specimens to be completely destroyed so the measurement of
water content was more accurate and representative. Also the matric suction was
measured using filter paper tests. Filter paper was placed in between soil compaction
layers and were removed and measured during the sampling events. The sampling events
were performed at various time periods with increasing time between sampling events.
Typical sampling time intervals used were 25, 50, 75, 100, 150 and 300 days.

50
Test Number 7: Test Number 7(TN7) used the same test methodology as TN3. Test Number 7
was an instantaneous profile experiment with a lower target suction range for which
unsaturated hydraulic conductivity was determined. This was done to gain a wider range
of suction values for the hydraulic conductivity function for the intact condition. To gain
conductivity values in a lower suction range lower initial water contents were used for
TN7 than used in TN3.
Cracked Instantaneous Profile Experiments The objective of the cracked instantaneous profile experiments was to measure
the unsaturated coefficients of permeability for the cracked condition. These experiments
differed from the intact experiments in that the samples were prepared with cracks or air
voids. Different methods were proposed to simulate and measure the infiltration of water
through a cracked matrix. The determination of the cracked unsaturated hydraulic
conductivity function may comprise of a combination of the cracked methods presented.
Experiments include different test method that varied the orientation and direction of the
cracks with respect to the soil profile. These experiments allowed for the anisotropy and
crack orientation effects to be considered. To analyze the aspects of how water flows
through a soil sample with that experienced in the field, three methods were used to
simulate direction of the water flow with respect to the crack orientation or direction.
Figure 3.6 below presents the three methods and their relation to the moisture flow.

th
co
si
tr
or
th
an
di
w
ar
T
pe
T
th
Metho
he vertical dir
ondition wher
imulated the c
ransfers throu
r seepage of w
hrough the cra
nd water mov
ifferent way w
water flow and
re listed below
Cracke
Test Number 4
Test N
erpendicular t
This experimen
hat divert or r
F
od A simulate
rection and th
re the soil wa
condition whe
ugh the crack b
water through
ack itself. Th
vement from o
water flows th
d the crack or
w.
ed Instantane
Method A: Method B: Method C:
4:
Number 4 (TN
to the soil pro
nt was design
ender the wat
Figure 3.6: M
d the conditio
hen infiltrates
as continually
en the water s
by evapotrans
h a soil profile
his method co
one side of a
hrough a crac
ientation. Th
ous Profile M
Vertical Infi Horizontal I Single Crack
N4) uses Meth
ofile and the d
ned to observe
ter movement
51
Method Flow D
on when wate
into the soil.
being irrigate
seeps through
sfer. This wo
e. Method C
nsidered the e
crack to the o
cked matrix w
he three metho
Methods and T
iltration (Testnfiltration (Tk Infiltration
hod B where t
direction of th
e the possible
t through the
Directions.
er enters the c
This would
ted and rained
h the soil eithe
ould simulate
simulated the
effects of air
other side. Ea
with respect to
ods that were
Test Number:
t Number 6)Test Number 4
(Test Numbe
the crack orie
he flow of wa
e tortousity ef
soil. To cons
cracked surfac
simulate the f
d on. Method
er around the
horizontal m
e water infiltr
space within
ach method m
o the direction
e included in t
4) er 5)
entation was
ater through th
ffects of havin
sider this effe
ce from
field
d B
cracks or
migration
ration
a crack
measured a
n of the
this study
he sample.
ng cracks
ect and

m
co
le
sa
th
tim
di
ra
F
an
va
in
tu
cr
ra
F
measure the hy
onducted with
engths in flow
ample set to a
This m
he duplicate m
me periods. T
ifferent water
ange and hydr
ilter paper san
nd measured
arious time pe
nto the soil pr
ubes. Each sa
rack volume f
atio similar to
igure 3.7 belo
ydraulic cond
h a different n
w paths. With
another and fo
method was co
method so sam
The sample w
r content. Th
raulic gradien
ndwiches wer
during each s
eriods with in
rofile using a
ample was pre
for each samp
o Method A, b
ow presents th
Figu
ductivity for th
number of per
h this experim
or comparison
onducted usin
mples could b
was compacte
e water conte
nt. The matric
re placed betw
sampling even
ncreasing time
circular saw a
epared so crac
ple set was de
but one sampl
he two crack
ure 3.7: Meth
52
his type of sim
rpendicular cr
ment, the impa
n to results fo
ng procedures
e completely
ed into cylindr
ents were cho
c suction was
ween compac
nt. The samp
e between sam
after the soil w
cks extend fro
etermined. Bo
le had signific
configuration
od B Crack C
mulation two
racks which m
act of the num
or intact samp
s similar to th
sampled and
rical tubes wi
sen to provid
s measured us
cted soil layer
pling events w
mpling events
was compact
om the side o
oth sample se
cantly more c
ns for Method
Configuration
experiments
may create di
mber of cracks
ples.
hose used for T
d destroyed at
ith two soil se
de the desired
sing filter pap
rs and were re
were performe
s. The cracks
ted in the appa
of the sample
ets had a crac
cracks cut into
d B.
n.
were
ifferent
s from one
TN3 using
t desired
ections of
suction
per tests.
emoved
ed at
s were cut
aratus
tube. The
k volume
o the tube.

53
Test Number 5: Test Number 5 (TN5) used Method C for a condition in which a single crack
existed horizontally in the middle of the soil profile. This method was used to analyze
the interface of a single crack and the air-water-vapor transfer that occurs at this
interface. The conductivity that is calculated over the air gap represents a lower limit of
the hydraulic conductivity and may represent the conductivity of evapotransfer. A
special procedure was used to create the crack in the middle of the tube. This procedure
involves compacting a soil section into half of a sample tube. Soil plugs from two half
tubes were then extruded into a sample tube from opposite ends. The soil plug sections
were carefully pushed together so that a small air gap remained in the middle of the tube
at the desired width. Two sample sets, Set 3 and Set 4, with air gaps of 1/8' and 1/4"
respectively were prepared.
This method was conducted using procedures similar to those used for TN3 using
the duplicate method so samples could be completely sampled and destroyed at desired
time periods. The samples were compacted into cylindrical tubes in layers at two
different water contents. The water contents were chosen to provide the desired suction
range and hydraulic gradient. The matric suction was measured using filter paper tests.
Filter papers were placed between soil compaction layers and were removed and
measured during each sampling event. These sample tubes were stored in an
environmental chamber to maintain moisture contents. Figure 3.8 below presents the
configuration for Method C.

T
th
in
us
cr
pe
ve
m
us
w
si
ra
lo
th
co
Test Number 6
Test N
he top of the s
nto the sample
sed a duplicat
racks on the h
ermeability m
ertically down
manner using t
sing cracked
wedge into the
ingle water co
ange. The wa
ocations using
he relationship
ontinuously u
F
6:
Number 6 (TN
sample. Wate
e and provide
te intact samp
hydraulic con
measurements
nward into th
the same proc
configuration
e soil. The sam
ontent which
ater content w
g volumetric m
p from the SW
until equilibriu
Figure 3.8: M
N6) incorporat
er was added
ed a path for w
ple in order to
nductivity. Th
had been tak
he sample. Al
cedure. For th
n used in prev
mple specime
was chosen to
was the only p
moisture prob
WCC for the s
um was achie
54
Method C Conf
ted Method A
to the top of
water to infiltr
o compare res
he intact dupli
ken using a m
ll samples for
he cracked sa
vious testing r
en were prepa
o provide resu
parameter mea
bes. The matr
soil. Each cra
eved.
figuration.
A where the cr
the tube wher
trate into the s
sults and obse
icate sample
method where
r TN7 were cr
amples, the cr
related to this
ared and com
ults within th
asured, and it
rix suction w
acked and int
racks were lo
re the cracks
sample. This
erve the impa
was needed b
water infiltra
reated in the s
racks were for
s study by driv
mpacted in lay
he desired suc
t was measure
was determined
tact test was m
ocated at
extended
s method
act of the
because no
ated
same
rmed
ving a
ers at a
ction
ed at two
d using
measured

55
CHAPTER 4: LABORATORY TESTING OF UNSATURATED HYDRAULIC CONDUCTIVITY
Introduction The seven planned instantaneous profile experiments titled Test Nos. 1 through 7
were conducted at Arizona State University. Except for two of the samples, samples
from each experiment were stored in a controlled environment using an isolation or
environmental chamber located in the basement of ISTB2 at ASU. The temperature of
the environmental chamber was maintained at 4 o C plus or minus 2 o C. For the first 175
days of run time, experiments TN1 and TN2 were stored in a lab area which has an
approximate temperature of 25 o C. Effort was taken to ensure the samples encountered
minimal disturbance by not moving the samples and keeping the surrounding
environment at a constant temperature.
The soil conditions for each instantaneous profile experiment was keep the same.
All samples were compacted at a density of 98% of the maximum density using Method
A of a standard proctor test. This was done to eliminate any effects to hydraulic
conductivity related to mass volume changes. The properties of the soil used in this study
are presented in Chapter 3.
This chapter presents the results of each instantaneous profile experiment. For
each experiment the set- up conditions and procedures, apparatus type, sampling
procedures, observations and results are discussed. Each experiment was conducted
according to the methods described for each experiment in Chapter 3. The computations
for determining the unsaturated hydraulic conductivity are presented in this chapter along
with the method for measuring the soil matric suction. Water content samples were
taken according the ASTM D2216-98 the “Standard Test Method for Laboratory
Determination of Water Content of Soil and Rock by Mass”.

56
Computations for the Instantaneous Profile Experiment The apparatus of the instantaneous profile method is a cylindrical tube with a
standard length and diameter. Soil is compacted into the apparatus in sections of
different water contents. Each section with different water contents creates differences in
the pore water pressure or suctions which drive the water flow.
For this experiment, to calculate the unsaturated hydraulic conductivity, the water
content and matric suction at points along the profile of the test tube must be measured.
The parameters needed to calculate the unsaturated hydraulic conductivity are the
volumetric water content and matric suction between two points at two times, the
distance between the two points, and the time interval in which two water content and
suction measurements were obtained. The matric suction could be calculated from the
water content measurements by interpolation from a SWCC curve, but it is more accurate
to use indirect measurements such as from a filter paper tests. In order to increase the
accuracy of the results it is best to take numerous measurements of the water content and
suction over various time periods and at various locations along the tube. This increases
the number of data points and allows for more conductivity points to be calculated.
In this report, the positions or locations for which sampling occurs are denoted as
positions, P#. A sampling event is when water content and matric suction samples were
taken and measured. One sampling event occurred at each location at a given time
period. Each position, such as the example P6 shown in Figure 4.1, is the approximate
distance in inches from the dry end of the tube apparatus.

a
T
pl
in
su
w
hy
su
ca
ch
ea
Data fr
plot of the vo
This plot is the
lot was used t
ntervals. The
ufficient time
water content.
ydraulic cond
The un
uction. Becau
alculated at d
hange in sucti
ach section of
Figure
from the instan
olumetric wat
e Volumetric
to calculate th
plot shown b
period, the w
The time per
ductivity.
Figure
nsaturated coe
use of this, th
ifferent sectio
ion. Also, to
f the tube is c
e 4.1: Examp
ntaneous prof
ter content ve
Water Conten
he flow of wa
below is typic
water contents
riod for which
e 4.2: Volum
efficient of pe
he unsaturated
ons of water c
gain points a
carefully cons
57
ple of Position
file test was p
ersus the dista
nt Profile and
ater between s
cal for an insta
s of each secti
h this occurs
metric Water C
ermeability va
d hydraulic co
content and ti
at different su
sidered before
n Location, P
plotted for dif
ance from the
d is presented
sampling loca
antaneous pro
ion should eq
is a function
Content Profil
aries with wa
onductivity, K
ime periods to
uction values,
ehand to get a
P6.
fferent time in
dry end of th
d in Figure 4.2
ations at diffe
ofile test. Aft
quilibrate to th
of the soil un
le.
ater content an
Kunsat must b
o allow for an
the water con
a good range o
ntervals on
he tube.
2. This
erent time
fter a
he same
nsaturated
nd
be
n adequate
ntent of
of suction

va
ex
(F
fi
co
fo
ex
tim
so
sa
su
alues from th
xperiment are
Fredlund and
igure are for a
onductivity to
In the
or a simple on
xample presen
me intervals a
oil profile. Fi
ampling even
uction measur
e experiment
e present in a
Rahardjo, 19
a clay. As sho
o decrease wit
Figure 4.3:
following, an
ne dimensiona
nts the equati
and suction v
igure 4.4 belo
nts. The samp
red for each p
. Typical res
plot of Kunsa
993). The un
own, the data
th increases i
Typical Insta(Hamil
n example cal
al example be
ions used to c
values by repe
ow presents th
pling event inc
point location
58
ults from a la
at versus suct
saturated hyd
a indicate a tre
n suction.
antaneous Prolton et al. 198
culation show
etween two po
calculate mult
eating the pro
he set-up of th
cludes an init
n.
aboratory inst
tion as shown
draulic condu
end for unsatu
ofile Results f81)
ws the steps fo
oints over on
tiple values o
cess over var
his two point
tial and final w
tantaneous pro
n in Figure 4.3
ctivities show
urated hydrau
for Clay.
for determinin
ne time interva
f Kunsat at di
rious points al
example usin
water content
ofile
3
wn in this
ulic
ng Kunsat
al. This
ifferent
long the
ng two
t and

w
us
4
The pa
water contents
sing Eqn 4.1
The av
.2.
Fig
: Initia: Initia: Final : Final : Initia: Initia: Final : Final
: Initial t: Final ti
P1: PositioP2: Positio
arameters sho
are gravimet
below.
: Volum: Gravim
RC: Relati: M
: Unit w
verage hydrau
gure 4.4: Tw
al water conteal water conte
water contenwater conten
al matric suctial matric sucti
matric suctiomatric suctio
time me
on at some dison at some dis
own in Figure
tric, they mus
metric water cmetric water coive CompactioMaximum dry
weight of wate
ulic gradient,
59
wo Point Samp
nt at P1 at timnt at P2 at tim
nt at P1 at timnt at P2 at timion at P1 at timion at P2 at timon at P1 at timon at P2 at tim
stance from dstance form d
4.4 above ar
st be converte
ontent ontent on y density fromer
, between tw
pling Event.
me= me=
me= me=
me= me=
me= me=
dry end of the dry end of the
re used in calc
ed to volumetr
m proctor com
wo points is ca
tube tube
culating Kuns
ric water cont
(Eqn.
mpaction test
alculated usin
sat. If the
tents
4.1)
ng Eqn.

av
va
va
de
When
verage hydrau
alues for each
alues between
etermined. T
The un
: Diffe: Distan
: Matric: Matric: Unit w
calculating th
ulic gradient s
h point. The p
n two points a
The calculation
nsaturated hyd
: Chan: Volum
: Cross-s: Change
: Aver
erence in heignce between th
2 1c suction at P1c suction at P2
weight of wate
he hydraulic g
should be cal
plot presented
and how the s
n using the av
Figure 4.5
draulic condu
nge in the volume of water thectional are oe in time age hydraulic
60
ght of water bhe two points
1 [kPa] 2 [kPa] er (9.81kN/m2
gradient for th
culated using
d in Figure 4.
suction values
verage suction
5: Suction Pr
uctivity is calc
ume of waterhat flowed betof tube
c gradient
between two ps
2)
he instantaneo
g the average
.5 shows an e
s used in the g
n values is sh
rofile.
culated using
r between the tween the two
(Eqn.
points
ous profile te
of the two su
example of the
gradient calcu
hown in Eqn.
(Eqn.
g Eqn. 4.4.
(Eqn.
two points o points
4.2)
est, the
uction
e suction
ulation are
4.3.
4.3)
4.4)

kn
th
ov
be
be
eq
th
co
co
The vo
nown as
he volumetric
ver the time p
The ar
etween the tw
elow shows h
quations Eqns
he curves and
ontents used f
ontents.
olume of wate
. This is calc
water conten
period. This a
Figure 4.6:
rea between th
wo points is ca
how the areas
s. 4.5, 4.6, 4.7
the change in
for determinin
er that flows b
culated by det
nt profile. Th
area is presen
: Volumetric
he two curves
alculated usin
under the cur
7, 4.8 and 4.9
n volume of w
ng the flow m
61
between the t
termining the
his area repres
nted in Figure
Water Conte
s for determin
ng a triangulat
rves are calcu
9 shows the st
water between
must first be c
two points du
area between
sents the volu
e 4.6 below.
ent Profile and
ning the volum
ation method.
ulated during
teps used to c
n the two poin
converted to v
uring the time
n the two curv
ume of water t
d .
me of water th
Figure 4.7, p
both time per
alculate the a
nts. The wate
volumetric wa
interval is
ves from
that flows
hat flowed
presented
riods. The
area under
er
ater

un
T
in
Once t
nsaturated hy
This computat
nstantaneous p
Figure
2
2
2 1
2 1
Note: Wate
the change in
ydraulic condu
ion is used to
profile experi
e 4.7: Volum
[m3]
1
1
er contents re
volume of w
uctivity can b
o determine th
iments. The d
62
me of Water C
2 1
2 1
epresented by
water and hydr
be calculated u
he unsaturated
data for each
alculation Plo
y are volum
raulic gradien
using Eqn. 4.
d hydraulic co
test is tabulat
ot.
(Eqn.
(Eqn.
(Eqn.
(Eqn.
(Eqn.
metric water co
nt are calculat
10.
(Eqn.
onductivity fo
ted in a sprea
4.5)
4.6)
4.7)
4.8)
4.9)
ontents.
ted, the
4.10)
or each
adsheet

63
and this simple 1-D approach is used for different locations within each sample to gain
numerous conductivity values from one sampling event.
Matric Suction Measurements The matric suction was measured with filter paper tests for the instantaneous
profile experiments performed, except for Test No. 6. Filter paper tests are used to
measure the matric suction because filter paper measurements have been found to be
fairly reliable and cover the full suction range of interest expected for this soil (Houston,
Houston and Wagner, 1994). In this study, Whatman’s No. 42 filter paper was used. The
filter paper tests were conducted in accordance to ASTM D5298-03, “Standard Test
Method for Measurement of Soil Potential (Suction) Using Filter Paper” and the journal
article titled “Laboratory Filter Paper Suction Measurements” by S.L. Houston, W.N.
Houston, and AM. Wagner (1994).
Filter paper tests for measuring soil suction must be conducted carefully to obtain
accurate results. The method for determining the matric suction using filter paper
consists of placing a small piece of filter paper in direct contact with the soil. It is
important that the specimens with filter paper tests be placed in a temperature controlled
environment. The filter paper is allowed time to equilibrate to the soil water content and
the filter paper water content is then related to the soil matric suction. The relationship
between the filter paper water content and the soil matric suction is specific to the type of
filter paper used. Since Whatman’s No. 42 filter paper was used, the following
relationship was used as presented below. This calibration curve for the filter paper
water content and the soil matric suction was taken from the article by R.J Chandler and
C.I. Gutierrez titled “The Filter-Paper Method of Suction Measurement”.

64
5.850 0.0622 (Eqn. 4.11) 10 (Eqn. 4.12) : Soil matric suction in pF. : Soil matric suction in kPa. : Filter paper water content. : Unit weight of water. The procedure for the filter paper tests followed the guidelines outlined in the
previously stated article titled “Laboratory Filter Paper Suction Measurements”. In this
article, specific steps in the contact methods are outlined to gain quality results. The
procedure for performing filter paper tests were all conducted in the same manner
following this procedure.
Prior to placing the filter paper in the soil, the filter paper pieces were dried for
24 hours at 110 o C in an oven. Whenever handling the filter paper, latex gloves were
worn to ensure that the filter paper remained clean. After drying, the filter paper was cut
into pieces. The total amount of filter paper introduced into the soil should be small to
minimize system compliance (Houston, Houston and Wagner, 1994). The area of soil
where the filter paper was placed was scarified to gain good contact between the soil and
the filter paper. To ensure intimate contact between the filter paper and the soil, the filter
paper piece was sandwiched between two other pieces of filter paper so that no soil will
come in contact with the dried filter paper piece. The filter paper sandwich is then buried
and the soil above is then compacted to specifications. The filter paper is allowed to
equilibrate with the surrounding soil for a minimum of 7 days.
When the filter paper was to be removed and measured, the soil around the filter
paper sandwich was removed. Again, latex gloves were worn to prevent any unwanted
particles from contaminating the clean filter paper piece. The filter paper sandwich is
carefully removed from the soil and then the sandwich is unwrapped and the clean piece

of
fi
te
pa
m
of
co
T
do
va
al
te
ac
5c
f filter paper
ilter paper is w
emperature of
aper are dry,
mass of the filt
f the soil at th
Decag
ontent over ti
The volumetric
omain reflect
ariation of the
llow accurate
exture and ele
cquisition uni
cm radius of
is immediatel
weighted and
f 110 o C to co
the dry weigh
ter paper the c
he time the fil
E
gon Volumetri
me for variou
c probes used
tometry (TDR
e soil (Decago
measuremen
ectrical condu
it that records
influence.
Figure 4
ly placed in a
the piece of f
ompletely dry
ht of the filter
correlation ab
lter paper was
Ec-5 Volume
ic moisture pr
us experiment
d are the Deca
R) sensors but
on). The Ec-
nt of all types
uctivity (Deca
s the volumetr
4.8: Volumetr
65
a pre-weighted
filter paper is
y. After 24 ho
r paper piece
bove can be u
s removed.
etric Moistur
robes were us
ts. This senso
agon Model E
t are based on
5 probes mea
of soil and ar
agon). The pr
ric water cont
ric Moisture P
d plastic bag.
s placed in an
ours and once
is recorded. W
used to determ
re Probes
sed to track an
or is shown if
Ec-5. The pro
n measuring t
asure at a very
re much less s
robes are conn
tent over time
Probe (Decag
The bag wit
oven maintai
e the piece of
With the wet
mine the matri
nd record the
f Figure 4.8 b
obes are not a
the dielectric
y high freque
sensitive to v
nected to a da
e. The probe
gon).
th the
ined at a
f filter
and dry
ic suction
e water
below.
a time
constant
ncy to
variation in
ata
s have a

se
im
fi
re
T
ra
di
de
eq
st
sh
vo
re
These
ensor to the v
mplemented in
irst calibrated
elationship be
This was done
anging from 7
ifferent water
ensity based o
quilibrate for
tabilized. A p
hown in Figur
With t
oltage of the
espective soil
sensors inclu
volumetric wa
n the data tha
d using the soi
etween the sen
by compactin
7.5% to 23.5%
r contents. Th
on a Method A
24 hours and
photo of the v
re 4.9 below.
Figu
the data acqui
sensor was pl
sample. The
uded a general
ater content of
at is download
il used in the
nor output an
ng soil in stan
%. Four senso
he soil was co
A standard pr
d within this ti
volumetric pro
ure 4.9: Volu
ired from the
lotted against
e data was plo
66
l calibration t
f the soil. Th
ded from the
study to gain
d the actual g
ndard proctor
ors were plac
ompacted to a
roctor test. T
ime period th
obes placed in
umetric Probe
calibration of
t the gravimet
otted with a re
to relate the v
his calibration
acquisition un
n a more accur
gravimetric w
r molds at diff
ed in soil sam
a density of 9
The samples w
he volumetric
n the proctor
e Calibration.
f the volumet
tric water con
easonable cor
voltage output
n is automatic
nit. The sens
rate calibratio
water content o
fferent water c
mples prepare
8% of the ma
were allowed
sensor readin
mold for cali
tric probes, th
ntent for each
rrelation and t
t of the
ally
sors were
on and
of the soil.
contents
ed at
aximum
to
ng
ibration is
he output
the trend
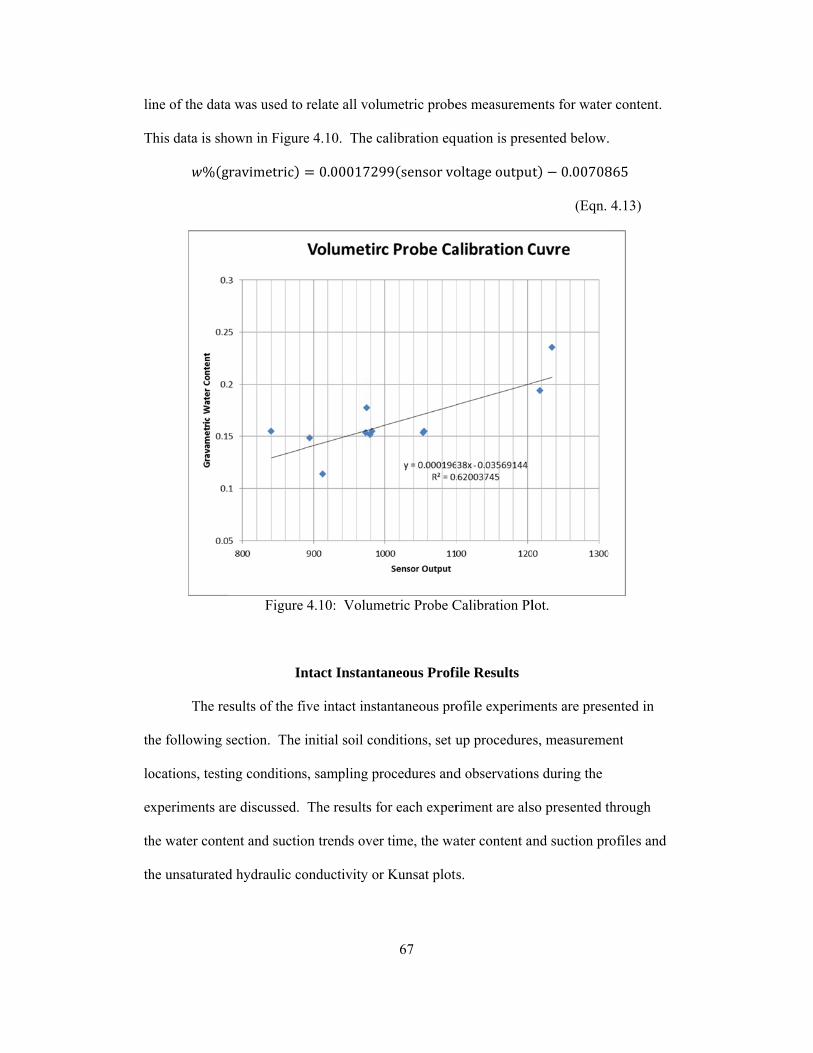
lin
T
th
lo
ex
th
th
ne of the data
This data is sh
% g
The re
he following s
ocations, testi
xperiments ar
he water conte
he unsaturated
a was used to
own in Figure
gravimetric
Figure
In
esults of the fi
section. The
ng conditions
re discussed.
ent and suctio
d hydraulic co
relate all volu
e 4.10. The c
0.0001729
4.10: Volum
ntact Instant
ive intact inst
initial soil co
s, sampling pr
The results f
on trends over
onductivity or
67
umetric probe
calibration equ
99 sensorvo
metric Probe C
taneous Profi
tantaneous pro
nditions, set u
rocedures and
for each exper
r time, the wa
r Kunsat plots
es measureme
quation is pres
oltageoutput
Calibration Pl
file Results
ofile experim
up procedure
d observation
riment are als
ater content an
s.
ents for water
sented below.
t 0.00708
(Eqn.
lot.
ments are prese
s, measureme
ns during the
so presented t
and suction pr
r content.
.
865
4.13)
ented in
ent
through
rofiles and

68
Test Number 1: The instantaneous profile experiment Test Number 1 (TN1) was started on
October 20, 2009. This experiment consisted of four different soil sections, each at
different water contents. Each section was of equal volume and consisted of soil
compacted to the same dry unit weight. The water content and matric suction were
measured periodically as the moisture flows from the wet to dry sections of soil. With
measurements of the soil water content and matric suction, the unsaturated hydraulic
conductivity was calculated.
The apparatus used for TN1 was a 36 inch long, 3 inch inside diameter clear
cylindrical Plexiglas tube. The tube was prepared with two rows of access holes evenly
spaced along the longitudinal axis of the tube. These holes provided access to the soil
and were where the filter paper samples were replaced and where water content samples
were obtained. The access holes were spaced approximately 3 inches apart. Soil was
prepared at approximately 11%, 12.5%, 14.5%, and 21% water contents and was placed
and compacted in the tubes. The soil was allowed to equilibrate for 24 hours prior to
being compacted into the apparatus and checked to ensure that the water content was as
close to the desired water content as possible. The water content used for the soil
sections was chosen in order to cover a wide range of suction and to drive moisture flow.
The initial soil conditions and the apparatus dimensions are shown in Figure 4.11 below,
which presents the actual locations of the sampling locations for this apparatus. The
sampling locations where chosen to be as close to the middle of each soil section as
possible.

in
ta
dr
in
w
in
Figure
Table
ncluding relev
aken from wa
riest section a
nterpolated fro
where determin
nitial suction v
Desired wRelative CDry DensActual w%Actual w%SaturationMatric SuActual MVoid Rati
e 4.11: Test N
4.1 below pre
vant soil prop
ter content m
and section 4
om the SWCC
ned from filte
values.
Table 4.1
Sectionw% (grav)Compaction %sity (pcf)% (grav)% (vol)n %uction (kPa)*atric Suction io
No. 1 Initial S
esents the init
perties. . The
measurements
is the wettest
C curve for th
er paper tests
1: Test Nos. * Calcula
%
1150
(kPa)
69
Soil Condition
tial testing co
initial conditi
during the sa
t section. The
he soil. The a
7 days after s
1 and 2 Initiaated from SW1 2
0.110.98
106.51.00% 128.77% 20.40% 57147001940
0.594
ns and Sampl
onditions of th
ions reported
ample creation
e suction valu
actual matric
sample creati
al Soil ConditWCC. 2 30.1250.98
106.52.50% 141.33% 247.27% 6
6900754
0.594
ling Location
he soil for TN
d in Table 4.1
n. Section 1 i
ues reported a
suction meas
on and are us
tions.
3 40.1450.98
106.54.50% 214.75% 356.43% 96
2640214
0.594
ns.
N1,
were
is the
are
urements
sed as the
40.210.98
106.51.00%5.84%6.21%
603.5
0.594

70
The soil was compacted in the apparatus tubes in 1.5 inch lifts. This was done to
keep the dry unit weight of the soil consistent through the profile. To ensure uniform
density, for each 1.5 inch lift the amount of soil required to occupy the volume at the
required dry unit weight was weighted out beforehand, and then compacted to the volume
of each lift. The dry soil section was compacted in the tubes first since the last lift was
difficult to make at the top of the tubes, so the wet sections was placed last since it is
easier to manipulate.
Volumetric moisture probes where installed in TN1 to track moisture flow. The
volumetric moisture probes where placed during compaction in each section of different
water content. Care was taken during compaction not to break the probes. The probes
were located in the center of the cross-section of the tube, pointing in the length direction
of the tube. The probes where placed in this manner to gain the most influence by the
surrounding soil. The probes have a 5cm radius of influence. The location of the
volumetric moisture probes is shown if Figure 4.11.
The soil was compacted in the sample tubes using a standard proctor hammer
which weighs 5.5 pounds and is dropped a distance of 12 inches. The amount of hammer
blows with a standard proctor hammer required to compact the soil into a 1.5 inch lift
decreased as the number of lifts increased. The plugs in the two rows of holes in the
apparatus tube where sealed and capped prior to compaction. Once the soil was
completely compacted in the apparatus, the end caps where sealed and fastened with
bolts. Figure 4.12 below shows the sample tubes with the dry section compacted in the
tubes.

sh
an
so
ev
so
an
fr
IS
After s
hown in Figur
nd then a filte
oil prepared to
vent. The bac
oil. Tape was
nd placement
rom TN1 at th
STB2 Geotech
Figur
sample compa
re 4.11. Sma
er paper sandw
o the same w
ckfilled soil w
s also placed
t of volumetri
he wettest sec
hnical laborat
re 4.12: Test
action, filter p
all holes wher
wich was pus
ater content o
was then caref
along the leng
ic moisture pr
ction or sectio
tory area.
71
No. 1 Compa
paper sandwi
re first created
shed into each
of that of each
fully compact
gth of the tub
robes. Figure
on 4. The com
acted Sample
ches were pla
d by ramming
h hole. The h
h section at th
ted to the den
be to denote e
e 4.13 below s
mpleted samp
e.
aced at the loc
g hollow tube
hole was back
he time of the
nsity of the su
each sampling
shows the sam
ples were store
cations
in the soil
kfilled with
e sampling
urrounding
g location
mple tube
ed in the

co
m
E
re
ac
sa
th
pa
pa
tw
re
gi
fo
in
The sa
ontainers and
measurements
Each soil secti
eplace the filt
ccess to the so
andwich. The
he inside of th
aper sandwich
aper piece ins
weezers, and p
ecorded. This
iven sampling
or 24 hours an
The to
ncreasing time
Fi
ample procedu
d bags were pr
. One sample
on has one ho
er paper samp
oil. A hollow
e hollow rod i
he hollow rod
hes are remov
side the filter
put in a sealed
s is done at ea
g event. Both
nd the dry we
otal run time f
er intervals be
igure 4.13: T
ure for TN1 w
re-weighted f
e of water con
ole that is use
ples. At each
w rod is driven
is extracted a
d is used as a w
ved from the
paper sandwi
d bag. The w
ach of the fou
h the water co
eights are reco
for TN1 was 2
etween sampl
72
Test No. 1 Sam
was performe
for the water c
ntent and suct
ed to gain wat
h sampling loc
n into the soil
and the soil th
water content
soil carefully
ich is remove
wet weight of
ur locations al
ontent and filt
orded.
255 days. Th
ling events. T
mple Tube.
d as follows.
content and fi
tion was taken
ter content sam
cation the cap
l to the depth
hat is pulled ou
t sample for th
y using needle
ed carefully u
the filter pap
long the lengt
ter paper sam
hirteen sampli
The experime
First, four sa
filter paper
n for each soi
mples and ret
p is removed
of the filter p
ut of the sam
hat location.
e nose pliers.
using latex glo
er piece is the
th of the tube
mples are put i
ing events occ
ent was ended
ample
il section.
trieve and
to provide
paper
mple from
The filter
The filter
oves and
en
for a
n an oven
curred at
d to

73
retrieve the volumetric moisture probes for use in another experiment. This experiment
used volumetric moisture probes to record water content and they were not used since
there was bad correlation between volumetric probe measurements and the measured
manual water contents. The date and run times of the sampling events for TN1 are
presented in Table 4.2 below.
Table 4.2: Test No. 1 Sampling Times and Dates.
The results of the water content and suction measurements from TN1 are
presented in the following. The data acquired during the sampling of TN1 was tabulated
into a spreadsheet and plots were made to analyze the trends of the water content and
suction. Figures 4.14 and 4.15 present the water content and suctions of the different soil
sections during the test. The test was ended on the 255th day of run time. The soil
sections within the profile did not reach equilibrium. This experiment was ended due to
inaccuracies in the testing procedures that influenced the measured water contents and
suction. During the test period enough change in water content occurred to calculate
hydraulic conductivity values.
Sample Number Run Time (days) Sample Date
0 10/20/20091 7 10/27/20092 14 11/3/20093 28 11/17/20094 42 12/1/20095 56 12/15/20096 70 12/29/20097 84 1/12/20098 112 2/9/20109 140 3/9/201010 168 4/6/201011 196 5/4/201012 225 6/1/201013 255 7/1/2010

th
hy
T
F
Figu
The m
he water conte
ydraulic cond
TN1. These co
igures 4.16 an
Figure 4.
ure 4.15: Test
measured data
ent and suctio
ductivity. Thi
orrected resul
nd 4.17 below
14: Test No.
t No. 1 Soil G
was averaged
on trends to re
is was done fo
lts of the wate
w. This corre
74
1 Matric Suc
Gravimetric W
d over the test
educe the scat
for both the w
er content and
cted data foll
ction versus T
Water Content
t period to ga
tter in the cal
water content a
d suction tren
lows the same
Time.
t versus Time
ain smother fu
lculation of th
and suction d
nds are presen
e trends as the
e.
unctions of
he
ata for
nted in
e

m
va
F
measured resu
alues over 20
igure 4.18.
F
lts. This data
0 day time per
Figure 4.16: T
Figure 4.17
a was used to
riods. The wa
Test No. 1 Co
7: Test No. 1
75
determine un
ater content p
orrected Wate
1 Corrected Su
nsaturated hyd
profile is prese
er Content ver
uction versus
draulic condu
ented in a plo
rsus Time.
s Time.
uctivity
ot in

be
th
ch
va
co
th
hy
ov
sh
T
re
co
The ca
elow. The co
his chapter ov
hosen to gain
arious points
onductivity v
he intervals is
ydraulic cond
ver a range of
hows that the
The data prese
epresentation
omputations o
Figure
alculated unsa
onductivity va
ver various int
multiple poin
of the soil pr
alues calculat
s presented in
ductivity valu
f suction from
unsaturated c
ented in Figur
of the unsatu
of the hydrau
e 4.18: Test N
aturated hydra
alues were cal
tervals within
nts at differen
ofile. Figure
ted over vario
Figure 4.19 a
ues obtained fr
m 400 to 2600
conductivity f
re 4.20 below
urated hydraul
lic conductiv
76
No. 1 Water C
aulic conduct
lculated using
n the soil prof
nt suction valu
4.19 below, p
ous positions
are also show
from TN1 rang
0 kPa. The w
for a soil can
presents the b
lic conductivi
ity over the lo
Content Profil
tivity values f
g the approac
file of TN1. V
ues which can
presents the u
and time inte
wn in Figure 4
ge over 2.5 o
wide range of d
vary greatly
best and mos
ity from TN1
ong time peri
le.
for TN1 are p
ch previously
Various interv
n be done alo
unsaturated hy
ervals. The lo
4.11. The uns
rders of magn
data and varia
for a given su
st accurate
. This plot pr
iods from 40 t
presented
stated in
vals are
ong
ydraulic
ocations of
saturated
nitude and
ability
uction.
resents the
to 60 days

an
un
F
nd presents be
nsaturated hy
Figure 4.19: T
est average tr
ydraulic condu
Test No. 1 Un
rend of the res
uctivity follow
nsaturated Hy
77
sults. This ca
ws a good ave
ydraulic Cond
an be seen in
erage trend of
ductivity Plot
Figure 4.20 a
f the data.
over Various
as the
s Intervals.

T
O
an
di
ha
pe
m
cy
th
an
Fig
Test Number 2
The in
October 20, 20
ny modificati
ifferent soil s
as the same d
eriodically as
measurements
The ap
ylindrical Ple
he sample tub
nd access to r
gure 4.20: Te
2:
nstantaneous p
009. This exp
ons to the exp
ections of dif
dry unit weigh
s the moisture
the unsaturat
pparatus used
xiglas tube. T
be. These hole
replace filter p
est No. 1 Uns
profile experi
periment was
periment wer
fferent water c
ht. The water
e flows from t
ted hydraulic
for TN2 was
The tube also
es provide ac
paper sample
78
aturated Hyd
ment Test Nu
considered a
e desired. Th
contents. Eac
r content and
the wet to dry
conductivity
s a 36 inch lon
o has two row
cess to the so
s. Soil was p
draulic Condu
umber 2 (TN2
duplicate of
his experimen
ch section is o
matric suctio
y sections of s
was calculate
ng, 3 inch inn
w of access ho
oil for water c
prepared at ap
uctivity Plot.
2) was started
Test Number
nt consists of
of equal volum
n were measu
soil. With the
ed.
ner diameter c
oles even spac
content measu
pproximately
d on
r 1 in case
four
me and
ured
e
clear
ced along
urements
11%,
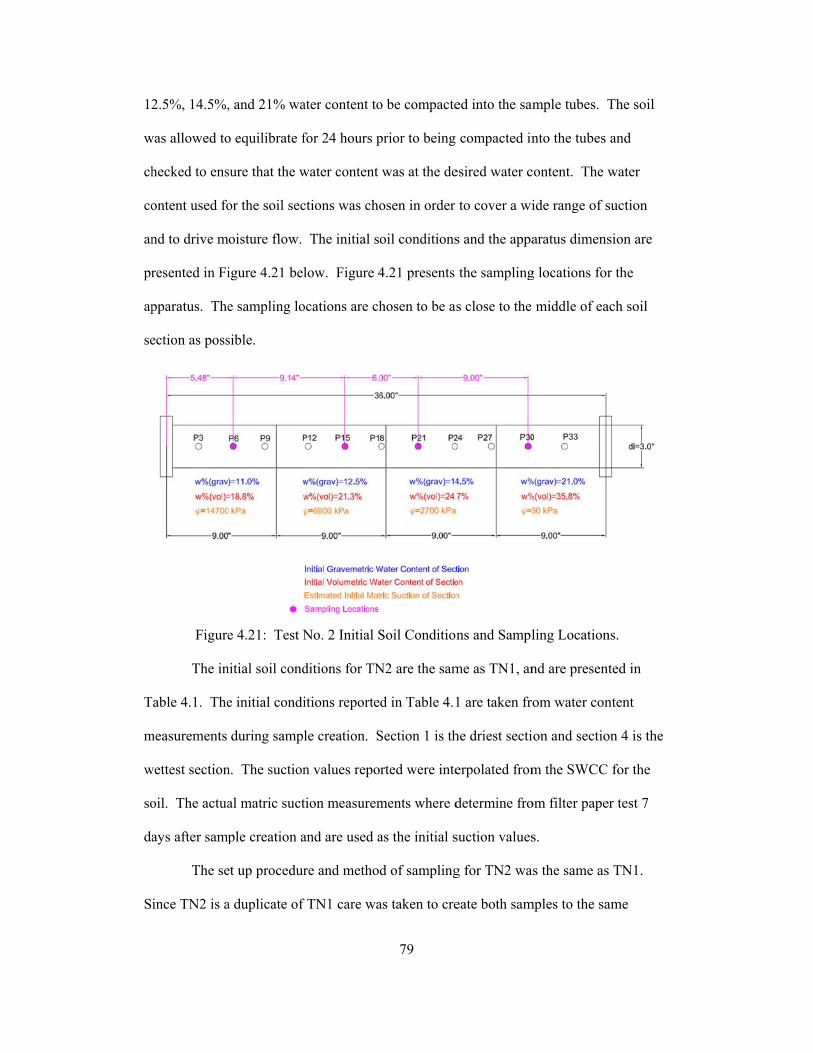
12
w
ch
co
an
pr
ap
se
T
m
w
so
da
S
2.5%, 14.5%,
was allowed to
hecked to ens
ontent used fo
nd to drive m
resented in Fi
pparatus. The
ection as poss
Figure
The in
Table 4.1. The
measurements
wettest section
oil. The actua
ays after samp
The se
ince TN2 is a
, and 21% wa
o equilibrate f
sure that the w
or the soil sec
moisture flow.
igure 4.21 bel
e sampling lo
sible.
e 4.21: Test N
nitial soil cond
e initial condi
during sampl
n. The suction
al matric suct
ple creation a
et up procedur
a duplicate of
ater content to
for 24 hours p
water content
ctions was cho
The initial so
low. Figure 4
ocations are ch
No. 2 Initial S
ditions for TN
itions reporte
le creation. S
n values repo
tion measurem
and are used a
re and method
f TN1 care wa
79
o be compacte
prior to being
was at the de
osen in order
oil conditions
4.21 presents
hosen to be as
Soil Condition
N2 are the sam
d in Table 4.1
Section 1 is th
rted were inte
ments where d
as the initial s
d of sampling
as taken to cre
ed into the sam
compacted in
esired water c
to cover a wi
s and the appa
the sampling
s close to the
ns and Sampl
me as TN1, an
1 are taken fro
he driest secti
erpolated from
determine fro
suction values
g for TN2 wa
eate both sam
mple tubes. T
nto the tubes
content. The w
ide range of s
aratus dimens
g locations for
middle of ea
ling Location
nd are present
om water con
ion and sectio
m the SWCC
om filter pape
s.
as the same as
mples to the sa
The soil
and
water
suction
sion are
r the
ach soil
ns.
ted in
ntent
on 4 is the
for the
er test 7
s TN1.
ame

80
specifications. The only difference between TN2 and TN1 is that TN2 does not have
volumetric moisture probes imbedded in the soil profile. The sample made for TN2 was
also stored and sampled the same as TN1. This experiment ran longer than TN1. The
sampling event dates and run times for TN2 are presented in Table 4.3 below.
Table 4.3: Test No. 2 Sampling Times and Dates.
The results of the water content and suction measurements for TN2 are presented
in the following. The data acquired during the testing of TN2 were tabulated into a
spreadsheet and plots were made to analyze the trends of the water content and suction.
Figures 4.22 and 4.23 present the water content and matric suction measurements over
time for the different sections during the test. The TN2 experiment ended on the 471st
day of runt time. The soil profile did not reach equilibrium. The experiment was ended
due to time constraints on testing. During the testing period, enough change in water
content occurred to calculate hydraulic conductivity values.
Sample Number Run Time (days) Sample Date
0 10/20/20091 7 10/27/20092 14 11/3/20093 28 11/17/20094 42 12/1/20095 56 12/15/20096 70 12/29/20097 84 1/12/20098 112 2/9/20109 140 3/9/201010 168 4/6/201011 196 5/4/201012 225 6/1/201013 255 7/1/201014 294 8/10/201015 322 9/7/201016 350 10/5/201017 426 12/20/201018 471 2/3/2011

w
bo
F
Figu
The m
with less scatte
oth the water
igures 4.24 an
Figure 4.
ure 4.23: Test
measured data
er in calculati
content and s
nd 4.25 below
22: Test No.
t No. 2 Soil G
was averaged
ing the unsatu
suction data f
w. The correc
81
2 Matric Suc
Gravimetric W
d over the test
urated hydrau
for TN2. The
cted data follo
ction versus T
Water Content
t period to ga
ulic conductiv
e corrected res
ows the same
Time.
t versus Time
ain smother fu
vity. This was
sults are prese
e trend as the m
e.
unctions
s done for
ented in
measured

re
20
esults. The da
0 day time pe
F
F
ata was used t
eriods. The w
Figure 4.24: T
Figure 4.25: T
to determine
water content p
Test No. 2 Co
Test No. 2 Co
82
unsaturated h
profile is pres
orrected Wate
orrected Matri
hydraulic con
sented in Figu
er Content ver
ic Suction ver
nductivity valu
ure 4.26.
rsus Time.
rsus Time.
ues over

be
th
to
un
in
F
of
co
gr
re
un
The ca
elow. The co
his chapter ov
o gain multipl
nsaturated hy
ntervals. The
igure 4.21. T
f magnitude o
onductivity v
reatly for a gi
epresentation
nsaturated hy
Figure
alculated unsa
onductivity va
ver various int
le conductivit
ydraulic condu
location of th
The range of c
over a range o
alues and larg
iven suction.
of the unsatu
ydraulic condu
e 4.26: Test N
aturated hydra
alues were cal
tervals within
ty values at di
uctivity value
he sampling i
conductivity v
of suction val
ge variability
The data pre
urated hydraul
uctivities ove
83
No. 2 Water C
aulic conduct
lculated using
n the soil prof
ifferent suctio
es calculated o
ntervals for th
values obtaine
ues from 200
show that the
esented in Fig
lic conductivi
r the long tim
Content Profil
tivity values f
g the approac
file for TN2.
ons. Figure 4
over various d
he Kunsat Plo
ed from TN2
0 to 2400 kPa
e unsaturated
gure 4.28 belo
ity for TN2.
me periods and
le.
for TN2 are p
ch previously
Various inter
4.27 below, pr
distances and
ots is presente
range over 2
. The wide ra
d conductivity
ow presents th
This plot pre
d present. Th
presented
stated in
rvals used
resents the
d time
ed in
.3 orders
ange of
y can vary
he best
sents the
his can be

se
go
F
een in Figure
ood average t
Figure 4.27: T
Fig
4.28 showing
trend of the d
Test No. 2 Un
gure 4.28: Te
g that the uns
ata.
nsaturated Hy
est No. 2 Uns
84
aturated hydr
ydraulic Cond
aturated Hyd
raulic conduc
ductivity Plot
draulic Condu
tivity values
over Various
uctivity Plot.
follow a
s Intervals.

T
st
ex
an
di
cy
co
ho
co
se
5,
ap
cr
sh
su
Test Number 3
The in
tarted on Mar
xperiment is c
nd 2. The rat
iscussed in C
The ap
ylindrical Ple
ontent to be c
ours prior to b
ontent was as
ection was ch
,090kPa to 75
pproximately
reate significa
hows the testi
uction.
3:
nstantaneous p
rch 6, 2010. A
configured an
tiocination be
hapter 5.
pparatus used
xiglas tube. S
compacted int
being compac
s close to the d
hosen in order
50kPa for eac
5000. A hig
ant changes in
ing apparatus
Figure
profile experi
As stated in th
nd designed a
hind the chan
for TN3 is a
Soil was prep
to the sample
cted into the t
desired water
r to provide a
ch section. Th
gh hydraulic g
n water conte
dimensions a
e 4.29: Test N
85
ment identifie
he experimen
round observ
nges in metho
9 inch long, 2
pared at appro
tube. The so
tubes and che
r content. The
good range o
his provided a
gradient was d
ent over the te
along with the
No. 3 Initial S
ed as Test Nu
ntal design sec
vations and iss
odology of TN
2.75 inch inn
oximately 9%
oil was allowe
ecked to ensur
e water conte
of suction dur
a hydraulic gr
desired to driv
esting period.
e initial water
Soil Condition
umber 3 (TN3
ction in Chap
sues with Tes
N3 to TN1 an
ner diameter c
% and 14.5% w
ed to equilibra
re that the wa
ent used for th
ring the test w
radient of
ve moisture fl
Figure 4.29
r content and
ns.
3) was
pter 3, this
st No. 1
nd TN2 is
clear
water
ate for 24
ater
he two soil
which was
flow and
below,
soil

86
The table below titled Table 4.4, presents the initial soil conditions and other
relevant soil properties for TN3. The initial conditions reported in Table 4.4 were taken
from water content measurements during the sample creation. Section 1 is the dry
section and section 2 is the wet section. The suction values reported was interpolated
from the SWCC curve for the soil.
Table 4.4: Test No. 3 Initial Soil Conditions.
The soil is compacted in the apparatus tubes in 1.5 inch lifts. This is done to
keep the density of the soil consistent through the profile. To ensure uniform density, for
each 1.5 inch lift the amount of soil required to occupy the volume at the required dry
density was weighted out beforehand. In between each lift the soil was scarified to
ensure good contact and continuity between lifts. The dry soil section was compacted
first since the last lift is difficult to make at the top of the tubes. The wet sections is
placed last since it is easier to manipulate. The soil was compacted in the sample tubes
using a standard proctor hammer. The amount of hammer blows with a standard proctor
hammer required to compact the soil into the 1.5 inch lift decreased as the number of lifts
increased. To help with the compaction process marks were put on the sample tubes and
1.5 inch spacing to help with the compaction process. Figure 4.30 below shows the
sample tubes with the dry soil section compacted in the tubes.
Section 1 2
Desired w% (grav) 0.09 0.145Relative Compaction % 0.98 0.98Dry Density (pcf) 106.5 106.5Actual w% (grav) 8.74% 13.54%Actual w% (vol) 14.92% 23.11%Saturation % 40.04% 62.03%Matric Suction (kPa) 5090 750Void Ratio 0.594 0.594

pa
lo
m
th
fi
se
F
fr
F
For thi
aper sandwich
ocated at 1.5 i
measurements
he filter paper
The so
irst a layer of
ealed to the tu
igure 4.32 be
rom visual ob
Figure 4.30:
is experiment
h is located in
inches from th
through the p
r sandwiches
Figure 4.31
oil samples w
wax paper an
ubes with duc
low. All the
bservation.
Sample Set-u
t, the matric s
n the middle o
he end of the
profile of the
in the sample
: Test No. 3
ere completel
nd then cover
ct tape. A pho
sample speci
87
up and Comp
suction is mea
of the soil pro
samples. Th
tube. Figure
e tube.
Filter Paper S
ly compacted
ed with plasti
oto of a comp
mens created
paction of Dry
asured at thre
ofile and one
hese locations
4.31 below,
Sandwich Loc
d and then sea
ic Saran warp
pleted sample
d for TN3 wer
y Section.
e locations. O
filter paper sa
provide suct
shows the loc
cations.
aled at each en
p. The plastic
for TN3 is sh
re completed
One filter
andwich is
ion
cations of
nd using
c warp was
hown in
as desired

F
an
ex
th
4
co
sa
lo
fi
se
pa
T
an
se
The sa
irst, sample c
nd recorded.
xperiment is r
he ends is rem
.33 below. T
ompression o
ample is caref
The sa
ocations wher
ilter paper san
ealed bag. Th
aper piece be
TN3. The filte
nd water cont
eparated at ea
Figure 4.3
ampling proce
containers and
Ten water co
retrieved from
moved. The sa
he sample is
f the wet soil
fully broken a
ampling proce
re filter paper
ndwich is rem
he wet weight
ing removed
er paper piece
tent samples a
ach lift interfa
32: Test No. 3
edure for TN3
d bags for wat
ontent sample
m the environ
ample is then
extruded by p
section. The
at the interfac
ess starts from
sandwiches a
moved carefull
of the filter p
from the soil
es are all remo
are taken. To
ace as depicte
88
3 Finished Co
3 is performed
ter content an
es are taken. A
mental chamb
n extruded usi
pushing from
e soil is extrud
ce between lif
m the dry end.
are located. T
ly using latex
paper piece is
is presented
oved the soil
o measure the
d in Figure 4
ompacted Sam
d as described
nd filter paper
A sample spe
ber and the pl
ing the extrud
the dry sectio
ded from the
fts.
. The lifts are
The filter pap
x gloves and t
s recorded. A
in Figure 4.3
and the soil p
water conten
.31. Each P#
mples.
d in the follow
r samples are
ecimen from t
lastic and wa
der shown in F
on to prevent
sample tube
e broken apar
per piece insid
tweezers, and
A photo of the
4 for a sampl
profile is divid
nt, the soil plu
# represents a
wing.
weighted
the
ax paper on
Figure
t excessive
and the
rt at the
de the
d put in a
filter
le from
ded up
ug is
location

al
ea
w
ar
long the soil p
ach end piece
within the soil
re put in an ov
Fi
profile startin
e (P1 and P6),
profile (P2 th
ven for 24 ho
Figu
gure 4.34: O
ng from the dr
, and two wat
hrough P5). B
ours and the d
ure 4.33: Test
Obtaining Filte
89
ry end. One w
ter content sam
Both the wate
dry weights ar
t No. 3 Extru
er Paper Sand
water content
mples are tak
er content and
re recorded.
ding Process.
dwich from So
t sample is tak
ken for each p
d filter paper
.
oil Sample.
ken at
piece
samples

in
ru
fo
sp
ob
th
pr
in
su
The to
ncreasing time
un time for ea
ollowing a ph
pecimen on th
bservation the
hat the sample
Tab
Figu
The re
resented in th
nto a spreadsh
uction. Figur
otal run time f
e intervals be
ach sample sp
hoto of the sam
he 305th day o
e soil sections
e has not yet r
ble 4.5: Test N
ure 4.35: Tes
esults of the w
he following.
heet and plots
re 4.36 and 4.3
Sample
for TN3 is 305
etween sampli
pecimen for T
mple on the 3
of run time is
s appeared to
reached equil
No. 3 Sample
st No. 3 Extru
water content
The data acq
s were made t
37 show that
e Number Sa
12354
90
5 days. Five
ing events. T
TN3 is present
05th day of ru
presented in
have signific
librium.
e Run Time an
uded Sample o
and suction m
quired during
o analyze the
the water con
ample Date
3/31/20104/26/20105/20/20108/3/20101/4/2011
sampling eve
The sample nu
ted in Table 4
un time is sho
Figure 4.35.
cantly differen
nd Sampling
on Day 305 o
measurements
the sampling
e trends of the
ntent and suct
Run Time
13
ents occurred
umber, sampl
4.5 below. In
own. The sam
From visual
nt color, sugg
Event Dates.
of Run Time.
s from TN3 ar
g of TN3 was
e water conten
tion of the tw
2551755005
at
e date and
n the
mple
gesting
re
tabulated
nt and
wo soil

se
ch
ections did no
hange in wate
ot reached com
er content occ
Figure 4
Figure 4
mplete equilib
curred to calcu
4.36: Test N
4.37: Test No
91
brium in 305
ulate hydraul
o. 3 Matric S
o. 3 Water Co
days. During
lic conductivi
uction vs. Tim
ontent over Ti
g this period e
ity.
me.
ime.
enough

th
tim
an
ca
ch
ha
su
From t
he results from
me for this sa
nd the surroun
alculation of h
hanges in wat
as flowed fro
uction profile
the water con
m the samplin
ample did not
nding environ
hydraulic con
ter content ha
m the wet sec
as well in Fi
Figure 4
ntent profile p
ng event on th
t allow for the
nmental cond
nductivity val
ave occurred d
ction to the dr
gure 4.39.
.38: Test No
92
presented in F
he 25th day co
e sample to eq
ditions. This s
lues for this ex
during the tes
ry section. Th
. 3 Soil Wate
Figure 4.38 be
ould not be us
quilibrate to i
sampling even
xperiment. T
sting period w
his can also b
er Content Pro
elow it was no
sed. The amo
is moisture co
nt is omitted
The plot show
which means t
be observed in
ofile.
oted that
ount of run
onditions
from the
ws that
that water
n the

be
th
ch
va
th
pr
F
of
ra
gr
The ca
elow. The co
his chapter ov
hosen to gain
alues which c
he unsaturated
resented. The
igure 4.41. T
f magnitude a
ange of data a
reatly for a gi
Figur
alculated unsa
onductivity va
ver various int
multiple valu
can be done a
d hydraulic co
e locations of
The range of c
and over a ran
and large vari
iven suction.
re 4.39: Test
aturated hydra
alues were cal
tervals with th
ues of unsatur
long various p
onductivity va
f the intervals
conductivity v
nge of suction
ability shows
93
No. 3 Soil Su
aulic conduct
lculated using
he soil profile
rated hydraul
points of the
alues were ca
s presenting in
values obtaine
n values from
s that the unsa
uction Profile
tivity values f
g the approac
e of TN3. Va
lic conductivi
soil profile.
alculated over
n Figure 4.29
ed from TN3
m 1,000 to 6,00
aturated condu
e.
for TN3 are p
ch previously
arious interva
ity at differen
In Figure 4.4
r the various i
and are also
range over 3
00 kPa. The
ductivity can v
presented
stated in
als are
nt suction
0 below
intervals
shown in
.5 orders
wide
vary

T
te
th
A
Test Number 6
The in
est that is con
he intact cond
August 12, 201
FRefer
Figure 4.41
6 (Intact):
nstantaneous p
ducted in both
dition is identi
10. This expe
Figure 4.40: Tto Figure 4.4
1: Locations o
profile experi
h the intact an
ified as TN6I
eriment was d
94
Test No. 3 Ku41 for Locatio
of Kunsat Co
ment Test No
nd cracked co
. The experim
designed acco
unsat Plot. on Description
omputation In
o. 6 (TN6) is
onditions. Th
ment for TN6
ording to the c
n.
ntervals.
a vertical infi
he sample for
6I was started
configuration
iltration
TN6 for
d on
n and

95
methods explained in the experimental design section in Chapter 3. The experiment is
designed in order to simulate vertical infiltration.
The apparatus used for TN6I is a 9 inch long, 3 inch inner diameter clear
cylindrical Plexiglas tube. Soil was prepared at approximately 15.5% water content prior
to being compacted in the sample tube. The soil was allowed to equilibrate for 24 hours
prior to being compacted into the sample tube and checked to ensure that the water
content was at the desired water content. The initial soil properties for TN6I are shown
in Table 4.6 below.
Table 4.6: Test No. 6 I Initial Soil Conditions.
The soil is compacted in the test apparatus tubes in 1.5 inch lifts. This is done to
ensure uniform density. To ensure uniform density, each 1.5 inch lift had the amount of
soil required to occupy the volume at the required dry density was weighted out
beforehand. In between each lift the soil was scarified to ensure good contact and
continuity between soil lifts.
The Decagon Ec-5 volumetric moisture probes that were used in TN1 were also
used in TN6I to record and measure the volumetric water content over time. The
volumetric moisture probes were used to interpolate matric suction values from the soil
water characteristic curve for the soil. The volumetric moisture probes were installed
during the compaction of each layer where they are located. The volumetric moisture
probes are installed from the side to have better influence from the soil. When the
Section 1Desired w% (grav) 0.15Relative Compaction % 0.98Dry Density (pcf) 106.5Actual w% (grav) 15.50%Actual w% (vol) 26.45%Saturation % 71.01%Matric Suction (kPa) 350Void Ratio 0.594

m
in
in
sa
m
pr
moisture probe
n the 5cm rad
ncrease the ac
F
The vo
ample tubes.
moisture inside
robes are sho
F
es are position
ius of influen
ccuracy of the
igure 4.42: O
olumetric moi
At each slit w
e the sample a
wn in Figure
Figure 4.43: L
ned in the ori
nce of the prob
e measuremen
Orientation of
isture probes
where the sen
and prevent l
4.43.
Location of V
96
entation show
bes. The pos
nts obtain by t
f Vol. Moistur
were installe
nsors enter the
eakage. The
Vol. Moisture
wn in Figure 4
itioning of th
the sensors.
re Probe for T
ed through slit
e sample tube
locations of t
e Probes for T
4.42, there is
he probes was
Test No. 6.
ts cut in the s
e, tape is place
the volumetri
Test No. 6.
more soil
s chosen to
ides of the
ed to seal
ic moisture

m
sa
al
sa
an
ho
en
co
T
ex
ch
The sa
made smooth.
ample prior to
Figure
For thi
llowed to infi
ample tube to
ny evaporatio
ours to allow
nvironment.
ontent over ti
This is also use
xperiment is c
hamber is pre
ample was com
The top surf
o inundation i
e 4.44: Test N
is experiment
iltrate into the
o allow water
on. The samp
the soil and v
Since volume
me the sampl
eful in determ
completed. T
esented in Fig
mpletely com
face of the sam
is presented in
No. 6 I Comp
t water is pon
e soil. Anothe
to be ponded
ple was sealed
volumetric pr
etric moisture
le was monito
mining when t
The assembled
gure 4.45 belo
97
mpacted and th
mple tube wa
n Figure 4.44
pacted Sample
nded on the to
er clear Plexi
d. A plastic ba
d and stored in
robes equilibr
e probes were
ored to determ
the soil in the
d sample for T
ow.
he top of surf
s cleaned for
4 below.
e with Vol. Pr
op surface of t
glas tube was
ag was sealed
n the environm
rate to the soil
e used to recor
mine when the
e sample equil
TN6I stored i
face of the sam
gluing. The
robes Installe
the soil profil
s glued to the
d at the top to
nmental chamb
l and surroun
rd the volume
e sample equi
librates and th
in the environ
mples was
completed
ed.
le and
top of the
o prevent
ber for 24
nding
etric water
ilibrated.
he
nmental

ch
ex
fo
ch
eq
sa
w
m
th
do
de
Figure
The am
hange in wate
xperiment. T
or a 2-4% cha
hosen so that
quilibrate to t
ample was pla
was inundated
The ex
moisture probe
hroughout its
ownloaded an
escribed prev
e 4.45: Test N
mount of wate
er content tha
The amount of
ange in gravim
the sample w
the same wate
aced in the en
on August 12
xperiment for
es recorded th
run time. Th
nd then impor
viously for the
No. 6 I Compl
er that was ap
at would still a
f water added
metric water c
would change
er content. Th
nvironmental
2, 2010 and w
r TN6I ran for
he water conte
he water conte
rted into an E
e Ec-5 probes
98
leted Sample
pplied to the s
allow the sam
d to the sampl
content. The
in water cont
he sample wa
chamber and
was allowed to
r 2330 hours.
ent every 20 m
ent data stored
Excel spreadsh
s was used to
in Environm
sample is base
mple to be uns
e is 120 gram
small amoun
tent and over
as inundated 2
d allowed to e
o run until the
During this
minutes. The
d on the data
heet for analy
determine the
mental Chambe
ed on achievi
saturated thro
ms which wou
nt of water wa
time be able
24 hours after
quilibrate. T
e sample equ
period the vo
e test was mon
acquisition u
ysis. The calib
e gravimetric
er.
ing a small
ughout the
uld allow
as also
to
r the
he sample
uilibrated.
olumetric
nitored
unit was
bration
water

co
be
so
an
is
ontent of the
elow in Figur
The m
oil. The grav
nd the matric
s presented in
sample over t
re 4.46.
Figure
matric suction
imetric water
suction is int
Figure 4.47.
time. The plo
4.46: Test N
is determined
r content data
terpolated usi
99
ot of the wate
No .6 I Water C
d using the so
was converte
ng the SWCC
er content ove
Content Profi
oil water chara
ed to the volu
C. The soil su
er time is pres
file.
acteristic curv
umetric water
uction profile
sented
ve for the
r content
e for TN6I

T
dr
be
in
The am
This is shown
rop significan
The ca
elow. The co
n this chapter.
Figure
mount of wate
in Figure 4.4
ntly and then
Figu
alculated unsa
onductivity va
. The conduc
e 4.47: Test N
er ponded on
8 below. In t
declines at a
ure 4.48: Tes
aturated hydra
alues were cal
ctivity values
100
No. 6 I Soil S
top of the sam
the beginning
steady rate.
st No. 6 I Infil
aulic conduct
lculated using
were calculat
Suction Profil
mple was also
g of the experi
ltration Data.
tivity values f
g the approac
ted between t
le.
o recorded ov
iment the wat
for TN6I are p
ch previously
the two volum
ver time.
ter level
presented
described
metric

m
ob
to
T
st
un
co
cy
co
ho
moisture probe
btained from
o 330 kPa. Th
Figure 4.
Test Number 7
The in
tarted on Aug
nsaturated hy
onducted usin
The ap
ylindrical Ple
ontent for com
ours prior to b
es and over 10
TN6I range f
his data is pre
.49: Test No.
7:
nstantaneous p
gust 13, 2010.
ydraulic condu
ng the same m
pparatus used
xiglas tube. S
mpaction into
being compac
00 hour time
from 4.2*10^
esented in Fig
. 6 I Coefficie
profile experi
This experim
uctivity data w
methods and p
for TN7 is a
Soil was prep
o the sample tu
cted into the t
101
periods. The
-12 to 5.0*10
gure 4.49 belo
ents of Unsatu
ment identifie
ment was des
with points in
procedures as
9 inch long, 2
pared at appro
ubes. The so
tubes and che
e range of con
0^-12 m/s ove
ow.
urated Hydrau
ed as Test Nu
signed to supp
n a lower suct
described for
2.5 inch inner
oximately 12%
oil was allowe
ecked to ensur
nductivity val
er a suction fr
ulic Conducti
umber 7 (TN7
plement the in
tion range. T
r TN3.
r diameter cle
% and 18% w
ed to equilibra
re that the wa
lues
rom of 230
ivity.
7) was
ntact
N7 is
ear
water
ate for 24
ater

co
w
14
ap
in
an
ta
se
fi
ke
ontent was at
was chosen in
405kPa to 87
pproximately
nitial water co
F
The ta
nd other relev
aken from wa
ection and sec
ilter paper sam
The so
eep the dry de
the desired w
order to have
kPa for each
900. Figure
ontent and suc
Figure 4.50: T
able below titl
vant soil param
ter content m
ction 2 is the
mples taken 7
Table
oil is compact
ensity of the s
Desired Relative Dry DenActual wActual wSaturatioMatric SVoid Ra
water content.
e a good range
soil section.
4.50 below s
ction of the so
Test No. 7 Ini
led Table 4.7
meters. The i
measurements
wet section. T
7 days after sa
e 4.7: Test N
ted in the app
soil consisten
Sectionw% (grav)Compaction %
nsity (pcf)w% (grav)w% (vol)on %Suction (kPa)atio
102
The water c
e of suction fo
This provide
hows the test
oil.
itial Soil Con
presents the i
initial conditi
during the sa
The suction v
ample creation
o. 7 Initial So
aratus tubes i
nt through the
1
%
112054
0
content used f
for the experim
d a hydraulic
ting apparatus
nditions and A
initial testing
ions reported
ample creation
values reporte
n.
oil Conditions
in 1.5 inch lif
e soil profile.
20.12 00.98 0
106.5 10.89% 18.5.29% 31.6.47% 84.91405
0.594 0.
for the two so
ment which w
c gradient of
s dimensions
Apparatus.
conditions o
in Table 4.7
n. Section 1 i
ed were taken
s.
fts. This is do
To ensure un
0.180.9806.555%66%99%
87.594
oil section
was
and the
f the soil
were
is the dry
from
one to help
niform

de
re
sc
w
tu
co
bl
in
1
sa
fi
pa
m
fi
ensity, each 1
equired dry un
carified to ens
was compacted
ubes. The we
ompacted in t
lows required
ncreased. To
.5 inch spacin
ample tubes w
ilter paper san
Figure 4.5
For thi
aper sandwich
measurements
ilter paper san
1.5 inch lift ha
nit weight we
sure good con
d in the tubes
et section is pl
the sample tub
d to compact t
help with the
ng to help wit
with the dry se
ndwich.
1: Test No. 7
is experiment
h is located in
throughout th
ndwiches in th
ad the amoun
eighted out be
ntact and cont
first since th
laced last sinc
bes using a st
the soil into a
e compaction
th the compac
ection compa
7 Sample crea
t, the matric s
n between eac
he soil profile
he sample tub
103
nt of soil requi
eforehand. In
tinuity betwee
e last lift is di
ce it is easier
tandard procto
a 1.5 inch lift
process mark
ction process.
acted in the sa
ation and Plac
suction is mea
ch soil lift. T
e. Figure 4.52
be.
ired to occup
n between eac
en soil lifts.
ifficult to ma
to manipulate
or hammer. T
decreased as
ks were put on
Figure 4.51
ample tubes a
cement of Filt
asured at five
These location
2 below, show
y the volume
ch lift the soil
The dry soil s
ake at the top
e. The soil w
The amount o
the number o
n the sample
below shows
and the placem
ter Paper San
locations. O
ns provide suc
ws the locatio
e at the
is
section
of the
was
of hammer
of lifts
tubes at
s the
ment of a
ndwich.
One filter
ction
ons of the

la
se
4
ob
fo
fr
ex
sa
tim
ea
The so
ayer of wax p
ealed to the tu
.53 below. A
bservation.
The sa
or TN7 are ex
rom each soil
xperiments th
ampling for T
The to
mes presente
ach specimen
Figure 4.52
oil samples w
aper and then
ubes with tape
All the specim
Figure 4.5
ampling proce
xtruded, the fi
section. Thi
hat in coopera
TN7 was perfo
otal run time f
d in Table 4.8
n in TN7is pre
: Test No. 7
ere completel
n covered with
e. A photo of
mens created fo
53: Test No.
edure for TN7
ilter paper is r
s procedure r
ates the duplic
ormed as desc
for TN7 is 200
8 below. The
esented in Tab
104
Filter Paper S
ly compacted
h plastic Sara
f a completed
or TN7 were
7 Finished C
7 was perform
retrieved and
emains consi
cate method.
cribed in the s
0 days. Four
e sample num
ble 4.8. In th
Sandwich Loc
d and then sea
an warp. The
d sample for T
completed as
Compacted Sam
med the same
water conten
stent for all in
The process
section for TN
sampling eve
mber, sample d
he following F
cations.
aled at each en
plastic warp
TN7 is shown
s desired from
mple.
as TN3. The
nt samples we
nstantaneous
and method f
N3.
ents occurred
date and run t
Figure 4.54, a
nd using a
was then
n in Figure
m visual
e samples
ere taken
profile
for
d at the
time for
a photo of

th
of
su
pr
in
su
po
co
co
he sample on
f the test. Fro
uggesting that
Tabl
F
The re
resented in th
nto a spreadsh
uction data. F
oints in the so
omplete equil
ontent occurr
the 200th day
om visual obs
t the sample h
le 4.8: Test N
Figure 4.54: T
esults of the w
he following.
heet and plots
Figures 4.55 a
oil profile. Fi
librium in 200
ed to calculat
Sampl
of run time i
servation the s
has not reach
No. 7 Sample
TN7 Extrude
water content
The data acq
s were made t
and 4.56 show
igures 4.55 an
0 days. Durin
te hydraulic c
le Number Sa
1234
105
s shown to pr
soil sections h
equilibrium.
Run Times a
d Sample on
and suction m
quired during
o analyze the
w the water co
nd 4.56 show
ng this time p
conductivity v
ample Date R
10/2/201012/21/2010
2/4/20113/1/2011
resent the col
have significa
and Sampling
Day 200 of R
measurements
the sampling
e trends of the
ontent and su
the two soil
period, enough
values from.
Run Time (day
112
or of the soil
antly differen
Event Dates.
Run Time.
s from TN7 ar
g of TN7 was
e water conten
uction data ov
sections did n
h change in w
ys)
503075
200
at the end
nt color,
.
re
tabulated
nt and
ver time for
not reach
water

th
The w
his plot of the
Figure 4
Figure 4
water content p
water conten
4.55: Test No
4.56: Test No
profile for TN
nt over time a
106
o. 7 Matric Su
o. 7 Water Co
N7 is presente
and the soil w
uction over Ti
ontent over Ti
ed in Figure 4
ater content p
ime.
ime.
.57 below. P
profile, the wa
Presented
ater

co
ch
fr
4
ontent trends
hange in wate
rom the wet to
.58.
from TN7 are
er content occ
o dry soil sect
Figure 4
e good and pr
curred during
tions. The so
.57: Test No
107
reformed as d
the test perio
oil suction pro
. 7 Soil Wate
desired. It can
od which infe
ofile for TN7
er Content Pro
n be observed
rs that water
is presented i
ofile.
d that
flowed
in Figure

be
pr
in
su
lo
co
of
The ca
elow in Figur
reviously stat
ntervals chose
uction values
ocations are sh
onductivity v
f suction valu
Figur
alculated unsa
re 4.59. The c
ted in this cha
en allow for m
to be obtaine
hown in Figu
alues obtaine
ues from 250 t
re 4.58: Test
aturated hydra
conductivity v
apter over var
multiple unsat
ed. The locati
ure 4.50 and a
d from TN7 r
to 1,200 kPa.
108
No. 7 Soil Su
aulic conduct
values were c
rious intervals
turated hydrau
ions of the va
are the same a
range over 2.5
uction Profile
tivity values f
calculated usi
s in the soil p
ulic conductiv
arious interva
as TN3. The u
5 orders of m
e.
for TN7 are p
ing the approa
profile. The v
vity values at
als and positio
unsaturated h
magnitude ove
presented
ach
various
t different
on
hydraulic
er a range

in
lo
ex
th
th
The re
n the followin
ocations, testi
xperiments ar
hrough the wa
he unsaturated
F
Cr
esults of the th
ng section. Th
ng conditions
re discussed.
ater content an
d conductivity
Figure 4.59: T
acked Instan
hree cracked i
he initial soil
s, sampling pr
The results f
nd suction tre
y, Kunsat plo
109
Test No. 7 Ku
ntaneous Pro
instantaneous
conditions, s
rocedures and
for each crack
ends, the wate
ts.
unsat Plot.
ofile Results
s profile expe
et up procedu
d observation
ked experimen
er content and
eriments are p
ures, measure
ns during the
nt will be pre
d suction prof
presented
ement
sented
files, and

T
st
th
in
di
F
S
cy
co
to
de
ha
se
pr
va
Test Number 4
The in
tarted on June
he cracked Me
ntact instantan
ifference for T
or this experi
et 1 and Set 2
The ap
ylindrical tub
ompacted into
o being compa
esired water c
ave a good ra
ection. This p
resents the tes
alues for the s
Fig
4:
nstantaneous p
e 7, 2010. Th
ethod B from
neous profile
TN4 is that th
iment two sam
2. Sample Se
pparatus used
e. Soil was p
o the sample t
acted into the
content. The
ange of suctio
provided a hy
sting apparatu
soil.
gure 4.60: Te
profile experi
his experimen
m chapter 3. T
experiment T
he soil profile
mple sets are c
t 2 has double
for TN4 is a
prepared at ap
tubes. The so
e tubes and ch
water conten
n during the t
ydraulic gradi
us dimension
st No. 4 Initia
110
ment identifie
nt follows the
The experimen
TN3 using the
e contains crac
created. The
e the crack vo
9 inch long,
pproximately
oil was allowe
hecked to ensu
nt used for the
test which wa
ent of approx
s along with t
al Soil Condit
ed as Test Nu
experimental
nt is conducte
e duplicate me
cks or voids o
two sample s
olume from S
3 inch inner d
8% and 14%
ed to equilibr
ure that the w
e two soil sect
as 6,130kPa t
ximately 9,000
the initial wat
tions and Tes
umber 4 (TN4
l design discu
ed the same a
ethod. The p
oriented horiz
sets are identi
Set 1.
diameter blac
water conten
rate for 24 ho
water content w
tions was cho
o 450kPa for
0. Figure 4.6
ter content an
st Apparatus.
4) was
ussed for
as the
primary
zontally.
ified as
ck PVC
nt to be
urs prior
was at the
osen to
each
60 below
nd suction

111
The table below titled Table 4.9 presents the initial soil conditions and other
relevant parameters. The initial conditions reported in Table 4.9 were taken from water
content measurements during sample creation. Section 1 is the dry section and section 2
is the wet section. The suction values reported were taken from filter paper samples taken
7 days after sample creation.
Table 4.9: Test No. 4 Initial Soil Conditions.
The soil is compacted in the apparatus tubes in 1.5 inch lifts. This is done the
keep the dry density of the soil consistent through the soil profile. To ensure uniform
density, for each 1.5 inch lift the amount of soil required to occupy the volume at the
required dry density was weighted out beforehand. In between each compaction lift the
soil was scarified to ensure good contact and continuity between lifts. The dry soil
section was compacted in the tubes first. The last lift is difficult to make at the top of the
sample tubes so the wet sections was placed last since it is easier to manipulate. The soil
was compacted in the sample tubes using a standard proctor hammer. Figures 4.62 and
4.63 below show the soil being placed and compacted in the tubes, the placement of a
filter paper sandwiches and the scarification between soil lifts.
Section 1 2Desired w% (grav) 0.08 0.14Relative Compaction % 0.98 0.98Dry Density (pcf) 106.5 106.5Actual w% (grav) 8.34% 14.85%Actual w% (vol) 14.23% 25.34%Saturation % 38.21% 68.04%Matric Suction (kPa) 6130 450Void Ratio 0.594 0.594

Figure 4.6
Figu
Figur
63: Test No. 4
ure 4.61: Tes
re 4.62: Test
4 Filter Paper
112
st No. 4 Samp
No. 4 Sample
r Sandwich P
ple Creation.
e Compaction
lacement and
n.
d Soil Scarificcation.

T
sc
co
lo
an
lo
sa
ex
th
0
to
on
in
so
so
re
Twelv
The samples w
carification be
ontents and d
ocations in the
nd in between
ocations of the
The ho
aw. The thick
xperiment wa
he actual thick
.13 inches. W
o achieve a cr
n other exper
n order to com
oil lift having
oil lift having
equire to achi
ve samples we
were compacte
etween soil la
ry unit weigh
e soil profile.
n areas in the
e filter paper
Figure 4.64
orizontal crac
kness of the c
as conducted p
kness of the v
With this param
rack to soil vo
iments being
mpare data fro
g a total of 6 c
g a total of 12
eve a desired
ere created for
ed using the s
ayers, the plac
ht. For this exp
One filter pa
soil profile h
sandwiches i
4: Test No. 4
cks were to be
crack was lim
prior to cuttin
void from the
meter identifi
olume ratio in
conducted in
om other expe
cracks for eac
cracks for ea
crack ratio th
113
r TN4 to have
sampling proc
cement of filt
periment, the
aper sandwich
has a crack. F
n the sample
Filter Paper S
e created in th
ited by the th
ng the cracks
cut. The crac
fied the crack
n the range of
n relation with
eriments. For
h sample. Se
ach sample. T
he following
e six duplicat
cedure to the
ter paper sand
e matric suctio
h is located in
Figure 4.64 be
tube.
Sandwich Loc
he sample tub
hickness of the
in the sample
ck thickness w
depth was the
f 2-5%. This c
h this study. T
r Set 1, one cr
et 2 has two c
To determine
calculation is
te samples for
compaction o
dwiches, soil
on is measure
n between eac
elow, shows t
cations.
bes using a Sil
e saw blade.
es for TN4 to
was determin
en determine
crack ratio w
The crack rat
rack is locate
cracks located
the depth of t
s performed.
r each set.
of the soil,
water
ed at five
ch soil lift
the
lk circular
A trial
measure
ned to be
in order
as based
tio is used
d in each
d in each
the cut
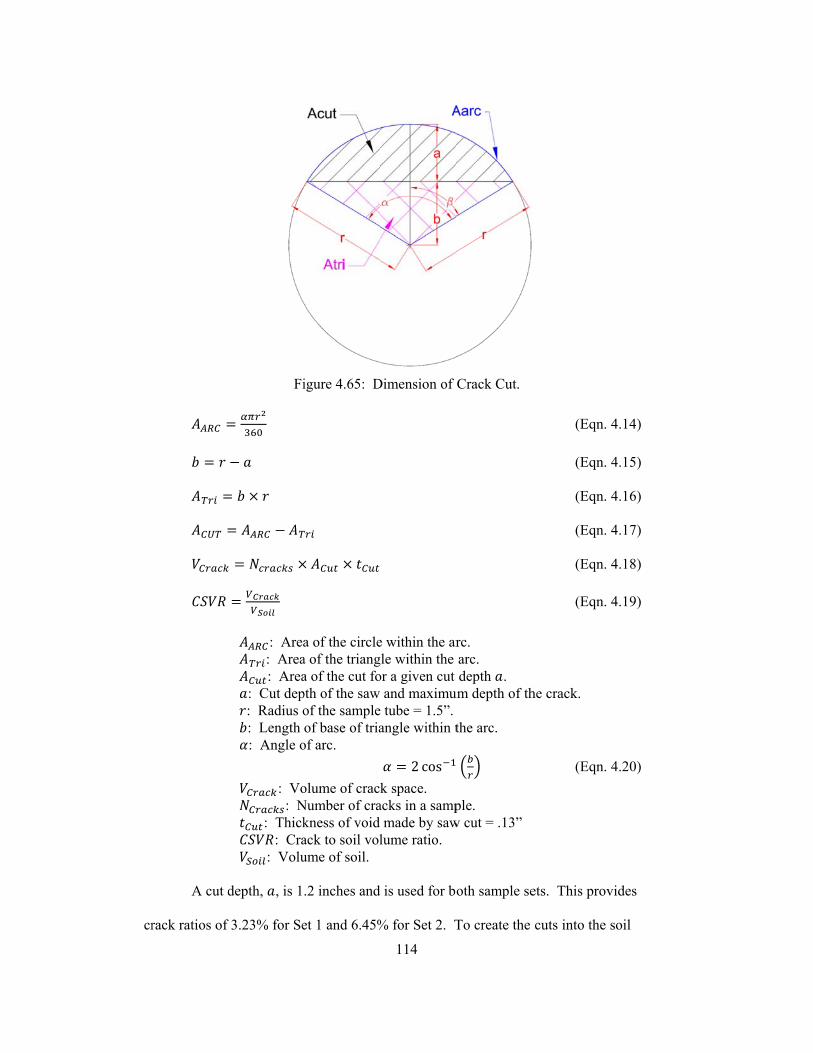
cr
A cut d
rack ratios of
Fi
: Area: Area: Area
: Cut dep: Radius o: Length : Angle o
: Vo: N
: Thick: Cra
: Volu
depth, , is 1
f 3.23% for Se
igure 4.65: D
a of the circlea of the trianga of the cut fopth of the saw of the sampleof base of tria
of arc.
olume of cracNumber of crakness of void ack to soil volume of soil.
.2 inches and
et 1 and 6.45%
114
Dimension of
e within the argle within the or a given cut
and maximue tube = 1.5”.angle within t
2 cos
k space. acks in a samp
made by sawlume ratio.
is used for bo
% for Set 2. T
Crack Cut.
rc. arc. depth .
um depth of th
the arc.
ple. w cut = .13”
oth sample se
To create the
(Eqn.
(Eqn.
(Eqn.
(Eqn.
(Eqn.
(Eqn.
he crack.
(Eqn.
ets. This prov
cuts into the
4.14)
4.15)
4.16)
4.17)
4.18)
4.19)
4.20)
vides
soil

sa
2
pa
T
pr
ample the cra
. The cracks
aper sandwich
The crack loca
resented a com
cks were loca
were position
h was maxim
ations were m
mpeted samp
Figure 4.66:
Figur
ated 1.5 inche
ned in locatio
mized. Figure
marked on the
les specimen
: Test No. 4 C
re 4.67: Test
115
es apart for Se
ns where the
4.66 presents
sample tubes
s prior to cutt
Cracks Locati
No. 4 Compl
et 1 and 0.5-0
distance betw
s the layout o
s prior to cutti
ting.
ions for Sets
leted Samples
0.8 inches apa
ween a crack
of the crack lo
ing. Figure 4
1 and 2.
s.
art for Set
and filter
ocations.
4.67

cr
sh
sa
cu
cr
S
or
th
th
The sa
reated signific
harpness dulle
amples the vo
utting. Plasti
racks and was
et 2. Due to t
rder not to cre
he soil and clo
he samples fro
ample sets we
cant resistanc
ed rapidly fro
oid created by
c shavings fro
s easily remov
the short dista
eate any unw
osing adjacen
om Set 1 and
Figu
ere cut using t
ce when cuttin
om cutting thr
y the cuts wer
om cutting th
ved. Great ca
ance between
anted disturb
nt crack space
2 with the cra
ure 4.68: Tes
116
the silk saw a
ng especially
rough the soil
e cleaned of a
rough the pla
are had to be
n crack locatio
ance such as
s. Figures 4.
acks cut and c
st No. 4 Set 1
at the desired
in the dry soi
l. Once the cr
any unwanted
astic was loos
taken in cutti
ons the cracks
creating inter
68 and 4.69 b
cleaned.
Cut Sample.
locations. Th
il sections. T
rack were cut
d particles cre
sely scattered
ing cracks for
s were cut slo
rnal cracks an
below present
he soil
The blade
t into the
eated from
in the
r sample
owly in
nd pushing
t photos of

ob
sh
si
co
co
F
All the
bservation. F
hould be insig
ignificant whe
ompletely com
overed with p
igure 4.71 pre
Figu
e samples cre
Figure 4.70 sh
gnificant sinc
en calculating
mpacted and
plastic Saran w
esents the sam
Fig
ure 4.69: Tes
ated except o
hows the dam
e the end port
g hydraulic co
sealed at each
warp. The pl
mples prior to
ure 4.70: Tes
117
st No. 4 Set 2
one sample we
mage the samp
tions of the sa
onductivity va
h end using a
astic warp wa
o storage in th
st No. 4 Samp
Cut Sample.
ere completed
ple in Set 2. T
amples are no
alues. The so
layer of wax
as then sealed
he environmen
ple Damage.
d as desired fr
The sample da
ot considered
oil samples w
x paper and th
d to the tubes
ntal chamber.
from visual
amage
or
were
hen
with tape.
.

S
ta
pr
fo
in
ru
dr
so
The sa
amples were
aken from eac
rofile experim
or TN4 that ar
The so
nspection duri
un time of the
ry soil section
oil. Figure 4.
Fig
ampling proce
extruded, the
ch soil section
ments that use
re performed
oil samples w
ing sampling
e experiment.
ns tended to c
72 below sho
Figu
gure 4.71: Te
edure for TN4
e filter paper w
n. The proced
e the duplicate
are described
ere successfu
the sample sp
From the ex
close up due t
ows this issue
ure 4.72: Tes
118
est No. 4 Seal
4 was perform
was retrieved
dure remains
e method. Th
d in the sectio
ully extruded f
pecimens crac
xtrusion proce
to the friction
though it did
st No. 4 Extru
ed Samples.
med the same
and water co
consistent for
he process and
on for TN3.
from the sam
cks remained
ess, some of th
n between the
d not seem to
uded sample.
as TN3 and T
ontent sample
r all instantan
d methods fo
mple tubes. Fr
d open through
he crack spac
sample tube
impact the re
TN7.
s were
neous
r sampling
rom visual
hout the
ces in the
and the
esults.

in
ru
a
Fr
su
pr
co
da
tr
th
te
The to
ncreasing time
un time for ea
photo of the
rom visual ob
uggesting that
T
The re
resented in Fi
ontent and su
ata acquired f
rends in the w
hat the sample
esting period e
otal run time f
e intervals be
ach specimen
samples from
bservation the
t the sample d
able 4.10: Te
Figure 4.7
esults of the w
igures 4.76 an
ction measure
from testing i
water content a
es did not rea
enough chang
Sampl
for TN4 was 3
etween sampli
for TN7 is pr
m each sample
e soil sections
did not reach
est No. 4 Sam
3: Test No. 4(Set 1 Left
water content
nd 4.79. Indiv
ements are pr
s tabulated in
and suction d
ch complete e
ge in water co
le Number Sa
12345
119
300 days. Fiv
ing events. T
resented in Ta
e set on the 30
s appear to ha
equilibrium.
mple Run Tim
4 Extruded Sa, Set 2 Right
and suction m
vidual plots f
resented in Fi
nto a spreadsh
ata. In Figure
equilibrium in
ontent occurre
ample Date R
7/27/20109/15/2010
12/27/20102/14/20113/3/2011
ve sampling e
The sample nu
able 4.10 belo
00th day of run
ave significan
mes and Samp
amples on DaPhoto)
measurements
for each samp
igure 4.74, 4.7
heet and plots
res 4.75 and 4
n 300 days of
ed to calculat
Run Time (day
510202530
events occurre
umber, sampl
ow. Presente
un time in Figu
ntly different c
ling Dates.
ay 300.
s from TN4 ar
ple set of the w
75, 4.77, and
s were made t
4.78, is can be
f run time. D
ted hydraulic
s)
5000035200
ed at
e date and
ed below is
ure 4.73.
color
re
water
4.78. The
to analyze
e observed
uring the

co
fo
onductivity v
or each set is
alues. From F
very different
Figure 4.74
Figure 4.75
Figure 4.76 o
t.
: Test No. 4,
: Test No. 4,
120
of the suction
Set 1, Matric
Set 2, Matric
data shows th
c Suction ove
c Suction ove
hat the suctio
er Time.
er Time.
on trends

Figure 44.76: Test No
Figure 4.77
o. 4 Matric Su
7: Test No. 4,
121
uction over T
, Set 1, Water
Time Sample
r Content ove
Set Comparis
er Time.
son.

Figure 4
Figure 4.78
4.79: Test N
8: Test No. 4,
o. 4 Water Co
122
, Set 2, Water
ontent over T
r Content ove
Time Sample S
er Time.
Set Comparis
son.
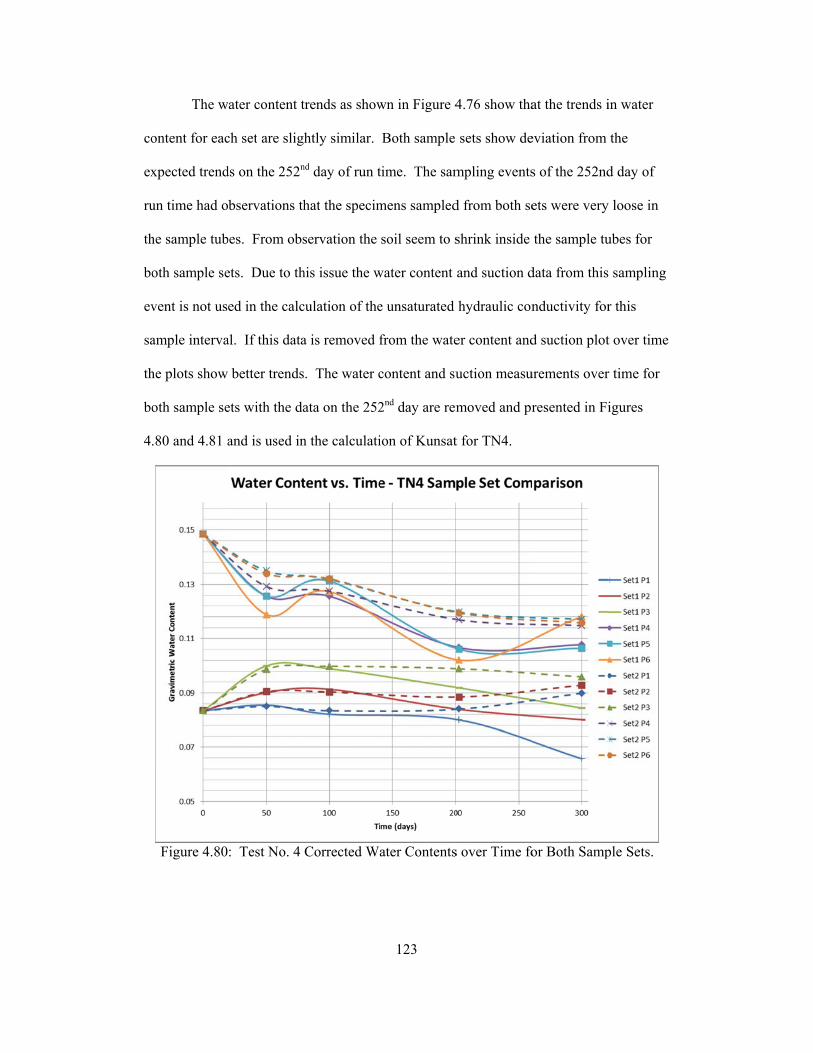
co
ex
ru
th
bo
ev
sa
th
bo
4
The w
ontent for eac
xpected trend
un time had o
he sample tub
oth sample se
vent is not us
ample interva
he plots show
oth sample se
.80 and 4.81 a
Figure 4.80
water content t
ch set are sligh
ds on the 252n
bservations th
bes. From obs
ets. Due to th
ed in the calc
al. If this data
better trends
ets with the da
and is used in
: Test No. 4
trends as show
htly similar.
nd day of run t
hat the specim
servation the
his issue the w
culation of the
a is removed f
. The water c
ata on the 252
n the calculati
Corrected Wa
123
wn in Figure 4
Both sample
time. The sam
mens sampled
soil seem to s
water content
e unsaturated
from the wate
content and su
2nd day are rem
ion of Kunsat
ater Contents
4.76 show tha
sets show de
mpling events
d from both se
shrink inside
and suction d
hydraulic con
er content and
uction measu
moved and pr
t for TN4.
s over Time fo
at the trends i
eviation from
s of the 252nd
ets were very
the sample tu
data from this
nductivity for
d suction plot
urements over
resented in Fi
or Both Samp
in water
the
d day of
y loose in
ubes for
sampling
r this
t over time
r time for
igures
ple Sets.

be
fo
pr
Figure 4
The w
elow in Figur
or Set 1 on the
rofiles for bot
4.81: Test No
water content a
re 4.82, 4.83,
e 252th day is
th sample set
Figure 4.8
o. 4 Corrected
and suction pr
4.85 and 4.86
s not used. T
is presented
82: Test No.
124
d Suction ove
rofiles for eac
6. Note that t
The compariso
in Figures 4.8
4, Set 1, Wat
er Time for B
ch sample set
the water con
on of water co
84 and 4.87.
ter Content Pr
oth Sample S
t from TN4 is
ntent and sucti
ontent and su
rofile.
Sets.
presented
ion data
ction

F
Figure 4.8
igure 4.84: T
83: Test No.
Test No. 4 Wa
125
4 Set 2, Wate
ater Content P
er Content Pr
Profile Set Co
rofile.
omparison.

Figure 4.8
Figure 4.8
85: Test No.
86: Test No.
126
4, Set 1, Matr
4, Set 2, Matr
ric Suction Pr
ric Suction Pr
rofile.
rofile.

sa
ca
in
co
in
pr
sh
Fi
The ca
ample set are
alculated usin
n the soil prof
onductivity v
n the figures b
resented in Fi
hows no signi
igure 4.87: T
alculated unsa
presented in
ng the approac
file. The vari
alues in differ
below are sho
igure 4.90 sho
ificant differe
Test No. 4 Ma
aturated hydra
Figures 4.88
ch previous s
ous intervals
rent suction r
own in Figure
ows the result
ence between
127
atric Suction P
aulic conduct
and 4.89. Th
tated in this c
chosen are us
ranges. The lo
4.63 and are
ts from both s
sample sets.
Profile Set Co
tivity values f
he conductivit
chapter over v
sed to gain m
ocations of th
the same as T
sample sets to
omparison.
for TN4 for ea
ty values wer
various interv
multiple hydra
he intervals pr
TN3. The Ku
ogether. The
ach
re
vals with
aulic
resented
unsat plot
data

Figu
Figu
ure 4.88: Test
ure 4.89: Test128
t No. 4, Set 1,
t No. 4, Set 2,
, Kunsat Plot
, Kunsat Plot
.
.

T
st
th
in
di
di
sa
w
P
Test Number 5
The in
tarted on July
he cracked Me
nstantaneous p
ifference for T
ifferent water
ample sets are
width than sam
The ap
lexiglas cylin
Figure 4.90:
5:
nstantaneous p
y 14, 2010. Th
ethod C. Thi
profile experi
TN5 is that th
r content. For
e identified as
mple Set 3.
pparatus used
ndrical tube. S
: Test No. 4,
profile experi
he experimen
s experiment
iment TN3 us
he soil profile
r this experim
s sample Set 3
for TN5 is a
Soil was prep
129
Kunsat Plot o
ment identifie
nt follows the
is conducted
sing the dupli
e contains an a
ment two samp
3 and Set 4. S
9 inch long, 2
pared at appro
of Both Samp
ed as Test Nu
experimenta
d the same ma
icate method.
air gap betwe
ple sets are cr
Sample Set 3
2.5 inch inner
oximately 8%
ple Sets.
umber 5 (TN5
al design discu
anner as the in
The primary
een two soil s
reated. The tw
has a smaller
r diameter cle
% and 19.5% w
5) was
ussed for
ntact
y
ections of
wo
r gap
ear
water

co
ho
co
ch
14
ap
al
4
so
re
co
se
ta
ontent to be c
ours before b
ontent was at
hosen in orde
4,000kPa to 1
pproximately
llow for signi
.91 below pre
oil suction.
Fig
The ta
elevant param
ontent measur
ection 2 is the
aken 7 days af
compacted int
eing compact
desired wate
er to have a go
15kPa for eac
12,500. A la
ificant evapot
esents the test
gure 4.91: Te
able below titl
meters. The in
rements durin
e wet section.
fter sample cr
to the sample
ted into the sa
r content. Th
ood range of s
ch section. Th
arge hydraulic
transpiration o
ting apparatus
st No. 5 Initia
led Table 4.11
nitial conditio
ng the sample
The suction
reation.
130
tubes. The s
ample tubes a
he water conte
suction value
his provides a
c gradient wa
over the air ga
s dimensions
al Soil Condit
1 presents the
ons reported in
e creation. Se
values report
soil was allow
and checked t
ent used for th
s during the t
a hydraulic gr
as chosen to d
ap between th
and the initia
tions and Tes
e initial soil co
n Table 4.11
ection 1 is the
ted were taken
wed to equilib
to ensure that
he two soil se
test which wa
radient of
drive moisture
he soil section
al water conte
st Apparatus.
onditions and
were taken fr
e dry section a
n from filter p
rate for 24
the water
ection was
as
e flow and
ns. Figure
ent and
d other
rom water
and
paper tests

ex
in
be
de
re
to
sa
th
A sam
xists in betwe
nto the sample
elow. The so
ensity for eac
equired dry de
o ensure good
Fig
Twelv
ample set. Th
he soil, scarifi
Table
mple creation w
een the two so
e tube with th
oil is compact
ch 1.5 inch lif
ensity is weig
d contact and
ure 4.92: Tes
ve samples are
he samples ar
ication betwe
Desired wRelative CDry DensActual w%Actual w%SaturationMatric SuVoid Ratio
4.11: Test N
was used to cr
oil sections. B
he same samp
ted in the appa
ft the amount
ghted out befo
continuity be
st No. 5 Soil
e created for T
re created usin
en soil layers
Sectionw% (grav)Compaction %sity (pcf)% (grav)% (vol)n %uction (kPa)io
131
No. 5 Initial S
reate and com
Both soil sect
ple height. Th
aratus tubes i
of soil requir
orehand. In b
tween lifts.
Sections Com
TN5. Six dup
ng the same p
s, placement o
1
%
71233
oil Condition
mpact the sam
tions 1 and 2
his is presente
in 1.5 inch lift
red to occupy
between each
mpacted in Sa
plicate sample
procedure as t
of filter paper
1 20.080.98
106.57.32% 192.49% 323.54% 87101300.594
ns.
mple so that an
where first co
ed in Figure 4
fts. To ensure
the volume a
lift the soil is
ample Tubes.
es are created
to the compac
r, the soil wat
20.1950.98
106.59.05%2.51%7.28%
660.594
n air gap
ompacted
4.92
e uniform
at the
s scarified
d for each
ction of
ter content

an
in
pa
th
sa
pu
sh
w
of
pu
ch
nd dry unit w
n each sample
aper was plac
hroughout the
andwiches in
Both s
ush into the s
hown in Figur
width. Using t
f the extruded
ushed into the
hamber.
weight. For th
e. One filter p
ced at the air g
e soil profile.
the sample tu
Figure 4.93
soil sections a
ample tube o
re 4.94 below
the clear tube
d sample for S
e sample tube
is experiment
paper sandwic
gap interface.
Figure 4.93 b
ube.
: Test No. 5
are compacted
f the wet soil
w. This metho
es is required
Set 3 is shown
e the samples
132
t, the matric s
ch is located i
. These locat
below shows
Filter Paper S
d in the sampl
section. Thi
od worked we
to visible see
n in Figure 4.
were sealed a
suction is mea
in between ea
tions provide
the locations
Sandwich Loc
le tubes and t
is is done usin
ell in producin
e the width of
.95. After the
and stored in
asured at four
ach soil lift. N
suction meas
s of the filter p
cations.
the dry soil se
ng an extrude
ng the desired
f the air gap. A
e dry soil sect
the environm
r locations
No filter
surements
paper
ection is
r as
d air gap
A photo
tion was
mental
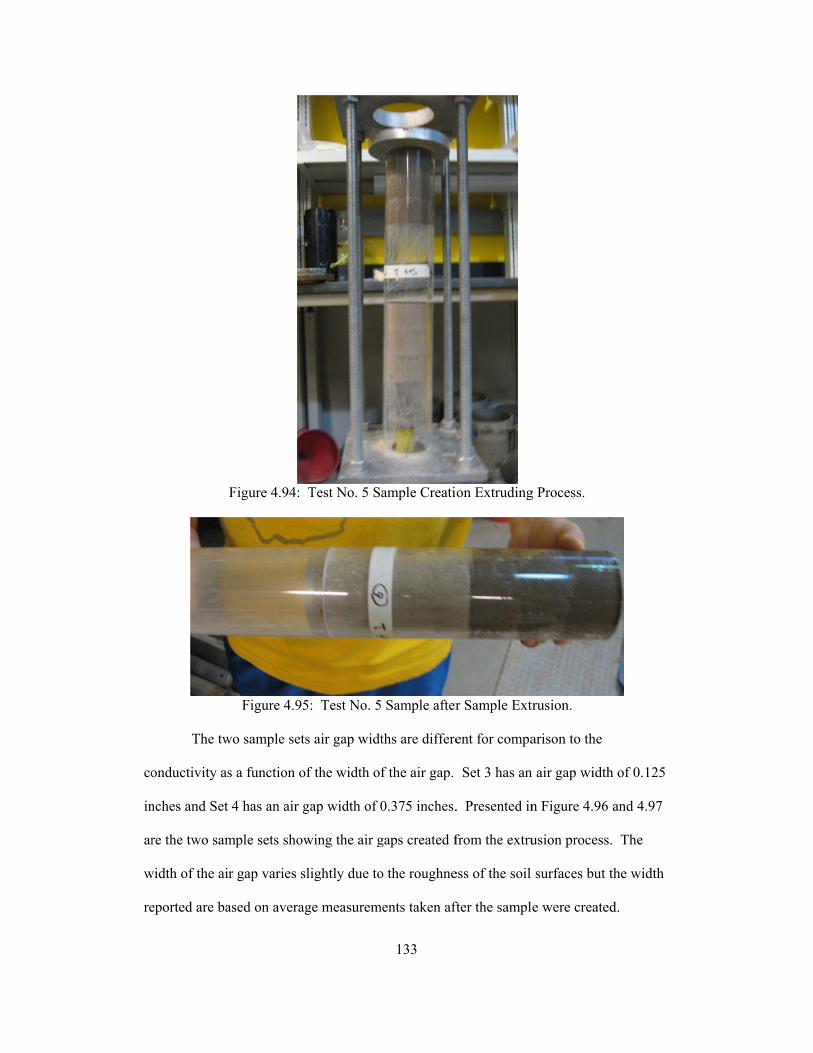
co
in
ar
w
re
The tw
onductivity as
nches and Set
re the two sam
width of the ai
eported are ba
Figure 4.94:
Figure 4.95
wo sample set
s a function o
4 has an air g
mple sets show
r gap varies s
ased on avera
Test No. 5 S
5: Test No. 5
ts air gap widt
of the width o
gap width of
wing the air g
slightly due to
ge measurem
133
ample Creatio
5 Sample after
ths are differe
f the air gap.
0.375 inches.
gaps created f
o the roughne
ments taken aft
on Extruding
r Sample Extr
ent for compa
Set 3 has an
. Presented in
from the extru
ess of the soil
fter the sample
g Process.
rusion.
arison to the
n air gap width
n Figure 4.96
usion process
surfaces but
e were create
h of 0.125
and 4.97
s. The
the width
ed.

S
ta
pr
m
tu
w
ai
of
The sa
amples were
aken from eac
rofile experim
methodology f
The so
ubes. From v
width with som
ir gap width f
f sample crea
Fi
Fi
ampling proce
extruded, the
ch soil section
ments that in c
for sampling i
oil samples fo
isual inspecti
me slight insig
for all the sam
ation. Figure
igure 4.96: T
igure 4.97: T
edure for TN5
e filter paper w
n. This proce
cooperates the
in TN5 is per
or TN5 were a
ion during sam
gnificant swe
mples remaine
4.98 presents
134
est No. 5 Set
est No. 5 Set
5 is performed
was retrieved
dure remains
e duplicate m
formed as des
able to be suc
mpling the air
lling that occ
ed very close
s a picture of s
3 Air Gap.
4 Air Gap.
d the same as
and water co
s consistent fo
method. The p
scribed for TN
ccessfully extr
r gaps remain
curred during
to the gap wi
samples from
s TN3, TN4, a
ontent sample
or all instantan
process and
N3.
ruded from th
ned at the spec
the experime
idth created a
m Sets 3 and 4
and TN7.
s were
neous
he sample
cified
ent. The
at the time
4 showing

th
th
in
ru
ob
th
he air gaps be
hat water flow
Figur
The to
ncreasing time
un time for ea
bservation the
he sample did
T
Figu
fore a sampli
wed from the w
re 4.98: Test
otal run time f
e intervals be
ach sample sp
e soil sections
d not reach equ
able 4.12: Te
ure 4.99: Tes
Sampl
ing event. Du
wet to dry soi
No. 5 Specim
for TN5 was 2
etween sampli
pecimens for T
s appear to ha
uilibrium.
est No. 5 Sam
st No. 5 Extru
le Number Sa
12345
135
uring extrusio
il section. Th
men Condition
250 days. Fiv
ing events. T
TN5 is presen
ave significan
mple Run Tim
uded Sample o
ample Date R
9/2/201010/22/201012/21/20101/30/20113/21/2011
on of the samp
his can be see
ns at Day 250
ve sampling e
The sample nu
nted in Table
ntly different
mes and Samp
on Day 250 o
Run Time (day
510162025
ples it was ob
en in Figure 4
0 of Run Time
events occurre
umber, sampl
4.12. From v
color suggest
ling Dates.
of Run Time.
ys)
5000600050
bserved
4.99.
e.
ed at
e date and
visual
ting that

sa
se
4
sp
da
eq
co
The re
ample sets are
et of the wate
.103, and 4.10
preadsheet an
ata. In Figure
quilibrium aft
ontent occurr
esults of the w
e presented in
r content and
04. The data
nd plots were
es 4.102 and 4
fter 250 days o
ed to calculat
Figure 4.100
water content
n Figures 4.10
d suction meas
obtained from
made to analy
4.105, show t
of run time. D
ted hydraulic
0: Test No. 5
136
and suction m
02 and 4.105.
surements are
m the experim
yze the trends
that the samp
During the tes
conductivity
, Set 3, Matri
measurements
Individual p
e presented in
ment was tabu
s in the water
les did not re
sting period e
values.
ic Suction ove
s from TN5 fo
plots for each
n Figure 4.100
ulated into a
r content and
each complete
enough chang
er Time.
or both
sample
0, 4.101,
suction
e
ge in water

Figure 4
Figure 4.101
4.102: Test N
1: Test No. 5
No. 5 Matric S
137
, Set 4, Matri
Suction over T
ic Suction ove
Time Sample
er Time.
Set Compari
ison.

Figure 4.103
Figure 4.104
3: Test No. 5
4: Test No. 5
138
5, Set 3, Wate
5, Set 4, Wate
er Content ove
er Content ove
er Time.
er Time.

an
dr
co
F
su
Figure 4
From t
nd suction tre
rier soil sectio
ontent and su
igures 4.106,
uction profile
4.105: Test N
the figures ab
ends are very
on are slightly
ction profiles
4.107, 4.109
s are presente
No. 5 Water C
bove of the sa
similar for bo
y different fro
s for each sam
and 4.110. C
ed in Figures
139
Content over T
ample set com
oth sample se
om compariso
mple set from
Comparison p
4.108 and 4.1
Time Sample
mparison for T
ets 3 and 4. T
on from set 3
TN5 and are
plots of the w
111.
Set Compari
TN5 the water
The suction tre
to set 4. The
presented be
water content a
son.
r content
ends in the
e water
low in
and

Figure 4.1
Figure 4.1
06: Test No.
07: Test No.
140
5, Set 3, Wa
5, Set 4, Wa
ater Content P
ater Content P
Profile.
Profile.

Figure 4.108: T
Figure 4.1
Test No. 5 W
09: Test No.
141
Water Content
5, Set 3, Mat
Profile Set C
tric Suction P
omparison.
Profile.

sa
ca
in
co
Fig
The ca
ample set are
alculated usin
n the soil prof
onductivities
Figure 4.1
gure 4.111: T
alculated unsa
presented in
ng the approac
file. The vari
at different su
10: Test No.
Test No. 5 Ma
aturated hydra
Figures 4.112
ch previous s
ous intervals
uction values
142
5, Set 4, Mat
atric Suction
aulic conduct
2 and 4.113.
tated in this c
were chosen
. The locatio
tric Suction P
Profile Set C
tivity values f
The conducti
chapter over v
to gain multi
on of the inter
Profile.
Comparison.
for TN5 for ea
ivity values w
various interv
iple hydraulic
rvals presente
ach
were
vals with
c
ed in the

fi
co
lo
an
us
co
pr
igures below i
onductivity ca
ong air gap co
nalyzed point
sing the dista
onditions are
resented in Fi
is shown in F
alculated ove
onductivities a
ts being equal
nce to the len
the same at th
igure 4.114 pr
Figur
Figure 4.93 an
r the air gap a
are calculated
l to 1.5 inches
ngth of the air
he interface a
resents the re
re 4.112: Tes
143
nd are the sam
are calculated
d as normal w
s. The short a
r gap. For thi
as in the adjac
esults for both
st No. 5, Set 3
me as TN3, TN
d for two diffe
with the distan
air gap condu
is situation it
cent soil lift.
h sample sets
3, Kunsat Plot
N4, and TN7.
ferent situation
nce between th
uctivities are c
is assumed th
The Kunsat p
together.
t.
. The
ns. The
he
calculated
hat the soil
plot

Figurre 4.113: Tes
144
st No. 5, Set 44, Kunsat Plott.

ob
ea
th
w
ai
co
so
From t
bserved that t
ach other. Th
han the condu
was expected s
ir gap. The c
onductivity o
oil unsaturate
Figure 4.114
the unsaturate
the conductiv
he conductivit
uctivity values
since the air g
onductivity v
f the water va
d hydraulic c
4: Test No. 5,
ed hydraulic c
vity points in i
ty values calc
s calculated o
gap should sig
values over th
apor transmis
conductivity.
145
, Kunsat Plot
conductivity p
intact section
culated over th
over the intact
gnificantly res
e shot air gap
sivity and are
of Both Sam
plots presente
of the soil pr
the air gaps ar
t sections of t
strict the flow
p are used as t
e used as a mi
mple Sets.
ed above is ca
rofile agree w
re significantl
the soil profil
w of moisture
the hydraulic
inimum value
an be
well with
ly lower
e. This
over the
e for the

146
Test Number 6 (Cracked): The cracked instantaneous profile experiment Test Number 6 is a vertical
infiltration test that is analyzed in tandem with TN6I. The samples for Test Number 6 in
the cracked condition are identified as TN6C. The experiment for TN6C was started on
December 15, 2010. This experiment was designed according to the configuration and
methods explained in the experiment design section in Chapter 3. This experiment was
design to simulate a vertical infiltration condition.
The apparatus used for TN6C is a 9 inch long, 3 inch inner diameter clear
cylindrical Plexiglas tube. Soil was prepared at approximately 15.5% water content prior
to being compacted into the sample tubes. The soil was allowed to equilibrate for 24
hours before being compacted into the sample tubes. The initial soil properties for TN6C
and other relative soil properties are shown in Table 4.13 below.
Table 4.13: Test No. 6 C Initial Soil Conditions.
The samples for TN6C were compacted in the same manner and using the same
procedure and specifications as TN6I. The soil was compacted in the test apparatus tubes
in 1.5 inch lifts. This is done to ensure uniform density. The Ec-5 volumetric moisture
probes were to measure the water content over time. These results were also used to
interpolate matric suction values using soil water characteristic curve for the soil. The
moisture probes are positioned in the same orientation and locations as TN6I as shown in
Figure 4.42. The volumetric moisture probes were installed through slits cut in the sides
Section 1Desired w% (grav) 0.15Relative Compaction % 0.98Dry Density (pcf) 106.5Actual w% (grav) 15.30%Actual w% (vol) 26.11%Saturation % 70.10%Matric Suction (kPa) 400Void Ratio 0.594

of
4
cr
pa
th
th
1
ru
ra
w
su
T
fo
be
f the sample t
.43.
The sa
rack pattern u
arallel with th
he natural dev
hat is used for
The cr
.25 inches thi
ubber mallet.
atio of 3.13%
were created.
urrounding th
The cracks we
orming the cra
elow.
tubes. The lo
ample for TN6
used is develo
his study. Sam
velopment of
r TN6C is pre
Figu
racks were for
ick. The piec
The steel pie
. The perime
Great care wa
he cracks are v
re formed im
ack pattern fo
ocations of the
6C is the crac
oped by Sam A
m’s crack pat
cracks, size o
esented in Fig
ure 4.115: Te
rmed using a
ce of metal wa
ece was drive
eter cracks we
as taken in fo
very fragile an
mediately aft
or TN6C is sh
147
e volumetric m
cked compani
Abbaszadeh w
ttern is based
of cracks, and
gure 4.115 bel
est No. 6 C C
piece of steel
as driven into
n 1.3 inches i
ere formed fir
orming the cra
nd would eas
ter the sample
hown in Figur
moisture prob
ion of TN6I, t
who was work
on research i
d crack pattern
low.
Crack Pattern.
l that is 0.75 i
o the top of th
into the soil p
rst and then th
acks because
sily break off
e was compac
res 4.116, 4.1
bes are shown
the intact sam
rking on a stud
in literature fo
ns. The crack
inches in leng
he soil profile
profile to gain
he cracks in th
the soil piece
is overly dist
cted. The pro
17, 4.118 and
n in Figure
mple. The
dy in
ocusing on
k pattern
gth and
using a
n a crack
he middle
es
turbed.
ocess of
d 4.119

F
F
F
Figure 4.116:
Figure 4.117:
Figure 4.118:
Creating Cr
Creating Cr
Creating Cr
148
ack Formatio
ack Formatio
ack Formatio
on for Test No
on for Test No
on for Test No
o. 6 C (1).
o. 6 C (2).
o. 6 C (3).

m
th
to
cr
pu
en
tim
en
in
w
cr
F
During
more compacti
he soil profile
o the bottom o
reation of the
ushed to the o
nsure that eac
mes with the
nvironmental
nundated.
Prior t
was done each
racks. Figure
Figure 4.119:
g the creation
ion due to the
e, the soil belo
of the crack.
cracks. Also
other side, dec
ch crack had a
steel form. A
chamber and
to inundation
h crack was cl
e 4.120 below
Creating Cr
n of the crack
e creation of t
ow the steel p
This may lea
o when a crac
creasing the w
approximately
After the crac
d allowed to e
the crack wid
leaned of any
w shows the cr
149
ack Formatio
pattern the to
the cracks. W
piece drives th
ad to higher so
ck is created o
width of some
y the same wi
ks were form
equilibrate for
dth, length an
soil particles
rack prior to m
on for Test No
op lift of the s
When the steel
he surrounds s
oil densities th
on one side of
e cracks. To
idth the crack
med and the sa
r 24 hours unt
nd depth was m
s that may hav
measurement
o. 6 C (4).
soil profile ha
l pieces are dr
soil laterally a
hen desired fr
f the sample t
prevent this a
ks are re-form
ample was put
til the sample
measured. B
ve remained i
t and before in
ad slightly
riven into
and down
from the
the soil is
and to
med many
t in the
e was
efore this
in the
nundation.

is
cr
of
The m
s presented in
rack ratio by
f crack ratios
Tab
Crac
Figure 4
measurements
Table 4.14 b
about 1%. Th
desired for st
ble 4.14: TesRefer
ck No.Crack
(123456789
101112
4.120: Compl
of each crack
below. The ac
he actual mea
tudy which is
t No. 6 C Crato Figure 4.1
k Width (in)
Cra
0.17150.16800.13850.14950.16300.18800.11700.12650.12650.15950.16550.1115
150
leted Sample
ks and the me
ctual crack rat
asured crack r
s 2% to 5%.
ack Measurem121 for Crack ck Depth (in)
Cr
1.22751.15601.17201.20501.18501.21001.22580.98751.07150.93500.10250.1285
TotaCra
for Test No.
easured crack
atio is differen
ratio is still w
ments and Crak No. Locationrack Length
(in)C
0.94650.92550.95550.93250.97300.97000.50200.44150.54000.43100.49650.3710
al Vol (in^3)ck Ratio
6 C.
volume of th
nt form the ca
within the desi
ack Volume. ns Crack Volume
(in^3)0.19930.17970.15510.16800.18790.22070.07200.05520.07320.06430.00840.00531.389
2.18%
he sample
alculated
ired range

so
tu
ev
ho
T
pr
ba
un
w
in
co
Water
oil the same a
ube to allow w
vaporation. T
ours to allow
The assembled
resented in Fi
ased on achie
nsaturated thr
which should c
nundated on D
ompleted.
Figure 4.1
is ponded on
as TN6I. Ano
water to be po
The sample w
the soil and v
d sample with
igure 4.122 b
eving a small
roughout the
cause a 2-4%
December 15,
121: Test No
n the top surfa
other clear Ple
onded. Also a
was sealed and
volumetric pr
h water ponde
elow. The am
change in wa
experiment.
change in gra
, 2010 and ran
151
o. 6 C Crack N
ace of the soil
exiglas tube w
a bag is sealed
d stored in the
robes equilibr
ed stored in th
mount of wate
ater content th
The amount o
avimetric wat
n until the sam
Number Loca
l profile and a
was glued to t
d at the top to
e environmen
rate to the sur
he environmen
er that is appl
hat would allo
of water adde
ter content. T
mple equilibra
ations.
allowed to inf
the top of the
o prevent any
ntal chamber f
rrounding env
ntal chamber
lied to the sam
ow the sample
ed was 120 gr
The sample w
ated or the te
filtrate the
sample
y unwanted
for 24
vironment.
is
mple was
e to be
rams
was
st was

m
th
w
de
ov
F
ex
Figur
The ex
moisture probe
hroughout its
was download
escribed prev
ver time. The
igure 4.123.
xperiment.
re 4.122: Tes
xperiment for
es recorded th
run time. Th
ed and impor
viously was us
e plot of the g
The sample d
st No. 6 C Sam
r TN6C ran fo
he water conte
he water conte
rted into an Ex
sed to determ
gravimetric w
did not compl
152
mple Stored i
or 1400 hours
ent every 60 m
ent data stored
xcel spreadsh
mine the gravim
water content o
letely equilibr
in Environme
s. During this
minutes. The
d on the data
heet for analy
metric water c
over time is p
rate in the tim
ental Chamber
s period the v
e test was mon
acquisition u
sis. The calib
content of the
presented belo
me allocated f
r.
olumetric
nitored
unit and
bration
e sample
ow in
for this

so
th
fo
The m
oil. The grav
he matric suct
or TN6C is pr
Figure 4
matric suction
imetric water
tion was inter
resented in Fi
Figure
4.123: Test N
was determin
r content was
rpolated from
igure 4.124.
4.124: Test N
153
No. 6 C Water
ned using the
converted to
the SWCC fo
No. 6 C Soil
r Content Pro
soil after cha
the volumetr
for the soil. T
Suction Profi
ofile.
aracteristic cu
ric water cont
The soil suctio
file.
urve for the
tent and
on Profile

is
w
be
th
vo
va
fr
The am
s shown in Fig
water complete
The ca
elow. The co
his chapter. T
olumetric mo
alues obtaine
rom of 150 to
mount of wate
gure 4.125 be
ely infiltrates
Figur
alculated unsa
onductivity va
The conductiv
oisture probes
d from TN6C
410 kPa. Th
er ponded on
elow. As show
the sample w
re 4.125: Tes
aturated hydra
alues are calcu
vity values we
and over 50
C range from
his plot is pres
154
top of the sam
wn in the plot
with the first4
st No. 6 C Inf
aulic conduct
ulated using t
ere calculated
day time peri
1.0*10^-11 to
sented in Figu
mple was reco
t below the le
450 hours of th
filtration Data
tivity values f
the approach
d for the interv
iods. The ran
o 6.3*10^-12
ure 4.126 belo
orded over tim
evel of the po
he experimen
a.
for TN6C are
previously de
val between t
nge of conduc
m/s over a su
ow.
me. This
onded
nt.
presented
escribed in
the two
ctivity
uction

Figure 4.1126: Test No. 6 C Coeffici
155
ients of Unsataturated Hydraaulic Conduc
ctivity.
156
CHAPTER 5: CONSIDERATIONS AND METHODS FOR DETERMINING THE UNSATURATED HYDRAULIC CONDUCTIVITY FOR INTACT AND
CRACKED CLAYS
Introduction The instantaneous profile experiments conducted in this study provided results
for the sandy clay soil tested over a wide suction range. The unsaturated hydraulic
conductivity values determined for the intact condition in the suction ranges chosen have
not been seen in current literature. The results from the seven instantaneous profile
experiments are presented in this chapter for the intact and cracked conditions. Various
models of the unsaturated hydraulic conductivity functions are used for analysis. With
these statistical and semi empirical functions fitted to the results, comments are made to
the fit and actual representation of the data obtained. Finally, a new model for the
unsaturated hydraulic conductivity function is proposed based on the results determined
from the experiments performed.
This chapter discusses considerations to the method used for determining the
unsaturated hydraulic conductivity values by the instantaneous profile method. Through
experimentation using the instantaneous profile method various considerations are
concluded to the general method, procedures and sampling method used. The analysis of
the data will be presented including combining all intact and cracked results from each
experiment for analysis. The considerations discussed in this chapter may provide insight
to the amount of scatter and trends in the data obtained from the experiments. Finally,
the intact and cracked unsaturated hydraulic conductivity results are compared and
analyzed.

157
Considerations of Method for Determining the Unsaturated Hydraulic Conductivity by the Instantaneous Profile Method
The first instantaneous profile experiments conducted in this study are Test
Numbers 1 and 2 (TN1 and TN2). These experiments are designed based on
recommendations from current literature. These two experiments are considered trial
experiments and were used to test the general method used and sampling procedures.
TN1 and TN2 use a long soil profile containing four different sections of different water
content compacted at the same dry densities. The results from these two experiment
produced results that were considered to have a high amount of scatter and not
representative of the actual hydraulic conductivity of the soil. Also because of the
manner in which the experiments were sampled, the results were considered prone to
inaccuracies.
The primary source of error encountered in TN1 and TN2 was due to the way the
experiment was sampled. The sampling procedure for TN1 and TN2 was performed by
driving a hollow into the soil profile to the center of the cross-section of the sample tube.
The hollow tube is then pulled out and the soil from the inside of the tube is used for a
water content measurement. From the hole created from driving the hollow tube, the
filter paper sandwich is then retrieved. After sampling is completed, another filter paper
sandwich is placed inside the hole. The hole is then re-compacted with the same soil
water content as measured from the sample recovered from the hollow tube. This method
of sampling allows for unwanted influence and disturbance to the soil profile and the
water content in each section.
The first disturbance issue for TN1 and TN2 is that the soil used to fill the hole
created from sampling is not exactly the same water content as the surrounding soil in the
soil profile. The required amount of time for a water content measurement is 24 hours, so
the soil is not replaced back into the soil profile for a total time of one day. The second

di
cr
co
th
ex
eq
re
th
co
pe
sa
of
fa
hy
an
di
w
isturbance iss
reates some u
ontinually rep
he surroundin
xperiments w
quilibrate. Ty
equire for the
Anoth
he direction o
ompaction in
erpendicular t
ampling, the s
f this compac
abric may hav
ydraulic cond
nd direction o
ifferent in the
which may hav
Figur
sue is that this
unwanted influ
placed during
ng soil in a spe
were conducted
ypical sampli
soil to equilib
er weakness i
f compaction
the direction
to the length
soil was comp
ction situation
ve a significan
ductivity has s
of compaction
e horizontal d
ve affected th
re 5.1: Test N
s continuous m
uence to the s
sampling eve
ecific soil sec
d at requires t
ng intervals w
brate may tak
in this method
n. During crea
of the length
of the sample
pacted in the
n is presented
nt effect on th
significant co
n (Mitchell an
direction from
he results.
No. 1 and Tes
158
method of sam
soil water con
ents, it may n
ction. The hig
that the soil to
were performe
ke longer than
d is the chang
ating the sam
h of the tube s
e tube. Durin
radial directio
in Figure 5.1
he conductivit
onsideration to
nd Soga, 2005
m the vertical d
t No. 2 Soil F
mpling and re
ntent. Becaus
not actually be
gh suction ran
o take a great
ed every 28 d
n this allowed
ge in the soil
mples for TN1
so that the cla
ng the replacem
on from the s
1 below. This
ty behavior o
o the orientati
5). The hydra
direction due
Fabric Sample
eplacing the s
se the soil is
e the water co
nge that the
t deal of time
days and the t
d time interva
fabric with re
and TN2 the
ay particles ar
ment of the s
sample tube.
s disturbance
of the soil. Th
ion of the soi
aulic conduct
to soil fabric
e Disturbance
soil,
ontent of
to
time
al.
espect to
e soil was
re oriented
oil from
A figure
in soil
he
il particles
tivity is
c effects
e.

159
The test method used for TN1 and TN2 uses four soil sections. The soil sections
are considered independent of each other. Controlling the suction and gradients between
these sections has proved to not be easy and involves a lot of considerations, assumptions
to the direction of flow, and if the sample section are wetting or dry. If different water
contents were chosen to gain a greater hydraulic gradient, the change in the water content
in the soil profile may be greater or less than time required to gain hydraulic conductivity
values. The rate of moisture flow is controlled and dependent of the soil hydraulic
conductivity. The experiments for TN1 and TN2 were not stored in a temperature
controlled environment but in the general lab area were the ambient temperature varied
significantly but not recorded. This temperature variation brings into consideration the
temperature effects onto the hydraulic conductivity which are not included in the scope of
this study.
With the deficiencies associated with this method of the instantaneous profile
method, improvements can be made to improve the method and gain more accurate
measurements with less influence from the test method and sampling procedures. Most
problems in these two experiments, TN1 and TN2 are associated with the sampling
method, number of soil sections, disturbance issues, apparatus size, initial soil conditions,
and environmental conditions. When these issues are considered, a new modification to
the instantaneous profile test was created. This modification is called the duplicate
method and is considered to produce more accurate measurements that resemble the
actually change in water content and suction in a soil.
The duplicate method is used in Test Numbers 3, 4, 5, and 7 which include both
intact and cracked experiments. The duplicate method consists of creating a number of
identical samples at the same time with the same soil conditions. The duplicate method
uses two soil section of different water content and use short sample tubes, 9 inches in

160
length. The number of duplicate samples created ranges from 4 to 6 samples, allowing
for a various range of sampling times. During the sample creation process, filter paper
sandwiches are placed in between soil compaction lifts in the soil profile to measure the
matric suction. The primary advantage of the duplicate method is that the samples can be
completely destroyed from sampling. Because of this, the water content measurements
along the soil profile can be very accurately measured using large water content samples
and multiple water content samples with a soil section. This cause the water content
samples to be more representative of the actual water content of the soil sampled. Also
the filter paper sandwiches can be easily retrieved from the specimens.
Other advantages of the duplicate method are that sample creation can be done
very easily and with little cost. The materials needed to perform the duplicate method
instantaneous profile experiment using manual water contents and filter paper tests can be
done only using plastic tubes, filter paper, plastic wrap and tape. Other equipment
includes common geotechnical equipment found in soil laboratories are used to create
and compact the samples. The duplicate method also allows for the user to choose the
suction range for which they desire to measure unsaturated hydraulic conductivity values
for. Since only two soil sections are used, the range of anticipated water contents and
suction is easily controlled. Also the gradient can be easily determined. The user can
also choose were to measure suction and water content and can be done at various
locations within the soil profile.
The duplicate method does have some disadvantages. The duplicate method
creates a large amount of variability and scatter of the unsaturated hydraulic conductivity
values calculated from various locations within the soil profile. This is due to the non-
homogeneous sample set, the fact that not all the soil sample encounter the same change
in water content and that not all the samples are compacted at exactly the same

161
conditions. The boundary effects of the sample apparatus also create some
disadvantages. The soils near the ends of the sample typically experience lower water
contents and suctions than anticipated. This may be due to possible evaporation and
desorption of water into the end cap seals. The scatter observed from the duplicate
experiments may also be a result of the soil fabric effects due to compaction of the soils
at different water contents. It has been discussed in literature that the soil fabric being
flocculated or dispersed has an effect on the hydraulic conductivity of a soil (Mitchell and
Soga 2005).
The vertical infiltration experiment Test No. 6 (TN6) performed well and as
expected. This experiment allowed for unsaturated conductivity values to be acquired in
the least amount of time. For the intact run for this experiment, the soil sample
equilibrated within 2500 hours. This experiment required significantly less time than the
duplicate method which during the testing period did not equilibrate within 300 days.
The results from the experiment also produce a nice trend in the unsaturated hydraulic
conductivity which is due to continuous measurement of the water content at the same
location in the soil profile over time. Note that no direct suction measurements were
made and the water content was measured using volumetric moisture probes. Limitations
of this method include that the water content of the soil must not reach complete
saturation in order to gain values in the unsaturated range. The amount of water added to
the sample must be carefully predetermined in order to not reach complete saturation at
any time during the experiment. Also this experiment was conducted at a lower suction
than other instantaneous profile experiments conducted in this study. It is unknown from
this study if this method could be used to gain hydraulic conductivity values at higher
suction greater than 1000kPa, but from vertical infiltration experiments conducted by Li,

162
Zhang and Fredlund, conductivity values were able to be measure at higher suctions
(2009).
The experiments conducted in this study have led to various considerations to
improvements that could be made to the instantaneous profile method. The
improvements discussed in the following are made from observations in this study and
considerations found in literature. The use of the duplicate method is a good
modification to the instantaneous profile experiment for determining unsaturated
hydraulic conductivity values over a wide range of suction and in high suction ranges.
One improvement to this method would be to incorporate various techniques to increase
the rate in the flow of water
The best way to decrease the amount of scatter in the unsaturated hydraulic
conductivity could be done by continual measurements the water content, matric suction
or both at location within the soil profile over time like in TN6. The use of various water
content and suction measurement devices could be implemented to record the soil water
content and matric suction over time at a single location within the soil profile. The
volumetric moisture probes used in this study proved to be accurate and reliable at
measuring the water content in the soil samples using the appropriate configuration of the
probes to increase the range of influence of the sensors. From experiments in this study
using these sensors some sensitivity to boundary and compaction conditions have led to
some inaccuracies but with careful considerations to installation and sample preparation
these inaccuracies could be minimized. Different types of sensors also seem promising
for measuring water contents and suctions at low water contents for this study as seen in
Table 5.1.
There are various method and techniques that could be used to measure the soil
matric suction. In this study, filter paper test were only used to measure suction but there

ar
m
su
us
co
th
T
in
on
bo
de
re
an
m
gr
T
co
re other meth
measuring soil
uction (Masro
sed to measur
onductivity se
he ability to m
Table5.1: Com
The us
n the instantan
n sensors that
oundary effec
evices such a
elated to the s
nd Fredlund,
more accurate
Anoth
radual change
To decrease th
ontent section
ods available
l suction” pre
ouri, Katia an
re soil suction
ensors. These
measure suctio
mmon Labora
se of large sam
neous profile
t have a speci
ct of the samp
s the volumet
space between
2009). Theor
the calculated
er recommen
e in water con
he effects of th
ns used in the
. The table b
sents various
d Kawai, 200
n over a wide
e sensors are
ons up to 400
atory Techniq
mple sizes co
experiment.
ific radius of
ple apparatus
tric moisture
n the water co
retically, the
d unsaturated
ndation to imp
ntent in the di
he sharp contr
duplicate me
163
below titled “C
techniques th
08). The mos
suction rang
also known a
0kPa.
ques for Meas
uld also incre
Many of the
influence. La
and have less
probes. Also
ontent and suc
closer the mo
d hydraulic co
prove the dupl
ifferent soil se
rast in water c
ethod, the soil
Common labo
hat could be u
st promising m
e would be th
as gypsum blo
suring Soil Su
ease the accur
measurement
arge sample s
s influence on
o the accuracy
ction monitor
onitoring poin
onductivity va
licate method
ection used in
contents betw
l sections cou
oratory techn
used to measu
method that co
he electrical/th
ock sensors an
uction (Masro
racy of measu
nt techniques u
sizes could de
n the measure
y of the test is
ring points (L
nts are to each
alues become
d would be us
n a sample sp
ween the two w
uld be prepare
iques for
ure soil
ould be
hermal
nd have
ouri 2008).
urements
used rely
ecrease the
ements
s also
Li, Zhang
h other the
.
se a more
pecimen.
water
ed to

164
gradually represent a gradual change in the water content from one section to the other.
This could be done by using three or four different sections of water content within a soil
sample. This modification could allow for the water to more easily transfer or move from
the wet to dry soil sections and increase the rate at which unsaturated hydraulic
conductivity values could be obtained decreasing the amount of time required to obtain
hydraulic conductivities.
Analysis of Results For analysis of the unsaturated hydraulic conductivity values or Kunsat values
for both the intact and cracked conditions, the results from each type of experiment are
combined. The intact experiments include Test Numbers 3, 6, and 7. The instantaneous
profile experiments Test Number 1 and 2 are not included in the intact Kunsat plots since
these points are not considered to be accurate, reliable or representative. The Kunsat
values calculated from TN1 and TN2 did not fit the expected trends and were conducted
at different conditions such as the testing environment so they are not included in the
intact Kunsat plot. The cracked experiments include Test Numbers 4, 5 and 6. In the
following the Kunsat plots for each condition, intact and cracked, will be presented along
with observation and conclusions of the results.
In another experiment conducted at San Diego State University performed in
parallel to the research project that this study was used for, unsaturated hydraulic
conductivity values were obtained in a lower suction range. The experiment at SDSU
was a tilt table experiment that studies the behavior of water infiltration for intact and
cracked conditions and with different sloped conditions. From the zero slope, intact
condition the volumetric water content data was provided to compute hydraulic
conductivity values from and are labeled at tilt table values or TT. The SWCC for the

so
vo
pr
is
a
in
in
w
hy
ex
co
va
oil was used t
olumetric wat
rofile from th
The K
s presented be
trend with in
ncreases. The
nstantaneous p
were obtained
ydraulic cond
xperiment in p
The un
onsidered in t
alues were ca
to interpolate
ter contents o
he experiment
Kunsat Plot for
elow in Figure
ncreasing varia
e data from ea
profile experi
in the desired
ductivities or
parallel with
Figure 5.2:
nsaturated hyd
the intact Kun
alculated from
suction value
over time wer
t. From this d
r the intact co
e 5.2. As pre
ability of the
ach experimen
iments TN3 a
d suction rang
Ksat measure
this study.
Kunsat Plot
draulic condu
nsat plot for th
m this experim
165
es from the vo
e provided fo
data the TT po
ondition from
sented in this
unsaturated h
nt does agree
and TN7, the u
ges. Both the
ements were m
from Various
uctivity points
he soil. Unsa
ment and are s
olumetric wat
or points at de
oints are com
the various e
s plot the cond
hydraulic con
e well with ea
unsaturated c
e intact and cr
made by Sam
s Intact Exper
s from TN1 a
aturated hydra
shown in the f
ter content da
epth with in th
mputed.
experiments c
ductivity valu
nductivity as s
ch other. For
conductivity p
racked, satura
m Abbaszadeh
riments.
and TN2 are n
aulic conduct
figure below.
ata. The
he soil
conducted
ues follow
suction
r the
points
ated
h during an
not
tivity
Figure

5
se
ot
no
pr
ex
co
in
pl
th
hy
T
.3 below pres
een in this plo
ther data poin
ot considered
revious sectio
Figure
The K
xperiments co
onductivity u
n TN6C with
lot show that
he intact data
ydraulic cond
TN5) from the
sents the Kuns
ot the data poi
nts from the o
d because of th
on in this chap
e 5.3: Kunsat
Kunsat Plot for
onducted is pr
sed in this plo
a crack volum
the cracked u
with increasi
ductivity from
e different sam
sat plot includ
ints from TN
other instantan
he various ina
pter.
t Plot for All I
r the various c
resented belo
ot is for the cr
me ratio aroun
unsaturated hy
ng scatter as
m the cracked
mple sets with
166
ding the point
1 and TN2 do
neous profile
accuracies in
Intact Instant
cracked cond
w in Figure 5
racked condit
nd 2-4% (Abb
ydraulic cond
suction increa
experiments
h different cra
ts taken from
o not fit the o
experiments.
the experime
taneous Profil
ditions from in
5.4. The satur
tion using the
baszadeh, 201
ductivity follo
ases. The val
using Method
acked specific
m TN1 and TN
overall trend o
. These point
ent described
le Experimen
nstantaneous
rated hydraul
e same crack p
11). The resu
ows a similar
lues of the un
ds B and C (T
cation do not
N2. As
of the
ts are also
in the
nts.
profile
lic
pattern as
ults on this
trend to
nsaturated
TN4 and
presented

an
sl
th
co
5
as
hy
be
in
dr
ny significant
light differenc
There
he intact and c
onditions add
.5 below from
ssociated with
ydraulic cond
ehavior of the
nstantaneous p
rying through
t differences.
ces in hydrau
Figure 5.4: K
are various a
cracked unsat
d a variation to
m Fredlund (2
h the differen
ductivity to th
e wetting and
profile experi
hout the testin
The points f
lic conductiv
Kunsat Plot fr
spects to cons
turated hydrau
o the permeab
2006) the prim
nce between th
he principal di
d drying hydra
iments perfor
ng period whi
167
from set 1, 2,
ity for a given
rom Various C
sider in relati
ulic conductiv
bility function
mary change i
he maximum
irection of an
aulic conducti
med some so
ch may also a
3 and 4 are v
n suction.
Cracked Expe
ion the scatter
vity data sets
n of the soil.
in the permea
and minimum
nisotropy. Th
ivity function
oil section exp
account for so
very similar w
eriments.
r of the data f
. Anisotropic
As shown in
ability functio
m coefficient
his is also simi
ns for a soil. I
perienced wet
ome of the sc
with only
for both
c soil
n Figure
on is
of
ilar to the
In the
tting and
atter.
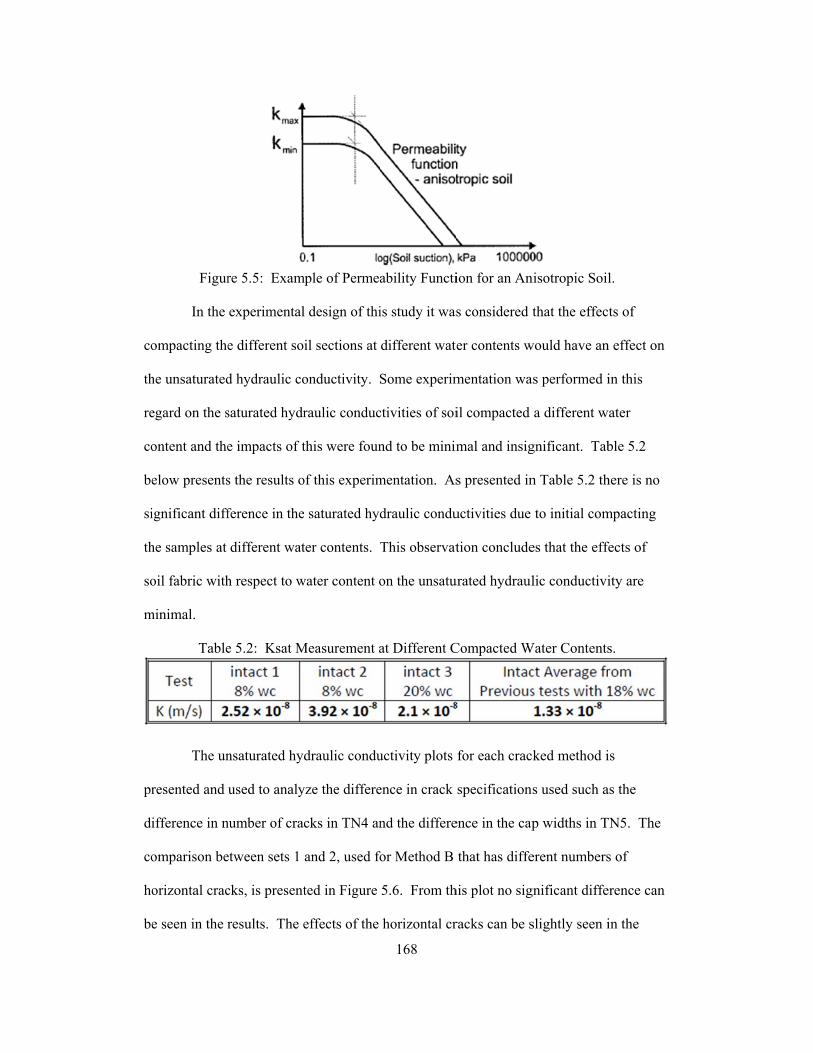
co
th
re
co
be
si
th
so
m
pr
di
co
ho
be
Figur
In the
ompacting the
he unsaturated
egard on the s
ontent and the
elow presents
ignificant diff
he samples at
oil fabric with
minimal.
Table
The un
resented and
ifference in n
omparison be
orizontal crac
e seen in the r
re 5.5: Exam
experimental
e different so
d hydraulic co
saturated hydr
e impacts of t
s the results o
ference in the
different wat
h respect to w
e 5.2: Ksat M
nsaturated hyd
used to analy
number of crac
etween sets 1
cks, is present
results. The e
mple of Permea
l design of thi
il sections at
onductivity. S
raulic conduc
this were foun
of this experim
saturated hyd
ter contents.
water content o
Measurement a
draulic condu
yze the differe
cks in TN4 an
and 2, used fo
ted in Figure
effects of the
168
ability Functi
is study it was
different wate
Some experim
ctivities of soi
nd to be minim
mentation. As
draulic condu
This observat
on the unsatu
at Different C
uctivity plots
ence in crack
nd the differe
for Method B
5.6. From th
horizontal cr
ion for an An
s considered t
er contents w
mentation wa
il compacted
mal and insig
s presented in
uctivities due
tion conclude
urated hydraul
Compacted W
for each crac
specification
ence in the cap
that has diffe
his plot no sig
racks can be s
nisotropic Soil
that the effec
would have an
as performed i
a different w
gnificant. Tab
n Table 5.2 th
to initial com
es that the effe
lic conductivi
Water Contents
ked method i
s used such a
p widths in T
erent numbers
gnificant diffe
slightly seen i
l.
ts of
n effect on
in this
water
ble 5.2
here is no
mpacting
fects of
ity are
s.
is
as the
TN5. The
s of
erence can
in the

w
in
fo
in
di
di
da
co
w
water content p
n the contour
or Set 2 with m
nsignificant.
The co
ifferent air ga
ifference can
ata points for
onductivities
water being ab
profile sampl
lines from Se
more horizon
Figure 5.6:
omparison of
ap widths is p
be seen in th
a given unsa
seem to occu
ble to transfer
e set compari
et 1 to Set 2 sh
ntal cracks. T
Comparison
the sample se
presented in F
e results. The
aturated condu
ur at a lower s
more quickly
169
ison in Figure
how that less
This difference
n of Kunsat V
ets 3 and 4 us
igure 5.7. Fr
e slight differ
uctivity. For
suction. This
y from one so
e 4.83. There
change in wa
e is still consi
alues for Test
sed for Metho
rom this plot o
rence can be s
Set 3, with th
result may be
oil section to t
e is a slight di
ater content o
idered to be
t No. 4.
od C for TN5
only a slight s
seen in the gr
he smaller air
e a consequen
the other.
ifference
occurred
that have
significant
roups of
gap, the
nce of the

as
in
w
th
m
3
is
th
The pr
s to simulate t
n determining
widths used fo
he air gap. Th
m/s and 2.0*10
are considere
s calculated ov
he gap.
Figure 5.7:
rimary objecti
the conductiv
g this water va
or both sample
he average co
0^-14 for Set
ed to be a min
ver the smalle
Comparison
ive of TN5 w
vity of an unsa
apor conducti
e sets. As sho
onductivity va
4. The condu
nimum value
est air gap an
170
n of Kunsat V
was to determi
aturated crack
ivity value for
own in Figure
alues over the
uctivity value
of the hydrau
d is the condu
alues for Test
ine the condu
k. This exper
r this situation
e 5.15 are the
e air gap for S
es calculated
ulic conductiv
uctivity of the
t No. 5.
uctivity over th
riment was su
n for the two
e results for TN
Set 3 are 8.4*1
over the air g
vity for the so
e water vapor
he air gap
uccessful
gap
N5 over
10^-15
gap for Set
oil since it
r flow over

st
be
re
L
pr
th
R
to
The in
tatistical and s
etween soil su
elationships w
Leong and Rah
resents the in
he data. Table
Refer to Chapt
o the data usin
Figur
Unsat
ntact unsaturat
semi empirica
uction and hy
were used incl
hardjo (1997)
tact unsaturat
e 5.2 in the fo
ter 2 for the e
ng the solver
re 5.8: Kunsa
urated Hydr
ted hydraulic
al fitting curv
ydraulic condu
luding the Ga
), and the Kun
ted hydraulic
ollowing pres
quations of th
function in E
at Curves Fit t
171
raulic Condu
conductivity
ves to the data
uctivity, so th
ardner (1958),
nze et al (196
conductivitie
ents the fittin
he models use
Excel.
to Intact Unsa
uctivity Mode
y results are u
a. There are n
he most comm
, van Genuch
8) models. T
es along with
ng parameters
ed. The fittin
aturated Cond
els
sed to fit vari
numerous rela
monly used
hten-Mualem
The plot in Fig
the models u
s used in the m
ng parameters
ductivity Data
ious
ationships
(1980),
gure 5.8
used to fit
models.
s were fit
a.

172
Table 5.3: Fitting Parameters for Various Kunsat Functions Used.
The Kunze (1968) model used is based off the SWCC of the soil. This model
determined the unsaturated hydraulic conductivity from the pore size distribution and
also uses matching factor. To gain a good fit using this model the drying curve from the
SWCC must be used (Kunze 1968). According the Michel and Soga (2005), this
computation procedure is most successful for sand soils having a relatively narrow pore
size distribution which may be the reason that this relationship does not fit to the data
well.
The semi empirical relationships used to model the unsaturated hydraulic
conductivity fit the data well using the fitting parameters shown in Table 5.2. The
Gardner and van Genuchten-Mualem models fit the data well but to not accurately
predict the conductivity behavior at high suctions. Figure 5.8 also shows that the
hydraulic conductivity functions continuously decrease after the air entry value of the
soil. Research done by Ebrahimi-B, Gitirana Jr., D. Fredlund, M. Fredlund and
Samarasekera (2006) suggest that there is a lower limit for the water permeability
coefficient equal to 1*10^-14 m/s. This lower limit agrees well with the minimum values
of hydraulic conductivity calculated from the instantaneous profile experiments
performed in this study. With this consideration of a lower limit to the hydraulic
conductivity, the use of these type of semi empirical functions that continuously plummet
after the air entry value may not be suitable or accurate to the actual unsaturated
conductivity function for the soil and may have impactions in use for modeling the
unsaturated hydraulic conductivity of soils at high suction values.
a m n R^2Gardner (1958) 0.025 2.815 89.38%Leong and Rahardjo (1997) 59.590 2.505163 2.517 89.69%Van Genuchten and Maulem (1980) 1.000E-09 0.92 6.020 89.35%
EquationFitting Parameters

vi
be
hy
ai
th
va
al
co
m
be
S
pe
un
The Le
isual standpo
egins to level
ydraulic cond
To bet
ir-vapor phas
he Figure 5.9
alue and the r
lready consid
onductivity fo
model. In the
ecomes a fun
In the
amarasekera
ermeability fo
nsaturated hy
eong and Rah
int and also h
l off near the r
ductivity beha
Proposed Un
tter model the
es and transit
below, the tra
residual condi
ders the unsatu
or suctions up
transition zon
ction of the d
Figure 5.9
work done by
(2006) sugge
or all soils eq
ydraulic condu
hardjo (1997)
has a good cor
residual sucti
avior of the so
nsaturated H
e unsaturated
tions between
ansition zone
itions. Mode
urated conduc
p to the air en
ne as depicted
desaturation o
9: Desaturati
y Ebrahimi-B
est that there i
qual to 1*10^-
uctivities and
173
model best fi
rrelation or R
ion which ma
oil.
Hydraulic Co
hydraulic con
n these phases
s in the SWC
els of the unsa
ctivity to be e
try value such
d in Figure 5.9
f the pores as
ion Zones De
B, Gitirana Jr.,
is a lower lim
-14 m/s. In th
vapor condu
fit the experim
R-squared valu
ay be more rea
onductivity F
nductivity of
s are consider
CC cure are di
aturated hydra
equal to the sa
h as the Broo
9, the unsatur
s suction incre
fined by a SW
, D. Fredlund
mit to the coeff
heir analysis t
uctivity functi
mental data fro
ue. This func
alistic to the a
Function
the soil, the s
red. As illustr
ictated by the
aulic conduct
aturated hydra
oks and Corey
rated conduct
eases.
WCC.
d, M. Fredlund
fficient of wat
they examine
ons to analyz
om a
ction
actual
soil-water-
rated in
air entry
tivity
aulic
y (1964)
tivity
d and
ter
d the
ze the

be
ra
th
en
va
en
co
th
pr
an
co
eq
su
co
ehavior of the
ange up to 1*
he soil is at th
ntering the po
apor conducti
ntire permeab
onductivities.
Figure 5.10:
With t
his study are u
roposed. The
nd residual be
onductivity is
qual to the sat
uction increas
onductivity an
e unsaturated
10^6 kPa. In
he highest valu
ores of the soi
ivity dominat
bility function
Variation of
the considerat
used, a new p
e primary fact
ehaviors of so
s considered t
turated hydra
ses at a rate d
nd a fitting pa
hydraulic con
n Figure 5.10 b
ue when the s
il. When the
tes the overall
n of a soil is a
f Liquid Watewith
tions provided
roposed unsa
tors in the pro
oil hydraulic c
to be constant
aulic conducti
etermined by
arameter. Th174
nductivity fun
below, the au
soil is saturate
conductivity
l conductivity
a combination
er, Vapor, andSoil Suction
d by Ebrahim
aturated hydra
oposed functio
conductivity.
t from zero su
ivity of the so
y the maximum
e hydraulic co
nction of a so
uthor’s state th
ed and starts t
reaches the r
y of the soil.
n of both the s
d Overall Per.
mi-B et al. (20
aulic conducti
on incorporat
For the prop
uction to the a
oil. The soil c
m and minimu
onductivity fu
oil over a wid
hat the condu
to decline as
residual condi
This suggests
soil-water and
rmeability Co
06) and resul
ivity function
te both the sa
posed function
air entry value
conductivity d
mum hydraulic
function levels
e suction
uctivity of
air starts
ition the
s that the
d vapor
efficient
lts from
n was
aturated
n, the
e and
declines as
c
s off at the

m
m
hy
be
fu
hy
ph
do
so
re
5
so
minimum unsa
minimum cond
The be
yperbolic pro
elow.
This e
unction will s
ydraulic beha
hases at high
ominate the u
olution to the
epresentation
.11. The hyp
ome modifica
aturated hydra
ductivity calc
est empirical
ofile equation
quation states
teadily levels
avior because
suctions were
unsaturated hy
equation is p
and paramete
erbolic profil
ations.
tanh
Figure 5.11:
aulic conduct
ulated from T
function that
which is a so
s a y increase
s off to a cons
is represents
e the vapor ph
ydraulic cond
present below
ers of this hyp
le is used to m
Example of H
175
ivity or Kmin
TN5 as the co
could be used
olution to a lo
s over x, that
stant value. T
the competit
hase overcom
ductivity near
as a hyperbo
perbolic profi
model the uns
Hyperbolic P
n which shoul
onductivity ov
d to model th
ogistical equat
(E
y will becom
This equation
tion between t
mes the water
the residual c
olic function.
ile equation a
aturated hydr
(E
rofile and Par
ld be equal to
ver the air gap
his behavior is
tion which is
Eqn. 5.1)
me saturated a
suits unsatur
the water and
phase which
condition. Th
The standard
are shown in F
raulic conduc
Eqn. 5.2)
rameters.
o the
p.
s a
shown
and
ated
d vapor
should
he general
d graphical
Figure
ctivity with

176
Using the hyperbolic profile and the modifications below, parameters in the
equation are fit to the unsaturated hydraulic conductivity values for the used soil in this
study. The averaging of the saturated (maximum) and minimum hydraulic conductivities
and air entry value and residual suctions allows for the translation of the function for an
appropriate fit to the data.
(Eqn. 5.3)
(Eqn. 5.4)
(Eqn. 5.5) (Eqn. 5.6)
log log tanh (Eqn. 5.7)
Parameters: : Soil suction. : Soil air entry value. : Residual suction value. : Saturated Hydraulic Conductivity. : Minimum unsaturated hydraulic conductivity. The simplified form of the proposed unsaturated hydraulic conductivity function
using relevant soil parameter, , , , and and two fitting parameters
a and b is presented below. The fitting parameter a, is related to the slope in the
transition zone. The fitting parameter b reduces the residual suction value to increase the
fit to the data. The residual suction value is related to the residual water content from the
SWCC and is sometimes hard to accurately determine a representative value for.

in
hi
sa
th
Param
This p
nstantaneous p
igh suction ra
aturated hydra
he instantaneo
meters: : :
roposed mod
profile experi
anges and this
aulic conduct
ous profile res
Figure 5.
10
: UnsaturateFitting paramFitting param
el is formulat
iments perfor
s model better
tivity and the
sults and is pr
12: Proposed
177
d hydraulic cmeters relatedmeters related
ted to better r
med in this st
r represent th
minimum co
resented in Fi
d Kunsat Fun
(E
conductivity.d to the slope d to the residu
represent the r
tudy. Values
he data by taki
nductivity. T
igure 5.12 bel
nction Fit the D
Eqn. 5.9)
in the transitiual suction val
results from t
s were determ
ing into accou
This model wa
low.
Data.
ion zone. lue.
the
mine in
unt the
as fit to

178
The values used for the inputs into the proposed unsaturated hydraulic
conductivity function, for the saturated and minimum conductivities and the air entry
value and residual suction are presented below.
Table 5.4: Input Parameters to Proposed Kunsat Function.
The proposed unsaturated hydraulic conductivity function fit the results from the
instantaneous profile experiment well and better resembles the actual behavior of the
permeability of a soil taking into account a minimum conductivity. When this model is
compared to other soil hydraulic conductivity models found in literature, the results
indicate a better fit according to the R-squared values and shown in Table 5.4 below.
Table 5.5: Fitting parameters Used for Proposed Kunsat Function and Comparison to Other Kunsat Models.
Comparison and Analysis of Intact and Cracked Unsaturated Hydraulic Conductivity Results
To analyze the effect of air voids and cracks to the unsaturated hydraulic
conductivity, the intact and cracked results are compared. The scope of this analysis is
limited to the suction range for which the instantaneous profile experiments were
conducted at. The cracked instantaneous profile experiments TN4 and TN5 can be
compared to the intact data sets from TN3, TN6I and TN7. The results for both intact
and cracked vertical infiltration experiments from TN6 are compared to each other since
Ksat (m/s) 1.33E-08Kmin (m/s) 6.10E-15Residual Suction (kPa) 20000Air Entry Value (kPa) 20a 0.61b 0.45
a b m n R^2Gardner (1958) 0.025 2.815 89.38%Leong and Rahardjo (1997) 59.590 2.505163 2.517 89.69%Van Genuchten and Maulem (1980) 1.000E-09 0.92 6.020 89.35%Proposed Function 0.61 0.45 89.49%
Fitting ParametersEquation

th
se
in
to
w
va
di
in
T
re
th
hey were cond
ection conclu
ntact and crac
The cr
o the intact re
within the scat
alues from TN
ifference betw
F
The cr
nstantaneous p
The conductiv
epresented as
his plot show
ducted in the
sions are pres
cked condition
racked unsatu
sults in Figur
tter of the inta
N4 fall within
ween the intac
Figure 5.13:
racked unsatu
profile experi
ities calculate
the lower con
that the resul
same manner
sented from th
ns are examin
urated hydraul
re 5.13. As pr
act data. Mos
n the band of
ct and cracked
Kunsat Comp
urated hydraul
iment TN5 ar
ed over the ai
nductivity con
lts from TN5
179
r in using the
he results of t
ned.
lic conductivi
resented in th
st of the unsat
data for TN3
d conditions f
parison of Tes
lic conductivi
re compared t
r gap are incl
nductivities f
fall within th
same soil con
this study and
ity results fro
his plot, the re
turated hydra
. The data sh
for this exper
st No. 4 to In
ity results fro
to the intact re
luded in the T
for TN5. The
he scatter of th
nditions. In t
d the differenc
om TN4 are co
esults from TN
aulic conducti
hows no signi
riment.
ntact Data.
om the air gap
esults in Figu
TN5 results an
e results prese
he intact data.
this
ces in the
ompared
N4 fall
ivity
ificant
p cracked
ure 5.14.
nd are
ented in
. Most of

th
T
T
po
en
co
co
th
co
co
he unsaturated
TN3 with a few
The results fro
oints calculat
F
The co
ntire intact da
onductivities
onductivity v
he conductivit
onductivities
onductivity su
d hydraulic co
w points fallin
om TN5 show
ted over the ai
Figure 5.14:
onductivities c
ata set in Figu
over the air g
alues. This w
ty of the wate
calculated ov
uggested by E
onductivity va
ng into the ran
w not significa
ir gap.
Kunsat Comp
calculated ov
ure 5.15. In th
gap are less th
was expected
er-vapor trans
ver the air gap
Ebrahimi-B et
180
alues from TN
nge of data fr
ant difference
parison of Tes
ver the air gap
his figure it ca
han the majori
since the con
sfer potential
p are less than
t al. (2006) w
N5 fall within
rom TN7 in a
from the inta
st No. 5 to In
p from TN5 ar
an be observe
ity intact unsa
nductivity ove
of the soil. A
n the minimum
which is 1*10^
n the band of
a lower suctio
act results bes
ntact Data.
re compared t
ed that the
aturated hydr
er the air gap
Also some of
m value of hy
^-14 m/s.
data from
n range.
sides the
to the
raulic
should be
the
ydraulic
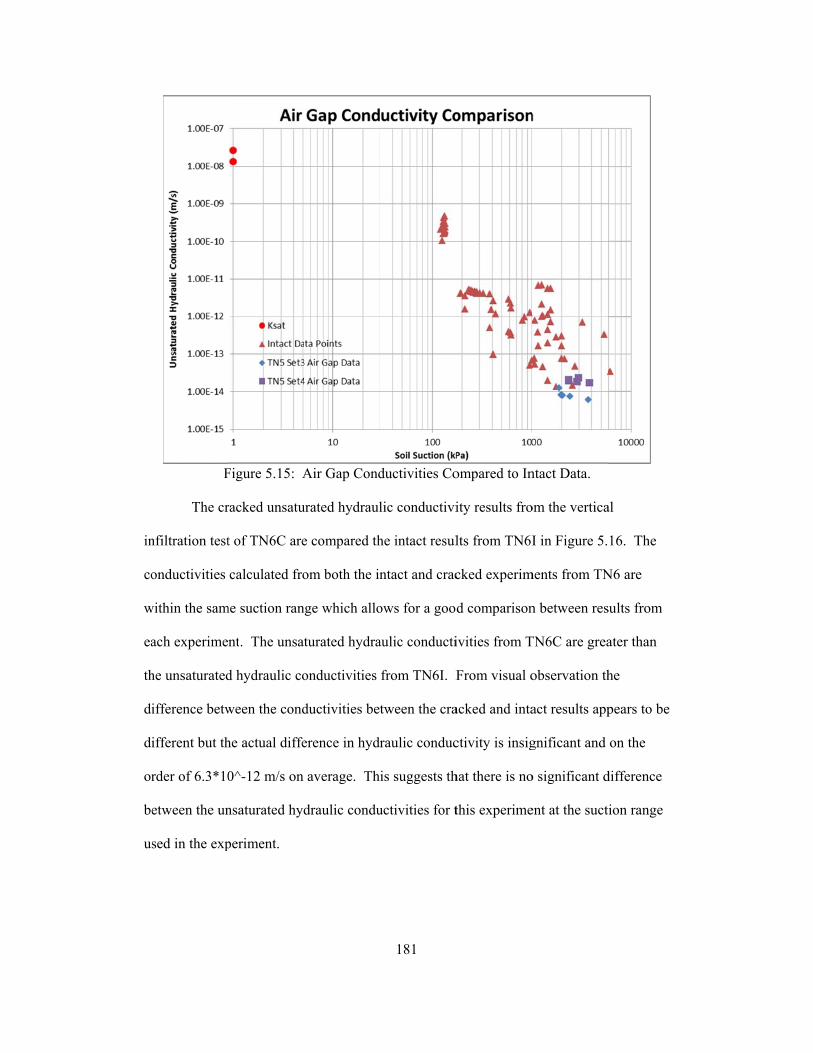
in
co
w
ea
th
di
di
or
be
us
F
The cr
nfiltration test
onductivities
within the sam
ach experime
he unsaturated
ifference betw
ifferent but th
rder of 6.3*10
etween the un
sed in the exp
Figure 5.15: A
racked unsatu
t of TN6C are
calculated fro
me suction ran
nt. The unsat
d hydraulic co
ween the cond
he actual diffe
0^-12 m/s on
nsaturated hyd
periment.
Air Gap Cond
urated hydraul
e compared th
om both the in
nge which allo
turated hydra
onductivities
ductivities bet
erence in hydr
average. Th
draulic condu
181
ductivities Co
lic conductivi
he intact resul
ntact and crac
ows for a goo
aulic conducti
from TN6I. F
tween the cra
raulic conduc
is suggests th
uctivities for t
ompared to In
ity results fro
lts from TN6I
cked experim
d comparison
ivities from T
From visual o
acked and inta
ctivity is insig
hat there is no
this experime
ntact Data.
om the vertica
I in Figure 5.
ments from TN
n between res
TN6C are grea
observation th
act results app
gnificant and
o significant d
ent at the suct
al
16. The
N6 are
sults from
ater than
he
pears to be
on the
difference
ion range
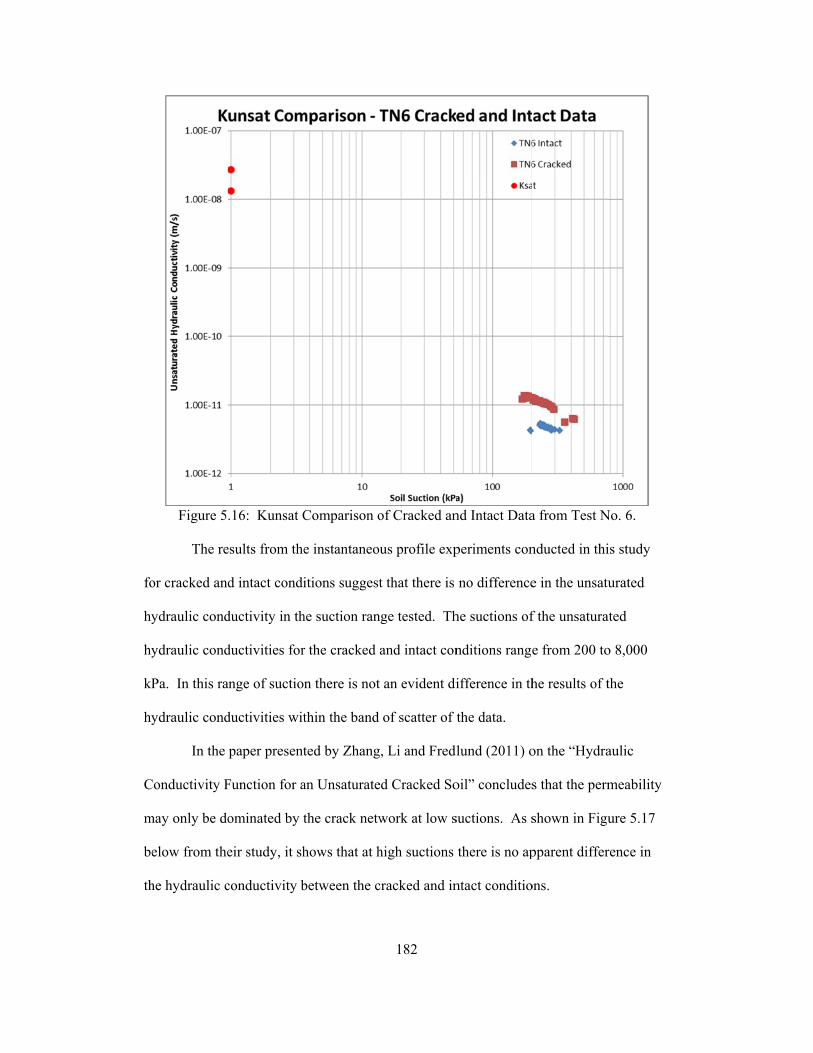
fo
hy
hy
kP
hy
C
m
be
th
Figure 5
The re
or cracked and
ydraulic cond
ydraulic cond
Pa. In this ra
ydraulic cond
In the
Conductivity F
may only be do
elow from the
he hydraulic c
.16: Kunsat C
esults from the
d intact condi
ductivity in th
ductivities for
ange of suction
ductivities wit
paper present
Function for a
ominated by t
eir study, it sh
conductivity b
Comparison o
e instantaneou
itions suggest
he suction ran
r the cracked a
n there is not
thin the band
ted by Zhang
an Unsaturate
the crack netw
hows that at h
between the c
182
of Cracked an
us profile exp
t that there is
ge tested. Th
and intact con
an evident di
of scatter of t
, Li and Fredl
d Cracked So
work at low s
high suctions
cracked and in
nd Intact Data
periments con
no difference
he suctions of
nditions range
ifference in th
the data.
lund (2011) o
oil” concludes
suctions. As s
there is no ap
ntact conditio
a from Test N
nducted in thi
e in the unsatu
f the unsatura
e from 200 to
he results of t
on the “Hydra
s that the perm
shown in Figu
pparent differ
ons.
No. 6.
is study
urated
ated
o 8,000
the
aulic
meability
ure 5.17
rence in
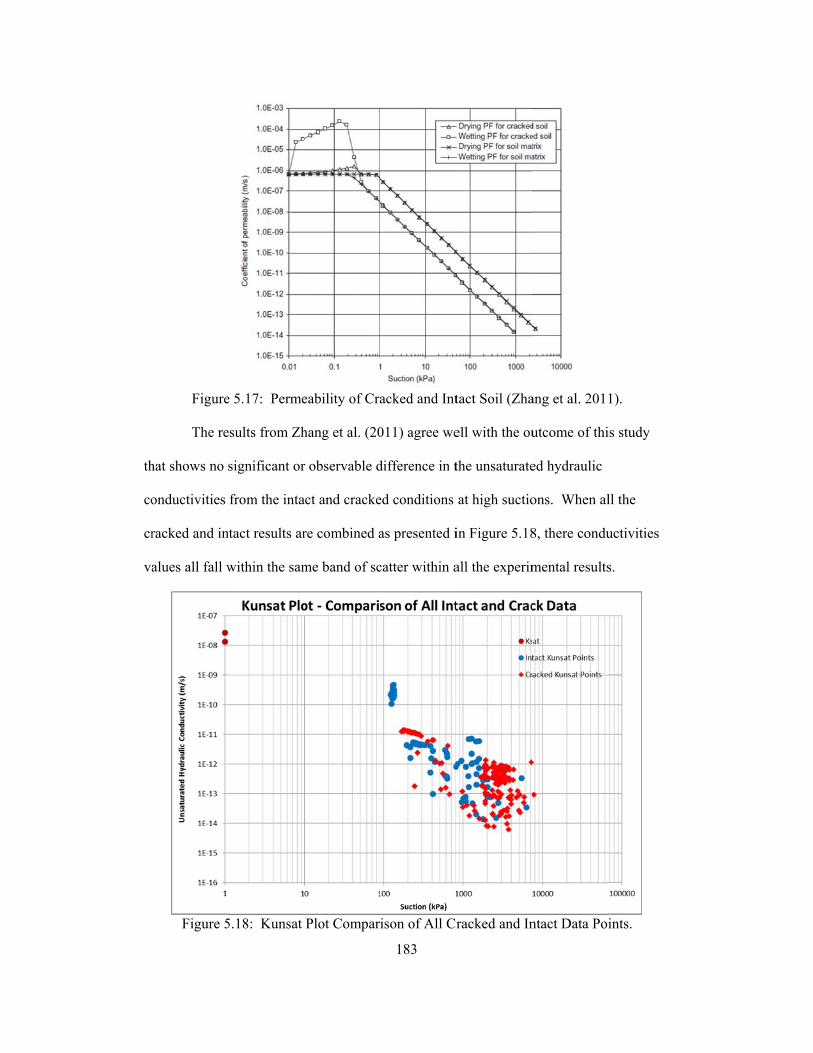
th
co
cr
va
Figure
The re
hat shows no
onductivities
racked and in
alues all fall w
Figure 5
e 5.17: Perme
esults from Zh
significant or
from the inta
ntact results ar
within the sam
5.18: Kunsat
eability of Cra
hang et al. (20
r observable d
act and cracke
re combined a
me band of sc
Plot Compar
183
acked and Int
011) agree we
difference in t
ed conditions
as presented i
catter within a
ison of All Cr
tact Soil (Zha
ell with the ou
the unsaturate
at high suctio
in Figure 5.18
all the experim
racked and In
ang et al. 201
utcome of thi
ed hydraulic
ons. When al
8, there condu
mental results
ntact Data Poi
1).
is study
ll the
uctivities
s.
ints.
184
CHAPTER 6: CONCLUSIONS AND RECOMMENDATIONS Determining the unsaturated hydraulic conductivity of a fine grained soil is a
tedious and time consuming process. Implications and considerations increase in
complexity, when measuring the unsaturated hydraulic conductivity for a cracked soil. In
this study, seven instantaneous profile experiments were designed and conducted to
measure the unsaturated hydraulic conductivity for intact and cracked fine grained soil.
The experiments performed in this study provide insight to various aspects to the
measurement, experimental design, calculation, and procedures used for measuring the
unsaturated hydraulic conductivity of a soil. A summary of the research conducted is
presented below along with the conclusions to the research objectives and
recommendations for future research related to the measurement of the unsaturated
hydraulic conductivity for fine grained soils.
Summary In chapter 1, the scope of the research performed in this study was outlined along
with the objectives and importance of this research. Cracked fine grained soils present
various implications to the design of infrastructure and foundation construction.
Desiccation cracking can occur in numerous situations and understanding the behavior of
the water flow is of great importance. In the analysis of some soil systems, the
unsaturated hydraulic conductivity is a significant parameter since is used to model water
flow, infiltration, volume change and the triggering of landslides (Li, Zhang and
Fredlund, 2009). There has been little research done on the implications of cracks and
fissures to the unsaturated hydraulic conductivity which provided the opportunity to
assess these effects.

185
It is important to model the hydraulic properties of cracked soils to investigate
the effect on the infiltration rate. The measurement of the saturated hydraulic
conductivity can be done through a relatively simple experiment and comparing the
hydraulic conductivity of the cracked and intact condition can be done. The
instantaneous profile method is an unsteady-state method that is used to measure the
unsaturated hydraulic conductivity. There are several variations of this method which
primarily differ in the general method used, sampling procedures and the way water is
removed or introduced into the system. For the cracked condition, measuring the
unsaturated hydraulic conductivity can be done similarly to the intact condition by
incorporating cracks into the soil profile so that their effects can be analyzed by
comparing the results from each condition.
The objectives of this study were to i) analyze the effects of air voids or cracks
on the unsaturated hydraulic conductivity; ii) research and summarize the methods used
for measuring the unsaturated hydraulic conductivity for cracked soils, and iii) propose
special considerations for measuring the unsaturated hydraulic conductivity by the
instantaneous profile method, including recommendations that deal with the prediction of
the unsaturated hydraulic conductivity.
In chapter 2, a literature review was conducted in order to provide insight into
current methods and techniques used for measuring the unsaturated hydraulic
conductivity for intact and cracked fine grained soil. In general, it was found that the
subject of unsaturated hydraulic conductivity has been studied by researchers, but the
publications are limited.
It was found in the literature that there are various functions that can be used to
predict the unsaturated conductivity. The equations presented and used are semi
empirical in nature and have been developed from statistical equations which are used to

186
model the conductivity behavior of soil. The equations presented by Broods and Corey
(1964), Gardner (1958), van Genuchten et al. (1980), Arbhabhirama and Kridakorn
(1968), and Leong and Rahardjo (1997) are equations that use statistical fits to model the
unsaturated coefficient of permeability function. All of these functions include empirical
constants that may relate to specific soil properties such as the air entry value and the
slope of the SWCC at the deflection point. Gardner (1958) and van Genuchten (1980)
equations are the most common equation used to model the unsaturated conductivity
function.
In geotechnical engineering there are numerous methods to measure the
unsaturated hydraulic conductivity of a soil. The unsaturated hydraulic conductivity can
be measured using direct or indirect techniques (Fredlund and Rahardjo, 1993). The
most practical and promising method for determining the unsaturated hydraulic
conductivity is the instantaneous profile method. The instantaneous profile method is an
unsteady state method that can use direct or indirect measurements. The method uses a
cylindrical specimen of soil that may be subjected to a continuous flow of water. Many
researchers have used instantaneous profile experiments to determine the unsaturated
hydraulic conductivity. This method is performed frequently in unsaturated soil testing
and is an acceptable direct technique of testing. On the other hand, researchers have
noted that the Kunsat function can be affected by the use of the soil water characteristic
curve to calculate suction and to calculate gradient terms. This suggests that the indirect
measurement used should be made from a well-established and accurate soil water
characteristic curve.
The apparatus used for most instantaneous profile experiment is a rigid form
cylindrical tube. Data was compiled of the length and size of the apparatus used in each
instantaneous profile experiment reviewed.

187
Regarding the effect of the presence of cracks on the unsaturated hydraulic
conductivity, it was found that this is a topic in unsaturated soil mechanics that is still not
fully understood. There is very limited research available to the behavior of soils when
there are cracks. The considerations from the review of the studies performed by various
researchers on the hydraulic behavior of cracks in fine grained soils offers some
considerations to the experimental design that were used in this study.
One of the objectives of this research work was to analyze the effects of air void
and cracks on the unsaturated hydraulic conductivity. The soil used for the study was
fully characterized as a Clayey Sand (SC) through an extensive testing program to index
the soil. The complete geotechnical analysis and testing is shown in chapter 3. Also the
experimental designed is outlined and explained. To analyze the hydraulic behavior of
the soil, separate experiments were conducted to test the intact and cracked conditions
using the instantaneous profile method.
To determine the coefficient of permeability for intact soil, the instantaneous
profile experiment was used. Two different types of experiments were performed: The
first instantaneous profile experiments titled Test Number 1 (TN1) and Test Number 2
(TN2) were trial experiments which were used to provide information on the accuracy
and quality of the methods used for measurement and the overall experiment
performance. Test Number 3 (TN3) and Test Number 7 (TN7) are also intact
instantaneous profile experiments. These experiments were designed from observations
and problematic issues encountered in TN1 and TN2 that were improved. Some
improvements include the sampling methods, testing procedures and the general method
used. The changes made were significant for TN3 and TN7 and the experiment use the
duplicate method.

188
The objective of the cracked instantaneous profile experiments was to measure
the unsaturated hydraulic conductivity for the cracked condition. The cracked
experiments differed from the intact experiments in that they have cracks or voids formed
into the soil profile. Different methods were proposed in order to simulate and measure
the infiltration process of water through a cracked surface. Differences between
experiments included the orientation and direction of the cracks with respect to the soil
profile and the path of water flow. These experiments also allowed for the anisotropy
and crack orientation effects to be considered. To analyze the aspects of water flow
through the soil three methods were proposed to each simulate a different direction of the
water flow with respect to the crack orientation.
In chapter 4, the computation and calculation procedures used to determine the
unsaturated hydraulic conductivity were discussed. Also, the methods used to measure
suction and water content were outlined, and the results of the intact and cracked
experiments were presented. Seven planned instantaneous profile experiments titled Test
Numbers 1 through 7 were conducted at Arizona State University. The samples from
each experiment were stored in a controlled environment by using an environmental
chamber located in the basement of ISTB2 at ASU except for TN1 and TN2 which were
stored in the Geotechnical laboratory area.
The results of the five intact instantaneous profile experiments were presented, as
well as the results of the three cracked instantaneous profile experiments. The initial soil
conditions, set up procedures, measurement locations, testing conditions, sampling
procedures, observations during the experiments, and results were discussed and
presented.
In chapter 5, the analysis of the results was presented for the cracked and intact
conditions along with consideration of the method used for determining the unsaturated

189
hydraulic conductivity by the instantaneous profile method. Also, the use of unsaturated
hydraulic conductivity models was presented and a new unsaturated hydraulic
conductivity model is proposed. Various considerations to the general methods,
sampling methods, sampling procedures and storage conditions used were also discussed.
The instantaneous profile experiments conducted in this study provide results for the
sandy clay soil tested over a wide suction range. The unsaturated hydraulic conductivity
values determined for the intact condition in the suction range tested have not been seen
in current literature reviewed. In the analysis of the unsaturated hydraulic conductivity
values for both the intact and cracked conditions, the results from each type of
experiment are combined. The intact experiments include Test Nos. 3, 6, and 7. The
cracked experiments include Test Nos. 4, 5 and 6.
The unsaturated hydraulic conductivity plots or Kunsat plots for the intact
condition from the various experiments conducted are presented. The Kunsat plots show
that the conductivity values follow a trend with increasing variability of the unsaturated
hydraulic conductivity as suction increases. The data from each experiment type does
agree well with each other. The results from instantaneous profile experiments TN3 and
TN7 show that unsaturated conductivity values could be obtained in the desired suction
ranges. The results from these experiments show that the cracked unsaturated hydraulic
conductivity follows a similar trend as to the intact results with increasing scatter as
suction increases. The points from the cracked experiments using Methods B and C
(TN4 and TN5), from the different sample sets, with different cracked specification do
not presented any significant differences.
There are various aspects to consider in relation the scatter to the data for both
the intact and cracked unsaturated conductivity data sets. Anisotropic soil conditions add
a variation to the permeability function of the soil. The primary change in the

190
permeability function is associated with the difference between the maximum and
minimum coefficient of hydraulic conductivity to the principal direction of anisotropy.
This is also similar to the behavior of the wetting and drying functions of a permeability
function. In the instantaneous profile experiments performed show that some soil
sections experienced wetting and drying through the testing which may also account for
the amount of scatter in the hydraulic conductivities.
Using the intact unsaturated hydraulic conductivity data and results, various
statistical and semi empirical models were fit to the data. There are numerous
relationships between soil suction and hydraulic conductivity, so the most commonly
used models were used including the Gardner (1958), van Genuchten-Mualem (1980),
Leong and Rahardjo (1997), and the Kunze et al (1968) relationships. The semi
empirical relationships used to model the unsaturated hydraulic conductivity fit the data
well. The Gardner and van Genuchten-Mualem models fit the data well but do not
accurately predict the conductivity behavior at high suctions. Research done by
Ebrahimi-B, Gitirana Jr., D. Fredlund, M. Fredlund and Samarasekera (2006) suggests
that there is a lower limit for the water permeability coefficient equal to 1*10^-14 m/s.
This lower limit agrees well with the minimum values of hydraulic conductivity
calculated from the instantaneous profile experiments performed. With this
consideration, using these types of semi empirical functions that continuously plummet
after the air entry value may not be accurate to the actual unsaturated conductivity
behavior for the soil and may have impactions in the use of modeling soils at high
suctions. The Leong and Rahardjo (1997) model best fit the experimental data from a
visual standpoint and also has a good correlation value. Also this function begins to level
off near the residual suction which may be more realistic to the actual hydraulic
conductivity behavior of the soil.

191
To better model the unsaturated hydraulic conductivity of a soil, the soil-water-
air-vapor phases and transition between these phases should be considered. With the
consideration provided by Ebrahimi-B et al. (2006) and the results from this study a new
proposed unsaturated hydraulic conductivity function was proposed. The primary factors
in the proposed function incorporate both the saturated and residual behaviors for soil
permeability. This proposed model is formulated to better represent the data from the
instantaneous profile experiments performed in this study. Since values were determine
in high suction ranges, the model better represents the data by taking into account the
saturated hydraulic conductivity and the minimum conductivity from TN5 over the air
gap. The proposed unsaturated hydraulic conductivity function fits the results from the
instantaneous profile experiment well due to its correlation values are compared to other
relationship used to model the results of this study.
To analyze the effect of air voids and cracks on the unsaturated hydraulic
conductivity, the intact and cracked results were compared. The scope of this analysis
was limited to the suction range for which the instantaneous profile experiments were
conducted at and to the results of these experiments. The cracked instantaneous profile
experiments TN4 and TN5 can be compared to the intact data sets from TN3, TN6I and
TN7. The results for both intact and cracked vertical infiltration experiments from TN6
are compared to each other since they were conducted in the same manner at the same
suction range. The results from TN4 fall within the scatter of the intact data and
therefore, the results showed no significant difference between the intact and cracked
conditions. Furthermore, the results from TN5 fall within the scatter of the intact data.
Hence, data from TN5 showed no significant difference from the intact data besides the
points calculated over the air gap.

192
The results and conclusion from Zhang et al. (2011) agree well with the outcome
of this study that shows no significant or observable difference in the unsaturated
hydraulic conductivities from the intact and cracked conditions at high suction values.
Conclusions The outcome of this research study on the unsaturated hydraulic conductivity
measurements on an intact and cracked fine grained soil has given insight into various
aspects of the hydraulic behavior of water through soil. Due to the conditions of testing,
the results of the hydraulic conductivity from experimentation are within the high suction
range for soils. From the comparison of the results from the intact and cracked
unsaturated hydraulic conductivity data obtained, it was found that there was no
significant difference between the intact and cracked conductivity functions for the
suction range tested. This result confirms finding provided by Zhang et al. (2011). The
methods used to analyze the presence of cracks in a soil profile to their unsaturated
hydraulic conductivity values performed as desired.
Overall from this study it has been found that the presence of cracks has no
significant bearing on the hydraulic behavior of soil when subjected to high suction
ranges. The results of this study do not apply to the behavior of cracked soil at low
suction or near saturation.
The experimental testing conducted in this study provided insight into methods
and considerations for determining the unsaturated hydraulic conductivity using the
instantaneous profile method. From performing the instantaneous profile experiments,
various conclusions were made to the general method and sampling procedures, as
outlined below.

193
The results from experiments TN1 and TN2, which were performed by following
the standard instantaneous profile procedure produced results that were
considered to have a high amount of scatter. It was concluded that the sampling
technique makes the standard test prone to inaccuracies due to disturbance issues.
An important consideration of the standard method is the change in the soil fabric
with respect to the direction of compaction. This is a clear weakness given the
fact that the hydraulic conductivity is very much affected by the orientation of
the soil particles and direction of compaction (Mitchell and Soga, 2005). The
hydraulic conductivity is different in the horizontal direction from the vertical
direction in a soil profile due to soil fabric effects.
Another issue with the test method used for TN1 and TN2 is the amount of soil
sections. The procedure use to perform these experiments used four different soil
sections which are all considered independent of each other. Controlling the
suction and gradients between these sections proved to not be easy and involved
a lot of considerations including the assumptions regarding the direction of flow,
and to the wetting or drying cycles the samples were subjected to at the time of
testing.
The duplicate method provides some advantages over the method used for TN1
and TN2. The primary advantage of the duplicate method is that the samples can
be completely destroyed for water content sampling. Because of this, the water
content measurements along the soil profile can be very accurately measured
from using large water content samples and sample taken are more
representative. Also the filter paper sandwiches can be easily retrieved.
Other advantages of the duplicate method are the simplified procedure for
specimen production and the small cost associated with it.

194
The duplicate method also allows for the user to choose the suction range for
which they would like to measure hydraulic conductivity values. Since only two
soil sections are used, the range of anticipated water contents and suction is
easier to control. Also the hydraulic and suction gradients can be easily
determined.
The duplicate method does have some disadvantages. The duplicate method
creates a large amount of variability and scatter from the computation of
hydraulic conductivity points calculated through various locations within the soil
profile. This is due to the non-homogeneous sample set and the fact that not all
the soil sample encounters the same change in water content and is not
compacted at exactly the same conditions.
The scatter observed from the duplicate experiments may also be a result of the
soil fabric effects of compacting the soils above and below the optimum water
content. It has been discussed in literature that the soil fabric being either
flocculated or dispersed has an effect on the hydraulic conductivity of a soil
(Mitchell and Soga 2005).
The vertical infiltration experiment Test No. 6 (TN6) performed well and as
expected. This experiment allowed for unsaturated conductivity values to be
acquired in the smallest amount of time.
The use of large sample sizes could also increase the accuracy of measurements
obtained by the instantaneous profile experiment. Many of the measurement
techniques used rely of sensors that have a specific radius of influence. Large
sample sizes could decrease the boundary effect of the sample apparatus and
have less influence on the measurements of devices such as the volumetric
moisture probes.

195
Recommendations for Future Research This study provided contribution to the unsaturated hydraulic conductivity
behavior for high soil suctions and considerations to methods using the instantaneous
profile method. However more research could be conducted in the areas listed below:
Further testing over the entire suction range of soil using the duplicate method
could provide a complete unsaturated hydraulic conductivity function. Also
more testing of the hydraulic conductivity at high suction ranges could be
performed to further understand the unsaturated hydraulic behavior at high
suction ranges.
Testing different soil types would determine the impact of use, accuracy and
applicability of the duplicate method.
The new proposed unsaturated hydraulic conductivity function presented in this
study could be fit to unsaturated hydraulic conductivity functions for different
soil types. The input parameters of the equation could be further explored and
related to know soil properties.
Longer testing periods of the unsaturated hydraulic conductivity could be
performed using the duplicate method to determine if the soil sample would
eventually come to moisture equilibrium.
Further research could be done to analyze the wetting and drying patterns of the
unsaturated hydraulic conductivity data. Determining the trends in the
unsaturated hydraulic conductivity data could be determined for the wetting and
drying and related to the wetting and drying trends used in the SWCC.
More unsaturated hydraulic conductivity testing could be performed at high
suctions using various measurement techniques such as electrical/thermal
conductivity sensors to measure suction. The use of this type of sensors may

196
increase the accuracy of the measured values and decrease the amount of scatter
in the results.

197
REFERENCES Alonso, E.E., and Olivella, S. 2006. Unsaturated soil mechanics applied to geotechnical problems. Unsaturated Soils, Publication No. 147. (1-2): 1-35. ASTM Standard D422. Standard test method for particle size analysis of soils. ASTM International, West Conshohocken, PA. DOI: 10.1520/D422-63. www.astm.org. ASTM Standard D698. Standard test methods for laboratory compaction characteristics of soil using standard effort (12,400 ft-lbf/ft3). ASTM International, West Conshohocken, PA. DOI: 10.1520/D698-00a. www.astm.org. ASTM Standard D854. Standard test methods for specific gravity of soil solids by water Pycnometer. ASTM International, West Conshohocken, PA. DOI: 10.1520/D854-02. www.astm.org. ASTM Standard D2487. Standard practice for classification of soils for engineering purposes (Unified Soil Classification System). ASTM International, West Conshohocken, PA. DOI: 10.1520/D2487-00. www.astm.org. ASTM Standard D4318. Standard test methods for liquid limit, plastic limit and plasticity index of soils. ASTM International, West Conshohocken, PA. DOI: 10.1520/D4318-00. www.astm.org. ASTM Standard D4546. Standard test methods for one-dimensional swell or collapse of cohesive soils. ASTM International, West Conshohocken, PA. DOI: 10.1520/D4546-08. www.astm.org. ASTM Standard D4829. Standard test method for expansion index of soils. ASTM International, West Conshohocken, PA. DOI: 10.1520/D4829-03. www.astm.org. ASTM Standard D5298. Standard test method for measurement of soil potential (suction) using filter paper. ASTM International, West Conshohocken, PA. DOI: 10.1520/D5298-03. www.astm.org. Chandler, R.J. and Gutierrez, C.I. The filter-paper method of suction measurement. Geotechnique. Childs, E.C., and Collis-George, G.N. 1950. The permeability of porous materials. Proceedings – Royal Society – Mathematical and Physical Sciences. 201 (A): 392-405. Coduto, D.P. 1999. Geotechnical engineering – principles and practices. Upper Saddle River, NJ: Prentice Hall. Dye, H. 2008. Moisture movement through expansive soil and impact on performance of residential structures. Ph.D., Arizona State University. Ebrahimi-B, N., Gitirana Jr., G.F.N., Fredlund, D.G., Fredlund, M.D., Samarasekera, L. 2006. A lower limit for the water permeability coefficient. 57th Canadian Geotechnical Conference.

198
EC-5 soil moisture, small area of influence. (Internet) 2010. Decagon, Available from: http://www.decagon.com/products/sensors/soil-moisture-sensors/ec-5-soil-moisture-small-area-of-influence/ Fredlund, D.G. and Houston, S.L. 2009. Protocol for the assessment of unsaturated soil properties in geotechnical engineering practice. Canadian Geotechnical Journal, 46: 694-707. Fredlund, D.G. 2006. Unsaturated soil mechanics in engineering practice. Journal of Geotechnical and Geoenvironmental Engineering, ASCE, 132 (3): 286-321. Fredlund, D.G. and Rahardjo, H. 1993. Soil mechanics for unsaturated soils. New York, NY: John Wiley and Sons, Inc. Fredlund, D.G., Xing, A., Huang, S. 1994. Predicting the permeability function for unsaturated soils using the soil-water characteristic curve. Canadian Geotechnical Journal. 31:533-546. Hamilton, J.M., Daniel, D.E., Olson, R.E. 1979. Measurement of hydraulic conductivity of partially saturated soils. ASTM STP., 746: 182–196. Houston, S.L., Houston, W.M., Wagner, AM. 1994. Laboratory filter paper suction measurements. Arizona State University. Huang, S., Barbour, S.L., Fredlund, D.G. 1998. Development and verification of a coefficient of permeability function for a deformable unsaturated soil. Canadian Geotechnical Journal. 35: 411-425. Krisdani, H., Rahardjo, H., Leong, EC. 2009 Use of instantaneous profile and statistical methods to determine permeability functions of unsaturated soils. Canadian Geotechnical Journal 46: 869-874. Kunze, R.J., Vehara, H., Graham, K. 1968. Factors important in the calculation of hydraulic conductivity. Proceedings Soil Sci. Soc. Amer., 32: 760-765. Leong E., C., and Rahardjo, H. Permeability Functions for Unsaturated Soils. 1997 Journal of Geotechnical and Geoenvironmental Engineering, 123, (12): 1118-1126. Li, X., Zhang, L.M., Fredlund, D.G. 2009. Wetting front advancing column test for measuring unsaturated hydraulic conductivity. Canadian Geotechnical Journal, 46: 1431-1445. Liu, CH., Cheng, SW., Yu, WS., Chen, SK. 2003. Water infiltration rate in cracked paddy soil. Geoderma, 117: 169-181. Marshall, T.J. 1958. A relation between permeability and size distribution of pores. The Journal of Soil Science. 9:1-8.

199
Masrouri, F., Katia V.B., Kawai, K. 2008. Laboratory hydraulic testing in unsaturated soils. Geotech. Geol. Eng., 26: 691-704. Mc Brayer, M.C., Mauldon, M., Drumm, E.C., Wilson, G.V. 1997. Infiltration tests on fractured compacted clay. Journal of Geotechnical and Geoenvironmental Engineering, 123, (5). McCartney, J.S., Villar, L. Zornberg, J.G. 2007. Estimation of the hydraulic conductivity function of unsaturated clays using an infiltration column test. The University of Texas. Meerdink, J.S., Benson, C.H., and Khire, M.V. 1996. Unsaturated hydraulic conductivity of two compacted barrier soil. Journal of Geotechnical Engineering, 122, (7): 565-577. Mitchell, J.K. and Soga, K. 2005. Fundamentals of soil behavior. Hoboken, NJ. John Wiley and Sons, Inc. Noval, V., Simunek, J., Van Genuchten, M.Th. 2000. Infiltration of water into soil with cracks. Journal of Irrigation and Drainage Engineering, 126. Rahman, Md.M., Fredlund, M., Fredlund, D.G., Pham, H., Nguyen. 2004. Changes in matric suction and subsequent movement of a slab placed on a highly fractured expansive soil - Appendix I. Rayhani, M.H.T., Yanful, E.K., Fakher, A. 2007. Desiccation-induced cracking and its effect on the hydraulic conductivity of clayey soils from Iran. Canadian Geotechnical Journal 44: 276-283. Richards, S. and Weeks, L. 1953. Capillary conductivity values from moisture yield and tension measurements on soil columns. Soils Sci. Soc. Am. Proc., 17: 206-209. Slawinski, C., Walczak, R.T., Skierucha, W. 2006. Error analysis of water conductivity coefficient measurement by instantaneous profiles method. International Agrophysics 20: 55-61. Van den Berg, E.H., Perfect, E., Tu, C., Knappett, P.S.K., Leao, T.P., and Donat, R.W. 2009. Unsaturated hydraulic conductivity measurements with centrifuges: A review. Vadose Zone Journal, 8 (3): 531-547. Vanapalli, S.K., Garga, V.K., Brisson, P. 2007. A modified permeameter for determination of unsaturated coefficient of permeability. Geotech Geol Eng. 24: 191-202. Yesiller, N., Miller, C.J., Inci, G., Yaldo, K. 2000. Desiccation and cracking behavior of three compacted landfill liner soils. Engineering Geology, 57: 105-121. Zapata, C.E. 1999. Uncertainty in soil-water-characteristic curve and impacts on unsaturated shear strength predictions. Ph.D., Arizona State University.

200
Zhang, L.M., Li, J.H., Fredlund, D.G. 2011. Unsaturated conductivity function for unsaturated cracked soil. Unsaturated soils: 993-999.

201
APPENDIX A
INTACT UNSATURATED HYDRAULIC CONDUCTIVITY DATA SET
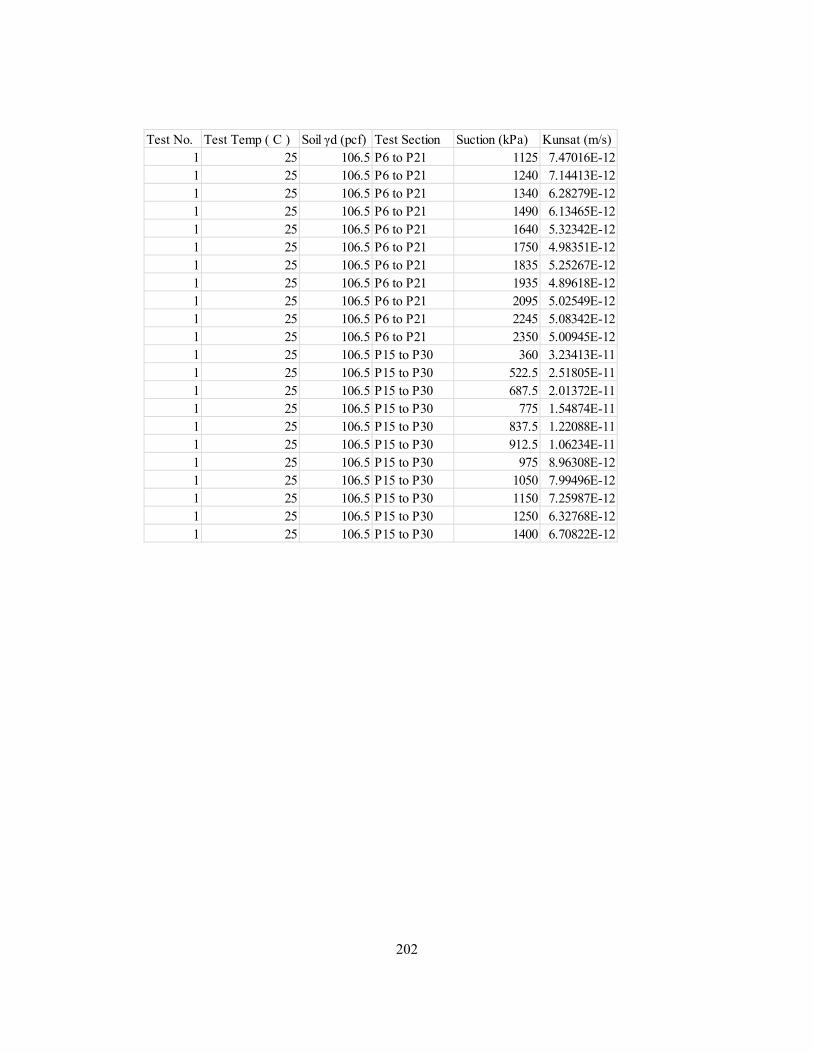
202
Test No. Test Temp ( C ) Soil γd (pcf) Test Section Suction (kPa) Kunsat (m/s)1 25 106.5 P6 to P21 1125 7.47016E-121 25 106.5 P6 to P21 1240 7.14413E-121 25 106.5 P6 to P21 1340 6.28279E-121 25 106.5 P6 to P21 1490 6.13465E-121 25 106.5 P6 to P21 1640 5.32342E-121 25 106.5 P6 to P21 1750 4.98351E-121 25 106.5 P6 to P21 1835 5.25267E-121 25 106.5 P6 to P21 1935 4.89618E-121 25 106.5 P6 to P21 2095 5.02549E-121 25 106.5 P6 to P21 2245 5.08342E-121 25 106.5 P6 to P21 2350 5.00945E-121 25 106.5 P15 to P30 360 3.23413E-111 25 106.5 P15 to P30 522.5 2.51805E-111 25 106.5 P15 to P30 687.5 2.01372E-111 25 106.5 P15 to P30 775 1.54874E-111 25 106.5 P15 to P30 837.5 1.22088E-111 25 106.5 P15 to P30 912.5 1.06234E-111 25 106.5 P15 to P30 975 8.96308E-121 25 106.5 P15 to P30 1050 7.99496E-121 25 106.5 P15 to P30 1150 7.25987E-121 25 106.5 P15 to P30 1250 6.32768E-121 25 106.5 P15 to P30 1400 6.70822E-12

203
Test No. Test Temp ( C ) Soil γd (pcf) Test Section Suction (kPa) Kunsat (m/s)2 25 106.5 P6 to P21 1055 8.31142E-122 25 106.5 P6 to P21 1195 7.90885E-122 25 106.5 P6 to P21 1335 8.05685E-122 25 106.5 P6 to P21 1405 7.39856E-122 25 106.5 P6 to P21 1505 6.67826E-122 25 106.5 P6 to P21 1615 6.57797E-122 25 106.5 P6 to P21 1670 6.39595E-122 25 106.5 P6 to P21 1750 5.92616E-122 25 106.5 P6 to P21 1845 5.5788E-122 25 106.5 P6 to P21 1920 5.62343E-122 25 106.5 P6 to P21 2000 5.57696E-122 25 106.5 P6 to P21 2075 5.82846E-122 25 106.5 P6 to P21 2025 7.05392E-122 25 106.5 P6 to P21 1725 7.96238E-122 25 106.5 P15 to P30 495 3.39264E-112 25 106.5 P15 to P30 645 2.78172E-112 25 106.5 P15 to P30 740 2.39685E-112 25 106.5 P15 to P30 785 1.85758E-112 25 106.5 P15 to P30 795 1.59232E-112 25 106.5 P15 to P30 825 1.39816E-112 25 106.5 P15 to P30 875 1.2819E-112 25 106.5 P15 to P30 910 1.09047E-112 25 106.5 P15 to P30 960 1.03757E-112 25 106.5 P15 to P30 1075 1.02684E-112 25 106.5 P15 to P30 1215 8.41103E-122 25 106.5 P15 to P30 1330 7.00865E-122 25 106.5 P15 to P30 1190 6.95459E-122 25 106.5 P15 to P30 925 7.16097E-12

204
Test No. Test Temp ( C ) Soil γd (pcf) Test Section Suction (kPa) Kunsat (m/s)3 4 106.5 P2 to P4 5360.985 3.34375E-133 4 106.5 P2 to P4 1568.635 7.3111E-133 4 106.5 P2 to P4 1275.71 1.01443E-123 4 106.5 P2 to P4 1464.365 2.03327E-133 4 106.5 P3 to P5 1165.015 3.8598E-133 4 106.5 P3 to P5 1568.635 5.79617E-123 4 106.5 P3 to P5 1275.71 7.16952E-123 4 106.5 P3 to P5 1464.365 1.16933E-123 4 106.5 P3 to P6 1079.8725 8.17101E-133 4 106.5 P3 to P6 1459.65375 5.7521E-123 4 106.5 P3 to P6 1179.06875 6.83743E-123 4 106.5 P3 to P6 1302.18375 1.08779E-123 4 106.5 P2 to P5 3263 7.1689E-133 4 106.5 P2 to P5 1568.635 1.51994E-123 4 106.5 P2 to P5 1275.71 2.20566E-123 4 106.5 P2 to P5 1464.365 4.52918E-133 4 106.5 P2 to P3 6184.61125 3.50163E-143 4 106.5 P2 to P3 2733.55125 4.912E-143 4 106.5 P2 to P3 2162.12875 7.63797E-143 4 106.5 P2 to P3 2576.96 1.50472E-143 4 106.5 P4 to P5 1079.8725 5.55187E-143 4 106.5 P4 to P5 1459.65375 2.03566E-143 4 106.5 P4 to P5 1179.06875 1.66804E-133 4 106.5 P4 to P5 1302.18375 4.68424E-143 4 106.5 P2 to P4 2010.44 7.91638E-143 4 106.5 P3 to P5 2010.44 3.0254E-133 4 106.5 P3 to P6 1765.33375 2.89116E-133 4 106.5 P2 to P5 2010.44 1.67446E-13

205
Test No. Test Temp ( C ) Soil γd (pcf) Test Section Suction (kPa) Kunsat (m/s)6 4 106.5 2 Pt. 328.8158124 4.24E-126 4 106.5 3 Pt. 301.3160356 4.39E-126 4 106.5 4 Pt. 196.8331579 4.18E-126 4 106.5 5 Pt. 194.4051999 4.28E-126 4 106.5 6 Pt. 285.3252296 4.30E-126 4 106.5 7 Pt. 284.5927299 4.30E-126 4 106.5 8 Pt. 283.9351616 4.57E-126 4 106.5 9 Pt. 283.443041 4.30E-126 4 106.5 10 Pt. 281.47959 4.59E-126 4 106.5 11 Pt. 278.9065378 4.35E-126 4 106.5 12 Pt. 274.6048793 4.41E-126 4 106.5 13 Pt. 268.9032699 4.76E-126 4 106.5 14 Pt. 263.7868587 4.56E-126 4 106.5 15 Pt. 258.1837707 4.64E-126 4 106.5 16 Pt. 252.676069 5.01E-126 4 106.5 17 Pt. 249.8264272 4.76E-126 4 106.5 18 Pt. 247.510115 4.79E-126 4 106.5 19 Pt. 244.1607373 5.15E-126 4 106.5 20 Pt. 240.3691109 4.90E-126 4 106.5 21 Pt. 236.7226159 4.96E-126 4 106.5 22 Pt. 234.1716459 5.32304E-126 4 106.5 23 Pt. 233.6284072 5.02395E-126 4 106.5 24 Pt. 232.6211495 5.03428E-12
Test No. Test Temp ( C ) Soil γd (pcf) Test Section Suction (kPa) Kunsat (m/s)7 4 106.5 953.499519 1.31465E-127 4 106.5 215.0475195 1.62266E-127 4 106.5 215.6250195 3.64144E-127 4 106.5 584.2735193 2.95364E-127 4 106.5 1068.399519 7.95865E-147 4 106.5 584.2735193 4.06173E-137 4 106.5 806.245 8.00955E-137 4 106.5 437.615 1.18729E-127 4 106.5 411.9025 2.72002E-127 4 106.5 621.93 1.73794E-127 4 106.5 960.4875 5.18757E-147 4 106.5 621.93 3.24395E-137 4 106.5 411.9025 9.91699E-147 4 106.5 839.745 9.96566E-137 4 106.5 392.73 1.54495E-127 4 106.5 381.9075 4.06548E-127 4 106.5 616.2375 2.30867E-127 4 106.5 1002.7275 7.00141E-147 4 106.5 616.2375 3.79762E-137 4 106.5 381.9075 5.1997E-13

206
Test No. Test Temp ( C ) Soil γd (pcf) Test Section Suction (kPa) Kunsat (m/s)TT 20 106.5 AB 129.4923509 2.92082E-10TT 20 106.5 AB 130.1135922 4.3855E-10TT 20 106.5 AB 130.7405457 1.68673E-10TT 20 106.5 AB 129.6598872 3.44534E-10TT 20 106.5 AB 128.8584298 1.61733E-10TT 20 106.5 AB 130.9088698 3.55776E-10TT 20 106.5 AB 132.8954851 1.88532E-10TT 20 106.5 AB 132.8595893 4.77192E-10TT 20 106.5 AB 125.407498 1.08307E-10TT 20 106.5 AB 133.0534137 1.92575E-10TT 20 106.5 AB 134.2305026 3.08751E-10TT 20 106.5 AB 134.5105522 2.02662E-10TT 20 106.5 AB 135.0293793 2.51879E-10TT 20 106.5 AB 132.9461043 1.74617E-10TT 20 106.5 AB 130.5802781 3.54564E-10TT 20 106.5 AB 128.4730755 2.37493E-10TT 20 106.5 AB 124.4827362 2.40991E-10TT 20 106.5 AB 121.5481205 2.11596E-10TT 20 106.5 BC 144.5951219 3.64891E-10TT 20 106.5 BC 147.8081066 7.67911E-10TT 20 106.5 BC 147.9486697 2.98486E-10TT 20 106.5 BC 145.3395587 6.0577E-10TT 20 106.5 BC 146.9936726 3.00491E-10TT 20 106.5 BC 148.2075061 6.71333E-10TT 20 106.5 BC 149.6082515 3.56137E-10TT 20 106.5 BC 153.4813519 8.7203E-10TT 20 106.5 BC 150.3085408 1.96783E-10TT 20 106.5 BC 153.1887249 3.49899E-10TT 20 106.5 BC 155.0937479 5.77977E-10TT 20 106.5 BC 157.0636295 3.96041E-10TT 20 106.5 BC 158.1554206 4.6635E-10TT 20 106.5 BC 157.5561391 3.21279E-10TT 20 106.5 BC 155.8594156 6.49087E-10TT 20 106.5 BC 152.9459733 4.38492E-10TT 20 106.5 BC 149.5971176 4.47095E-10TT 20 106.5 BC 147.6991661 3.86524E-10TT 20 106.5 CD 150.3857735 3.92998E-10TT 20 106.5 CD 153.4882516 8.29697E-10TT 20 106.5 CD 153.8347163 3.21939E-10TT 20 106.5 CD 151.9074765 6.49901E-10TT 20 106.5 CD 154.0360772 3.21336E-10TT 20 106.5 CD 155.3111444 7.187E-10TT 20 106.5 CD 156.4707853 3.81138E-10TT 20 106.5 CD 160.9070465 9.32802E-10TT 20 106.5 CD 161.2396594 2.07115E-10TT 20 106.5 CD 163.2623064 3.6951E-10TT 20 106.5 CD 165.9927836 6.07882E-10TT 20 106.5 CD 169.122077 4.14629E-10TT 20 106.5 CD 171.9514777 4.83984E-10TT 20 106.5 CD 173.2301333 3.30787E-10TT 20 106.5 CD 172.7857055 6.62539E-10TT 20 106.5 CD 170.7240822 4.46076E-10TT 20 106.5 CD 168.8329565 4.49382E-10TT 20 106.5 CD 167.8100825 3.87208E-10

207
APPENDIX B
CRACKED UNSATURATED HYDRAULIC CONDUCTIVITY DATA SET

208
Test No. Set No. Test Temp ( C ) Soil γd (pcf) Test Section Suction (kPa) Kunsat (m/s)4 1 4 106.5 P2 to P4 3337.27 2.30549E-134 1 4 106.5 P2 to P4 2872.25 2.39324E-134 1 4 106.5 P2 to P4 3030.45 9.49973E-144 1 4 106.5 P2 to P4 4015.38 6.28169E-144 1 4 106.5 P3 to P5 2684.02 2.68964E-134 1 4 106.5 P3 to P5 1679.5 3.58865E-134 1 4 106.5 P3 to P5 1705.4825 1.8088E-134 1 4 106.5 P3 to P5 2315.945 1.29065E-134 1 4 106.5 P3 to P6 2708.52 5.66488E-134 1 4 106.5 P3 to P6 1809.75 7.66927E-134 1 4 106.5 P3 to P6 1780.41 3.79166E-134 1 4 106.5 P3 to P6 2301.685 3.46889E-134 1 4 106.5 P2 to P5 3288.52 5.09143E-134 1 4 106.5 P2 to P5 2641.75 5.10726E-134 1 4 106.5 P2 to P5 2836.3775 2.0788E-134 1 4 106.5 P2 to P5 3920.2275 1.30647E-134 1 4 106.5 P2 to P3 5188.275 2.30401E-144 1 4 106.5 P2 to P3 3551.25 2.55856E-144 1 4 106.5 P2 to P3 3538.645 9.36027E-154 1 4 106.5 P3 to P4 2732.77 6.8936E-144 1 4 106.5 P3 to P4 1910 1.08362E-134 1 4 106.5 P3 to P4 1899.555 5.57695E-144 1 4 106.5 P3 to P4 2411.0975 3.84577E-144 1 4 106.5 P4 to P5 1000.5 3.47897E-144 1 4 106.5 P4 to P5 1197.2875 1.75948E-144 1 4 106.5 P4 to P5 1597.5125 1.44803E-14

209
Test No. Set No. Test Temp ( C ) Soil γd (pcf) Test Section Suction (kPa) Kunsat (m/s)4 2 4 106.5 P2 to P4 3106.4575 2.48359E-134 2 4 106.5 P2 to P4 2738.0025 2.61979E-134 2 4 106.5 P2 to P4 2746.445 1.18566E-134 2 4 106.5 P2 to P4 2750.2125 1.98553E-134 2 4 106.5 P2 to P4 2546.1625 2.16685E-134 2 4 106.5 P3 to P5 2580.9575 2.84999E-134 2 4 106.5 P3 to P5 1834.75 3.98223E-134 2 4 106.5 P3 to P5 1794.22 1.81195E-134 2 4 106.5 P3 to P5 1853.675 3.24947E-134 2 4 106.5 P3 to P5 1862.0525 3.45497E-134 2 4 106.5 P3 to P6 2648.9575 6.57263E-134 2 4 106.5 P3 to P6 1875.5 9.24585E-134 2 4 106.5 P3 to P6 1806.5775 4.13333E-134 2 4 106.5 P3 to P6 1951.14 7.12234E-134 2 4 106.5 P3 to P6 1945.695 7.13127E-134 2 4 106.5 P2 to P5 3020.7075 5.68748E-134 2 4 106.5 P2 to P5 2620.7525 6.22315E-134 2 4 106.5 P2 to P5 2628.0275 2.74166E-134 2 4 106.5 P2 to P5 2674.25 4.41835E-134 2 4 106.5 P2 to P5 2455.42 4.673E-134 2 4 106.5 P2 to P3 5020.9 2.65533E-144 2 4 106.5 P2 to P3 3584.5025 3.18597E-144 2 4 106.5 P2 to P3 3424.0525 1.62992E-144 2 4 106.5 P2 to P3 3239.73 2.69416E-144 2 4 106.5 P2 to P3 3005.1325 2.00049E-144 2 4 106.5 P3 to P4 2666.7075 7.02525E-144 2 4 106.5 P3 to P4 1952 9.67258E-144 2 4 106.5 P3 to P4 1912.6375 4.60593E-144 2 4 106.5 P3 to P4 1929.6375 8.76846E-144 2 4 106.5 P3 to P4 1952.795 9.83425E-144 2 4 106.5 P4 to P5 666.515 9.35162E-144 2 4 106.5 P4 to P5 988.25 1.19987E-134 2 4 106.5 P4 to P5 1116.6125 4.09469E-144 2 4 106.5 P4 to P5 1364.1575 3.96863E-144 2 4 106.5 P4 to P5 1403.0825 2.58395E-14

210
Test No. Set No. Test Temp ( C ) Soil γd (pcf) Test Section Suction (kPa) Kunsat (m/s)5 3 4 106.5 P2 to P4 3749.64625 3.38653E-135 3 4 106.5 P2 to P4 2948.13375 3.86736E-135 3 4 106.5 P2 to P4 2591.4775 3.27558E-135 3 4 106.5 P2 to P4 2423.84 5.21771E-135 3 4 106.5 P2 to P4 2634.6225 3.7219E-135 3 4 106.5 P3 to P5 3710.68625 2.95251E-135 3 4 106.5 P3 to P5 2438.67375 3.70297E-135 3 4 106.5 P3 to P5 1947.1725 3.94286E-135 3 4 106.5 P3 to P5 1919.9775 5.63643E-135 3 4 106.5 P3 to P5 2059.585 3.38742E-135 3 4 106.5 P3 to P6 3709.6275 6.6705E-135 3 4 106.5 P3 to P6 2427.365 8.52137E-135 3 4 106.5 P3 to P6 1917.06 9.16055E-135 3 4 106.5 P3 to P6 1932.6675 1.32185E-125 3 4 106.5 P3 to P6 2055.8425 7.17594E-135 3 4 106.5 P2 to P5 3748.635 7.67926E-135 3 4 106.5 P2 to P5 2936.8725 8.86165E-135 3 4 106.5 P2 to P5 2561.365 7.44129E-135 3 4 106.5 P2 to P5 2436.5325 1.11994E-125 3 4 106.5 P2 to P5 2630.8825 7.67948E-135 3 4 106.5 P2 to P3 (Intact) 7194.61375 1.1307E-125 3 4 106.5 P2 to P3 (Intact) 4831.92875 1.20861E-135 3 4 106.5 P2 to P3 (Intact) 4015.9525 4.50477E-145 3 4 106.5 P2 to P3 (Intact) 3840.525 7.96628E-145 3 4 106.5 P2 to P3 (Intact) 4054.5825 8.69278E-145 3 4 106.5 P3 to P4 (Long) 3711.6975 7.31403E-145 3 4 106.5 P3 to P4 (Long) 2449.935 9.02898E-145 3 4 106.5 P3 to P4 (Long) 1977.285 9.77747E-145 3 4 106.5 P3 to P4 (Long) 1907.285 1.48958E-135 3 4 106.5 P3 to P4 (Long) 2063.325 9.55096E-145 3 4 106.5 P3 to P4 (Short) 3711.6975 6.09502E-155 3 4 106.5 P3 to P4 (Short) 2449.935 7.52415E-155 3 4 106.5 P3 to P4 (Short) 1977.285 8.14789E-155 3 4 106.5 P3 to P4 (Short) 1907.285 1.24132E-145 3 4 106.5 P3 to P4 (Short) 2063.325 7.95914E-155 3 4 106.5 P4 to P5 (Inact) 265.71875 2.36503E-125 3 4 106.5 P4 to P5 (Inact) 554.87875 4.74726E-135 3 4 106.5 P4 to P5 (Inact) 522.6975 1.36266E-135 3 4 106.5 P4 to P5 (Inact) 503.2925 1.03913E-125 3 4 106.5 P4 to P5 (Inact) 639.625 4.02493E-12

211
Test No. Set No. Test Temp ( C ) Soil γd (pcf) Test Section Suction (kPa) Kunsat (m/s)5 4 4 106.5 P2 to P4 4260.12125 2.85852E-135 4 4 106.5 P2 to P4 3201.10875 3.45764E-135 4 4 106.5 P2 to P4 2883.7975 3.13544E-135 4 4 106.5 P2 to P4 3417.72 3.6329E-135 4 4 106.5 P2 to P4 3447.545 2.73148E-135 4 4 106.5 P3 to P5 3800.8175 2.79302E-135 4 4 106.5 P3 to P5 2369.43 3.76244E-135 4 4 106.5 P3 to P5 2337.3925 3.46056E-135 4 4 106.5 P3 to P5 3005.7575 3.87692E-135 4 4 106.5 P3 to P5 2950.175 3.05442E-135 4 4 106.5 P3 to P6 3814.07 6.3366E-135 4 4 106.5 P3 to P6 2382.8075 8.58528E-135 4 4 106.5 P3 to P6 2324.3275 7.88064E-135 4 4 106.5 P3 to P6 3038.245 8.91175E-135 4 4 106.5 P3 to P6 3030.5325 7.19043E-135 4 4 106.5 P2 to P5 4273.37375 6.50651E-135 4 4 106.5 P2 to P5 3214.48625 8.37816E-135 4 4 106.5 P2 to P5 2870.7575 7.54556E-135 4 4 106.5 P2 to P5 3450.215 8.43118E-135 4 4 106.5 P2 to P5 3527.885 6.36036E-135 4 4 106.5 P2 to P3 (Intact) 7815.39625 9.08014E-145 4 4 106.5 P2 to P3 (Intact) 5124.46125 9.08978E-145 4 4 106.5 P2 to P3 (Intact) 4686.62 7.47342E-145 4 4 106.5 P2 to P3 (Intact) 5823.4325 7.63631E-145 4 4 106.5 P2 to P3 (Intact) 5782.95 4.84607E-145 4 4 106.5 P3 to P4 (Long) 3787.565 6.88925E-145 4 4 106.5 P3 to P4 (Long) 2356.0525 8.4483E-145 4 4 106.5 P3 to P4 (Long) 2350.4325 7.94663E-145 4 4 106.5 P3 to P4 (Long) 2973.2625 9.34939E-145 4 4 106.5 P3 to P4 (Long) 2869.835 7.31914E-145 4 4 106.5 P3 to P4 (Short) 3787.565 1.72231E-145 4 4 106.5 P3 to P4 (Short) 2356.0525 2.11208E-145 4 4 106.5 P3 to P4 (Short) 2350.4325 1.98666E-145 4 4 106.5 P3 to P4 (Short) 2973.2625 2.33735E-145 4 4 106.5 P3 to P4 (Short) 2869.835 1.82979E-145 4 4 106.5 P4 to P5 (Inact) 245.5425 1.80467E-135 4 4 106.5 P4 to P5 (Inact) 446.0775 1.28301E-125 4 4 106.5 P4 to P5 (Inact) 534.57 1.06089E-125 4 4 106.5 P4 to P5 (Inact) 600.045 1.56941E-13

212
Test No. Set No. Test Temp ( C ) Soil γd (pcf) Test Section Suction (kPa) Kunsat (m/s)6 Cracked 4 106.5 NA 408.6655802 6.27367E-126 Cracked 4 106.5 NA 421.5389483 6.21611E-126 Cracked 4 106.5 NA 356.1206861 5.631E-126 Cracked 4 106.5 NA 294.5982583 8.56118E-126 Cracked 4 106.5 NA 254.6969226 1.03929E-116 Cracked 4 106.5 NA 221.6237275 1.12216E-116 Cracked 4 106.5 NA 214.9588919 1.14226E-116 Cracked 4 106.5 NA 203.6348717 1.18086E-116 Cracked 4 106.5 NA 177.4775822 1.26178E-116 Cracked 4 106.5 NA 168.2240281 1.21228E-116 Cracked 4 106.5 NA 176.0767099 1.32235E-116 Cracked 4 106.5 NA 174.6734407 1.35543E-116 Cracked 4 106.5 NA 177.4334611 1.36057E-116 Cracked 4 106.5 NA 178.7412817 1.37438E-116 Cracked 4 106.5 NA 185.9352456 1.33675E-116 Cracked 4 106.5 NA 198.3890215 1.26925E-116 Cracked 4 106.5 NA 203.6479143 1.25004E-116 Cracked 4 106.5 NA 208.8862919 1.22978E-116 Cracked 4 106.5 NA 215.1861884 1.20274E-116 Cracked 4 106.5 NA 229.0121188 1.15046E-116 Cracked 4 106.5 NA 244.6897654 1.09468E-116 Cracked 4 106.5 NA 252.5543794 1.0611E-116 Cracked 4 106.5 NA 240.5598573 1.08889E-116 Cracked 4 106.5 NA 234.4581516 1.10459E-116 Cracked 4 106.5 NA 248.8607113 1.05445E-116 Cracked 4 106.5 NA 257.345179 1.03371E-116 Cracked 4 106.5 NA 266.487512 1.0074E-116 Cracked 4 106.5 NA 277.63792 9.65936E-126 Cracked 4 106.5 NA 285.2350003 9.38879E-12