
Laboratores for the 21st Century: i Best Practces ilabs21.lbl.gov/DPM/Assets/bp_water_508.pdfof how...
12
ici l l i i l i i i W E G L i by U.S. Department of Energy Energy Eff ency and Renewab e Energy Federa Energy Management Program Un ted States Env ronmenta Protect on Agency Laborator e s f o r t h e 2 1 s t C e n t u r y : B e s t P r a c t ces Steve Hall, Hedrick-Blessing/PIX12657 ATER FFICIENCY UIDE FOR ABORATORIES Introduct on Most laboratory buildings in our country use significantly more water per square foot than stan- dard commercial buildings do, primarily to meet their larger cooling and process loads. This greater need also provides laboratories with more opportu- nities to make cost-effective improvements in water efficiency, especially with respect to the amount of water they use in cooling towers and for special pro- cess equipment. A laboratory’s water efficiency can also be improved by making a few changes in other types of equipment, such as water treatment and sterilizing systems, as described in this guide. And alternative sources of water can often be effectively integrated into a laboratory’s operations. This guide to water efficiency is one in a series of best practices for laboratories. It was produced Laboratories for the 21st Century (“Labs 21”), a joint program of the U.S. Environmental Protection Agency (EPA) and the U.S. Department of Energy (DOE). Geared toward architects, engineers, and facility managers, these guides provide information about technologies and practices to use in design- ing, constructing, and operating safe, sustainable, high-performance laboratories. This exterior view of the Nidus Center for Scientific Enterprise in St. Louis, Missouri, shows the cisterns that store rainwater used to irrigate the grounds of this research facility.
Transcript of Laboratores for the 21st Century: i Best Practces ilabs21.lbl.gov/DPM/Assets/bp_water_508.pdfof how...
ici ll
ii l
i
ii
W EGL
i
by
U.S. Department of Energy Energy Eff ency and Renewab e Energy Federa Energy Management Program
Un ted States Env ronmentaProtect on Agency
L a b o r a t o r e s f o r t h e 2 1 s t C e n t u r y : B e s t P r a c t c e s
Ste
ve H
all,
Hed
rick
-Ble
ssin
g/P
IX12
657
ATER FFICIENCY UIDE FOR ABORATORIES
Introduct on Most laboratory buildings in our country use
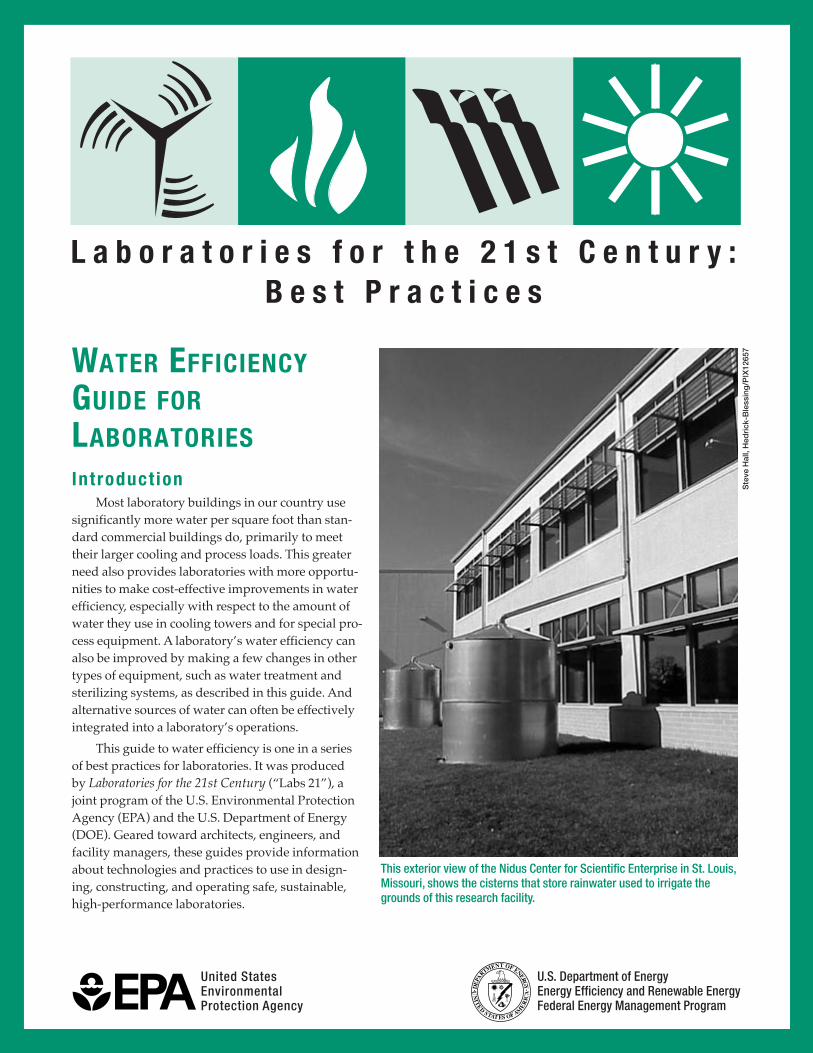
significantly more water per square foot than stan-dard commercial buildings do, primarily to meet their larger cooling and process loads. This greater need also provides laboratories with more opportu-nities to make cost-effective improvements in water efficiency, especially with respect to the amount of water they use in cooling towers and for special pro-cess equipment. A laboratory’s water efficiency can also be improved by making a few changes in other types of equipment, such as water treatment and sterilizing systems, as described in this guide. And alternative sources of water can often be effectively integrated into a laboratory’s operations.
This guide to water efficiency is one in a series of best practices for laboratories. It was produced
Laboratories for the 21st Century (“Labs 21”), a joint program of the U.S. Environmental Protection Agency (EPA) and the U.S. Department of Energy (DOE). Geared toward architects, engineers, and facility managers, these guides provide information about technologies and practices to use in design-ing, constructing, and operating safe, sustainable, high-performance laboratories.
This exterior view of the Nidus Center for Scientific Enterprise in St. Louis, Missouri, shows the cisterns that store rainwater used to irrigate the grounds of this research facility.

L A B S F O R T H E 2 1 S T C E N T U R Y 32 L A B S F O R T H E 2 1 S T C E N T U R Y
Laboratory Cool ing Towers Typical Cooling Tower Operation Drift ("D")
Water with concentrated mineral salts
Treatment chemicals
Water sprayed
downward
Evaporation ("E")
Warm water
Process heat
source
Cool water
Blowdown ("B")
Water flowing out of a cooling tower circulates to equipment that needs cooling. The equipment is cooled; the water is warmed. The warm water is returned to the cooling tower where it is re-cooled and the process begins again.
Cooling towers, which are part of many laboratory buildings, might represent the largest single opportunity for greater water efficiency. This is because laboratories usually have very large comfort-cooling and process loads. Laboratories often use 100% outside air for ventila-tion; this makes their comfort cooling loads higher than those of most office buildings. Additional cooling is often needed for special equipment such as lasers and electron microscopes (see the section on laboratory equipment in this guide). In fact, from 30% to 60% of all the water used in multipurpose laboratories is for cooling.
Makeup back to water process ("M")
Recirculating pump(also called bleed-off)
Cooling towers use water in three ways: evaporation, drift, and bleed-off. Figure 1 illustrates water use in a typi-cal cooling tower. Evaporation (E) is fixed and controlled by thermodynamics; about 2.4 gallons per minute (gpm) of cooling water is used for every 100 tons of cooling. Bleed-off (B) contains the concentrated, dissolved solids and other material left behind from evaporation. Drift (D) losses are typically a function of tower design. Most of today’s tower designs reduce drift to about 0.05% to 0.2%. Since the amounts are small and they contain dissolved solids, they are usually included in bleed-off. Make-up (M) water replaces water lost because of E, B, or D.
Cool ing Tower Water Management The primary methods for managing water use in
cooling towers are operational ones. For example, cool-ing towers can be investigated to see if there should be an
Figure 1. Water use in a typical cooling tower (Source: New Mexico Office of the State Engineer 1999; reprinted with permission)
results in greater water efficiency (New Mexico Office of the State Engineer 1999).
Figure 2 shows the effect of the CR on make-up water use. Note that increasing the CR from 2 to 5 yields almost 85% of the savings that can be obtained by increasing the cycles from 2 to 10. Increasing the cycling above 6 does not significantly reduce make-up water use, but it does increase the likelihood that deposits will form and cause fouling of the system (Puckorius 2002). Any of several different parameters can be used to estimate the water savings for a specific tower, as shown in the sample calculation.
increase in the concentration ratio (CR) or cycles of con-centration of water in the tower. The CR is an indication of how many times water circulates in the tower before it is bled off and discharged. Increasing the recycle rate of the tower reduces the consumption of make-up water and
To calculate the concentrat ion rat io (CR)and associated water savings: Since the CR represents the relationship between the concentration Ga
llons
/day
/100
tons
of c
oolin
g
7000.0
6000.0
5000.0
4000.0
3000.0
2000.0
1000.0
0.0
Incremental water savings
2 4 6 8 10 12 14 16 18 20 of dissolved solids in bleed-off (CB) to the concentration in make-up water (CM), it can be expressed as
CR = CB/CM.
If a cooling tower is metered for bleed-off and make-up water, CR can be calculated as follows where M is the volume of make-up water and B is the volume of bleed (in gallons).
CR = M/B.
The amount of water saved by increasing the CR can be calculated as
Vsaved = M1 * (CR2 - CR1)/CR1(CR2 - 1).
Here, V is the total volume saved, M1 is the initial make-up water volume, CR1 is the initial concentration ratio, and CR2 is the desired or final concentration ratio.
Concentration ratio (CR) Figure 2. Incremental water savings
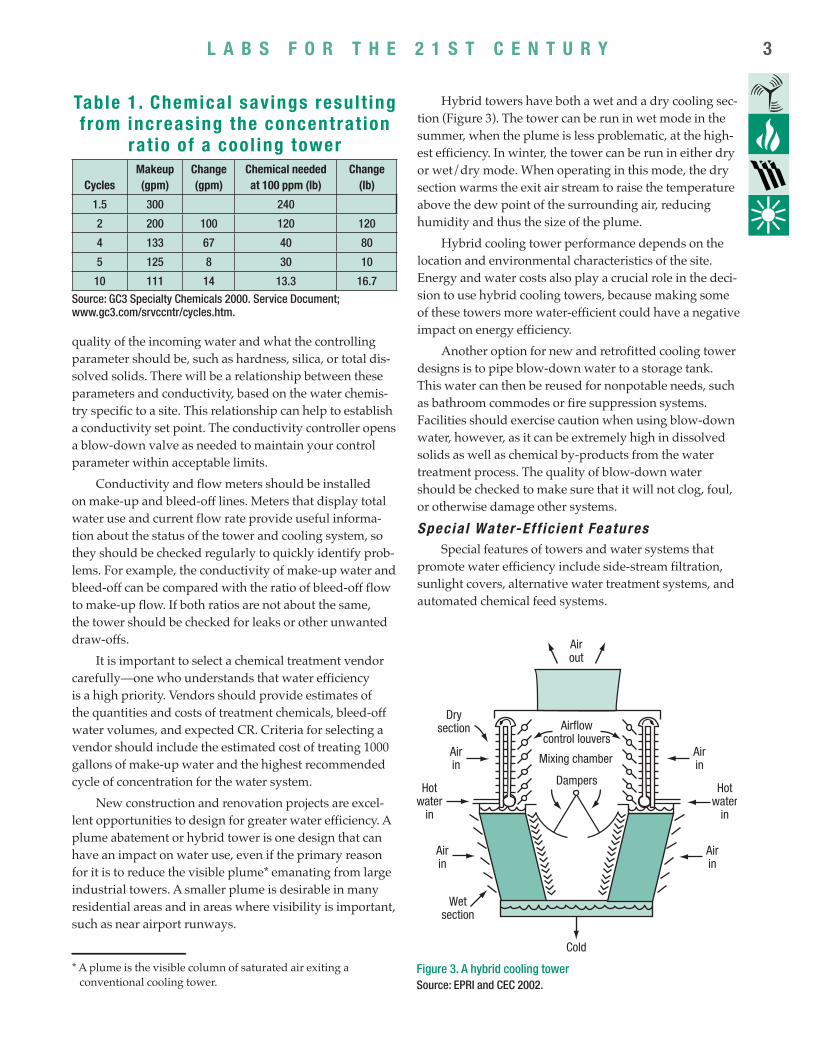
In addition to savings on water and sewer costs, sav-ings also result from having to purchase fewer chemicals to treat the water. As the volume of incoming fresh water is reduced, so is the amount of chemicals needed. Table 1 shows approximate savings on chemical usage resulting from increasing the CR in a 10,000-gpm system.
Perhaps the best way to increase the cycles of concen-tration is through better monitoring and management of the water chemistry. The first step is to understand the
L A B S F O R T H E 2 1 S T C E N T U R Y2 3 L A B S F O R T H E 2 1 S T C E N T U R Y
Table 1 . Chemical savings resul t ingf rom increasing the concentrat ion
rat io of a cool ing tower
Cycles Makeup (gpm)
Change (gpm)
Chemical needed at 100 ppm (lb)
Change (lb)
1.5 300 240
2 200 100 120 120
4 133 67 40 80
5 125 8 30 10
10 111 14 13.3 16.7
Source: GC3 Specialty Chemicals 2000. Service Document; www.gc3.com/srvccntr/cycles.htm.
quality of the incoming water and what the controlling parameter should be, such as hardness, silica, or total dis-solved solids. There will be a relationship between these parameters and conductivity, based on the water chemis-try specific to a site. This relationship can help to establish a conductivity set point. The conductivity controller opens a blow-down valve as needed to maintain your control parameter within acceptable limits.
Conductivity and flow meters should be installed on make-up and bleed-off lines. Meters that display total water use and current flow rate provide useful informa-tion about the status of the tower and cooling system, so they should be checked regularly to quickly identify prob-lems. For example, the conductivity of make-up water and bleed-off can be compared with the ratio of bleed-off flow to make-up flow. If both ratios are not about the same, the tower should be checked for leaks or other unwanted draw-offs.
It is important to select a chemical treatment vendor carefully—one who understands that water efficiency is a high priority. Vendors should provide estimates of the quantities and costs of treatment chemicals, bleed-off water volumes, and expected CR. Criteria for selecting a vendor should include the estimated cost of treating 1000 gallons of make-up water and the highest recommended cycle of concentration for the water system.
New construction and renovation projects are excel-lent opportunities to design for greater water efficiency. A plume abatement or hybrid tower is one design that can have an impact on water use, even if the primary reason for it is to reduce the visible plume* emanating from large industrial towers. A smaller plume is desirable in many residential areas and in areas where visibility is important, such as near airport runways.
* A plume is the visible column of saturated air exiting a conventional cooling tower.
Hybrid towers have both a wet and a dry cooling sec-tion (Figure 3). The tower can be run in wet mode in the summer, when the plume is less problematic, at the high-est efficiency. In winter, the tower can be run in either dry or wet/dry mode. When operating in this mode, the dry section warms the exit air stream to raise the temperature above the dew point of the surrounding air, reducing humidity and thus the size of the plume.
Hybrid cooling tower performance depends on the location and environmental characteristics of the site. Energy and water costs also play a crucial role in the deci-sion to use hybrid cooling towers, because making some of these towers more water-efficient could have a negative impact on energy efficiency.
Another option for new and retrofitted cooling tower designs is to pipe blow-down water to a storage tank. This water can then be reused for nonpotable needs, such as bathroom commodes or fire suppression systems. Facilities should exercise caution when using blow-down water, however, as it can be extremely high in dissolved solids as well as chemical by-products from the water treatment process. The quality of blow-down water should be checked to make sure that it will not clog, foul, or otherwise damage other systems.
Specia l Water-Ef f ic ient Features Special features of towers and water systems that
promote water efficiency include side-stream filtration, sunlight covers, alternative water treatment systems, and automated chemical feed systems.
Air out
Hot
Dry section
Air in
Air in
Wet section
Airflow control louvers
Mixing chamber
Dampers Hot
water water in in
Air Air in in
Cold
Figure 3. A hybrid cooling tower Source: EPRI and CEC 2002.

L A B S F O R T H E 2 1 S T C E N T U R Y 54 L A B S F O R T H E 2 1 S T C E N T U R Y
Side-stream filtration systems cleanse the water with a rapid sand filter or high-efficiency cartridge filter. These systems increase water efficiency and use fewer chemicals because they draw water from the sump, filter out sedi-ment, and return filtered water to the tower. Side-stream filtration is particularly helpful for systems that are subject to dusty atmospheric conditions.
Sunlight covers can reduce the amount of sunlight (and thus heat) on a tower’s surface. They can also signifi-cantly reduce biological growth, such as algae.
Alternative water treatment options, such as ozona-tion or ionization, can reduce water and chemical usage. Such systems can have an impact on energy costs, how-ever, so managers should carefully consider their life-cycle cost.
Automated chemical feeds should be installed on cooling tower systems larger than 100 tons. An automated feed system controls bleed-off by conductivity and adds chemicals according to the make-up water flow. Such systems minimize water and chemical use while optimiz-ing the control of scale, corrosion, and biological growth (Vickers 2002).
Laboratory Process Equipment Three broad areas in which the water efficiency of
a wide range of laboratory process equipment can be improved are cooling of equipment, rinsing, and flow con-trol. These areas can be addressed individually or together to increase the water efficiency of most laboratories.
Equipment Cool ing Single-pass cooling typically consumes more water
than any other cooling method in laboratories. In single-pass or once-through cooling systems, water is circulated once through a piece of equipment and then discharged to a sewer. Single-pass systems use approximately 40 times more water than a cooling tower operating at 5 cycles of concentration to remove the same heat load.
The equipment typically associated with single-pass cooling are CAT scanners, degreasers, hydraulic equip-ment, condensers, air compressors, welding machines, vacuum pumps, ice machines, X-ray equipment, air con-ditioners, process chillers, electron microscopes, gas chro-matographs, and mass spectrometers. Sometimes, research staff members order and install these and other types of equipment that require cooling without consulting facility management. The equipment is usually connected directly to a public water supply, and it drains to a sewer.
The best way to combat the water waste associated with single-pass cooling is to use a process or cooling loop. This loop provides water at a preset temperature to
cool researchers’ equipment. A small packaged chiller or central plant towers can reject the heat from these systems. Other efficient options include reusing single-pass discharge water for irrigation or initial rinses, or for recov-ering the heat from one process for use in another.
Often, the equipment in this category is used only intermittently. So, it can be quite difficult to determine how much of a laboratory’s total water use goes to process equipment. A water meter on the process loop can provide this kind of information. By separating laboratory water from domestic, irrigation, or other cooling water, facil-ity managers can better monitor water quality and usage across the whole facility.
The more complicated equipment used in today’s lab-oratories often requires tighter or more stable temperature control (or both) than a centralized system can provide. Small packaged chillers allow this control and reduce water usage. Such chiller systems consist of a compressor, condenser, evaporator, pump, and temperature control-ler in one small package. The packaged unit recirculates temperature-controlled fluid to a laboratory application to remove heat and maintain a constant temperature. The recirculating fluid picks up heat from the application and returns to the chiller to be cooled to a specified set point before circulating back to the application.
Packaged chillers work in somewhat the same way that large comfort-load chillers do. Laboratory managers may want to compare the amount of energy used by dif-ferent packaged chillers at both part and full loads, and select the most efficient one that meets their needs.
Removing the chiller’s heat can be done by rejecting the heat to either air or water. If an air-cooled condenser is used, it is better to use a design that rejects heat to the out-side air rather than to conditioned laboratory space. The second option would increase inside temperatures and the amount of energy needed for space conditioning. An alter-native is to reject the heat to water (Krupnick 2000). In this case, the cooling water should be recirculated chilled water, or recirculated through a cooling tower. Using once-through cooling water for this purpose is not recommended.
Equipment Used in Rinsing Rinsing equipment can often be made more efficient.
A counter-current rinsing operation is typically the most efficient method (Figure 4). In counter-current rinsing, the flow of rinse water is opposite to that of the workflow. The basic premise is to use the cleanest water only for the final or last stages of a rinse operation; water for early rinsing tasks, when the quality of the rinse water is not as impor-tant, is obtained later in the process. Other efficient rinsing

L A B S F O R T H E 2 1 S T C E N T U R Y4 5 L A B S F O R T H E 2 1 S T C E N T U R Y
Work flow
Water flow
Third rinse tank
Second rinse tank
First rinse tank
Rinsewater in
Rinsewater out
Figure 4. Schematic diagram of counter-current rinsing process (Source: New Mexico Office of the State Engineer 1999; reprinted with permission)
options include batch processing, in which several pieces are cleaned at the same time, and using rinses from one process in another one.
Flow Contro l Many pieces of lab equipment are “on” continuously,
even when the process runs only a few hours per day or a few days per year. Often, the water flow to some of this equipment is only a few gallons per minute. However, a continuous 1.5-gpm trickle flow through a small cooling unit adds up to 788,400 gallons per year.
Using a control or solenoid valve in these applications allows water to flow only when the unit is being used. Another option is to use shut-off valves or timers to turn equipment off after normal working hours and when a process is shut down for maintenance or other reasons.
Laboratory Speci f ic Best Pract ices Water efficiency is an important consideration not
only for special process equipment but in other lab equip-ment, as well. This includes equipment used in laboratory water treatment, sterilization, photographic, X-ray, and vacuum systems.
Water-Treatment Equipment In their day-to-day operations, many laboratories
require high-quality water or water free from mineral and organic contaminants. There are five basic levels of sepa-ration processes: particle filtration, microfiltration, ultra-filtration, nanofiltration, and hyperfiltration. A filtration spectrum (see www.gewater.com/library/ ) illustrates the separation process and size range for common types
of materials. Typically, as finer and finer particles are removed, energy use and water waste increase. Therefore, facility managers will want to choose a filtration process that matches their requirements. For example, reverse osmosis (RO) water should be used only in processes that require very pure water. Because RO produces the purest water, it usually requires the most energy and materials and results in the most waste.
Two streams exit the RO system: the concentrate stream and filtered, purified water. The concentrate is rejected water containing a high level of dissolved miner-als. The concentrate is then typically sent to a drain, or a portion of it is recycled back to the feed stream to increase the system’s overall water recovery. Although the concen-trate is high in dissolved minerals, it can be reused in non-potable applications (e.g., in bathroom commodes) (See Figure 5). However, as with cooling tower blow-down, water quality should be monitored to avoid fouling other systems. The recovery rate (i.e., the ratio of the filtered purified water to the volume of feed water) is typically 50% to 75% for a conventional RO system operating on city feed water.
Dis infect ion/Ster i l izat ion Systems Two types of systems are used for disinfection in labo-
ratories: sterilizers and autoclaves. Sterilizers use water to produce and cool steam and to cool wastewater before discharge. Some units also use water to draw a vacuum to expedite the drying process. Water use in sterilizers ranges from 1 to 3 gpm. Autoclaves use ethylene oxide as the sterilizing medium rather than steam. Water is used to
To make a water pur i f icat ion system moreeff ic ient :• Evaluate the laboratory’s requirements for high-quality water,
including the total volume and the rate at which it will be needed, so that the system can be properly designed and sized.
• Determine the quality of water required in each application; use the lowest appropriate level of quality to guide the system design (FEMP 2004).
• Evaluate the quality of the water supply for a period of time before the system is designed. This evaluation allows designers to accurately characterize the quality of the water supply and helps them determine the best method for attaining the quality level required. For example, city water contains a wide range of impurities. EPA suggests a limit of 500 mg/L for total dissolved solids (TDS) (see also www.epa.gov/safewater/). Note that the TDS of one public water supply has ranged from 33-477 mg/L over the course of a year (New York City Department of Environment 2003).
• Consider using one of the proprietary systems for improving system efficiency; some claim recovery rates up to 95%.
L A B S F O R T H E 2 1 S T C E N T U R Y 76 L A B S F O R T H E 2 1 S T C E N T U R Y
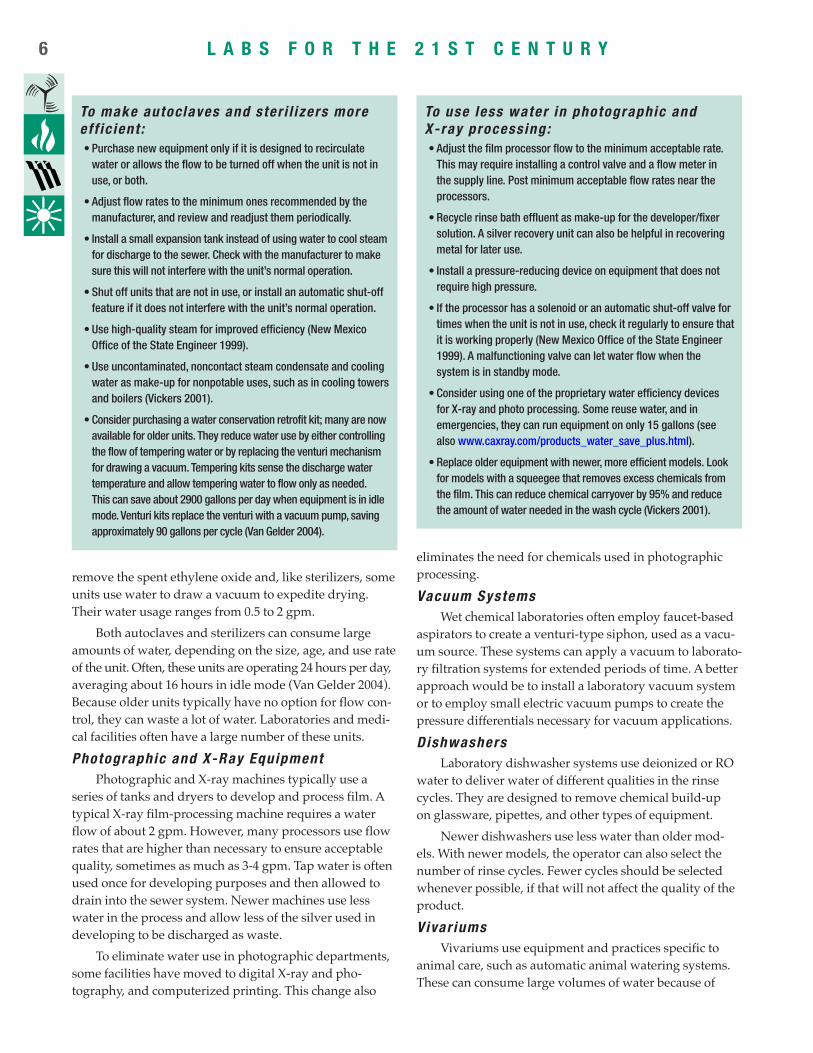
To make autoclaves and ster i l izers moreeff ic ient :• Purchase new equipment only if it is designed to recirculate
water or allows the flow to be turned off when the unit is not in use, or both.
• Adjust flow rates to the minimum ones recommended by the manufacturer, and review and readjust them periodically.
• Install a small expansion tank instead of using water to cool steam for discharge to the sewer. Check with the manufacturer to make sure this will not interfere with the unit’s normal operation.
• Shut off units that are not in use, or install an automatic shut-off feature if it does not interfere with the unit’s normal operation.
• Use high-quality steam for improved efficiency (New Mexico Office of the State Engineer 1999).
• Use uncontaminated, noncontact steam condensate and cooling water as make-up for nonpotable uses, such as in cooling towers and boilers (Vickers 2001).
• Consider purchasing a water conservation retrofit kit; many are now available for older units. They reduce water use by either controlling the flow of tempering water or by replacing the venturi mechanism for drawing a vacuum. Tempering kits sense the discharge water temperature and allow tempering water to flow only as needed. This can save about 2900 gallons per day when equipment is in idle mode. Venturi kits replace the venturi with a vacuum pump, saving approximately 90 gallons per cycle (Van Gelder 2004).
remove the spent ethylene oxide and, like sterilizers, some units use water to draw a vacuum to expedite drying. Their water usage ranges from 0.5 to 2 gpm.
Both autoclaves and sterilizers can consume large amounts of water, depending on the size, age, and use rate of the unit. Often, these units are operating 24 hours per day, averaging about 16 hours in idle mode (Van Gelder 2004). Because older units typically have no option for flow con-trol, they can waste a lot of water. Laboratories and medi-cal facilities often have a large number of these units.
Photographic and X-Ray Equipment Photographic and X-ray machines typically use a
series of tanks and dryers to develop and process film. A typical X-ray film-processing machine requires a water flow of about 2 gpm. However, many processors use flow rates that are higher than necessary to ensure acceptable quality, sometimes as much as 3-4 gpm. Tap water is often used once for developing purposes and then allowed to drain into the sewer system. Newer machines use less water in the process and allow less of the silver used in developing to be discharged as waste.
To eliminate water use in photographic departments, some facilities have moved to digital X-ray and pho-tography, and computerized printing. This change also
To use less water in photographic andX-ray processing:• Adjust the film processor flow to the minimum acceptable rate.
This may require installing a control valve and a flow meter in the supply line. Post minimum acceptable flow rates near the processors.
• Recycle rinse bath effluent as make-up for the developer/fixer solution. A silver recovery unit can also be helpful in recovering metal for later use.
• Install a pressure-reducing device on equipment that does not require high pressure.
• If the processor has a solenoid or an automatic shut-off valve for times when the unit is not in use, check it regularly to ensure that it is working properly (New Mexico Office of the State Engineer 1999). A malfunctioning valve can let water flow when the system is in standby mode.
• Consider using one of the proprietary water efficiency devices for X-ray and photo processing. Some reuse water, and in emergencies, they can run equipment on only 15 gallons (see also www.caxray.com/products_water_save_plus.html).
• Replace older equipment with newer, more efficient models. Look for models with a squeegee that removes excess chemicals from the film. This can reduce chemical carryover by 95% and reduce the amount of water needed in the wash cycle (Vickers 2001).
eliminates the need for chemicals used in photographic processing.
Vacuum Systems Wet chemical laboratories often employ faucet-based
aspirators to create a venturi-type siphon, used as a vacu-um source. These systems can apply a vacuum to laborato-ry filtration systems for extended periods of time. A better approach would be to install a laboratory vacuum system or to employ small electric vacuum pumps to create the pressure differentials necessary for vacuum applications.
Dishwashers Laboratory dishwasher systems use deionized or RO
water to deliver water of different qualities in the rinse cycles. They are designed to remove chemical build-up on glassware, pipettes, and other types of equipment.
Newer dishwashers use less water than older mod-els. With newer models, the operator can also select the number of rinse cycles. Fewer cycles should be selected whenever possible, if that will not affect the quality of the product.
Vivar iums Vivariums use equipment and practices specific to
animal care, such as automatic animal watering systems. These can consume large volumes of water because of
L A B S F O R T H E 2 1 S T C E N T U R Y6 7 L A B S F O R T H E 2 1 S T C E N T U R Y
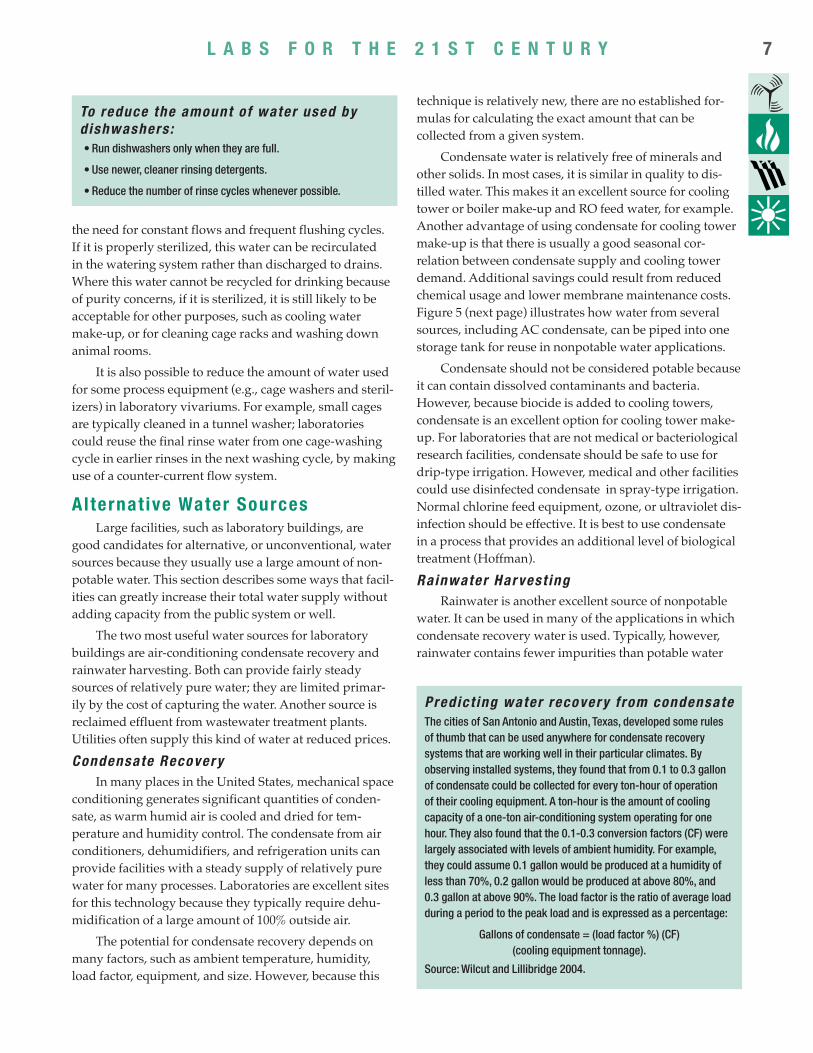
To reduce the amount of water used bydishwashers :• Run dishwashers only when they are full.
• Use newer, cleaner rinsing detergents.
• Reduce the number of rinse cycles whenever possible.
the need for constant flows and frequent flushing cycles. If it is properly sterilized, this water can be recirculated in the watering system rather than discharged to drains. Where this water cannot be recycled for drinking because of purity concerns, if it is sterilized, it is still likely to be acceptable for other purposes, such as cooling water make-up, or for cleaning cage racks and washing down animal rooms.
It is also possible to reduce the amount of water used for some process equipment (e.g., cage washers and steril-izers) in laboratory vivariums. For example, small cages are typically cleaned in a tunnel washer; laboratories could reuse the final rinse water from one cage-washing cycle in earlier rinses in the next washing cycle, by making use of a counter-current flow system.
Alternat ive Water Sources Large facilities, such as laboratory buildings, are
good candidates for alternative, or unconventional, water sources because they usually use a large amount of non-potable water. This section describes some ways that facil-ities can greatly increase their total water supply without adding capacity from the public system or well.
The two most useful water sources for laboratory buildings are air-conditioning condensate recovery and rainwater harvesting. Both can provide fairly steady sources of relatively pure water; they are limited primar-ily by the cost of capturing the water. Another source is reclaimed effluent from wastewater treatment plants. Utilities often supply this kind of water at reduced prices.
Condensate Recovery In many places in the United States, mechanical space
conditioning generates significant quantities of conden-sate, as warm humid air is cooled and dried for tem-perature and humidity control. The condensate from air conditioners, dehumidifiers, and refrigeration units can provide facilities with a steady supply of relatively pure water for many processes. Laboratories are excellent sites for this technology because they typically require dehu-midification of a large amount of 100% outside air.
The potential for condensate recovery depends on many factors, such as ambient temperature, humidity, load factor, equipment, and size. However, because this
technique is relatively new, there are no established for-mulas for calculating the exact amount that can be collected from a given system.
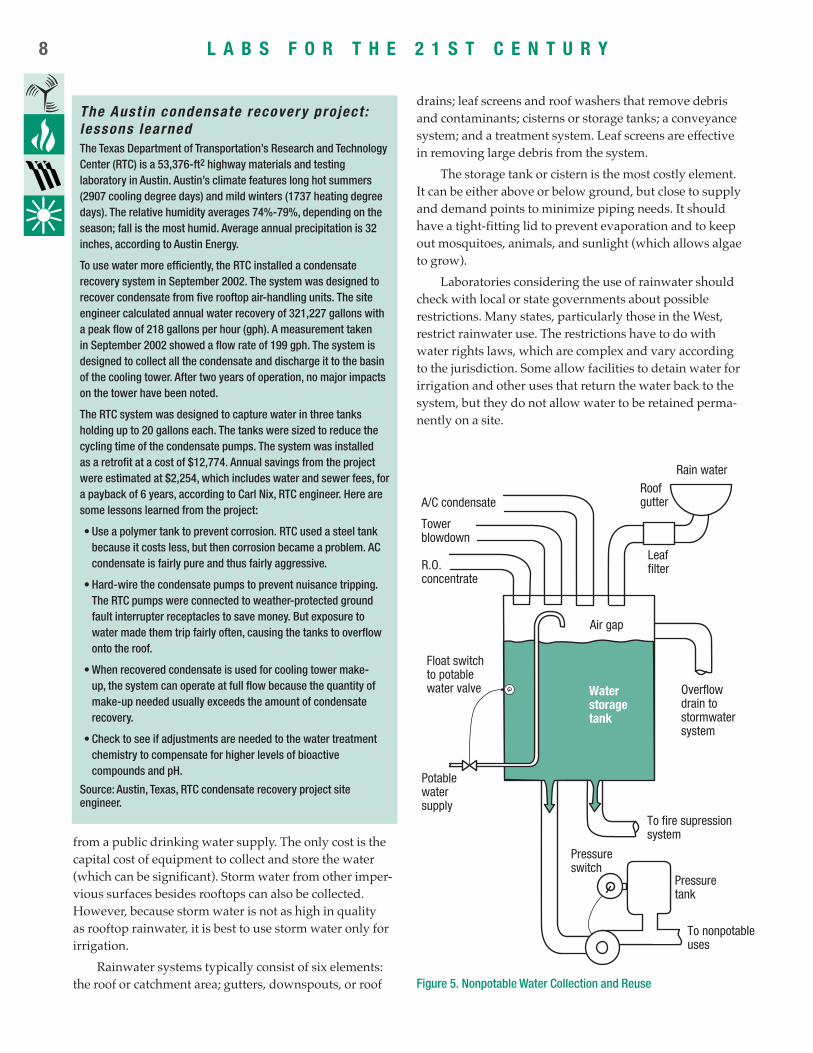
Condensate water is relatively free of minerals and other solids. In most cases, it is similar in quality to dis-tilled water. This makes it an excellent source for cooling tower or boiler make-up and RO feed water, for example. Another advantage of using condensate for cooling tower make-up is that there is usually a good seasonal cor-relation between condensate supply and cooling tower demand. Additional savings could result from reduced chemical usage and lower membrane maintenance costs. Figure 5 (next page) illustrates how water from several sources, including AC condensate, can be piped into one storage tank for reuse in nonpotable water applications.
Condensate should not be considered potable because it can contain dissolved contaminants and bacteria. However, because biocide is added to cooling towers, condensate is an excellent option for cooling tower make-up. For laboratories that are not medical or bacteriological research facilities, condensate should be safe to use for drip-type irrigation. However, medical and other facilities could use disinfected condensate in spray-type irrigation. Normal chlorine feed equipment, ozone, or ultraviolet dis-infection should be effective. It is best to use condensate in a process that provides an additional level of biological treatment (Hoffman).
Rainwater Harvest ing Rainwater is another excellent source of nonpotable
water. It can be used in many of the applications in which condensate recovery water is used. Typically, however, rainwater contains fewer impurities than potable water
Predict ing water recovery f rom condensate The cities of San Antonio and Austin, Texas, developed some rules of thumb that can be used anywhere for condensate recovery systems that are working well in their particular climates. By observing installed systems, they found that from 0.1 to 0.3 gallon of condensate could be collected for every ton-hour of operation of their cooling equipment. A ton-hour is the amount of cooling capacity of a one-ton air-conditioning system operating for one hour. They also found that the 0.1-0.3 conversion factors (CF) were largely associated with levels of ambient humidity. For example, they could assume 0.1 gallon would be produced at a humidity of less than 70%, 0.2 gallon would be produced at above 80%, and 0.3 gallon at above 90%. The load factor is the ratio of average load during a period to the peak load and is expressed as a percentage:
Gallons of condensate = (load factor %) (CF) (cooling equipment tonnage).
Source: Wilcut and Lillibridge 2004.
L A B S F O R T H E 2 1 S T C E N T U R Y 9
��
��
��
����
8 L A B S F O R T H E 2 1 S T C E N T U R Y
The Aust in condensate recovery project :lessons learnedThe Texas Department of Transportation’s Research and Technology Center (RTC) is a 53,376-ft2 highway materials and testing laboratory in Austin. Austin’s climate features long hot summers (2907 cooling degree days) and mild winters (1737 heating degree days). The relative humidity averages 74%-79%, depending on the season; fall is the most humid. Average annual precipitation is 32 inches, according to Austin Energy.
To use water more efficiently, the RTC installed a condensate recovery system in September 2002. The system was designed to recover condensate from five rooftop air-handling units. The site engineer calculated annual water recovery of 321,227 gallons with a peak flow of 218 gallons per hour (gph). A measurement taken in September 2002 showed a flow rate of 199 gph. The system is designed to collect all the condensate and discharge it to the basin of the cooling tower. After two years of operation, no major impacts on the tower have been noted.
The RTC system was designed to capture water in three tanks holding up to 20 gallons each. The tanks were sized to reduce the cycling time of the condensate pumps. The system was installed as a retrofit at a cost of $12,774. Annual savings from the project were estimated at $2,254, which includes water and sewer fees, for a payback of 6 years, according to Carl Nix, RTC engineer. Here are some lessons learned from the project:
• Use a polymer tank to prevent corrosion. RTC used a steel tank because it costs less, but then corrosion became a problem. AC condensate is fairly pure and thus fairly aggressive.
• Hard-wire the condensate pumps to prevent nuisance tripping. The RTC pumps were connected to weather-protected ground fault interrupter receptacles to save money. But exposure to water made them trip fairly often, causing the tanks to overflow onto the roof.
• When recovered condensate is used for cooling tower make-up, the system can operate at full flow because the quantity of make-up needed usually exceeds the amount of condensate recovery.
• Check to see if adjustments are needed to the water treatment chemistry to compensate for higher levels of bioactive compounds and pH.
Source: Austin, Texas, RTC condensate recovery project site engineer.
from a public drinking water supply. The only cost is the capital cost of equipment to collect and store the water (which can be significant). Storm water from other imper-vious surfaces besides rooftops can also be collected. However, because storm water is not as high in quality as rooftop rainwater, it is best to use storm water only for irrigation.
Rainwater systems typically consist of six elements: the roof or catchment area; gutters, downspouts, or roof
drains; leaf screens and roof washers that remove debris and contaminants; cisterns or storage tanks; a conveyance system; and a treatment system. Leaf screens are effective in removing large debris from the system.
The storage tank or cistern is the most costly element. It can be either above or below ground, but close to supply and demand points to minimize piping needs. It should have a tight-fitting lid to prevent evaporation and to keep out mosquitoes, animals, and sunlight (which allows algae to grow).
Laboratories considering the use of rainwater should check with local or state governments about possible restrictions. Many states, particularly those in the West, restrict rainwater use. The restrictions have to do with water rights laws, which are complex and vary according to the jurisdiction. Some allow facilities to detain water for irrigation and other uses that return the water back to the system, but they do not allow water to be retained perma-nently on a site.
���� �����
�����
�� ���������� ��
���������� �����
��
� �
�
��
�
���
��
��� � ����� ��
��� � �� ���������� ������
�� � �� ������� �� ������
�������� ����
�� ������������
�������� �� ���
���� ������
���� ���
� ���
��� �� ���
��
��� ����������
������
�����������
����� ������� ����
Figure 5. Nonpotable Water Collection and Reuse
L A B S F O R T H E 2 1 S T C E N T U R Y8 9 L A B S F O R T H E 2 1 S T C E N T U R Y
To determine the amount of ra inwater that can be col lected at a s i te : First, determine the collection area, average rainfall, and collection efficiency. The collection area is the total square footage of the roof or catchment area. The average rainfall for a site can be obtained from National Weather Service data. Because of seasonal variations, rainwater should be considered in terms of variable monthly supply and demand for supplemental uses. To develop a collection range, use average rainfall as a maximum and half the average rainfall as a minimum, to represent drought conditions. The conversion factor is as follows: 1 inch of precipitation on 1 square foot of collection area yields 0.6233 gallon.
Rainwater volume (gal) = collection area (ft2) * collection efficiency (%) * avg. rainfall (in.) * 0.6233 (gal/in.).
The collection efficiency depends on such factors as roof material, diversion amount, and design retention. The smoother, cleaner, and more impervious the roof surface, the more high-quality water can be collected. Pitched metal roofs lose negligible amounts of water, concrete or asphalt roofs lose an average of about 10%, and built-up tar and gravel roofs lose as much as 15%. Flat roofs can retain as much as half an inch. Some water is lost to spillover in drains and gutters; some cisterns become full during periods of heavy rain, and some water can be lost to overflow. So, many installers assume efficiencies between 75% and 90% (Texas Water Board 1997).
Rainwater and condensate recovery systems can be expensive to install as retrofits. Storage capacity in partic-ular is expensive. However, properly sizing the system to match demand to supply could greatly reduce costs. The real value of these systems comes from the high quality of water they provide.
A laboratory complex in Washington, D.C., provides a hypothetical example of rainwater harvesting. The site receives an average of 43 inches of precipitation each year. The complex has a roof area of 54,000 ft2. With a collection efficiency of only 75%, the facility could capture about 1,085,477 gallons of rainwater annually. The site would save on both water and sewer fees if water normally drains to the sewer. Using a pricing rate similar to those in the condensate recovery example, this system would save $5,970 per year in water costs.
Recla imed Wastewater Reclaimed wastewater is an option in limited cir-
cumstances, when a laboratory has access to municipal wastewater that has been treated to a secondary disinfec-tion level or when treated wastewater can be generated cost effectively on site. Reclaimed wastewater might be used for some nonpotable applications, such as cooling tower make-up. An example is the Nicholas C. Metropolis Modeling and Simulation Center at Los Alamos National
Laboratory (LANL) in New Mexico. The center uses treat-ed wastewater from the LANL complex for cooling tower applications.
The EPA regulates wastewater discharge but does not regulate water reuse applications or quality. There are uniform national requirements only for biological oxygen demand, total suspended solids, and pH. The National Pollutant Discharge Elimination System (NPDES) regu-lates all other contaminants by region and body of water.
Design Considerat ions One of the most important ways to begin using water
more efficiently is to create a water balance. A water bal-ance shows the sources and uses of water on a site. It can be very detailed or cover only major uses; it can show usage at the whole site or in certain buildings or opera-tions. The objective is to show where and how water is being used, what the sources are, and how much water is being disposed of. In new facilities, a balance can help designers plan equipment layouts and identify opportuni-ties for greater efficiency. In existing facilities, it can help laboratory managers identify leaks, other losses, and pos-sible misuses. Although it is not possible to account for every drop, well-managed facilities can usually account for 85%–95% of the water they purchase.
Creat ing a Water Balance The first step is to document all major water-using
equipment and processes at the site and usage amounts. The water quality required for each use can also be includ-ed, as well as information about the local climate, such as monthly averages for evapotranspiration rate, relative humidity, temperature, and precipitation.
To f ind the source of an imbalance in water purchases vs . water usage: • Check grounds and facilities for obvious water or steam leaks in
piping, distribution, chilled water or irrigation systems, and other equipment.
• Check the main water meter at night and again in the morning to see if there is a large amount of unexplained usage that indicates a leak in the system.
• Review recent utility bills (about 2 years’ worth) to understand trends in water use over time.
• Complete a detailed survey of staff and equipment to identify or verify the principal water users and water-using equipment.
• Ask researchers and facility staff how their equipment is being used, if actual usage is higher than original estimates.

L A B S F O R T H E 2 1 S T C E N T U R Y 1110 L A B S F O R T H E 2 1 S T C E N T U R Y
X
X
X Sewer
Fresh water
Cooling towers
Lawn/grounds irrigation
UPW
Exhaust scrubbers
After ConstructionSewer
Fresh water
Cooling towers
Lawn/grounds irrigation
UPW
Exhaust scrubbers
Before Construction
AWN FAB
AWN FAB
Figure 6. The diagrams show how water efficiency measures at an Intel plant in Rio Rancho, New Mexico, have changed the way in which water flows through the facility (UPW = ultra-pure water; FAB = fabrication plant; AWN = acid waste neutralization facility). (Source: New Mexico Office of the State Engineer 1999; reprinted with permission)
The second step is to determine whether known pur-chases equal known usage. If these two are in balance, the next step is to look for opportunities for greater efficiency in each major usage category and determine whether water from one process can be used elsewhere cost effectively. If purchases and usage do not balance, how-ever, more investigation is needed. Often, the chief cul-prit is a lack of information. A thorough review can help laboratory managers fill in any missing information and discover the source of the imbalance.
Figure 6 shows a water balance for a microprocessor plant near Albuquerque, New Mexico. By rethinking the water quality needs of certain applications, plant staff were able to use water discharges from one process for a number of others. For example, reject water from ultra-pure water systems can be used to irrigate the grounds. Ultra-pure water discharged from fabrication processes is clean enough for use in cooling towers and exhaust scrub-bers. The company also implemented a number of efficien-cy measures within the plant to make better use of water. The plant has been able to maintain water use at about 4 million gallons per day despite an increase in production of 70% (New Mexico Office of the State Engineer 1999).
Design Planning Laboratory designers will want to consider water uses
and sources early in the design process. The following list shows where each topic discussed in this guide should be addressed in the design process. During the Schematic Design Phase • Identify appropriate alternative water sources.
• Locate collection or storage areas.
• For multibuilding campuses, design the building lay-out to reduce the size of the distribution system.
• Include a process or cooling loop for all equipment.
• Include a vacuum system.
• Include condensate and chilled water return systems.
During the Design Development Phase • Identify any processes that can use water from other
processes or that can supply water to processes.
• Meter all major water-using processes.
• Select equipment with water-saving features.
C o n clu s io n Because laboratories need more water to meet process
and cooling loads, among other requirements, they usual-ly use much more water per square foot than conventional commercial buildings do. However, this greater usage also provides laboratories with significant opportunities to reduce their total water use by making cost-effective improvements wherever possible. Many government agencies and organizations—such as the DOE Federal Energy Management Program, the EPA, and the American Water Works Association—have published guidelines and recommendations on water efficiency for industrial, com-mercial, and laboratory buildings. These water efficiency guidelines can help you use less water today to ensure that the nation will have safe, secure supplies tomorrow.
L A B S F O R T H E 2 1 S T C E N T U R Y10 11 L A B S F O R T H E 2 1 S T C E N T U R Y
References American Water Works Association (AWWA). 1993.
Helping Businesses Manage Water Use: A Guide for Water Utilities. Denver, CO: AWWA.
Electric Power Research Institute (EPRI) and California Energy Commission (CEC). 2002. Comparison of Alternate Cooling Technologies for California Power Plants: Economic, Environmental, and Other Tradeoffs. Palo Alto, CA: EPRI; Sacramento, CA: CEC. Available at www.energy.ca.gov/reports/2002-07-09_500-02-079F.PDF. Accessed August 2004.
Federal Energy Management Program. June 2004. Saving Energy, Water and Money with Efficient Water Treatment Technologies, A FEMP Technology Focus. DOE/ EE-0294. Washington, DC: U.S. Department of Energy.
Hoffman, Bill. Coordinator—Commercial Industrial Programs, City of Austin, TX, water department.
Krupnick, Stu. July 2000. “Realizing Chillers’ Capabilities in Laboratories.” Process Cooling and Equipment, A Supplement to Process Heating Magazine. Available online at www.process-cooling.com/CDA/ ArticleInformation/features/BNP__Features__Item/ 0,3674,7515,00.html. Accessed August 2004.
New Mexico Office of the State Engineer. July 1999. A Water Conservation Guide for Commercial, Institutional and Industrial Users. Albuquerque, NM: Office of the State Engineer. Available online at www.seo.state.nm.us/ water-info/conservation/pdf-manuals/cii-users-guide. pdf. Accessed August 2004.
New York City Department of Environmental Protection. 2003. New York City Drinking Water Supply and Quality Report. Available online at www.nyc.gov/ html/dep/pdf/wsstat03.pdf. Accessed August 2004.
Puckorius, Paul. November 2002. “Water Conservation Via Optimizing Water Use.” Process Cooling and Equipment, A Supplement to Process Heating Magazine. Available online at www.process-cooling. com/CDA/ArticleInformation/Water_Works_Item/ 0,3677,87663,00.html. Accessed August 2004.
Tanner, Stephanie, Eva Urbatsch, and Anna Hoenmanns. 2003. Water Efficiency Plan. Internal Publication. Golden, CO: National Renewable Energy Laboratory.
Texas Water Development Board. 1997. Texas Guide to Rainwater Harvesting, Second Edition. Austin: Texas Water Development Board.
Van Gelder, Roger E. 2004. “Field Evaluation of Three Models of Water Conservation Kits for Sterilizer Trap Cooling at University of Washington.” Presented at the
2004 Water Sources Conference & Exposition, January 11–14, Austin, Texas.
Vickers, Amy. 2001. Handbook of Water Use and Conservation. Amherst, MA: Water Plow Press.
Wilcut, Eddie, and Brian Lillibridge. 2004. “Condensate 101—Calculations and Applications.” Presented at the 2004 Water Sources Conference & Exposition, January 11-14, Austin, Texas.
Addit ional Resources Federal Energy Management Program. Best
Management Practices for Water Conservation at Federal Facilities. Washington, DC: U.S. Department of Energy. Available online at www.eere.energy.gov/femp/ technologies/water_fedrequire.cfm. Accessed August 2004.
North Carolina Department of Environment and Natural Resources’ Division of Pollution Prevention and Environmental Assistance, Water Efficiency: Water Management Options. Available online at http:// www.p2pays.org/ref/04/03101.pdf. Accessed September 2004.
U.S. Department of Defense. Military Handbook 1165: Water Conservation. Washington, DC: DoD, 7 April 1997. Available online at https://energy.navy.mil/ publications/water/mil_hdbk_1165.pdf. Accessed August 2004.
Acknowledgments Stephanie Tanner was the principal author of this
publication. The author wishes to thank Bill Hoffman, City of Austin Water Department, for information on rainwa-ter harvesting and A/C condensate recovery, and James Kohl, URS Corp., for initial research. Roy Sieber of ERG and Otto Van Geet, P.E., Nancy Carlisle, A.I.A, and Sheila Hayter, P.E., all of NREL, provided helpful comments and peer reviews. Paula Pitchford and Susan Sczepanski of NREL provided editing and graphic design.

DOE/GO-102005-2008
iic i i
202-646-5218
i
202-564-7509 [email protected]
202-586-3120 [email protected]
i
L A B S F O R T H E 2 1 S T C E N T U R Y 12
Laboratories for the 21st Century U.S. Environmental Protection Agency Office of Administration and Resources Management www.labs21century.gov
In partnership with the U.S. Department of Energy Energy Efficiency and Renewable Energy Bringing you a prosperous future where energy is clean, abundant, reliable, and affordable www.eere.energy.gov
Prepared at the National Renewable Energy Laboratory A DOE national laboratory
May 2005
Printed with a renewable-source ink on paper containing at least 50% wastepaper, including 20% postconsumer waste
For More Informat on On Water-Ef f ent Laborator es: Stephanie Tanner National Renewable Energy Laboratory 901 D Street, S.W., Suite 930 Washington, D.C. 20024
On Laborator es for the 21st Century : Dan Amon U.S. Environmental Protection Agency 1200 Pennsylvania Ave., N.W. (mail code 3204R) Washington, DC 20460
Will Lintner U.S. Department of Energy Federal Energy Management Program 1000 Independence Ave., S.W. Washington, DC 20585
Best Pract ces on the Web: www.labs21century.gov