Labor Productivity, Wages, Nationality, and … Productivity, Wages, Nationality, and Foreign...
108
Labor Productivity, Wages, Nationality, and Foreign Ownership Shares in Thai Manufacturing, 1996-2000 Eric D. Ramstetter Chief, Research Division, ICSEAD and Visiting Professor, Graduate School of Economics, Kyushu University Working Paper Series Vol. 2003-15 July 2003 The views expressed in this publication are those of the author(s) and do not necessarily reflect those of the Institute. No part of this book may be used reproduced in any manner whatsoever without written permission except in the case of brief quotations embodied in articles and reviews. For information, please write to the Centre. The International Centre for the Study of East Asian Development, Kitakyushu
Transcript of Labor Productivity, Wages, Nationality, and … Productivity, Wages, Nationality, and Foreign...

Labor Productivity, Wages, Nationality, and Foreign Ownership Shares in Thai Manufacturing, 1996-2000
Eric D. Ramstetter
Chief, Research Division, ICSEAD and
Visiting Professor, Graduate School of Economics, Kyushu University
Working Paper Series Vol. 2003-15
July 2003
The views expressed in this publication are those of the author(s) and
do not necessarily reflect those of the Institute.
No part of this book may be used reproduced in any manner whatsoever
without written permission except in the case of brief quotations
embodied in articles and reviews. For information, please write to the
Centre.
The International Centre for the Study of East Asian Development, Kitakyushu

1
Labor Productivity, Wages, Nationality, and Foreign Ownership Shares in Thai Manufacturing, 1996-2000
by
Eric D. Ramstetter1
Chief, Research Division, International Centre for the Study of East Asian Development (ISCEAD)
11-4 Otemachi, Kokurakita-ku, Kitakyushu, 803-0814, Japan (email [email protected])
and Visiting Professor, Graduate School of Economics, Kyushu University
July 2003
Abstract
This paper compares labor productivity and wages among nationality and ownership groups of foreign multinational corporations (MNCs) and local plants in Thai manufacturing for 1996, 1998, and 2000. Disaggregating foreign MNCs by nationality or foreign ownership share revealed a few significant differences in both labor productivity and wages that were not present in more aggregate specifications. In these cases, there was a weak tendency for MNCs from Europe, Japan, and the United States to have relatively high labor productivity and wages, for wholly foreign MNCs to have relatively high labor productivity, and for majority- and wholly foreign MNCs to pay relatively high wages. However, these results suggest that the relationships among labor productivity or wages, on the one hand, and nationality or foreign ownership shares, on the other hand, were generally weak in Thai manufacturing. These results are also consistent with those of previous studies in suggesting that the relationship between labor productivity and foreign ownership in general was also rather weak, though the relationship between wages and foreign ownership was somewhat stronger. JEL Classification: D24, F23, O53 Keywords: multinational corporations, nationality, foreign ownership shares, labor productivity, wages, Thai manufacturing
1 I thank Somsak Tambunlertchai for assistance in obtaining the data used in this study and for advice. I also thank Erik Jones, Robert E. Lipsey, Atsuko Matsuoka, Oleksandr Movshuk, Michael G. Plummer, Fredrik Sjöholm, Sadayuki Takii, and Yaohui Zhao, among others, for comments. This paper was completed as a part of ICSEAD's project "Foreign Multinational Corporations and Host-Country Labor Markets in Asia" and I thank ICSEAD and Kyushu University for funding that supported the study. However, I am solely responsible for all remaining errors and for all opinions expressed.

2
1. Introduction
Previous studies of foreign MNCs in Thailand present two puzzles for economists. First, most
studies suggest that foreign MNCs have generally had higher labor productivity than local plants or firms but
that differences in labor productivity, as well as more general differences in production technology were
often insignificant statistically.2 These results are puzzling because they contrast markedly with the
conclusions suggested by theoretical analysis and with similar results obtained for other countries.3 Second,
despite the inability to find statistically significant differences in labor productivity, previous studies suggest
that foreign MNCs often paid significantly higher wages. This finding of higher wages in foreign MNCs is
more consistent with theoretical predictions and findings from other countries.4 However, the combined
finding of significant differences in wages but insignificant differences in labor productivity is puzzling to
the extent that one would expect wage differentials and labor productivity differentials to be correlated in
competitive markets. Correspondingly this suggests that labor and/or output markets may not be
competitive in Thailand, at least when foreign MNCs are involved.
One reason for the above findings could be that previous analyses omitted important factors from
their analyses. Moran (2001), for example, suggests that distinguishing by foreign ownership share is very
important and there is a strong theoretical rationale for expecting this distinction to be important as discussed
below. A second distinction of potential importance is the nationality of investor, a distinction that was first
emphasized by Kojima (1978). Although some previous studies of Thai manufacturing have attempted to
account for these factors, no known study has attempted to analyze the effects of nationality and foreign
2 These studies include analyses of limited data sets primarily covering firms promoted by the Board of Investment (BOI) for 1973-1974 and 1985-1986 (Ramstetter and Tambunlertchai 1991), 1982-1983 (Khanthachai et al. 1987), and 1990 (Ramstetter 1993, 1994), as well as from analyses of the more comprehensive data sets for 1996 and 1998 similar to those used here (Ramstetter 2001a, 2001b, 2002b). 3 See, for example, studies of Indonesia (Hill 1988, pp. 107-120; Okamoto and Sjöholm 2000; Sjöholm 1998; Takii 2002; Takii and Ramstetter 2000), Mexico (Blomström 1990, pp. 28-34), and 5 Asian economies (Ramstetter 1999a). 4 See studies of Thailand for 1990 in Ramstetter (1994) and 1996 in Matsuoka (2001a, 2001b, 2001c). See also studies of Indonesia by Hill (1990), Lipsey and Sjöholm (2001, 2002), and Manning (1993) and 5 Asian economies by Ramstetter (1999a).

3
ownership shares on both labor productivity and wages in a consistent framework at the industry level.5
The primary goal of this study is to fill this gap in the literature and see if there are statistically significant
differences in labor productivity and wages among nationality and ownership groups of foreign MNCs and
local plants, after removing the influences of other determinants such as factor intensities, policy status
(proxied by promotion by the Board of Investment or BOI), size, and vintage. A second aim of the paper is
to see if labor productivity and wages in European plants, in particular, differ from other foreign plants in
Thailand and if so, how. The paper first reviews the theoretical and methodological issues involved
(Section 2). It then summarizes important characteristics of the data used and examines the shares of
foreign MNCs in Thai manufacturing (Section 3), before reporting the results obtained (Section 4), and
offering some concluding remarks (Section 5).
2. Theoretical Principles and Methodology
The theoretical literature on MNCs provides a very simple and important rationale for expecting
MNCs to be more efficient than non-MNCs in at least some respects. Namely most theorists agree that
MNCs tend to possess firm-specific assets, especially intangible assets related to production techniques and
processes, marketing networks, and/or management ability, in relatively large amounts.6 There is also a
large literature documenting the tendency for MNCs to spend relatively large amounts on research and
development and advertising, as well as to possess a relatively large number of patents (e.g., Caves 1996;
Dunning 1993; Markusen 1991). If foreign MNCs possess relatively large amounts of these firm-specific 5 Ramstetter (1994, 2001a, 2001b) also investigates differences in labor productivity among nationality and ownership groups of foreign MNCs, including European MNCs, finding that these differences tend to be statistically insignificant in 1990, 1996, and 1998. In contrast, Ramstetter (1994) and Matsuoka (2001c) also report evidence that MNCs from the triad (Europe, Japan, and the United States) paid higher wages than MNCs from 3 of Asia’s newly industrializing economies (NIEs: Korea, Singapore, Taiwan; Hong Kong is the other NIE but Hong Kong MNCs are not identified in these data sets) in 1990 and 1996 while Matsuoka (2001c) also reports that 1996 wages tended to be highest in majority-foreign plants, followed by wholly-foreign and minority-foreign plants. 6 A large body of this literature (e.g., Dunning 1988, 1993; Hymer 1960; Markusen 1991) asserts that the possession of firm-specific assets, is a necessary condition for a firm to become a MNC. Another body of literature (e.g., Buckley and Casson 1992; Casson 1987; Rugman 1980, 1985) disputes this view, asserting that internalization is the sole necessary condition for a firm to become a MNC, and that the possession of firm-specific assets is a sufficient but not a necessary condition for a firm to become a MNC. However, all agree that MNCs tend to possess these assets in relatively large amounts.

4
assets, then it is likely that other factors of production, including labor, will be more productive in MNCs
than in non-MNCs. If labor is more productive in MNCs, it is further likely that wages will be relatively
high in MNCs because firms’ labor demand is determined in large part by the labor productivity. Another
reason that labor productivity and wages may be high in MNCs, especially in foreign MNCs operating in
developing economies, is that foreign MNCs tend to be more capital and skill intensive than local firms.
Still another reason that foreign MNCs may pay higher wages is because MNCs often have difficulties
harmonizing their labor management practices with local norms, which results from differences in business
culture in foreign-owned MNCs and local firms, and can create a preference for local firms among workers.
This can create a wage premium for workers in MNCs, reflecting the extra payments necessary to woo
workers away from local firms that employ more commonly accepted labor management practices.
One of the most obvious and well-documented differences among nationality groups of MNCs is
the difference often observed in labor management practices. This has been particularly well documented
in the case of Japanese MNCs in Southeast Asia, which have generally employed a number of practices that
differ greatly from local firms or their European or U.S. counterparts (e.g., Koike and Inoki 1990; Yamashita
1992). Another question is whether the endowments of firm-specific assets possessed by a MNC are
somehow related to the nationality of the MNC. Of particular interest in this context is the idea that MNCs
from relatively low-income home economies may possess relatively small amounts of relatively low-quality,
firm-specific assets compared to MNCs from richer economies.7 Several theoreticians have disputed these
arguments and it is generally hard to find empirical evidence that labor productivity, wage levels, or other
indicators of MNC performance are systematically related to the nationality of MNCs in Asia.8
Nonetheless, these assertions have stirred interest among academics and policy makers alike and it is
certainly possible that there may be differences in MNCs by nationality if the home countries and their
7 This is implied by Dunning’s (1988 ch. 5) investment development cycle that relates a country’s net FDI position to the level of development. Kojima’s (1978) assertions that Japanese FDI in the 1970s was more trade-oriented because it embodied factor-proportions that better matched the comparative advantages of host Asian economies than U.S. and European FDI, can be interpreted in a similar light. 8 See Buckley (1985) for a criticism of Kojima’s theoretical propositions and Hill and Johns (1985), Naya and Ramstetter (1992); and Ramstetter (1994, 1999a) for empirical evidence.

5
MNCs differ greatly in important respects, particularly with respect to the quantity and/or nature of the
firm-specific assets they control. In the Thai case, this would suggest that European MNCs and U.S.
MNCs are likely to resemble each other and perhaps Japanese MNCs as well, while MNCs from poorer
home economies might differ.
An important and related point is that parents of MNCs are often though to restrict the access of
their foreign affiliates to the MNC’s firm-specific assets depending on the degree of control the parent
exercises over the affiliate. In this context, it is often argued that MNC parents are more reluctant to share
their technology-related assets with minority-owned affiliates than with their majority-owned or
wholly-owned affiliates (Chao and Yu 1996; Caves 1996, ch. 3, 7, 9; Dunning 1993, ch 7-9, 11; Moran
2001). Moreover, there is now a growing empirical literature suggesting that parents restrict access to
exporting networks, which are another important firm-specific asset controlled by MNCs, in affiliates with
relatively small foreign ownership shares in Southeast Asia.9 However, the corresponding evidence with
respect to productivity is much more mixed, at least in Indonesia and Thailand where larger foreign
ownership shares are not necessarily correlated with higher productivity (Ramstetter 2001a; Takii 2002).
Here it should be recognized that, although MNC parents may be hesitant to share production
technology-related assets with minority-owned affiliates for fear of losing control of those assets, MNC
parents may also want to share technology in order to generate high productivity and large profits in those
same affiliates. The relative importance of these competing motives is an empirical matter. In addition, it
is also much more difficult to prevent the spread of production technology through labor turnover, for
example, than to prevent access to marketing networks.
This paper focuses on differences in labor productivity and wages, which is only one aspect of
productivity and factor payments. The results of productivity and/or factor payment comparisons between
foreign MNCs and local firms often differ depending on the productivity or factor payment measure used.10.
9 See evidence for Indonesia, Singapore, and Thailand in Ramstetter (1994, 1998, 1999a, 1999b, 2002a). 10 For example other productivity measures include capital productivity and the productivity of intangible assets. A lot of economic literature also focuses on total factor productivity, which includes unexplained productivity. Unexplained productivity includes important elements of productivity, for example the productivity of intangible assets that are not measured explicitly, but it also includes errors in productivity

6
Moreover, productivity and factor payments are only two of several important aspects in which foreign
MNCs can be expected to differ from local plants. Although this focus on labor productivity and wages is
somewhat limited, it is also meaningful because these are two of the most important aspects in which foreign
MNCs affect host economies and their workers.
The simplest method of comparing labor productivity and wages in groups of foreign MNCs and
local plants is to calculate mean labor productivity and mean wages for each ownership group and compare
those mean values. One could also test for statistical differences among the mean values for various
ownership groups using simple t-tests. However, such simple comparisons have the large disadvantage of
ignoring other factors affecting labor productivity and wages, such as factor intensity, policy biases, plant
size, and vintage. More sophisticated comparisons of labor productivity try to remove the effects of these
other factors in order to isolate differences in labor productivity that can be attributed more clearly to
differences in ownership and the differences in endowments of firm-specific assets thought to underlie
differences in ownership.11
Because flexible functional forms are very difficult to implement econometrically when there are
a large number of ownership or nationality groups to compare, this paper employs a simpler approach used
in several previous studies (e.g., Blomström 1990, pp. 28-34; Ramstetter 1994; Takii and Ramstetter 2000),
comparing labor productivity in the context of a Cobb-Douglas function with constant returns to scale and
analyzing similar specification of the wage equation.12 In other words, both average labor productivity and
wages are first viewed as a function of skill intensity, proxied by the ratio of non-production workers to all measurement that result from the inability to define and measure inputs and outputs with precision, the inability to correctly specify production technology, and/or statistical problems encountered when estimating productivity. Therefore, a focus on total factor productivity can be misleading because it is impossible to distinguish the productivity of unmeasured factors and errors in productivity measurement. 11 In the case of wages, differences among ownership groups may also reflect the wage premium foreign MNCs must pay to woo workers away from local plants. 12 This assumption has the drawback of implying some very restrictive assumptions about the production function, namely that the elasticity of substitution is one, there are constant returns to scale, and differences in ownership only affect average labor productivity. However, even slightly more flexible functional forms such as the Cobb-Douglas function with variable returns to scale are difficult to estimate because of apparent multicollinearity, even when there are only three groups of MNCs to compare; see Ramstetter (2001a) for an example. A second advantage this formulation is that estimating labor productivity and wages as a function of factor intensities is the reduced probability that heteroscedasticity will be a problem compared to estimating production as a function of labor and capital in levels, for example.

7
workers, and physical capital intensity or fixed assets per hour worked. Unfortunately, the measure of skill
intensity available in these data sets is very rough, which means that there may be skill-related reasons for
differences in productivity and wages that are not captured here. Dummy variables identifying plants
promoted by the Thai Board of Investment (BOI), older plants, and large plants are added to these equations
are added to account for the effects BOI status, vintage, and size might impart.13 Dummy variables
identifying foreign MNCs, two groupings of foreign MNCs by nationality, and one grouping of foreign
MNCs by ownership share are then added to see if average labor productivity differs between foreign MNCs
and local plants or among groups of foreign MNCs. The following eight equations are thus estimated:
(1) ln(V/E) = a1 + a2[ln(EN/E)] + a3[ln(K/E)] + a4(Df) + a5(Dboi) + a6(Dold) + a7(Dlg)
(2) ln(V/E) = b1 + b2[ln(EN/E)] + b3[ln(K/E)] + b4(Dftr) + b5(Dfn3) + b6(Dfot) + b7(Dboi) + b8(Dold)
+ b9(Dlg)
(3) ln(V/E) = c1 + c2[ln(EN/E)] + c3[ln(K/E)] + c4(Dfeu) + c5(Dfus) + c6(Dfjp) + c7(Dfn3) + c8 (Dfot)
+ c9(Dboi) + c10(Dold) + c11(Dlg)
(4) ln(V/E) = d1 + d2[ln(EN/E)] + d3[ln(K/E)] + d4(Dfmn) + d5(Dfmj) + d6(Dfwh) + d7(Dboi)
+ d8(Dold) + d9(Dlg)
(5) ln(W/E) = e1 + e2[ln(EN/E)] + e3[ln(K/E)] + e4(Df) + e5(Dboi) + e6(Dold) + e7(Dlg)
(6) ln(W/E) = f1 + f2[ln(EN/E)] + f3[ln(K/E)] + f4(Dftr) + f5(Dfn3) + f6(Dfot) + f7(Dboi) + f8(Dold)
+ f9(Dlg)
13 The BOI dummy is not available in the 1998 dataset and omitted from the 1998 regressions.

8
(7) ln(W/E) = g1 + g2[ln(EN/E)] + g3[ln(K/E)] + g4(Dfeu) + g5(Dfus) + g6(Dfjp) + g7(Dfn3) + g8 (Dfot)
+ g9(Dboi) + g10(Dold) + g11(Dlg)
(8) ln(W/E) = h1 + h2[ln(EN/E)] + h3[ln(K/E)] + h4(Dfmn) + h5(Dfmj) + h6(Dfwh) + h7(Dboi)
+ h8(Dold) + h9(Dlg)
where
Dboi=1 if a plant is BOI-promoted, =0 otherwise,
Df=1 if the foreign ownership share of a plant is 1% or greater, =0 otherwise,
Dfeu=1 if the major foreign owner of plant is European, =0 otherwise,
Dfjp=1 if the major foreign owner of plant is Japanese, =0 otherwise,
Dfmj=1 if the foreign ownership share of a plant is 50%-99%, =0 otherwise,
Dfmn=1 if the foreign ownership share of a plant is 1%-49%, =0 otherwise,
Dfn3=1 if the major foreign owner of plant is from 3 Asian Newly Industrializing Economies (NIEs:
Korea, Singapore, or Taiwan), =0 otherwise,
Dftr=1 if the major foreign owner if from the triad (Europe, the United States, or Japan), =0 otherwise,
Dfot=Df-Dftr-Dfn3,
Dfus=1 if the major foreign owner of a plant is from the United States, =0 otherwise,
Dfwh=1 if the foreign ownership share of a plant i is 100%, =0 otherwise,
Dlg=1 if a plant’s output is larger than mean output for the industry plus one standard deviation, =0
otherwise,
Dold=1 if a plant has been in operation for 11 or more years, =0 otherwise,
E=hours worked by workers in plant i,
K=average book value of fixed assets in a plant multiplied by the percentage of hours used each year
W=employee compensation payments in a plant
9
V=value added in a plant
3. The Data and Shares of Foreign Multinationals
The data used in this study are the factory-level data that underlie the 1997 industrial census of
1996 data (National Statistical Office 1999), the 1999 industrial survey of 1998 data (National Statistical
Office 2001a) and the 2001 manufacturing industry survey of 2000 data (National Statistical Office
forthcoming).14 A major problem with using these data sets for economic analysis in their original form,
especially the census data for 1996, is that they contain several duplicate or near-duplicate records. It was
thus necessary to eliminate these duplicates and the methodology for eliminating duplicates is detailed in the
statistical appendix. It should be noted that the methodology used was biased toward leaving a record in
the database if there was some doubt as to whether it was a duplicate. A second problem is that several
plants report apparently implausible values for important variables. Correspondingly, plants that had less
than 1,000 baht (about US$39 in 1996 and US$24-25 in 1998 and 2000) in purchases of intermediate
materials, sales of goods produced, and beginning- or end-of-year fixed asset (=capital) stocks, and plants
with non-positive value added were also eliminated from the samples used in this study because such small
values do not make economic sense in this context. Third, because comparing very small plants with
foreign MNCs, which are generally much larger, is not very meaningful, a large number of predominately
local plants with less than 20 persons engaged (employees, unpaid workers, and owners) were eliminated
from the samples.
After eliminating duplicates, non-meaningful entries, and plants with less than 20 employees,
samples were greatly reduced, with a disproportionately large number of local plants being eliminated.
Samples were reduced from 23,677 plants (2,672 foreign MNCs) to 10,494 (1,822) in 1996, from 8,552
(1,124) to 4,773 (1,026) in 1998, and from 9,286 (644) to 2,520 (520) in 2000. The coverage of the
14 The 2000 manufacturing industry survey also provides data for 1999 (National Statistical Office 2001b) but this survey is not used here because its sample size is even smaller than the relatively small sample size of the 2001 survey (see Ramstetter 2003 for estimates from all surveys).

10
surveys in 1998 and 2000 is markedly worse than the coverage of the census in 1996 and it is thus very
difficult to use these data to analyze changes over time because of these large changes in sample coverage.
Samples of large plants with output of 25 million baht or more (about US$0.99 million in 1996,
US$0.60-0.62 million in 1998 and 2000) are also used in the analysis below and these samples were even
smaller, 5,481 plants (1,509 foreign MNCs) in 1996, 2,729 (885) in 1998, and 1,487 (476). However, even
though these samples of large plants included only 16-32 percent of the plants in the original datasets, they
accounted for the vast majority of employment and value added of plants in the original datasets, for
example, 65 percent and 84 percent, respectively, in 1996, 82 percent and 94 percent, respectively, in 1998,
and 79 percent and 110 percent in 2000, the large ratio in 2000 resulting from the fact that a number of plants
reported negative value added in the original dataset. Published industrial census/survey-based estimates
are also much smaller than corresponding estimates of manufacturing employment in labor force surveys
(52 percent of the labor force survey total in 1996, 44 percent in 1998, and 50 percent in 2000) and
manufacturing value added in the national accounts (72 percent of the national accounts’ total in 1996, 45
percent in 1998, and 49 percent in 2000).15 In short, the industrial censuses and surveys cover do not
appear to cover the manufacturing sector comprehensively and a large number of predominately local plants
with very few employees and small or negative value added were eliminated from the samples used in this
study.
Foreign MNCs accounted for 42 percent of the employment in all sample plants in 1996 and 45
percent in both 1998 and 2000 (Table 1). Corresponding shares of value added were a bit larger, 52 percent
in 1996, 59 percent in 1998, and 47 percent in 2000 (Table 2). These are in-sample shares and foreign
shares of total manufacturing activities are probably much lower. For example, in 1996 (the census year),
15 Publications for survey years (National Statistical Office 2001a, forthcoming) report extrapolated totals that are much larger than the sample totals reported in this study. There are also large variations in census/survey coverage of value added across industries, though it is difficult to be very precise in this respect because of differences in industry definitions between the industrial censuses or surveys and the national accounts. For example, using national accounts estimates as a basis for comparison, census and survey coverage appears to be relatively comprehensive in chemicals, rubber, plastics, and motor vehicles but rather poor in textiles, apparel, leather and footwear, non-metallic mineral products, furniture, and jewelry (see Appendix Tables 2a-2c).

11
this sample of foreign plants employed 749,129 workers and produced 442 billion baht of value added,
which amounts to only 16 percent of total manufacturing employment as estimated in the labor force survey
and 32 percent of manufacturing value added as estimated in the national accounts (See Appendix Tables 1a,
2a). Actual shares of foreign MNCs in Thai manufacturing employment and value added were probably
very close to these smaller estimates because omitted plants were predominantly local and census coverage
of foreign MNCs seems to have been relatively comprehensive.16 There is also wide variation in foreign
shares across industries, with high foreign shares in the machinery industries, especially electric machinery,
motor vehicles, and general machinery.
Japanese MNCs were by far the largest by nationality group (Tables 1, 2). In all manufacturing,
they accounted for 18 percent of sample plant employment in 1996, 22 percent in 1998, and 20 percent in
2000. Corresponding shares of value added were 30 percent, 32 percent, and 22 percent, respectively.
Japanese shares were largest in motor vehicles, general machinery, and electric machinery, followed by
metal products, chemicals, and textiles. Japanese shares were smaller in other industries but shares of value
added still exceeded double digits in a number of them, for example, food, apparel, rubber, and plastics.
Shares of other foreign nationality groups were much smaller. In all manufacturing, MNCs from the 3
Asian NIEs (Korea, Singapore, and Taiwan) were the second largest group in 1996 and 1998 followed by
U.S. MNCs. European MNCs, had smaller shares in these two years, 2-3 percent of employment and 4
percent of value added. In 2000, European shares were much larger, 9 and 13 percent, respectively, and
larger than shares of MNCs from the 3 Asian NIEs or the United States. The major reason for the increase
in the European share in 2000 appears to be poorer coverage of other MNCs and local plants combined with
relatively good coverage of European MNCs.17 By industry European MNCs were relatively large in
jewelry, rubber, and chemicals in 1996, and also became relatively large in 1998 in apparel, non-metallic
16 Comparisons of home country data for Japanese and U.S. MNCs with census data suggest that census coverage of Japanese and U.S. MNCs is relatively comprehensive (Ramstetter 2003). 17 For example, employment in 1996 (the census year) employment was 40,108 in European plants and 749,129 in all foreign plants. In 2000, these figures were 57,984 and 286,001, respectively. In contrast, home country data for Japan and the United States suggest that these two groups of MNCs alone employed at least 342,126 workers in 1996 and 414,886 workers in 2000 (Ramstetter 2003).

12
mineral products, and electric machinery. In 2000, European shares were also large in metal products and
motor vehicles, in addition to many of the aforementioned industries. Thus, although Japanese MNCs are
by far the largest in Thai manufacturing, followed by MNCs from the United States and the 3 Asian NIEs,
European MNCs also have a significant presence.
In 1996, minority-foreign plants were the largest group by ownership share, both overall and in
most individual industries (Tables 1-2). This partially reflects relatively strict restrictions on foreign
ownership shares that existed until the financial crisis in 1997 led Thai authorities to relax those restrictions.
In all manufacturing, minority-foreign plants accounted for 24 percent of employment and 32 percent of
value added, while corresponding shares were 8 percent and 9 percent, respectively, for majority-foreign
plants, and 10 percent and 11 percent, respectively for wholly-foreign plants. Measured in terms of value
added, majority-foreign plants were the largest MNC group in chemicals and rubber, while wholly-foreign
plants were largest in general machinery and electric machinery, but minority-foreign plants dominated all
other industries.
4. Labor Productivity and Wages in Local Plants and Foreign MNCs by Nationality and Ownership Group
The fact that foreign MNCs’ shares of employment tend to be smaller than corresponding shares
of value added, reflects the fact that average labor productivity (measured as value added per hour worked)
tends to be relatively high foreign MNCs (see Appendix Tables 9a-9c and 10a-10c). For example, in all
manufacturing plants, mean value added per hour was 165 baht in 1996, 204 baht in 1998, and 110 baht in
2000 in foreign plants, compared to only 106 baht, 103 baht, and 74 baht, respectively, in local plants.
Compensation per hour was also higher, 37 baht per hour, 49 baht per hour, and 35 baht per hour,
respectively, in foreign plants compared to 27 baht per hour, 44 baht per hour, and 24 baht per hour,
respectively, in local plants. However, this pattern is not always observed if similar comparisons are made
at the industry level. For example, value added per hour was lower in foreign plants than in local plants in
5 of 14 industries listed in Tables 1-2 in 1996 (food, leather & footwear, nonmetallic mineral products,
13
furniture, jewelry), 2 industries in 1998 (leather & footwear, furniture), and 1 industry in 2000 (plastics).
However, compensation per hour was lower in only 1 industry each in 1996 (rubber) and 1998 (nonmetallic
mineral products), and no industries in 2000. Similar patterns are also observed when foreign plants are
distinguished by nationality or foreign ownership share. For example, value added per hour was lower in
European MNCs than in local plants in 6 industries in 1996 (food, leather & footwear, plastics, motor
vehicles, furniture, jewelry), 3 industries in 1998 (leather & footwear, plastics, furniture), and no industries in
2000 (there were no European MNCs in 3 of the 14 industries in 2000). Compensation per hour was lower
for European MNCs in 2 industries in 1996 (leather & footwear and rubber), 3 industries in 1998 (leather &
footwear, plastics, nonmetallic mineral products), and no industries in 2000. This pattern, where positive
differentials in favor of foreign MNCs are more common for wages than for labor productivity, is observed
in most other ownership groups as well. In addition, both value added per hour and compensation per hour
were lower in wholly foreign plants than in local plants for more industries and than in majority-foreign or
minority-foreign plants.18
As described in Section 2, labor productivity and wages may vary across ownership groups
because of variation in other factors related to labor productivity and wages such as factor intensities, policy
status (e.g., BOI promotion), vintage, and size. Thus, before it can be concluded that differences among
ownership groups such as those described above are indeed related to differences in ownership, it is first
necessary to remove the influences of these related factors. The purpose of estimating equations (1)-(8) is
thus to describe variation in labor productivity wages among foreign ownership and nationality groups and
local plants, after removing the effects of these factors. The effect of foreign ownership is revealed by the
size and sign of the coefficient on foreign ownership dummies. Because the dummy for plant size cannot
18 For wholly foreign plants value added per hour was lower in 6 industries (leather & footwear, rubber, plastics, nonmetallic mineral products, furniture, jewelry) while compensation per hour was lower in 4 industries (rubber, nonmetallic mineral products, electric machinery, furniture). For majority-foreign plants value added per hour was lower in 4 industries (apparel, nonmetallic mineral products, electric machinery, jewelry) while compensation per hour was lower in 2 industries (rubber, electric machinery). For minority-foreign plants value added per hour was lower in 5 industries (food, leather & footwear, nonmetallic mineral products, jewelry, furniture) but compensation per hour was lower in only 1 industry (leather & footwear).

14
account for size-related differences in slope coefficients and because comparisons of foreign MNCs and
local plants are thought to be more meaningful in more homogenous samples of all plants, estimates are
made for two samples, samples of all plants and samples of large plants with output equal to or larger than
25 million baht. When tests for heteroscedasticity indicate the presence of this problem, White’s robust
standard errors are used for calculating t-tests instead of OLS residuals (Hall and Cummins 1999; White
1980). Also, because behavior differs markedly across industries, as indicated by large differences in slope
coefficients estimated with relatively small errors for different industries, it is not practical to pool all
industries into one sample. Thus, labor productivity and wage equations are each estimated for two
samples (all plants and large plants) in each of the 14 industries listed in Tables 1-2 for three years, 1996,
1998, and 2000. The detailed results of these estimates are very lengthy and presented in Appendix Tables
3-8. Tables 3-8 summarize the most important results in this context, that is the signs and size of the
statistically significant coefficients on the foreign ownership dummies in equations (1)-(8), along with a
measure of goodness of fit, the adjusted R-squared.
As indicated above, the 1996 samples are by far the most comprehensive and results for this year
are probably more reliable than results for subsequent years. The results of estimating equations (1) to (4)
for 1996 are also very similar to the results of previous studies (Ramstetter 2001a, 2001b, 2002b), which use
more flexible forms of the production function and /or slightly different sets of control variables, in that
coefficients on foreign ownership dummies were significantly different than zero in relatively few cases
(Table 3). For example, the foreign dummy coefficient was consistently positive and significant in
equation (1) in both the sample of all plants and the sample of large plants in only 2 of the 14 industries,
chemicals and metal products, and positive and significant in the sample of all plants only in only 1 other
industry, jewelry. In the sample of large plants, this coefficient was significantly negative in 2 industries,
food and electric machinery. Disaggregating by nationality in equations (2) and (3) suggests that the
positive differentials in favor of MNCs were mainly related to activities of European and U.S. MNCs in
chemicals, Japanese and other MNCs in metal products, and triad MNCs in jewelry. Likewise the negative
differentials were mainly related to activities of Japanese MNCs in food and U.S. MNCs in electric

15
machinery. However, disaggregating by nationality did not improve the fit of the equations in any of these
cases, suggesting that disaggregating by nationality may not be meaningful.19 In a few other industries,
disaggregating by industry improves the fit and suggests significant differentials that are not observed in the
aggregate equation (1). These include positive differentials related to European and U.S. MNCs in textiles
and European and Japanese MNCs in general machinery, and a negative differential related to U.S. MNCs in
apparel. Disaggregating by foreign ownership share in equation (4) improves explanatory power and
suggests positive differentials in textiles related to majority- and wholly foreign plants and a negative in
differential furniture related to minority-foreign plants, all of which were not observed in the aggregate
equation. Other positive differentials also seem closest related to minority- and wholly foreign plants in
chemicals and wholly foreign plants only metal products, while other negative differentials were related to
minority-foreign plants in food and electric machinery and to majority- and wholly foreign plants in electric
machinery.
The results of estimating equations (5) to (8) are also consistent with results from past studies
using somewhat different specifications (Matsuoka 2001a, 2001b, 2001c) in suggesting that positive wage
differentials were more common than positive labor productivity differentials. Results of the estimating the
aggregate equation (5) suggests positive differentials in both samples in 3 industries, apparel, plastics, and
non-metallic mineral products, and in samples of all plants in 4 additional industries, food, chemicals, metal
products, and jewelry (Table 4). In addition, disaggregating by nationality and foreign ownership revealed
positive differentials not observed in equation (5) in 6 more industries, textiles (European MNCs and
majority-foreign MNCs), leather & footwear (Japanese MNCs), general machinery, (other MNCs), electric
machinery (European MNCs), motor vehicles (Japanese MNCs), and furniture (European MNCs). In short,
positive differentials are observed in at least one of the wage equations in all but 1 industry, rubber, where
there were negative differentials related to European MNCs and majority- and wholly foreign MNCs.
19 The hypothesis that disaggregating by nationality or ownership group can be tested with an F-test of coefficient equality and a higher adjusted R-squared in disaggregated equation is a necessary, but not sufficient condition for this F-test to reject the hypothesis of coefficient equality. However, these tests are not valid when there is heteroscedasiticty in one of the equations and this is often the case in estimates of equations (1)-(8).

16
Moreover, disaggregating by nationality revealed several differentials not observed in the aggregate equation
and European MNCs were often seen to pay higher wages than local plants in such cases.
Results for these 1998 differ in that labor productivity is significantly higher in foreign MNCs in a
larger number of industries.20 Estimates of the aggregate equation (1) reveal significantly higher
productivity in both samples of all plants and large plants in 4 industries, food, apparel, chemicals, and
nonmetallic mineral products, and in another 5 industries in samples of all plants, plastics, general machinery,
electric machinery, motor vehicles, and jewelry (Table 5). Disaggregating by nationality also reveals
positive differentials related to plants from the 3 Asian NIEs in rubber. This leaves only 2 industries in
which labor productivity appears completely unrelated to ownership, textiles and leather & footwear, and 1
industry in which foreign MNCs had significantly lower labor productivity, furniture. By nationality,
relatively few of the observed differences are related to European MNCs, for which productivity was
significantly higher than local plants in only 3 industries, food, chemicals, and non-metallic mineral products.
On the other hand, a much larger number of these productivity differentials are related to Japanese MNCs,
though here again, disaggregating by nationality does not improve the explanatory power of the models in
most samples. There are also some mixed results in metal products, general machinery, and electric
machinery, with signs of foreign ownership dummies changing from sample to sample or differing across
nationality groups. In short, these results differ markedly from results for 1996 and from previous results
for 1998 using more flexible functional forms and slightly different specifications (e.g., Ramstetter 2001a,
2001b, 2002b), which found far fewer positive productivity differentials.21
20 One might be tempted to attribute this difference to the effects of the financial crisis, which probably affected local plants more severely than foreign plants and could have created to more productivity differentials. Differences in sample coverage between 1998 and other years mandate caution when making such interpretations, however. 21 There are several possible causes of these differences. Previous studies sometimes used more flexible forms of the production function creating a greater probability of multicollinearity and used a slightly different set of control variables, including two types of labor (production and non-production workers) and trade propensities. The inclusion of trade propensities as a control variable may be an important difference because yet other studies (e.g., Ramstetter 2002a) show that trade propensities are highly correlated with foreign ownership shares. The inclusion of trade propensities as a control variable may therefore capture some of the effects of foreign ownership, which simultaneously affects trade propensities and productivity, and these controls are omitted from in this study for this reason. On the other hand, if trade propensities should be used as a control, then their omission may bias foreign ownership dummies upwards.
17
In contrast, results of estimating wage equations for 1998 are very similar to the results for 1996 in
suggesting a relatively large number of positive wage differentials. Results of estimating the aggregate
equation (5) indicated foreign MNCs paid significantly higher wages in both samples of all and large plants
in 5 industries, food, apparel, chemicals, nonmetallic mineral products, and general machinery, in samples of
all plants in another 4 industries, plastics, metal products, motor vehicles, and furniture, and in the sample of
large plants in 1 more industry, leather & footwear (Table 6). In addition, disaggregating by industry
reveals significantly positive differentials in textiles related to European plants. European plants also paid
relatively high wages in food and nonmetallic minerals, as well as relatively low wages in furniture. A
larger number of positive wage differentials were related to Japanese and U.S. MNCs, but here again the
disaggregate equations did not always improve the fit of the equations, suggesting that differences among
nationality groups were not always important.
Results of estimating 2000 productivity and wage equations are broadly similar to results for 1996
in that the reveal relatively few significant differences in labor productivity and a relatively large number of
significant differences in wages. For example, results of estimating equations (1) reveal significantly
positive differences in only 2 of the 14 industries in samples of all plants (leather & footwear, furniture) and
in no industries in the sample of large plants (Table 7). Disaggregating by nationality reveals significant
and positive differentials in food (NIE MNCs), rubber products (European MNCs), non-metallic mineral
products (NIE MNCs), and general machinery (Japanese MNCs), but here again the fit of the disaggregate
equations was no better than the aggregate equations in a few cases and there were negative differentials in a
few other cases (large European MNCs in food and Japanese MNCs in both samples for electric machinery).
In contrast, wages were positively related to at least one foreign ownership dummy most industries, apparel,
rubber, metal products, and motor vehicles being the exceptions. Moreover, there were no negative and
significant relationships observed between wages and foreign ownership dummies in this year. There were
also no significant wage differentials involving Europoean MNCs for this year. Another interesting result
from this year is that wage differentials were more often related to heterogeneous category of other MNCs
than to specific nationality groups.

18
5. Conclusion
This paper has compared labor productivity and wages among nationality and ownership groups
of foreign multinational corporations (MNCs) and local plants in Thai manufacturing for 1996, 1998, and
2000, paying particular attention to the role of European MNCs. Although European MNCs were
relatively small in Thai manufacturing during this period, following Japanese MNCs, which constituted the
largest nationality group, as well as MNCs from the 3 Asian NIEs and the United States, European MNCs
had substantial presence in a number of industries such as electrical machinery, chemicals, and food.
Disaggregating foreign MNCs by nationality or foreign ownership share revealed significant differences in
both labor productivity and wages that were not present in more aggregate specifications. In these cases,
there was a weak tendency for MNCs from Europe, Japan, and the United States to have relatively high
labor productivity and wages, for wholly foreign MNCs to have relatively high labor productivity, and for
majority- and wholly foreign MNCs to pay relatively high wages. However, these results suggest that the
relationships among labor productivity or wages, on the one hand, and nationality or foreign ownership
shares, on the other hand, were generally weak in Thai manufacturing.
This study yields two other important results that are broadly consistent with results from previous
studies. First, foreign MNCs do not appear to have had significantly higher labor productivity than local
plants in Thai manufacturing in most industries in 1996 and 2000. Results for 1998 differ, however,
revealing significant differences in a number of industries. For all years, significant differences in labor
productivity were even less common in samples of large plants, in which comparisons of foreign MNCs and
local plants are thought to be most meaningful. Second, foreign MNCs pay significantly higher wages in a
relatively large number of industries in all years. Here again significant differences are less common in
samples of large plants, but differences in wages were always significant in more industries than
corresponding differences in labor productivity. In short, the relationship between labor productivity and
foreign ownership was rather weak during this period in Thai manufacturing, though the relationship
between wages and foreign ownership was somewhat stronger.

19
Several problems demand caution when interpreting these results. First, the differences in
sample coverage over time mean that changes in results from year to year may result not from changes in
economic behavior but rather from changes in sampling. In this respect, the results from the 1998 and
2000 samples are should be interpreted with particular caution because these samples are much less
comprehensive than the 1996 sample. Second, another problem stems from the fact that 1998 was a very
bad year for the Thai economy, during which economic growth plunged in the midst of the Asian economic
crisis. Thus, results for 1998 may reflect the special economic circumstances in that year. Third, it is also
possible that these results obtain because unduly restrictive assumptions about technology have been
imposed, though it is important to note that comparisons of labor productivity in all foreign MNCs and local
plants under far less restrictive assumptions yield broadly similar results, and that use of flexible functional
forms is probably impossible when disaggregating by nationality or foreign ownership share. Fourth, it is
likely that (1) foreign MNCs choose to invest in industries with relatively high productivity and wages and
(2) that labor productivity and wages are determined simultaneously. To deal with these problems it would
be highly desirable to formulate and estimate a system of equations accounting for this simultaneity, though
accounting for aspect (1) would probably be impossible when disaggregating by nationality and/or foreign
ownership share. Fifth, one reason for the lack of differences in labor productivity in Thailand may be the
existence of substantial spillovers or a strong correlation between productivity in local plants and the
presence of foreign MNCs in an industry. It would thus be desirable to examine the issue of spillovers
more closely in the Thai case, though such efforts would be complicated by data limitations, namely the
inability to create panels which make it easier to deal with the simultaneity issue (1) mentioned above.

20
References Blomström, Magnus, 1990. Foreign Investment and Spillovers. London: Routledge. Buckley, Peter J., 1985. "The Economic Analysis of the Multinational Enterprise: Reading versus Japan?", Hitotsubashi Journal of Economics, Vol. 26, No. 2 (December), pp. 117-124. Buckley, Peter J. and Mark Casson, 1992. The Future of the Multinational Enterprise, 2nd Edition. London: Macmillan. Casson, Mark, 1987. The Firm and the Market: Studies on the Multinational and the Scope of the Firm. Cambridge, MA: MIT Press. Caves, Richard E., 1996. Multinational Enterprise and Economic Analysis, second edition. Cambridge, UK: Cambridge University Press. Chao, C.-C. and Eden Yu, 1996. "Are wholly foreign-owned enterprises better than joint ventures?" Journal of International Economics, vol. 40, no. 1/2, pp. 225-237. Dunning, John H., 1988. Explaining International Production. London: Unwin Hyman. Dunning, John H., 1993. Multinational Enterprises and the Global Economy. Workingham, U.K.: Addison-Wesley Publishing Co. Hall, Bronwyn H. and Clint Cummins, 1999. Time Series Processor, User’s Guide Version 4.5. Palo Alto: TSP International. Hill, Hal and Brian Johns, 1985. "The Role of Foreign Investment in Developing East Asian Countries," Weltwirtschaftliches Archiv, Band 121, Heft 2, pp. 355-381. Hill, Hal, 1988. Foreign Investment and Industrialization in Indonesia. Singapore: Oxford University Press. Hill, Hal, 1990. "Indonesia’s Industrial Transformation Part II", Bulletin of Indonesian Economic Studies, Vol. 26, pp. 75-109. Hymer, Stephen H., 1960. "The International Operations of National Firms: A Study of Direct Foreign Investment," Ph.D. dissertation, MIT (published by MIT Press, 1976).
21
Kojima, Kiyoshi, 1978. Direct Foreign Investment: A Japanese Model of Multinational Business Operations. London: Croom Helm; New York: Praeger; Tokyo: Tuttle. Lipsey, Robert E. and Sjöholm, Fredrik, 2001. "Foreign Direct Investment and Wages in Indonesian Manufacturing", Working Paper 2001-02, Kitakyushu: International Centre for the Study of East Asian Development. Lipsey, Robert E. and Sjöholm, Fredrik, 2002. "Foreign Direct Investment and Indonesian Manufacturing Wages: An Analysis with Panel Data", Working Paper 2002-29, Kitakyushu: International Centre for the Study of East Asian Development. Manning, Chris, 1993. “Industrial Relations and Structural Change During the Suharto Period: an Approaching Crisis?”, Bulletin of Indonesian Economic Studies, Vol. 29, pp. 51-95. Khanthachai, Nathabhol, Kanchana Tanmavad, Tawatchai Boonsiri, Chantana Nisaisook, and Anucha Arttanuchit, 1987. Technology and Skills in Thailand. Singapore: Institute of Southeast Asian Studies. Koike, Kazuo and Takenori Inoki, eds., 1990. Skill Formation in Japan and Southeast Asia. Tokyo: University of Tokyo Press. Kojima, Kiyoshi, 1978. Direct Foreign Investment: A Japanese Model of Multinational Business Operations. London: Croom Helm; New York: Praeger; Tokyo: Tuttle. Markusen, James R., 1991. "The Theory of the Multinational Enterprise: A Common Analytical Framework," in Eric D. Ramstetter, ed., Direct Foreign Investment in Asia's Developing Economies and Structural Change in the Asia-Pacific Region, Boulder, Co: Westview Press, pp. 11-32. Matsuoka, Atsuko, 2001a. "Wages, Foreign Multinationals, and Local Plants in Thai Manufacturing", Working Paper 2001-15, Kitakyushu: International Centre for the Study of East Asian Development. __________, 2001b. "Wage Differentials among Local Plants and Foreign Multinationals by Foreign Ownership Share and Nationality in Thai Manufacturing", Working Paper 2001-25, Kitakyushu: International Centre for the Study of East Asian Development. __________, 2001c. "Wage Differentials between Local Plants and Foreign Multinationals in Thai Manufacturing: Industry-level Analysis", Working Paper 2001-26, Kitakyushu: International Centre for the Study of East Asian Development.

22
Moran, Theodore, 2001. Parental Supervision: The New Paradigm for Foreign Direct Investment and Development. Washington, D.C.: Institute for International Economics. National Economic and Social Development Board, 2001. Data on value added and gross output by 5-digit Thai Standard Industrial Classification for 1988-1999, data received by email. Bangkok: National Economic and Social Development Board. National Economic and Social Development Board, 2003. National Income of Thailand, 2001 edition. Bangkok: National Economic and Social Development Board. National Statistical Office, 1999. Report of the 1997 Industrial Census of the Whole Kingdom. Bangkok: National Statistical Office. __________, 2001a. Report of the 1999 Industrial Survey, Whole Kingdom, Bangkok: National Statistical Office. __________, 2001b. Report of the 2000 Manufacturing Industry Survey, Whole Kingdom, Bangkok: National Statistical Office. __________, 2003. Report of the Labor Force Survey: Whole Kingdom, various issues; data downloaded from the NSO website (http://www.nso.go.th/eng/stat/lfs/lfstab9.htm) in March 2003. Bangkok: National Statistical Office. __________, forthcoming. Report of the 2001 Manufacturing Industry Survey, Whole Kingdom, Bangkok: National Statistical Office, tables downloaded from www.nso.go.th/eng/stat/manufact/manufact.htm. Naya, Seiji and Eric D. Ramstetter, 1992. "United States Direct Foreign Investment in Asia's Developing Economies," in United Nations, Economic and Social Commission for Asia and the Pacific (ESCAP), ed., Foreign Investment and Industrial Comparative Advantage in East Asia and the Pacific, Bangkok: ESCAP (document no. E/ESCAP/1015), pp. 51-111. Okamoto, Yumiko and Fredrik Sjöholm, 2000. "Productivity in the Indonesian Automotive Industry," ASEAN Economic Bulletin, Vol. 17, No. 1, pp. 60-73. Ramstetter, Eric D., 1993. "Production Technology in Foreign and Local Firms in Thai Manufacturing", Discussion Paper No. 8. Nagoya: Graduate School of International Development, Nagoya University. __________, 1994. "Comparisons of Japanese Multinationals and Other Firms in Thailand's Nonoil Manufacturing Industries," ASEAN Economic Bulletin, Vol. 11, No. 1, pp. 36-58.

23
__________, 1998. "Export Propensities and Foreign Ownership Shares in Southeast Asian Manufacturing", in F. Gerard Adams and Shinichi Ichimura, eds., East Asian Development: Will the East Asian Miracle Survive? Westport, CN: Praeger, pp. 171-192. __________, 1999a. "Comparisons of Foreign Multinationals and Local Firms in Asian Manufacturing Over Time ", Asian Economic Journal, Vol. 13, No. 3 (June), pp. 163-203. __________, 1999b. "Trade Propensities and Foreign Ownership Shares in Indonesian Manufacturing in the Early 1990s", Bulletin of Indonesian Economic Studies, Vol. 35, No. 2 (August), pp. 43-66. __________, 2001a. "Labor Productivity in Foreign Multinationals and Local Plants in Thai Manufacturing, 1996 and 1998", Working Paper 2001-13, Kitakyushu: International Centre for the Study of East Asian Development. __________, 2001b. "Labor Productivity in Local Plants and Foreign Multinationals by Nationality in Thai Manufacturing, 1996 and 1998", Working Paper 2001-31, Kitakyushu: International Centre for the Study of East Asian Development. __________, 2002a. "Trade Propensities and Foreign Ownership Shares in Thai Manufacturing, 1996", Working Paper 2002-03, Kitakyushu: International Centre for the Study of East Asian Development. __________, 2002b. "Does Technology Differ in Local Plants and Foreign Multinationals in Thai Manufacturing? Evidence from Translog Production Functions for 1996 and 1998", Working Paper 2002-04, Kitakyushu: International Centre for the Study of East Asian Development. __________, 2003. "Foreign Multinationals in Thailand After the Crisis: The Challenge of Measuring and Interpreting Recent Trends ", in Mitsuru Toida and Jinichi Uemura, eds., Ajia Kogyoken no Keizai Tenbo 2003 [Projections for Asian Industrializing Region 2003], Tokyo: Institute of Developing Economies, pp. 83-170. Rugman, Alan M., 1980. "Internalization as a General Theory of Foreign Direct Investment: A Re-Appraisal of the Literature," Weltwirtschaftliches Archiv, Band 116, Heft 2, pp. 365-379. __________, 1985. "Internalization is Still a General Theory of Foreign Direct Investment," Weltwirtschaftliches Archiv, Band 121, Heft 3, pp. 570-575.

24
Sjöholm, Fredrik, 1998. "Joint Ventures, Technology Transfer and Spillovers: Evidence from Indonesian Estblishment Data", in Economic Planning Agency, ed., Foreign Direct Investment in Asia, papers and proceedings of an international symposium, 22-23 October, Tokyo: Economic Planning Agency, pp. 587-616. Takii, Sadayuki, 2002. "Productivity Differentials between Local and Foreign Plants in Indonesian Manufacturing, 1995", Working Paper 2002-02, Kitakyushu: International Centre for the Study of East Asian Development. Takii, Sadayuki and Eric D. Ramstetter, 2000. "Foreign Multinationals in Indonesian Manufacturing 1985-1998: Shares, Relative Size, and Relative Labor Productivity", Working Paper 2000-18, Kitakyushu: International Centre for the Study of East Asian Development. Tambunlertchai, Somsak and Eric D. Ramstetter, 1991. "Foreign Firms in Promoted Industries and Structural Change in Thailand," in Eric D. Ramstetter, ed., Direct Foreign Investment in Asia's Developing Economies and Structural Change in the Asia-Pacific Region, Boulder, CO: Westview Press, pp. 65-102. White, Halbert, 1980. "A Heterosckedasticity-Consistent Covariance Matrix Estimator and A Direct Test for Heteroskedasticity", Econometrica, Vol. 48, No. 4 (May), pp. 817-838. Yamashita, Shoichi, ed., 1992. Transfer of Japanese Technology and Management to the ASEAN Coutnties. Tokyo: University of Tokyo Press.

Table 1: Shares of Foreign Plants in the Employment of Sample Plants by Foreign Ownership Share or Foreign Nationality and Industry (percent)1996 census 1998 survey 2000 survey
For- By share By nationality For- By nationality For- By nationalityIndustry eign MN MJ WH EU US JP N3 OT eign EU US JP N3 OT eign EU US JP N3 OT
Manufacturing 42 24 8 10 2 6 18 8 8 45 3 5 22 8 7 45 9 5 20 7 5 Food 30 24 4 2 3 3 13 4 7 29 2 3 10 7 7 33 9 1 15 4 5 Textiles 42 36 4 2 1 1 18 10 12 34 2 1 8 9 14 21 0 1 5 6 8 Apparel 31 28 2 1 1 2 8 4 17 44 7 0 10 3 24 30 0 5 8 1 15 Leather & footwear 29 19 7 3 1 6 6 13 4 17 0 5 1 5 6 11 0 0 2 6 2 Chemicals & products 37 22 7 8 3 9 12 5 8 40 6 4 17 6 7 49 22 2 17 4 4 Rubber products 43 21 13 9 3 3 9 11 16 42 4 12 12 6 8 42 10 17 7 5 3 Plastics & products 32 18 7 7 1 0 13 6 12 46 1 1 21 10 14 27 4 0 11 1 11 Nonmetallic mineral products 20 13 5 3 1 1 4 10 4 33 4 9 11 6 3 35 12 4 5 13 2 Metal products 38 26 4 7 1 1 13 9 14 31 0 1 19 8 3 40 9 0 17 11 3 General machinery 65 25 10 29 1 1 47 13 3 83 1 2 71 3 6 72 2 0 66 2 2 Electric machinery, etc. 84 20 17 47 5 22 37 14 6 88 7 13 45 19 5 83 20 5 49 8 2 Motor vehicles 57 38 16 2 0 1 54 1 2 65 0 0 62 2 1 63 3 1 54 4 1 Furniture 24 19 3 2 0 3 6 6 8 13 1 1 8 3 1 16 0 3 9 2 2 Jewelry 59 27 22 10 19 9 3 4 24 42 5 17 3 0 17 70 34 0 5 22 9 Other manufacturing industries 34 22 8 4 2 10 10 6 6 37 4 4 17 9 4 42 6 15 8 7 6
Notes: WH=wholly foreign, MJ=50-99% foreign-owned; MN=1-49% foreign owned; EU=Europe; US=United States; JP=Japan; N3=Singapore, Taiwan, or Korea; OT=other.Employment in sample plants was only 73% of total manufacturing employment as estimated in industrial census/survey publications in 1996, 46% in 1998, and 24% in 2000.Employment in sample plants was only 38% of total manufacturing employment as estimated in labor force survey publications in 1996, 20% in 1998, and 11% in 2000.Because these samples cover MNCs much more comprehensively than non-MNCs, these in-sample shares are often much higher actual shares.Changes over time observed probably result largely from changes in sample coverage, which declines greatly over the sample period. Sources: Author's calculations from plant-level data underlying National Statistical Office (1999, 2001a, forthcoming) and National Statistical Office (2003).
25
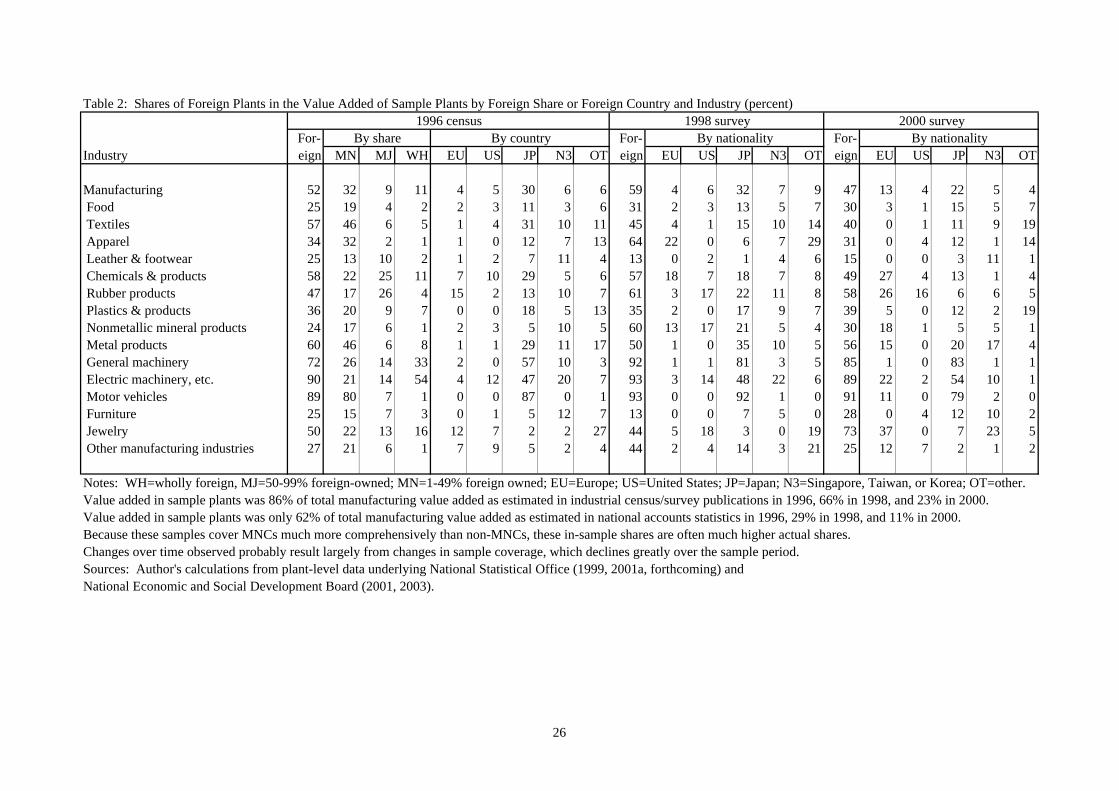
Table 2: Shares of Foreign Plants in the Value Added of Sample Plants by Foreign Share or Foreign Country and Industry (percent)1996 census 1998 survey 2000 survey
For- By share By country For- By nationality For- By nationalityIndustry eign MN MJ WH EU US JP N3 OT eign EU US JP N3 OT eign EU US JP N3 OT
Manufacturing 52 32 9 11 4 5 30 6 6 59 4 6 32 7 9 47 13 4 22 5 4 Food 25 19 4 2 2 3 11 3 6 31 2 3 13 5 7 30 3 1 15 5 7 Textiles 57 46 6 5 1 4 31 10 11 45 4 1 15 10 14 40 0 1 11 9 19 Apparel 34 32 2 1 1 0 12 7 13 64 22 0 6 7 29 31 0 4 12 1 14 Leather & footwear 25 13 10 2 1 2 7 11 4 13 0 2 1 4 6 15 0 0 3 11 1 Chemicals & products 58 22 25 11 7 10 29 5 6 57 18 7 18 7 8 49 27 4 13 1 4 Rubber products 47 17 26 4 15 2 13 10 7 61 3 17 22 11 8 58 26 16 6 6 5 Plastics & products 36 20 9 7 0 0 18 5 13 35 2 0 17 9 7 39 5 0 12 2 19 Nonmetallic mineral products 24 17 6 1 2 3 5 10 5 60 13 17 21 5 4 30 18 1 5 5 1 Metal products 60 46 6 8 1 1 29 11 17 50 1 0 35 10 5 56 15 0 20 17 4 General machinery 72 26 14 33 2 0 57 10 3 92 1 1 81 3 5 85 1 0 83 1 1 Electric machinery, etc. 90 21 14 54 4 12 47 20 7 93 3 14 48 22 6 89 22 2 54 10 1 Motor vehicles 89 80 7 1 0 0 87 0 1 93 0 0 92 1 0 91 11 0 79 2 0 Furniture 25 15 7 3 0 1 5 12 7 13 0 0 7 5 0 28 0 4 12 10 2 Jewelry 50 22 13 16 12 7 2 2 27 44 5 18 3 0 19 73 37 0 7 23 5 Other manufacturing industries 27 21 6 1 7 9 5 2 4 44 2 4 14 3 21 25 12 7 2 1 2
Notes: WH=wholly foreign, MJ=50-99% foreign-owned; MN=1-49% foreign owned; EU=Europe; US=United States; JP=Japan; N3=Singapore, Taiwan, or Korea; OT=other.Value added in sample plants was 86% of total manufacturing value added as estimated in industrial census/survey publications in 1996, 66% in 1998, and 23% in 2000.Value added in sample plants was only 62% of total manufacturing value added as estimated in national accounts statistics in 1996, 29% in 1998, and 11% in 2000.Because these samples cover MNCs much more comprehensively than non-MNCs, these in-sample shares are often much higher actual shares.Changes over time observed probably result largely from changes in sample coverage, which declines greatly over the sample period. Sources: Author's calculations from plant-level data underlying National Statistical Office (1999, 2001a, forthcoming) andNational Economic and Social Development Board (2001, 2003).
26

Table 3: Significant Coefficients on Foreign Ownership Dummies and Adjusted R-squared from Estimates of Labor Productivity Equations (1) to (4) for 14 Manufacturing Industries:1996 Census Samples (all=samples including all plants with viable observations; large=samples of large plants with gross output>=25 million baht)
Coeffi-cents, Food Textiles Apparel
Leather &footwear Chemicals
Rubberproducts
Plastics &products
Nonme-tallic
mineral pr. Metal
products General
machinery Electric
machinery Motor
vehicles Furniture JewelryAdj. R2 all large all large all large all large all large all large all large all large all large all large all large all large all large all large
Equation 1 Df ns -0.28 ns ns ns ns ns ns 0.44 0.39 ns ns ns ns ns ns 0.32 0.28 ns ns ns -0.32 ns ns ns ns 0.33 ns Adj. R2 0.15 0.13 0.13 0.02 0.07 0.02 0.00 0.01 0.15 0.12 0.06 0.09 0.06 0.07 0.15 0.08 0.11 0.10 0.13 0.11 0.13 0.15 0.27 0.31 0.32 0.11 0.31 0.25Equation 2 Dftr ns ns 0.44 0.51 ns ns ns ns 0.51 0.52 ns ns ns ns ns ns 0.41 ns ns ns ns -0.36 ns ns ns ns 0.39 ns Dfn3 ns ns ns ns ns ns ns ns ns ns ns ns ns ns ns ns ns ns 0.47 ns ns ns ns ns ns ns ns ns Dfot ns ns ns ns ns ns ns ns ns ns ns ns ns ns ns ns 1.06 0.87 ns ns ns ns ns ns ns ns ns ns Adj. R2 0.15 0.12 0.13 0.03 0.08 0.03 0.00 -0.01 0.15 0.12 0.06 0.09 0.06 0.07 0.15 0.08 0.12 0.10 0.14 0.11 0.13 0.15 0.27 0.32 0.32 0.10 0.31 0.26Equation 3 Dfeu ns ns 0.74 ns ns ns ns ns 0.72 0.68 ns ns ns ns ns ns ns ns 1.23 1.10 ns ns ns -0.87 ns ns ns ns Dfus ns ns 1.23 1.29 -1.08 ns ns ns ns ns ns ns ns ns -1.35 ns ns ns ns ns ns -0.80 ns ns ns ns ns ns Dfjp ns -0.34 ns ns ns ns ns ns 0.45 0.49 -0.85 ns ns ns ns ns 0.47 ns ns ns ns ns ns ns ns ns ns ns Dfn3 ns ns ns ns ns ns ns ns ns ns ns ns ns ns ns ns ns ns 0.44 ns ns ns ns ns ns ns ns ns Dfot ns ns ns ns ns ns ns ns ns ns ns ns ns ns ns ns 1.07 0.87 ns ns ns ns ns ns ns ns ns ns Adj. R2 0.15 0.13 0.14 0.03 0.08 0.02 -0.01 -0.02 0.15 0.12 0.07 0.08 0.06 0.07 0.15 0.08 0.12 0.11 0.15 0.13 0.13 0.15 0.27 0.32 0.32 0.10 0.31 0.25Equation 4 Dfmn ns -0.30 ns ns ns ns ns ns 0.34 ns ns ns ns ns ns ns ns ns ns ns ns ns ns ns ns -0.56 ns ns Dfmj ns ns 0.68 0.79 ns ns ns ns ns ns ns ns ns ns ns ns ns ns ns ns ns -0.40 ns ns ns ns ns ns Dfwh ns ns 0.88 ns ns ns ns ns 0.82 0.77 ns ns ns ns ns ns 0.63 ns ns ns ns -0.54 ns ns ns ns ns ns Adj. R2 0.15 0.13 0.14 0.04 0.07 0.02 0.00 -0.01 0.15 0.12 0.06 0.08 0.06 0.07 0.15 0.08 0.11 0.10 0.13 0.11 0.13 0.15 0.26 0.31 0.32 0.12 0.31 0.24
Notes: ns=coefficient not significant at the 5% level or better.Coefficients come from ordinary least squares estimates of each equation in firm-level cross sections for samples of all plants and large plants in each industry.Heteroscedasticity-consistent standard errors used if the White heteroscedasticity test is significant at 0.05 or less.See Appendix Table 3 for detailed estimatation results.
27

Table 4: Significant Coefficients on Foreign Ownership Dummies and Adjusted R-squared from Estimates of Wage Equations (5) to (8) for 14 Manufacturing Industries:1996 Census Samples (all=samples including all plants with viable observations; large=samples of large plants with gross output>=25 million baht)
Coeffi-cents, Food Textiles Apparel
Leather &footwear Chemicals
Rubberproducts
Plastics &products
Nonme-tallic
mineral pr. Metal
products General
machinery Electric
machinery Motor
vehicles Furniture JewelryAdj. R2 all large all large all large all large all large all large all large all large all large all large all large all large all large all large
Equation 5 Df 0.16 ns ns ns 0.14 0.12 ns ns 0.21 ns ns ns 0.18 0.19 0.44 0.42 0.14 ns ns ns ns ns ns ns ns ns 0.33 ns Adj. R2 0.12 0.06 0.15 0.10 0.12 0.06 0.07 0.03 0.17 0.15 0.11 0.11 0.08 0.08 0.15 0.06 0.10 0.07 0.11 0.08 0.10 0.11 0.09 0.11 0.44 0.18 0.28 0.15Equation 6 Dftr 0.18 ns ns ns ns ns 0.31 ns 0.31 0.30 ns ns 0.29 0.27 0.49 0.49 0.28 0.21 ns ns ns ns 0.30 ns 0.20 ns 0.40 ns Dfn3 ns ns ns ns ns ns ns ns ns ns ns ns ns ns 0.46 0.37 ns ns ns ns ns ns ns ns ns ns ns ns Dfot ns ns ns ns ns ns ns ns ns ns ns ns ns ns ns ns ns ns 0.58 ns ns ns ns ns ns ns ns ns Adj. R2 0.11 0.06 0.15 0.10 0.12 0.05 0.07 0.02 0.17 0.16 0.10 0.11 0.09 0.09 0.15 0.06 0.11 0.08 0.12 0.08 0.11 0.12 0.11 0.13 0.43 0.18 0.27 0.13Equation 7 Dfeu ns ns 0.66 0.80 ns ns ns ns ns ns -0.84 -0.89 ns ns 0.59 0.58 ns ns ns ns 0.64 0.57 ns ns 0.55 0.21 0.33 ns Dfus ns ns ns ns ns ns ns ns ns ns ns ns 0.34 ns ns ns ns ns ns ns ns ns ns ns ns ns ns ns Dfjp ns ns ns ns 0.21 ns 0.48 0.45 0.27 ns ns ns 0.30 0.26 0.51 0.55 0.29 ns ns ns ns ns 0.27 ns ns ns 0.77 ns Dfn3 ns ns ns ns ns ns ns ns ns ns ns ns ns ns 0.46 0.37 ns ns ns ns ns ns ns ns ns ns ns ns Dfot ns ns ns ns ns ns ns ns ns ns ns ns ns ns ns ns ns ns 0.58 ns ns ns ns ns ns ns ns ns Adj. R2 0.11 0.06 0.16 0.11 0.12 0.05 0.07 0.04 0.17 0.15 0.11 0.11 0.09 0.08 0.15 0.06 0.11 0.08 0.11 0.08 0.13 0.14 0.11 0.13 0.43 0.17 0.28 0.14Equation 8 Dfmn 0.15 ns ns ns ns ns ns ns ns ns ns ns ns ns 0.39 0.38 0.18 ns ns ns ns ns ns ns ns ns 0.41 ns Dfmj ns ns 0.39 0.47 ns ns ns ns 0.35 ns -0.29 ns 0.40 0.41 0.73 0.68 ns ns ns ns ns ns ns ns ns ns ns ns Dfwh ns ns ns ns 0.48 0.45 ns ns 0.39 0.37 -0.34 ns ns ns ns ns ns ns ns ns ns ns ns ns ns ns ns ns Adj. R2 0.12 0.06 0.16 0.12 0.12 0.06 0.07 0.03 0.17 0.16 0.11 0.11 0.09 0.08 0.15 0.06 0.11 0.07 0.11 0.08 0.12 0.13 0.09 0.10 0.43 0.18 0.28 0.13
Notes: ns=coefficient not significant at the 5% level or better.Coefficients come from ordinary least squares estimates of each equation in firm-level cross sections for samples of all plants and large plants in each industry.Heteroscedasticity-consistent standard errors used if the White heteroscedasticity test is significant at 0.05 or less.See Appendix Table 4 for detailed estimatation results.
28

Table 5: Significant Coefficients on Foreign Ownership Dummies and Adjusted R-squared from Estimates of Labor Productivity Equations (1) to (3) for 14 Manufacturing Industries:1998 Survey Samples (all=samples including all plants with viable observations; large=samples of large plants with gross output>=25 million baht)
Coeffi-cents, Food Textiles Apparel
Leather &footwear Chemicals
Rubberproducts
Plastics &products
Nonme-tallic
mineral pr. Metal
products General
machinery Electric
machinery Motor
vehicles Furniture JewelryAdj. R2 all large all large all large all large all large all large all large all large all large all large all large all large all large all large
Equation 1 Df 0.64 0.29 ns ns 0.81 0.51 ns ns 0.41 0.36 ns ns 0.40 ns 0.65 0.50 ns ns 0.40 ns 0.31 ns 0.86 ns ns -0.71 0.94 n<30 Adj. R2 0.17 0.10 0.33 0.18 0.21 0.25 0.21 0.30 0.19 0.12 0.18 0.13 0.09 0.11 0.18 0.17 0.14 0.16 0.41 0.33 0.17 0.11 0.32 0.29 0.39 0.18 0.27 n<30Equation 2 Dftr 0.79 0.45 ns ns 0.82 ns ns ns 0.50 0.46 ns ns 0.56 ns 1.06 0.73 ns ns 0.35 ns ns ns 0.97 0.57 ns -0.79 0.95 n<30 Dfn3 0.49 ns ns ns ns 1.13 ns ns ns ns 0.67 0.69 ns ns ns ns ns ns ns ns ns ns ns ns ns ns ns n<30 Dfot ns ns ns ns 0.81 ns ns ns ns ns ns ns ns ns ns ns ns ns ns ns ns ns ns ns ns ns ns n<30 Adj. R2 0.17 0.10 0.33 0.18 0.20 0.25 0.20 0.32 0.19 0.12 0.20 0.15 0.09 0.10 0.19 0.19 0.14 0.16 0.40 0.33 0.16 0.10 0.31 0.32 0.38 0.17 0.25 n<30Equation 3 Dfeu 1.03 ns ns ns ns ns ns - 0.93 0.82 ns ns ns ns 1.27 0.95 ns ns ns ns ns ns ns ns ns ns ns n<30 Dfus 1.67 1.32 ns ns - - ns ns ns ns ns ns ns ns 1.04 ns -2.79 - ns -1.12 ns -0.69 ns ns ns ns ns n<30 Dfjp 0.57 ns ns ns 0.76 ns ns ns ns ns ns ns 0.56 ns 0.89 ns 0.41 ns 0.36 ns 0.37 ns 0.98 0.59 ns -0.73 ns n<30 Dfn3 0.49 ns ns ns ns 1.11 ns ns ns ns 0.65 0.68 ns ns ns ns ns ns ns ns ns ns ns ns ns ns - n<30 Dfot ns ns ns ns 0.83 ns ns ns ns ns ns ns ns ns ns ns ns ns ns ns ns ns ns ns ns ns ns n<30 Adj. R2 0.18 0.11 0.33 0.17 0.20 0.26 0.22 0.35 0.19 0.12 0.21 0.15 0.08 0.08 0.19 0.18 0.15 0.16 0.41 0.34 0.17 0.14 0.31 0.30 0.38 0.16 0.22 n<30
Notes: ns=coefficient not significant at the 5% level or better; - = no plants in this category; n<30 = sample size smaller than 30.Coefficients come from ordinary least squares estimates of each equation in firm-level cross sections for samples of all plants and large plants in each industry.Heteroscedasticity-consistent standard errors used if the White heteroscedasticity test is significant at 0.05 or less.If White cannot be calculated, heteroscedasticity-consistent standard errors used if the LM heteroscedasticity test is significant at 0.05 or less.See Appendix Table 5 for detailed estimatation results.
29

Table 6: Significant Coefficients on Foreign Ownership Dummies and Adjusted R-squared from Estimates of Wage Equations (5) to (7) for 14 Manufacturing Industries:1998 Survey Samples (all=samples including all plants with viable observations; large=samples of large plants with gross output>=25 million baht)
Coeffi-cents, Food Textiles Apparel
Leather &footwear Chemicals
Rubberproducts
Plastics &products
Nonme-tallic
mineral pr. Metal
products General
machinery Electric
machinery Motor
vehicles Furniture JewelryAdj. R2 all large all large all large all large all large all large all large all large all large all large all large all large all large all large
Equation 5 Df 0.39 0.29 ns ns 0.38 0.38 ns 0.26 0.31 0.34 ns ns 0.29 ns 0.48 0.49 0.16 ns 0.25 0.19 ns ns 0.28 ns 0.50 ns ns n<30 Adj. R2 0.10 0.05 0.24 0.06 0.24 0.17 0.14 0.12 0.11 0.06 0.18 0.07 0.06 0.01 0.14 0.17 0.09 0.07 0.25 0.20 0.08 0.06 0.30 0.44 0.46 0.20 0.44 n<30Equation 6 Dftr 0.41 0.31 ns ns ns ns ns ns 0.40 0.41 ns ns 0.32 ns 0.57 0.53 0.28 ns 0.26 ns ns ns 0.39 ns ns ns ns n<30 Dfn3 0.33 ns ns ns ns ns ns 0.39 ns ns 0.67 ns ns ns 0.61 0.71 ns ns ns ns ns ns ns ns ns ns ns n<30 Dfot 0.42 ns ns ns 0.61 0.66 ns ns ns ns ns ns ns ns ns ns ns ns ns ns ns ns ns ns 1.09 ns ns n<30 Adj. R2 0.10 0.05 0.25 0.07 0.25 0.19 0.13 0.12 0.11 0.06 0.20 0.08 0.05 0.00 0.15 0.20 0.10 0.06 0.24 0.19 0.07 0.06 0.32 0.43 0.46 0.19 0.43 n<30Equation 7 Dfeu 0.54 0.42 ns 0.42 ns ns ns - ns ns ns ns ns ns 0.59 0.58 ns ns ns ns ns ns ns ns -0.64 ns ns n<30 Dfus 0.98 0.87 ns ns - - ns ns 0.60 0.69 ns ns ns 0.53 0.90 0.87 ns - ns ns ns ns ns ns 0.58 ns ns n<30 Dfjp 0.27 ns ns ns 0.41 ns 0.49 0.55 ns ns ns -0.45 0.32 ns ns ns 0.30 ns 0.31 0.24 ns ns 0.38 ns ns ns ns n<30 Dfn3 0.32 ns ns ns ns ns ns 0.40 ns ns 0.65 ns ns ns 0.61 0.71 ns ns ns ns ns ns ns ns ns ns - n<30 Dfot 0.42 ns ns ns 0.60 0.65 ns ns ns ns ns ns ns ns ns ns ns ns ns ns ns ns ns ns 1.09 ns ns n<30 Adj. R2 0.11 0.07 0.25 0.06 0.25 0.18 0.13 0.13 0.11 0.07 0.21 0.09 0.04 -0.02 0.15 0.21 0.09 0.05 0.24 0.19 0.10 0.11 0.31 0.43 0.46 0.17 0.41 n<30
Notes: ns=coefficient not significant at the 5% level or better; - = no plants in this category; n<30 = sample size smaller than 30.Coefficients come from ordinary least squares estimates of each equation in firm-level cross sections for samples of all plants and large plants in each industry.Heteroscedasticity-consistent standard errors used if the White heteroscedasticity test is significant at 0.05 or less.If White cannot be calculated, heteroscedasticity-consistent standard errors used if the LM heteroscedasticity test is significant at 0.05 or less.See Appendix Table 6 for detailed estimatation results.
30

Table 7: Significant Coefficients on Foreign Ownership Dummies and Adjusted R-squared from Estimates of Labor Productivity Equations (1) to (3) for 14 Manufacturing Industries:2000 Survey Samples (all=samples including all plants with viable observations; large=samples of large plants with gross output>=25 million baht)
Coeffi-cents, Food Textiles Apparel
Leather &footwear Chemicals
Rubberproducts
Plastics &products
Nonme-tallic
mineral pr. Metal
products General
machinery Electric
machinery Motor
vehicles Furniture JewelryAdj. R2 all large all large all large all large all large all large all large all large all large all large all large all large all large all large
Equation 1 Df ns ns ns ns ns ns 0.98 ns ns ns ns ns ns ns ns ns ns ns ns ns ns ns ns ns 0.96 ns ns n<30 Adj. R2 0.18 0.10 0.32 0.03 0.27 0.00 0.07 0.23 0.34 0.05 0.05 0.01 0.08 0.05 0.08 0.03 0.08 0.01 0.05 -0.01 0.09 0.04 0.21 -0.01 0.57 0.25 0.17 n<30Equation 2 Dftr ns ns ns ns ns ns ns ns ns ns ns ns ns ns ns ns ns ns ns ns -0.49 -0.53 ns ns ns ns ns n<30 Dfn3 0.58 ns ns ns ns ns 1.17 ns ns ns ns ns ns ns ns ns ns ns ns ns ns ns ns ns ns ns ns n<30 Dfot ns ns ns ns ns ns ns ns ns ns ns ns ns ns ns ns ns ns ns ns ns ns ns ns ns ns ns n<30 Adj. R2 0.18 0.10 0.31 0.03 0.26 -0.06 0.06 0.19 0.33 0.05 0.03 -0.01 0.06 0.03 0.07 0.01 0.09 0.01 0.04 -0.04 0.11 0.06 0.19 -0.02 0.56 0.21 0.21 n<30Equation 3 Dfeu ns -0.71 ns ns - - - - ns ns 1.31 ns ns ns ns ns ns ns ns ns ns ns ns ns - - ns n<30 Dfus ns ns ns ns ns ns - - ns ns ns ns - - ns ns - - - - ns ns ns ns ns ns - n<30 Dfjp ns ns ns ns ns ns ns ns ns ns ns ns ns ns ns ns ns ns 0.86 ns -0.50 -0.53 ns ns ns ns ns n<30 Dfn3 0.57 ns ns ns ns ns 1.17 ns ns ns ns ns ns ns 0.72 ns ns ns ns ns ns ns ns ns ns ns ns n<30 Dfot ns ns ns ns ns ns ns ns ns ns ns ns ns ns ns ns ns ns ns ns ns ns ns ns ns ns ns n<30 Adj. R2 0.19 0.11 0.30 0.01 0.24 -0.10 0.06 0.19 0.32 0.03 0.09 0.05 0.09 0.06 0.08 0.03 0.09 0.00 0.05 -0.04 0.09 0.04 0.18 -0.06 0.55 0.21 0.20 n<30
Notes: ns=coefficient not significant at the 5% level or better; - = no plants in this category; n<30 = sample size smaller than 30.Coefficients come from ordinary least squares estimates of each equation in firm-level cross sections for samples of all plants and large plants in each industry.Heteroscedasticity-consistent standard errors used if the White heteroscedasticity test is significant at 0.05 or less.If White cannot be calculated, heteroscedasticity-consistent standard errors used if the LM heteroscedasticity test is significant at 0.05 or less.See Appendix Table 7 for detailed estimatation results.
31

Table 8: Significant Coefficients on Foreign Ownership Dummies and Adjusted R-squared from Estimates of Wage Equations (5) to (7) for 14 Manufacturing Industries:2000 Survey Samples (all=samples including all plants with viable observations; large=samples of large plants with gross output>=25 million baht)
Coeffi-cents, Food Textiles Apparel
Leather &footwear Chemicals
Rubberproducts
Plastics &products
Nonme-tallic
mineral pr. Metal
products General
machinery Electric
machinery Motor
vehicles Furniture JewelryAdj. R2 all large all large all large all large all large all large all large all large all large all large all large all large all large all large
Equation 5 Df 0.17 ns 0.31 0.41 ns ns 0.45 ns ns ns ns ns 0.48 ns 0.54 0.33 ns ns 0.41 ns ns ns ns ns 1.03 0.38 ns n<30 Adj. R2 0.19 0.08 0.26 0.03 0.46 0.20 0.10 0.05 0.34 0.15 0.03 0.08 0.12 0.12 0.22 0.14 0.22 0.13 0.23 0.20 0.14 0.14 0.14 0.12 0.47 0.21 0.41 n<30Equation 6 Dftr ns ns ns 0.50 ns ns 0.59 ns ns ns ns ns 0.38 ns 0.47 ns ns ns 0.46 ns ns ns ns ns ns ns ns n<30 Dfn3 0.45 0.38 ns ns ns ns ns ns ns ns ns ns ns ns 0.54 ns ns ns ns ns ns ns ns ns ns ns ns n<30 Dfot ns ns 0.44 ns ns ns ns ns ns ns ns ns ns ns 0.82 ns ns ns ns ns 0.62 ns ns ns ns 0.63 ns n<30 Adj. R2 0.19 0.09 0.26 0.02 0.45 0.16 0.08 0.00 0.32 0.15 0.03 0.08 0.10 0.11 0.21 0.13 0.22 0.12 0.22 0.19 0.16 0.17 0.12 0.08 0.46 0.19 0.37 n<30Equation 7 Dfeu ns ns ns ns - - - - ns ns ns ns ns ns ns ns ns ns ns ns ns ns ns ns - - ns n<30 Dfus ns ns 0.57 ns ns ns - - 0.45 ns ns ns - - 0.93 ns - - - - ns ns ns ns ns ns - n<30 Dfjp ns ns ns 0.57 ns ns 0.59 ns ns 0.42 ns ns 0.51 ns ns ns ns ns 0.52 ns ns ns ns ns ns ns ns n<30 Dfn3 0.45 0.38 ns ns ns ns 0.38 ns ns ns ns ns ns ns 0.53 ns ns ns ns ns ns ns ns ns ns ns ns n<30 Dfot ns ns 0.43 0.52 ns ns ns ns ns ns ns ns 0.69 ns 0.81 ns ns ns ns ns 0.62 ns ns ns ns 0.63 ns n<30 Adj. R2 0.19 0.09 0.25 0.01 0.44 0.13 0.08 0.00 0.33 0.20 0.02 0.07 0.10 0.10 0.21 0.12 0.21 0.11 0.22 0.19 0.16 0.17 0.12 0.20 0.45 0.18 0.38 n<30
Notes: ns=coefficient not significant at the 5% level or better; - = no plants in this category; n<30 = sample size smaller than 30.Coefficients come from ordinary least squares estimates of each equation in firm-level cross sections for samples of all plants and large plants in each industry.Heteroscedasticity-consistent standard errors used if the White heteroscedasticity test is significant at 0.05 or less.If White cannot be calculated, heteroscedasticity-consistent standard errors used if the LM heteroscedasticity test is significant at 0.05 or less.See Appendix Table 8 for detailed estimatation results.
32
33
Statistical Appendix: Details from Thailand’s Industrial Censuses and Surveys
This appendix first provides details underlying the text tables which could not be included in
the main text because of space constraints. Data on employment (Appendix Tables 1a-1f) and value
added (Appendix Tables 2a-2f) are first provided for all sample plants (used to construct text Tables 1-2)
as well as for samples of large plants. In addition, because many of these compilations have not been
published before, these appendix tables contain industry and country details that were not used in the text,
but might be useful in future studies. Appendix Tables 3-8 then provide detailed regression results
underlying corresponding Tables 3-8 in the text, including all estimated coefficients and significance
levels for two-tailed t-tests of the hypothesis that the each coefficient is zero, the adjusted R-squared, the
F-statistic testing the hypothesis that all slope coefficients are zero and its significance level, the White
test for heteroscedasticity and its significance level, and the number of observations. Finally, details on
value added per hour (Appendix Tables 9a-9f), compensation per hour (Appendix Tables 10a-10f), and
the number of plants in each sample (Appendix Tables 11a-11f) are provided by industry and ownership
group for samples of all plants and samples of large plants.
The second and perhaps more important aim of this appendix is to detail the methodology for
removing apparently duplicate entries from the datasets. As indicated in the text, the data used in this
study are the factory-level data for that underlie the 1997 industrial census of 1996 data (National
Statistical Office 1999), the 1999 industrial survey of 1998 data (National Statistical Office 2001a) and
the 2001 manufacturing industry survey of 2000 data (National Statistical Office forthcoming). Before
checking for duplicates, plants that reported less than 1,000 baht in purchases of materials and
components, sales of goods produced, and beginning- and end-of-year fixed asset (=capital) stocks were
removed from the data sets because such small values are not economically meaningful. Plants
reporting less than 20 persons engaged were also eliminated because comparisons of these small plants,
which are predominately local, with foreign MNCs are not very meaningful. Removal of these plants
reduced samples from 23,677 to 13,834 in 1996, 8,552 to 4,946 in 1998, and 9,294 to 2,896 in 2000.
The dataset for 1996 contained another 8,812 observations (a total of 32,489 observations) but these
observations were marked as non-replying plants and not analyzed.

34
To check for duplicate records, the data file was first sorted by (a) sales of goods produced, (b)
purchases of materials and components, and (c) persons engaged. Duplicate checking was then
conducted for 10 variables: (1) industry, (2) capacity utilization=(number of hours in operation per day
* number of days in operation in the year)/(24*number of days in the year)*100), (3) number of
employees, (4) wage income paid, (5) purchases of materials and components, (6) total intermediate
consumption, (7) sales of goods produced, (8) total gross output, (9) fixed assets at the beginning of the
year, and (10) fixed assets at year end. The number of duplicates and near duplicates found by this
procedure is summarized below:
1996 data 1998 data 2000 data 10/10 variables are duplicates 3,541 plants 91 plants 2 plants at least 9/10 variables are duplicates 5,357 plants 124 plants 2 plants at least 8/10 variables are duplicates 6,266 plants 135 plants 4 plants at least 7/10 variables are duplicates 6,792 plants 145 plants 7 plants at least 6/10 variables are duplicates 7,053 plants 163 plants 13 plants at least 5/10 variables are duplicates 7,167 plants 191 plants 15 plants
Among these duplicate or near-duplicate records, information on plant location was often different while
most if not all other variables were identical, which suggests that several plants of multi-plant firms all
reported firm-wide information. Likewise information on industry affiliation and ownership often
differed in some cases while other information was identical. There were also a number of apparent
typographical errors and a number of records that were repeated several times. There is no good way to
eliminate duplicates given all these problems but to avoid double counting it is clearly necessary to
eliminate (1) all duplicates from data set or (2) all records but one record from each set of duplicates.
Option (2) was chosen because it maximizes the coverage of the samples. Duplicates were
eliminated in the following manner. First, for large establishments, data were cross checked with
published sources (Advanced Research Group Co. Ltd., 1998, various years; Business Research and
Development, various years; The Nation, various years; The Brooker Group, 1996, 1997; Toyo Keizai,
various years) and the record thought to be most reliable was retained. Second, if there were 3 or more
records in a duplicate set, most commonly observed values were retained in the data set. Third, if a
plant was reported as both foreign- and locally-owned, it was assumed to be foreign-owned unless other
information to the contrary was available or the above criteria contradicted this one. Fourth, if the year
of establishment differed, the older year was used unless other information to the contrary was available
or the above criteria were contradictory. Finally, there were a number of records where the choice of

35
the record to retain was arbitrary.
After duplicate checking was complete, plants that reported non-positive values for value
added were also eliminated from the samples used in this study because non-positive values do not make
economic sense in this context. As noted in the text, all of these adjustments reduced sample sizes
substantially, from 23,677 plants (2,672 foreign MNCs) to 10,494 (1,822) in 1996, from 8,552 (1,124) to
4,773 (1,026) in 1998, and from 9,286 (644) to 2,520 (520) in 2000. Samples of large plants with
output of 25 million baht or more were even smaller, 5,481 plants (1,509 foreign MNCs) in 1996, 2,729
(885) in 1998, and 1,487 (476). More detailed data on the number of plants, employment, and
ownership group are provided in the Appendix Tables 11a-11f. However, even though these samples
are much smaller than the original samples, they cover the majority of employment and value added in
the original sample plants as noted in the text (see also Appendix Tables 1a-1f and 2a-2f).
Additional References used in the Statistical Appendix: Advanced Research Group Co. Ltd., 1998. Financial Focus, CD-ROM. Bangkok: Advanced Research Group Co., Ltd. Advanced Research Group Co. Ltd., various years. Thailand Company Information, 1988-1989, 1989-1990, 1990-1991, 1991-1992, 1992-1993, 1993-1994, 1994-1995, 1995-1996, 1996-1997, 1997-1998, 1998-1999, 1999-2000, 2000-2001, 2001-2002 issues. Bangkok: Advanced Research Group Co., Ltd. Business Research and Development, various years. Thailand Business Profiles, 1996-1997 and 1997-1998 issues. Bangkok: Business Research and Development. The Brooker Group, 1996. Directory of Supporting Industries in Thailand 1996. Bangkok: The Brooker Group (including accompanying diskette). The Brooker Group, 1997. Profiles of BOI-Promoted Companies and Sectors - 1997. Bangkok: Board of Investment Welfare (including accompanying diskette). The Nation, various years. Top 1000 Companies, 1997-1998 issues; Top 1000, 1999 issue; 1000 Top Companies, 2000 issue. Bangkok: The Nation. Toyo Keizai, various years. Kaigai Shinshutsu Kigyo Soran (A Comprehensive Survey of Firms Overseas), CD-ROMs with data from 1998 and 2000 issues (data for 1996, 1998). Tokyo: Toyo Keizai (in Japanese).

Appendix Table 1a: Estimates of Employment in Thai Manufacturing by Foreign Ownership Share or Foreign Nationality and Industry, 1996 (number)Industrial Census (average Labor Force Survey Estimate for Manufacturing = 4,682,200)
Sample plantsPubli- All Foreign Foreign, by nationality Foreign, by ownership
Industry cation plants total EU US JP N3 N3si N3tw N3kr OT OTch OTot MN MJ WHManufacturing 2,413,325 1,772,616 749,129 40,108 105,200 318,602 139,068 22,382 98,027 18,659 146,151 46,509 99,642 423,422 141,527 184,180 Food 349,034 269,698 79,617 7,332 7,815 34,122 11,692 1,748 8,441 1,503 18,656 9,167 9,489 64,015 10,856 4,746 Textiles 224,860 151,904 63,741 975 1,357 28,010 15,209 536 12,359 2,314 18,190 10,461 7,729 55,047 5,878 2,816 Apparel 175,151 134,854 42,101 1,343 2,270 10,245 5,905 806 4,755 344 22,338 3,035 19,303 37,890 3,016 1,195 Leather & footwear 88,882 54,149 15,720 550 3,106 3,280 6,856 0 3,884 2,972 1,928 33 1,895 10,060 3,964 1,696 Chemicals & products 93,274 67,517 25,160 2,314 5,853 8,282 3,317 968 2,042 307 5,394 2,030 3,364 15,045 4,551 5,564 Rubber products 79,242 63,358 27,023 1,888 2,157 5,986 6,690 1,936 4,492 262 10,302 693 9,609 13,330 8,307 5,386 Plastics & products 113,000 79,616 25,287 483 369 10,265 4,552 939 3,086 527 9,618 1,845 7,773 14,427 5,315 5,545 Non-metallic mineral products 153,973 102,324 20,937 1,120 1,474 3,926 10,571 1,260 9,156 155 3,846 2,137 1,709 13,172 4,910 2,855 Metal products 129,347 88,228 33,184 1,112 567 11,442 8,071 1,619 6,030 422 11,992 9,961 2,031 23,319 3,289 6,576 General machinery 113,280 92,325 59,562 781 519 43,127 12,159 6,693 4,415 1,051 2,976 217 2,759 23,173 9,342 27,047 Electric machinery, etc. 301,917 226,153 190,269 11,925 49,043 84,049 32,646 4,064 23,621 4,961 12,606 304 12,302 45,471 39,476 105,322 Office & computing machinery 78,661 52,119 51,800 0 36,579 4,760 8,914 364 7,970 580 1,547 0 1,547 8,068 4,636 39,096 Miscellaneous electric mach. 84,860 65,160 46,674 268 6,466 27,636 10,568 583 9,807 178 1,736 0 1,736 18,296 15,785 12,593 Radio, TV, communication 113,328 88,193 74,952 6,924 4,455 44,150 12,838 3,117 5,518 4,203 6,585 304 6,281 17,166 15,997 41,789 Precision machinery 25,068 20,681 16,843 4,733 1,543 7,503 326 0 326 0 2,738 0 2,738 1,941 3,058 11,844 Motor vehicles 107,222 80,956 45,803 152 409 43,317 469 0 351 118 1,456 106 1,350 30,557 13,251 1,995 Furniture 86,636 67,460 15,952 241 2,027 4,348 3,880 39 2,993 848 5,456 913 4,543 12,567 1,986 1,399 Jewelry 30,945 24,473 14,399 4,701 2,086 833 964 464 403 97 5,815 98 5,717 6,599 5,354 2,446 Other manufacturing industries 366,562 269,601 90,374 5,191 26,148 27,370 16,087 1,310 11,999 2,778 15,578 5,509 10,069 58,750 22,032 9,592 Beverages 50,161 34,192 19,923 0 16,099 0 90 90 0 0 3,734 0 3,734 19,663 260 0 Tobacco 17,150 14,605 3,080 913 0 0 0 0 0 0 2,167 2,167 0 913 0 2,167 Wood products 58,580 47,223 5,769 552 0 1,576 1,157 689 468 0 2,484 804 1,680 5,166 603 0 Paper products 43,207 31,215 8,264 311 1,405 1,982 2,097 0 1,572 525 2,469 878 1,591 6,565 1,663 36 Printing & publishing 47,570 36,687 7,668 1,625 4,264 784 65 65 0 0 930 0 930 7,571 69 28 Oil, coal, nuclear, etc. 7,413 6,710 4,694 864 2,393 939 350 0 0 350 148 0 148 2,301 2,393 0 Basic metals 43,171 28,062 9,050 428 332 6,229 942 0 498 444 1,119 403 716 8,106 763 181 Misc. transportation machinery 22,296 15,850 3,904 118 0 2,196 791 466 325 0 799 630 169 3,579 205 120 Other misc. manufacturing 77,014 55,057 28,022 380 1,655 13,664 10,595 0 9,136 1,459 1,728 627 1,101 4,886 16,076 7,060Notes: EU=Europe; US=United States; JP=Japan; N3=N3si+N3tw+N3kr; N3si=Singapore, N3tw=Taiwan, KR=Korea; OT=OTch+OTot; OTch=China; OTot=Others. WH=wholly foreign, MJ.=50-99% foreign-owned; MN=1-49% foreign owned; .Sources: National Statistical Office (1999) and author's calculations from plant-level data underlying this publication; National Statistical Office (2003).
36

Appendix Table 1b: Estimates of Employment in Thai Manufacturing by Foreign Nationality and Industry, 1998 (number)Industrial Survey (average Labor Force Survey Estimate for Manufacturing = 4,577,200)
Sample plantsPubli- All Foreign Foreign, by nationality
Industry cation plants total EU US JP N3 N3si N3tw N3kr OT OTch OTotManufacturing 2,023,020 928,743 417,635 30,024 44,190 203,291 74,551 11,815 53,208 9,528 65,579 17,853 47,726 Food 357,786 181,080 53,307 4,122 5,283 18,981 12,076 2,979 8,889 208 12,845 3,740 9,105 Textiles 201,172 70,614 23,809 1,647 699 5,779 6,022 0 5,718 304 9,662 2,413 7,249 Apparel 141,303 42,973 18,825 3,138 0 4,124 1,364 189 1,175 0 10,199 2,710 7,489 Leather & footwear 80,946 46,675 8,129 49 2,459 459 2,266 0 1,235 1,031 2,896 689 2,207 Chemicals & products 61,355 32,186 12,714 1,875 1,170 5,465 2,039 736 1,303 0 2,165 404 1,761 Rubber products 69,962 44,416 18,660 1,555 5,521 5,224 2,741 334 2,363 44 3,619 607 3,012 Plastics & products 109,802 35,248 16,234 500 197 7,269 3,413 796 2,334 283 4,855 3,973 882 Non-metallic mineral products 130,824 60,506 19,873 2,167 5,352 6,953 3,726 501 3,225 0 1,675 296 1,379 Metal products 106,844 34,648 10,664 100 328 6,722 2,610 566 2,044 0 904 648 256 General machinery 94,228 62,165 51,492 743 1,150 43,909 1,826 374 631 821 3,864 62 3,802 Electric machinery, etc. 260,028 129,232 113,990 9,195 16,286 57,677 24,901 4,040 17,230 3,631 5,931 126 5,805 Office & computing machinery 34,951 22,986 22,485 0 9,289 4,365 8,684 822 7,862 0 147 0 147 Miscellaneous electric mach. 85,922 44,843 37,704 9,050 1,249 17,107 6,869 1,850 5,019 0 3,429 126 3,303 Radio, TV, communication 126,505 52,614 48,289 0 5,384 31,727 8,823 1,368 3,824 3,631 2,355 0 2,355 Precision machinery 12,650 8,789 5,512 145 364 4,478 525 0 525 0 0 0 0 Motor vehicles 78,616 29,235 19,144 75 75 18,026 600 265 335 0 368 77 291 Furniture 72,880 38,480 5,129 220 285 3,179 1,174 0 1,174 0 271 0 271 Jewelry 23,565 7,352 3,070 381 1,253 190 0 0 0 0 1,246 497 749 Other manufacturing industries 233,709 113,933 42,595 4,257 4,132 19,334 9,793 1,035 5,552 3,206 5,079 1,611 3,468 Beverages 21,846 11,551 2,709 0 1,227 86 80 80 0 0 1,316 0 1,316 Tobacco 8,979 4,788 2,022 0 2,022 0 0 0 0 0 0 0 0 Wood products 41,327 24,600 2,907 577 73 714 1,223 558 665 0 320 168 152 Paper products 28,640 13,975 3,742 0 55 993 1,229 41 1,142 46 1,465 190 1,275 Printing & publishing 31,302 6,925 950 280 417 103 150 106 44 0 0 0 0 Oil, coal, nuclear, etc. 1,580 867 106 0 0 106 0 0 0 0 0 0 0 Basic metals 31,559 16,385 5,319 457 49 3,845 332 250 82 0 636 329 307 Misc. transportation machinery 16,679 4,594 2,411 173 0 2,215 23 0 23 0 0 0 0 Other misc. manufacturing 56,800 30,248 22,429 2,770 289 11,272 6,756 0 3,596 3,160 1,342 924 418Notes: EU=Europe; US=United States; JP=Japan; N3=N3si+N3tw+N3kr; N3si=Singapore, N3tw=Taiwan, KR=Korea; OT=OTch+OTot; OTch=China; OTot=Others. Sources: National Statistical Office (2001a) and author's calculations from plant-level data underlying this publication; National Statistical Office (2003).
37

Appendix Table 1c: Estimates of Employment in Thai Manufacturing by Foreign Nationality and Industry, 2000 (number)Manufacturing Industry Survey (average Labor Force Survey Estimate for Manufacturing = 5,004,800)
Sample plantsPubli- All Foreign Foreign, by nationality
Industry cation plants total EU US JP N3 N3si N3tw N3kr OT OTch OTotManufacturing 2,318,752 634,780 286,001 57,984 28,637 129,369 41,274 9,997 26,833 4,444 28,737 5,308 23,429 Food - 126,152 41,755 10,820 729 18,745 5,379 3,317 2,042 20 6,082 221 5,861 Textiles 233,243 54,396 11,366 135 392 2,982 3,496 0 3,496 0 4,361 539 3,822 Apparel 146,355 19,008 5,635 0 970 1,563 190 0 190 0 2,912 716 2,196 Leather & footwear 105,938 25,193 2,654 0 0 541 1,610 0 956 654 503 0 503 Chemicals & products 86,204 16,729 8,269 3,670 324 2,925 729 207 522 0 621 0 621 Rubber products - 24,063 10,192 2,466 3,991 1,703 1,277 304 973 0 755 504 251 Plastics & products - 17,013 4,661 733 0 1,891 218 0 218 0 1,819 494 1,325 Non-metallic mineral products 130,524 34,817 12,241 4,068 1,265 1,797 4,491 574 3,917 0 620 0 620 Metal products 104,250 24,392 9,703 2,197 0 4,196 2,648 544 2,104 0 662 249 413 General machinery 83,285 23,314 16,788 574 0 15,442 405 102 303 0 367 35 332 Electric machinery, etc. 355,445 121,511 101,315 23,866 5,838 59,375 9,991 3,350 6,261 380 2,245 0 2,245 Office & computing machinery 60,686 25,586 24,119 17,428 1,357 4,724 496 0 496 0 114 0 114 Miscellaneous electric mach. 113,093 31,274 24,242 3,020 4,481 13,716 3,025 1,165 1,635 225 0 0 0 Radio, TV, communication 153,457 49,916 43,396 0 0 35,097 6,168 2,185 3,983 0 2,131 0 2,131 Precision machinery 28,209 14,735 9,558 3,418 0 5,838 302 0 147 155 0 0 0 Motor vehicles 102,141 13,683 8,575 429 71 7,424 578 241 337 0 73 0 73 Furniture - 25,345 4,062 0 660 2,273 614 0 614 0 515 407 108 Jewelry - 10,394 7,326 3,554 0 562 2,250 0 628 1,622 960 223 737 Other manufacturing industries - 98,770 41,459 5,472 14,397 7,950 7,398 1,358 4,272 1,768 6,242 1,920 4,322 Beverages - 19,505 12,541 2,274 10,010 225 0 0 0 0 32 0 32 Tobacco 12,462 9,277 3,392 508 2,223 0 0 0 0 0 661 0 661 Wood products 52,482 13,973 1,128 0 0 179 764 0 174 590 185 185 0 Paper products 44,260 11,766 3,362 64 0 677 811 0 811 0 1,810 0 1,810 Printing & publishing 44,543 8,806 3,182 0 475 47 1,490 1,358 132 0 1,170 0 1,170 Oil, coal, nuclear, etc. 8,003 1,735 568 420 0 0 0 0 0 0 148 0 148 Basic metals 38,591 7,743 3,391 323 287 2,661 0 0 0 0 120 77 43 Misc. transportation machinery 24,597 5,367 2,173 51 0 1,756 0 0 0 0 366 0 366 Other misc. manufacturing 163,182 20,598 11,722 1,832 1,402 2,405 4,333 0 3,155 1,178 1,750 1,658 92Notes: EU=Europe; US=United States; JP=Japan; N3=N3si+N3tw+N3kr; N3si=Singapore, N3tw=Taiwan, KR=Korea; OT=OTch+OTot; OTch=China; OTot=Others. Sources: National Statistical Office (forthcoming) and author's calculations from plant-level data underlying this publication; National Statistical Office (2003).
38

Appendix Table 1d: Estimates of Employment in Large Sample Plants by Foreign Ownership Share or Foreign Nationality and Industry, 1996 (number)All Foreign Foreign, by nationality Foreign, by ownership
Industry plants total EU US JP N3 N3si N3tw N3kr OT OTch OTot MN MJ WHManufacturing 1,561,569 730,316 38,969 104,399 313,847 132,319 21,802 92,713 17,804 140,782 45,148 95,634 411,607 137,008 181,701 Food 246,125 77,844 7,243 7,755 33,173 11,377 1,672 8,202 1,503 18,296 9,039 9,257 63,055 10,203 4,586 Textiles 136,013 62,073 832 1,357 27,933 14,610 484 11,919 2,207 17,341 10,243 7,098 53,564 5,807 2,702 Apparel 117,631 39,790 1,160 2,123 9,861 5,370 671 4,484 215 21,276 2,839 18,437 36,059 2,673 1,058 Leather & footwear 47,738 15,236 550 3,106 3,170 6,590 0 3,825 2,765 1,820 0 1,820 9,710 3,830 1,696 Chemicals & products 62,538 24,693 2,314 5,762 8,125 3,138 968 1,894 276 5,354 1,990 3,364 14,626 4,503 5,564 Rubber products 60,272 26,422 1,888 2,157 5,839 6,266 1,936 4,068 262 10,272 693 9,579 13,099 7,937 5,386 Plastics & products 69,039 24,051 450 280 9,855 3,987 873 2,587 527 9,479 1,734 7,745 13,742 5,091 5,218 Non-metallic mineral products 80,371 20,074 1,029 1,474 3,883 10,170 1,260 8,910 0 3,518 1,960 1,558 12,704 4,606 2,764 Metal products 71,123 32,029 1,087 428 11,092 7,497 1,556 5,519 422 11,925 9,894 2,031 22,477 3,129 6,423 General machinery 84,203 58,687 745 519 42,722 11,879 6,693 4,135 1,051 2,822 129 2,693 22,464 9,283 26,940 Electric machinery, etc. 219,158 188,748 11,836 48,960 83,268 32,151 4,034 23,200 4,917 12,533 304 12,229 44,514 39,308 104,926 Office & computing machinery 51,936 51,652 0 36,496 4,760 8,849 364 7,905 580 1,547 0 1,547 8,068 4,636 38,948 Miscellaneous electric mach. 61,369 46,179 268 6,466 27,359 10,385 583 9,624 178 1,701 0 1,701 17,907 15,724 12,548 Radio, TV, communication 86,470 74,358 6,924 4,455 43,803 12,591 3,087 5,345 4,159 6,585 304 6,281 16,845 15,927 41,586 Precision machinery 19,383 16,559 4,644 1,543 7,346 326 0 326 0 2,700 0 2,700 1,694 3,021 11,844 Motor vehicles 71,953 45,506 152 409 43,163 439 0 321 118 1,343 106 1,237 30,260 13,251 1,995 Furniture 45,918 15,428 241 2,027 4,157 3,793 0 2,945 848 5,210 804 4,406 12,131 1,898 1,399 Jewelry 20,102 12,809 4,334 1,988 808 895 395 403 97 4,784 98 4,686 6,317 4,340 2,152 Other manufacturing industries 229,385 86,926 5,108 26,054 26,798 14,157 1,260 10,301 2,596 14,809 5,315 9,494 56,885 21,149 8,892 Beverages 32,586 19,923 0 16,099 0 90 90 0 0 3,734 0 3,734 19,663 260 0 Tobacco 11,330 3,080 913 0 0 0 0 0 0 2,167 2,167 0 913 0 2,167 Wood products 35,639 4,948 552 0 1,545 740 689 51 0 2,111 668 1,443 4,485 463 0 Paper products 28,100 7,961 311 1,405 1,982 1,829 0 1,304 525 2,434 843 1,591 6,342 1,619 0 Printing & publishing 30,249 7,550 1,625 4,214 716 65 65 0 0 930 0 930 7,481 69 0 Oil, coal, nuclear, etc. 6,660 4,694 864 2,393 939 350 0 0 350 148 0 148 2,301 2,393 0 Basic metals 24,723 8,727 400 332 6,015 861 0 458 403 1,119 403 716 7,954 676 97 Misc. transportation machinery 13,143 3,719 83 0 2,196 741 416 325 0 699 630 69 3,394 205 120 Other misc. manufacturing 46,955 26,324 360 1,611 13,405 9,481 0 8,163 1,318 1,467 604 863 4,352 15,464 6,508Notes: EU=Europe; US=United States; JP=Japan; N3=N3si+N3tw+N3kr; N3si=Singapore, N3tw=Taiwan, KR=Korea; OT=OTch+OTot; OTch=China; OTot=Others. WH=wholly foreign, MJ.=50-99% foreign-owned; MN=1-49% foreign owned; .Sources: Author's calculations from plant-level data underlying National Statistical Office (1999).
39

Appendix Table 1e: Estimates of Employment in Large Sample Plantsby Foreign Nationality and Industry, 1998 (number)All Foreign Foreign, by nationality
Industry plants total EU US JP N3 N3si N3tw N3kr OT OTch OTotManufacturing 831,119 409,423 29,159 43,700 201,247 71,423 11,415 50,731 9,277 63,894 17,107 46,787 Food 166,003 52,552 4,122 5,283 18,695 11,707 2,979 8,520 208 12,745 3,660 9,085 Textiles 62,304 23,382 1,647 699 5,730 5,899 0 5,595 304 9,407 2,386 7,021 Apparel 38,246 18,311 3,138 0 4,124 1,175 0 1,175 0 9,874 2,385 7,489 Leather & footwear 43,519 7,855 0 2,459 438 2,062 0 1,065 997 2,896 689 2,207 Chemicals & products 29,088 12,294 1,875 1,138 5,376 1,825 736 1,089 0 2,080 350 1,730 Rubber products 42,844 18,537 1,555 5,521 5,167 2,675 334 2,297 44 3,619 607 3,012 Plastics & products 31,704 15,491 464 197 7,153 3,165 796 2,086 283 4,512 3,939 573 Non-metallic mineral products 49,256 19,363 1,988 5,352 6,953 3,507 501 3,006 0 1,563 205 1,358 Metal products 28,567 9,636 33 0 6,490 2,305 492 1,813 0 808 615 193 General machinery 58,462 51,310 743 1,150 43,909 1,711 374 516 821 3,797 39 3,758 Electric machinery, etc. 126,339 113,149 9,050 16,286 57,190 24,759 4,014 17,114 3,631 5,864 91 5,773 Office & computing machinery 22,986 22,485 0 9,289 4,365 8,684 822 7,862 0 147 0 147 Miscellaneous electric mach. 43,180 37,355 9,050 1,249 16,830 6,832 1,850 4,982 0 3,394 91 3,303 Radio, TV, communication 51,977 48,038 0 5,384 31,560 8,771 1,342 3,798 3,631 2,323 0 2,323 Precision machinery 8,196 5,271 0 364 4,435 472 0 472 0 0 0 0 Motor vehicles 26,446 19,040 75 75 17,963 600 265 335 0 327 77 250 Furniture 25,007 4,913 220 285 3,068 1,134 0 1,134 0 206 0 206 Jewelry 6,613 2,884 267 1,225 190 0 0 0 0 1,202 453 749 Other manufacturing industries 96,721 40,706 3,982 4,030 18,801 8,899 924 4,986 2,989 4,994 1,611 3,383 Beverages 10,190 2,709 0 1,227 86 80 80 0 0 1,316 0 1,316 Tobacco 3,680 2,022 0 2,022 0 0 0 0 0 0 0 0 Wood products 18,432 2,291 377 0 510 1,107 511 596 0 297 168 129 Paper products 12,971 3,570 0 55 993 1,057 0 1,011 46 1,465 190 1,275 Printing & publishing 6,168 902 255 417 103 127 83 44 0 0 0 0 Oil, coal, nuclear, etc. 867 106 0 0 106 0 0 0 0 0 0 0 Basic metals 13,673 4,978 457 49 3,537 299 250 49 0 636 329 307 Misc. transportation machinery 3,589 2,361 123 0 2,215 23 0 23 0 0 0 0 Other misc. manufacturing 27,151 21,767 2,770 260 11,251 6,206 0 3,263 2,943 1,280 924 356Notes: EU=Europe; US=United States; JP=Japan; N3=N3si+N3tw+N3kr; N3si=Singapore, N3tw=Taiwan, KR=Korea; OT=OTch+OTot; OTch=China; OTot=Others. Sources: Author's calculations from plant-level data underlying National Statistical Office (2001a).
40

Appendix Table 1f: Estimates of Employment in Large Sample Plants by Foreign Nationality and Industry, 2000 (number)All Foreign Foreign, by nationality
Industry plants total EU US JP N3 N3si N3tw N3kr OT OTch OTotManufacturing 584,792 283,527 57,741 28,637 128,833 40,057 9,855 25,982 4,220 28,259 5,186 23,073 Food 117,451 41,558 10,820 729 18,655 5,272 3,210 2,042 20 6,082 221 5,861 Textiles 49,587 11,189 106 392 2,982 3,428 0 3,428 0 4,281 459 3,822 Apparel 17,141 5,635 0 970 1,563 190 0 190 0 2,912 716 2,196 Leather & footwear 23,218 2,654 0 0 541 1,610 0 956 654 503 0 503 Chemicals & products 15,680 8,066 3,637 324 2,925 559 207 352 0 621 0 621 Rubber products 23,261 10,192 2,466 3,991 1,703 1,277 304 973 0 755 504 251 Plastics & products 15,794 4,459 733 0 1,841 131 0 131 0 1,754 472 1,282 Non-metallic mineral products 30,945 12,036 4,045 1,265 1,773 4,491 574 3,917 0 462 0 462 Metal products 21,461 9,601 2,197 0 4,149 2,613 544 2,069 0 642 229 413 General machinery 21,809 16,674 574 0 15,399 334 102 232 0 367 35 332 Electric machinery, etc. 120,710 101,203 23,866 5,838 59,294 9,991 3,350 6,261 380 2,214 0 2,214 Office & computing machinery 25,586 24,119 17,428 1,357 4,724 496 0 496 0 114 0 114 Miscellaneous electric mach. 30,988 24,242 3,020 4,481 13,716 3,025 1,165 1,635 225 0 0 0 Radio, TV, communication 49,842 43,344 0 0 35,076 6,168 2,185 3,983 0 2,100 0 2,100 Precision machinery 14,294 9,498 3,418 0 5,778 302 0 147 155 0 0 0 Motor vehicles 11,902 8,472 429 71 7,321 578 241 337 0 73 0 73 Furniture 15,800 4,018 0 660 2,273 570 0 570 0 515 407 108 Jewelry 9,710 7,116 3,396 0 535 2,225 0 603 1,622 960 223 737 Other manufacturing industries 90,323 40,654 5,472 14,397 7,879 6,788 1,323 3,921 1,544 6,118 1,920 4,198 Beverages 18,299 12,509 2,274 10,010 225 0 0 0 0 0 0 0 Tobacco 8,711 3,392 508 2,223 0 0 0 0 0 661 0 661 Wood products 12,246 1,041 0 0 128 728 0 138 590 185 185 0 Paper products 11,117 3,156 64 0 677 605 0 605 0 1,810 0 1,810 Printing & publishing 7,689 3,147 0 475 47 1,455 1,323 132 0 1,170 0 1,170 Oil, coal, nuclear, etc. 1,702 568 420 0 0 0 0 0 0 148 0 148 Basic metals 6,820 3,371 323 287 2,641 0 0 0 0 120 77 43 Misc. transportation machinery 4,953 2,173 51 0 1,756 0 0 0 0 366 0 366 Other misc. manufacturing 18,786 11,297 1,832 1,402 2,405 4,000 0 3,046 954 1,658 1,658 0Notes: EU=Europe; US=United States; JP=Japan; N3=N3si+N3tw+N3kr; N3si=Singapore, N3tw=Taiwan, KR=Korea; OT=OTch+OTot; OTch=China; OTot=Others. Sources: Author's calculations from plant-level data underlying National Statistical Office (forthcoming).
41

Appendix Table 2a: Estimates of Value Added in Thai Manufacturing by Foreign Ownership Share or Foreign Nationality and Industry, 1996 (billion baht)Na- Industrial Census
tional Sample plantsac- Publi- All Foreign Foreign, by nationality Foreign, by ownership
Industry counts cation plants total EU US JP N3 N3si N3tw N3kr OT OTch OTot MN MJ WHManufacturing 1,386 998.11 854.70 441.55 34.36 46.72 256.73 54.34 9.12 37.24 7.98 49.40 13.29 36.10 271.17 79.26 91.12 Food 107.95 113.56 98.86 24.66 2.25 3.09 10.83 2.93 0.55 1.94 0.43 5.57 1.68 3.89 18.81 3.56 2.29 Textiles 92.65 46.47 35.32 20.27 0.18 1.47 11.07 3.51 0.09 2.41 1.01 4.05 1.98 2.07 16.33 2.20 1.74 Apparel 161.44 23.94 19.69 6.75 0.27 0.10 2.36 1.40 0.41 0.95 0.04 2.63 0.39 2.23 6.23 0.33 0.19 Leather & footwear 44.04 15.75 9.96 2.53 0.12 0.21 0.73 1.11 0.00 0.39 0.72 0.36 0.01 0.35 1.34 0.95 0.24 Chemicals & products 47.97 58.88 53.29 30.82 3.70 5.36 15.67 2.85 1.60 1.08 0.17 3.22 0.75 2.47 11.86 13.32 5.63 Rubber products 22.42 36.04 33.33 15.83 5.08 0.77 4.23 3.29 2.56 0.69 0.04 2.46 0.37 2.09 5.81 8.69 1.33 Plastics & products 14.16 27.04 19.81 7.17 0.08 0.02 3.65 0.90 0.18 0.49 0.24 2.53 0.38 2.15 3.97 1.86 1.34 Non-metallic mineral products 74.42 65.02 40.60 9.66 0.80 1.02 1.89 3.86 0.25 3.57 0.03 2.09 1.79 0.30 7.08 2.27 0.31 Metal products 37.88 35.21 28.80 17.33 0.32 0.36 8.43 3.23 0.53 2.31 0.39 4.98 2.98 2.00 13.30 1.75 2.28 General machinery 55.79 38.51 33.66 24.37 0.63 0.13 19.30 3.21 1.13 1.34 0.73 1.09 0.02 1.08 8.68 4.58 11.10 Electric machinery, etc. 180.04 127.99 111.64 99.99 4.49 13.56 52.53 22.00 1.37 18.26 2.37 7.42 0.10 7.32 23.74 16.00 60.25 Office & computing machinery 51.64 28.02 24.13 24.04 0.00 8.06 1.60 13.62 0.11 12.96 0.55 0.76 0.00 0.76 3.72 1.94 18.38 Miscellaneous electric machinery 19.55 40.07 32.76 27.89 0.57 3.30 18.92 4.73 0.10 4.45 0.18 0.36 0.00 0.36 11.21 3.42 13.25 Radio, TV, communication 92.51 47.98 43.55 38.00 3.61 1.97 23.03 3.61 1.16 0.81 1.64 5.77 0.10 5.67 8.38 10.12 19.50 Precision machinery 16.34 11.92 11.19 10.07 0.30 0.22 8.98 0.04 0.00 0.04 0.00 0.52 0.00 0.52 0.42 0.53 9.12 Motor vehicles 104.16 139.67 130.56 115.68 0.02 0.34 113.55 0.12 0.00 0.11 0.01 1.65 0.01 1.64 104.47 9.63 1.57 Furniture 36.18 14.42 11.41 2.81 0.03 0.11 0.55 1.31 0.01 0.78 0.52 0.81 0.13 0.67 1.71 0.81 0.30 Jewelry 98.03 9.18 8.15 4.10 0.95 0.54 0.20 0.18 0.09 0.05 0.05 2.23 0.01 2.22 1.79 1.02 1.29 Other manufacturing industries 308.55 246.42 219.62 59.57 15.44 19.65 11.73 4.42 0.34 2.84 1.24 8.32 2.70 5.62 46.03 12.29 1.25 Beverages 86.38 69.67 61.75 13.59 0.00 9.31 0.00 0.09 0.09 0.00 0.00 4.18 0.00 4.18 13.58 0.01 0.00 Tobacco 29.55 30.67 28.64 0.39 0.20 0.00 0.00 0.00 0.00 0.00 0.00 0.19 0.19 0.00 0.20 0.00 0.19 Wood products 8.87 14.98 13.59 3.09 1.07 0.00 0.37 0.10 0.06 0.04 0.00 1.54 1.35 0.19 3.01 0.08 0.00 Paper products 22.68 32.12 27.64 16.12 12.39 0.13 2.36 0.61 0.00 0.49 0.12 0.64 0.35 0.29 15.92 0.20 0.01 Printing & publishing 15.89 30.09 26.82 3.63 0.98 2.00 0.48 0.01 0.01 0.00 0.00 0.16 0.00 0.16 3.58 0.04 0.00 Oil, coal, nuclear, etc. 104.90 33.04 31.34 8.36 0.13 7.40 0.64 0.08 0.00 0.00 0.08 0.10 0.00 0.10 0.96 7.40 0.00 Basic metals 20.74 17.82 15.82 7.31 0.61 0.58 4.34 1.41 0.00 1.29 0.12 0.37 0.06 0.31 4.95 2.28 0.09 Misc. transportation machinery 15.86 6.67 5.40 2.41 0.03 0.00 1.43 0.23 0.18 0.05 0.00 0.72 0.70 0.02 2.36 0.03 0.02 Other misc. manufacturing 3.67 11.36 8.63 4.67 0.03 0.23 2.11 1.89 0.00 0.97 0.91 0.41 0.06 0.35 1.47 2.25 0.94Notes: EU=Europe; US=United States; JP=Japan; N3=N3si+N3tw+N3kr; N3si=Singapore, N3tw=Taiwan, KR=Korea; OT=OTch+OTot; OTch=China; OTot=Others. WH=wholly foreign, MJ.=50-99% foreign-owned; MN=1-49% foreign owned; .Sources: National Statistical Office (1999) and author's calculations from plant-level data underlying this publication; National Economic and Social Development Board (2001
42

Appendix Table 2b: Estimates of Value Added in Thai Manufacturing by Foreign Ownership Share or Foreign Nationality and Industry, 1998 (million baht)Na- Industrial Survey
tional Sample plantsac- Publi- All Foreign Foreign, by nationality
Industry counts cation plants total EU US JP N3 N3si N3tw N3kr OT OTch OTotManufacturing 1,451 653.24 427.97 253.17 19.03 25.94 136.32 31.40 6.52 20.58 4.30 40.49 4.61 35.88 Food 140.75 92.46 61.47 18.87 1.43 1.98 8.16 3.07 1.04 1.99 0.05 4.22 0.43 3.79 Textiles 106.25 44.71 22.80 10.21 0.99 0.32 3.52 2.21 0.00 2.03 0.18 3.16 0.32 2.83 Apparel 167.24 21.51 10.90 6.97 2.35 0.00 0.70 0.77 0.00 0.77 0.00 3.15 1.66 1.49 Leather & footwear 52.06 14.36 11.86 1.58 0.00 0.26 0.15 0.52 0.00 0.33 0.19 0.65 0.06 0.59 Chemicals & products 61.23 28.62 27.35 15.64 4.90 1.86 5.00 1.80 0.82 0.98 0.00 2.07 0.16 1.92 Rubber products 28.49 23.16 18.11 11.10 0.54 3.11 4.00 1.95 0.14 1.80 0.02 1.49 0.12 1.37 Plastics & products 16.40 23.13 10.31 3.60 0.17 0.02 1.78 0.90 0.19 0.63 0.09 0.73 0.55 0.18 Non-metallic mineral products 58.56 57.35 35.39 21.40 4.70 5.94 7.60 1.63 0.14 1.49 0.00 1.52 0.09 1.43 Metal products 41.82 21.29 12.60 6.34 0.08 0.01 4.40 1.24 0.28 0.96 0.00 0.62 0.57 0.05 General machinery 48.08 34.98 33.23 30.57 0.47 0.29 27.08 1.04 0.12 0.20 0.71 1.70 0.03 1.66 Electric machinery, etc. 218.11 85.61 61.58 57.14 1.68 8.76 29.79 13.26 2.95 7.99 2.31 3.66 0.04 3.62 Office & computing machinery 82.16 20.34 14.68 14.49 0.00 5.87 3.73 4.84 0.48 4.36 0.00 0.05 0.00 0.05 Miscellaneous electric machinery 24.68 18.87 16.87 14.97 1.67 0.37 6.93 3.62 1.64 1.98 0.00 2.37 0.04 2.33 Radio, TV, communication 93.58 42.35 26.66 25.38 0.00 2.42 17.12 4.60 0.83 1.46 2.31 1.23 0.00 1.23 Precision machinery 17.68 4.05 3.38 2.29 0.01 0.09 2.00 0.19 0.00 0.19 0.00 0.00 0.00 0.00 Motor vehicles 27.88 72.28 35.87 33.34 0.04 0.02 32.93 0.27 0.20 0.07 0.00 0.08 0.01 0.07 Furniture 21.10 9.15 4.46 0.56 0.02 0.02 0.30 0.21 0.00 0.21 0.00 0.01 0.00 0.01 Jewelry 85.68 4.47 2.03 0.90 0.09 0.37 0.06 0.00 0.00 0.00 0.00 0.38 0.10 0.29 Other manufacturing industries 377.64 120.14 80.00 34.94 1.56 2.97 10.84 2.52 0.63 1.13 0.76 17.05 0.47 16.58 Beverages 109.38 69.94 39.45 18.47 0.00 2.59 0.07 0.49 0.49 0.00 0.00 15.32 0.00 15.32 Tobacco 34.67 0.69 0.45 0.10 0.00 0.10 0.00 0.00 0.00 0.00 0.00 0.00 0.00 0.00 Wood products 5.90 5.50 4.71 0.60 0.11 0.01 0.25 0.16 0.04 0.12 0.00 0.07 0.04 0.03 Paper products 31.93 11.70 10.21 3.05 0.00 0.16 1.50 0.42 0.00 0.41 0.01 0.97 0.08 0.90 Printing & publishing 14.77 8.23 3.04 0.19 0.05 0.05 0.02 0.07 0.02 0.04 0.00 0.00 0.00 0.00 Oil, coal, nuclear, etc. 149.39 1.16 0.96 0.08 0.00 0.00 0.08 0.00 0.00 0.00 0.00 0.00 0.00 0.00 Basic metals 16.37 9.97 10.50 3.89 0.40 0.02 3.06 0.10 0.08 0.02 0.00 0.31 0.07 0.25 Misc. transportation machinery 10.78 3.99 1.32 1.00 0.09 0.00 0.90 0.00 0.00 0.00 0.00 0.00 0.00 0.00 Other misc. manufacturing 4.45 11.77 9.37 7.57 0.91 0.03 4.97 1.29 0.00 0.54 0.76 0.36 0.28 0.08Notes: EU=Europe; US=United States; JP=Japan; N3=N3si+N3tw+N3kr; N3si=Singapore, N3tw=Taiwan, KR=Korea; OT=OTch+OTot; OTch=China; OTot=Others. Sources: National Statistical Office (2001a) and author's calculations from plant-level data underlying this publication; National Economic and Social Development Board (200
43

Appendix Table 2c: Estimates of Value Added in Thai Manufacturing by Foreign Ownership Share or Foreign Nationality and Industry, 2000 (million baht)Na- Manufacturing Industry Survey
tional Sample plantsac- Publi- All Foreign Foreign, by nationality
Industry counts cation plants total EU US JP N3 N3si N3tw N3kr OT OTch OTotManufacturing 1,577 766.83 234.48 111.10 30.58 8.73 51.42 11.56 4.27 6.55 0.74 8.82 0.99 7.83 Food 145.03 - 30.82 9.21 0.91 0.26 4.50 1.49 0.99 0.49 0.02 2.05 0.12 1.93 Textiles 105.84 58.32 10.71 4.26 0.04 0.06 1.20 0.97 0.00 0.97 0.00 1.99 0.11 1.88 Apparel 161.90 21.70 2.62 0.81 0.00 0.10 0.31 0.03 0.00 0.03 0.00 0.37 0.11 0.26 Leather & footwear 60.29 14.73 3.28 0.50 0.00 0.00 0.10 0.36 0.00 0.19 0.17 0.04 0.00 0.04 Chemicals & products 85.49 47.00 10.78 5.24 2.89 0.39 1.39 0.09 0.04 0.05 0.00 0.48 0.00 0.48 Rubber products - - 7.67 4.47 2.01 1.22 0.43 0.45 0.08 0.36 0.00 0.37 0.11 0.26 Plastics & products - - 3.47 1.34 0.19 0.00 0.41 0.08 0.00 0.08 0.00 0.67 0.07 0.60 Non-metallic mineral products 65.01 48.69 12.43 3.70 2.30 0.11 0.64 0.59 0.10 0.48 0.00 0.06 0.00 0.06 Metal products 48.40 31.91 7.53 4.24 1.16 0.00 1.49 1.30 0.48 0.82 0.00 0.29 0.03 0.26 General machinery - 28.99 10.78 9.18 0.14 0.00 8.91 0.09 0.02 0.07 0.00 0.06 0.03 0.02 Electric machinery, etc. - 159.22 43.67 38.89 9.76 0.88 23.51 4.17 2.52 1.61 0.04 0.58 0.00 0.58 Office & computing machinery - 41.93 13.35 13.22 8.77 0.30 4.04 0.05 0.00 0.05 0.00 0.07 0.00 0.07 Miscellaneous electric machinery - 38.68 8.89 6.92 0.19 0.58 4.16 2.00 1.27 0.70 0.03 0.00 0.00 0.00 Radio, TV, communication - 72.90 18.82 17.15 0.00 0.00 14.55 2.09 1.25 0.85 0.00 0.51 0.00 0.51 Precision machinery - 5.71 2.61 1.59 0.80 0.00 0.76 0.03 0.00 0.02 0.01 0.00 0.00 0.00 Motor vehicles - 49.93 8.05 7.36 0.86 0.02 6.34 0.13 0.02 0.11 0.00 0.01 0.00 0.01 Furniture - - 3.30 0.91 0.00 0.14 0.38 0.32 0.00 0.32 0.00 0.08 0.06 0.01 Jewelry - - 2.05 1.50 0.77 0.00 0.14 0.47 0.00 0.22 0.26 0.11 0.05 0.06 Other manufacturing industries - - 77.31 19.48 9.57 5.55 1.68 1.02 0.01 0.75 0.26 1.67 0.30 1.37 Beverages 70.39 - 15.29 13.04 8.02 4.99 0.03 0.00 0.00 0.00 0.00 0.00 0.00 0.00 Tobacco 32.07 32.92 38.91 1.00 0.92 0.06 0.00 0.00 0.00 0.00 0.00 0.03 0.00 0.03 Wood products 7.40 8.91 2.63 0.21 0.00 0.00 0.08 0.12 0.00 0.02 0.11 0.01 0.01 0.00 Paper products 33.97 22.48 9.53 1.12 0.01 0.00 0.23 0.24 0.00 0.24 0.00 0.64 0.00 0.64 Printing & publishing 15.22 13.67 2.23 0.50 0.00 0.03 0.02 0.06 0.01 0.05 0.00 0.38 0.00 0.38 Oil, coal, nuclear, etc. 121.48 29.13 1.28 0.21 0.20 0.00 0.00 0.00 0.00 0.00 0.00 0.01 0.00 0.01 Basic metals 15.95 17.57 2.96 0.97 0.13 0.31 0.52 0.00 0.00 0.00 0.00 0.01 0.01 0.01 Misc. transportation machinery - 4.71 1.40 0.79 0.01 0.00 0.49 0.00 0.00 0.00 0.00 0.29 0.00 0.29 Other misc. manufacturing - 28.13 3.08 1.64 0.28 0.16 0.32 0.60 0.00 0.44 0.16 0.29 0.28 0.01Notes: EU=Europe; US=United States; JP=Japan; N3=N3si+N3tw+N3kr; N3si=Singapore, N3tw=Taiwan, KR=Korea; OT=OTch+OTot; OTch=China; OTot=Others. Sources: National Statistical Office (forthcoming) and author's calculations from plant-level data underlying this publication; National Economic and Social Development Board
44

Appendix Table 2d: Estimates of Value Added in Large Sample Plants by Foreign Ownership Share or Foreign Nationality and Industry, 1996 (billion baht)Publi- All Foreign Foreign, by nationality Foreign, by ownership
Industry cation plants total EU US JP N3 N3si N3tw N3kr OT OTch OTot MN MJ WHManufacturing 998.11 834.18 439.83 34.22 46.66 256.30 53.62 9.05 36.67 7.89 49.03 13.16 35.87 270.03 78.94 90.86 Food 113.56 96.65 24.56 2.25 3.09 10.78 2.90 0.55 1.92 0.43 5.55 1.68 3.87 18.75 3.53 2.28 Textiles 46.47 33.91 20.14 0.17 1.47 11.05 3.44 0.08 2.35 1.01 4.01 1.96 2.05 16.22 2.19 1.73 Apparel 23.94 18.08 6.55 0.24 0.09 2.32 1.36 0.40 0.93 0.03 2.53 0.36 2.17 6.08 0.29 0.18 Leather & footwear 15.75 9.28 2.49 0.12 0.21 0.73 1.09 0.00 0.38 0.71 0.34 0.00 0.34 1.31 0.94 0.24 Chemicals & products 58.88 52.66 30.73 3.70 5.35 15.66 2.80 1.60 1.04 0.16 3.21 0.74 2.47 11.79 13.31 5.63 Rubber products 36.04 33.05 15.80 5.08 0.77 4.23 3.28 2.56 0.68 0.04 2.45 0.37 2.09 5.79 8.68 1.33 Plastics & products 27.04 18.56 7.04 0.07 0.01 3.61 0.83 0.18 0.41 0.24 2.51 0.37 2.15 3.89 1.84 1.31 Non-metallic mineral products 65.02 38.46 9.58 0.80 1.02 1.89 3.81 0.25 3.56 0.00 2.06 1.77 0.28 7.03 2.23 0.31 Metal products 35.21 26.88 17.22 0.32 0.35 8.40 3.18 0.53 2.26 0.39 4.97 2.97 2.00 13.23 1.74 2.25 General machinery 38.51 32.66 24.24 0.62 0.13 19.24 3.17 1.13 1.31 0.73 1.08 0.01 1.06 8.58 4.56 11.10 Electric machinery, etc. 127.99 110.77 99.80 4.48 13.55 52.45 21.92 1.37 18.19 2.36 7.41 0.10 7.31 23.62 15.98 60.20 Office & computing machinery 28.02 24.10 24.01 0.00 8.05 1.60 13.60 0.11 12.94 0.55 0.76 0.00 0.76 3.72 1.94 18.35 Miscellaneous electric machinery 40.07 32.28 27.83 0.57 3.30 18.89 4.71 0.10 4.42 0.18 0.36 0.00 0.36 11.17 3.42 13.24 Radio, TV, communication 47.98 43.39 37.93 3.61 1.97 23.00 3.57 1.15 0.78 1.63 5.77 0.10 5.67 8.34 10.10 19.49 Precision machinery 11.92 11.01 10.03 0.29 0.22 8.96 0.04 0.00 0.04 0.00 0.52 0.00 0.52 0.39 0.52 9.12 Motor vehicles 139.67 129.32 115.64 0.02 0.34 113.52 0.12 0.00 0.11 0.01 1.64 0.01 1.63 104.43 9.63 1.57 Furniture 14.42 10.40 2.78 0.03 0.11 0.55 1.29 0.00 0.77 0.52 0.80 0.12 0.67 1.68 0.80 0.30 Jewelry 9.18 7.79 4.00 0.89 0.53 0.20 0.17 0.08 0.05 0.05 2.21 0.01 2.20 1.76 0.99 1.25 Other manufacturing industries 246.42 215.71 59.26 15.42 19.65 11.67 4.26 0.33 2.70 1.23 8.27 2.69 5.58 45.84 12.23 1.19 Beverages 69.67 61.59 13.59 0.00 9.31 0.00 0.09 0.09 0.00 0.00 4.18 0.00 4.18 13.58 0.01 0.00 Tobacco 30.67 28.53 0.39 0.20 0.00 0.00 0.00 0.00 0.00 0.00 0.19 0.19 0.00 0.20 0.00 0.19 Wood products 14.98 12.53 3.04 1.07 0.00 0.37 0.08 0.06 0.01 0.00 1.52 1.35 0.18 2.98 0.06 0.00 Paper products 32.12 27.18 16.06 12.39 0.13 2.36 0.55 0.00 0.43 0.12 0.63 0.34 0.29 15.87 0.18 0.00 Printing & publishing 30.09 25.91 3.62 0.98 2.00 0.48 0.01 0.01 0.00 0.00 0.16 0.00 0.16 3.58 0.04 0.00 Oil, coal, nuclear, etc. 33.04 31.33 8.36 0.13 7.40 0.64 0.08 0.00 0.00 0.08 0.10 0.00 0.10 0.96 7.40 0.00 Basic metals 17.82 15.48 7.26 0.60 0.58 4.31 1.40 0.00 1.28 0.11 0.37 0.06 0.31 4.92 2.26 0.08 Misc. transportation machinery 6.67 5.14 2.39 0.02 0.00 1.43 0.22 0.17 0.05 0.00 0.71 0.70 0.01 2.34 0.03 0.02 Other misc. manufacturing 11.36 8.02 4.55 0.03 0.23 2.07 1.83 0.00 0.92 0.91 0.39 0.05 0.34 1.41 2.23 0.91Notes: EU=Europe; US=United States; JP=Japan; N3=N3si+N3tw+N3kr; N3si=Singapore, N3tw=Taiwan, KR=Korea; OT=OTch+OTot; OTch=China; OTot=Others. WH=wholly foreign, MJ.=50-99% foreign-owned; MN=1-49% foreign owned; .Sources: Author's calculations from plant-level data underlying National Statistical Office (1999).
45
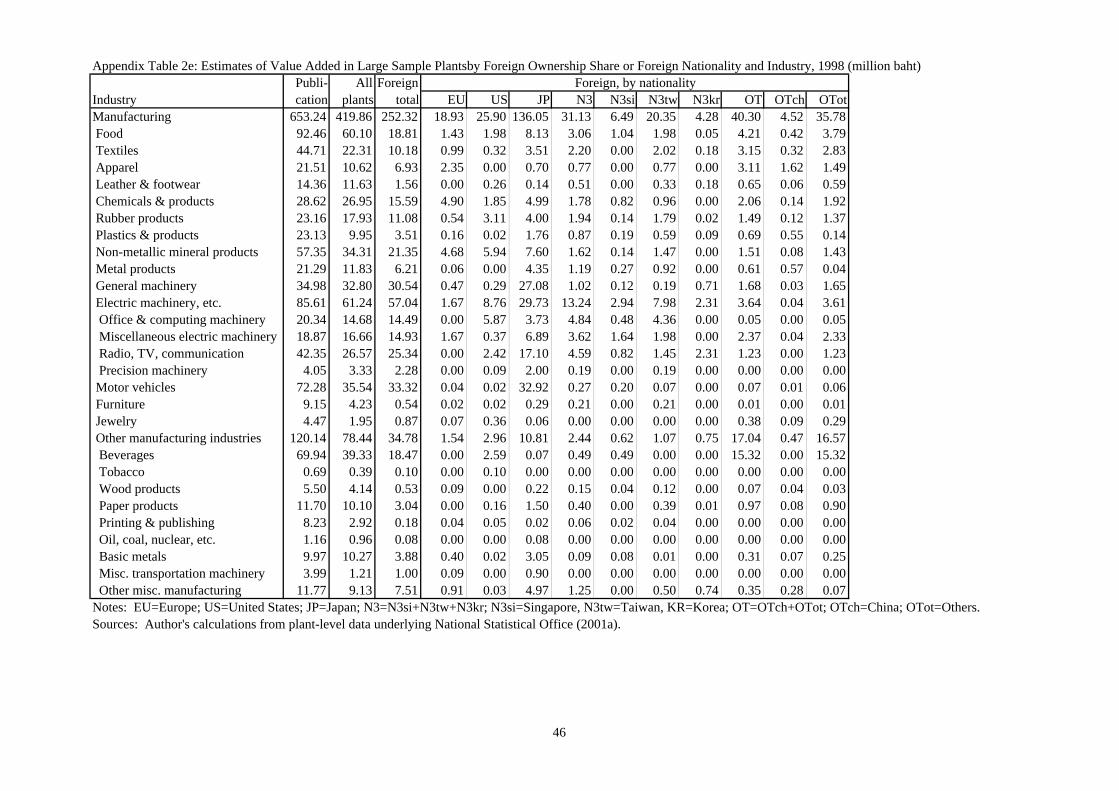
Appendix Table 2e: Estimates of Value Added in Large Sample Plantsby Foreign Ownership Share or Foreign Nationality and Industry, 1998 (million baht)Publi- All Foreign Foreign, by nationality
Industry cation plants total EU US JP N3 N3si N3tw N3kr OT OTch OTotManufacturing 653.24 419.86 252.32 18.93 25.90 136.05 31.13 6.49 20.35 4.28 40.30 4.52 35.78 Food 92.46 60.10 18.81 1.43 1.98 8.13 3.06 1.04 1.98 0.05 4.21 0.42 3.79 Textiles 44.71 22.31 10.18 0.99 0.32 3.51 2.20 0.00 2.02 0.18 3.15 0.32 2.83 Apparel 21.51 10.62 6.93 2.35 0.00 0.70 0.77 0.00 0.77 0.00 3.11 1.62 1.49 Leather & footwear 14.36 11.63 1.56 0.00 0.26 0.14 0.51 0.00 0.33 0.18 0.65 0.06 0.59 Chemicals & products 28.62 26.95 15.59 4.90 1.85 4.99 1.78 0.82 0.96 0.00 2.06 0.14 1.92 Rubber products 23.16 17.93 11.08 0.54 3.11 4.00 1.94 0.14 1.79 0.02 1.49 0.12 1.37 Plastics & products 23.13 9.95 3.51 0.16 0.02 1.76 0.87 0.19 0.59 0.09 0.69 0.55 0.14 Non-metallic mineral products 57.35 34.31 21.35 4.68 5.94 7.60 1.62 0.14 1.47 0.00 1.51 0.08 1.43 Metal products 21.29 11.83 6.21 0.06 0.00 4.35 1.19 0.27 0.92 0.00 0.61 0.57 0.04 General machinery 34.98 32.80 30.54 0.47 0.29 27.08 1.02 0.12 0.19 0.71 1.68 0.03 1.65 Electric machinery, etc. 85.61 61.24 57.04 1.67 8.76 29.73 13.24 2.94 7.98 2.31 3.64 0.04 3.61 Office & computing machinery 20.34 14.68 14.49 0.00 5.87 3.73 4.84 0.48 4.36 0.00 0.05 0.00 0.05 Miscellaneous electric machinery 18.87 16.66 14.93 1.67 0.37 6.89 3.62 1.64 1.98 0.00 2.37 0.04 2.33 Radio, TV, communication 42.35 26.57 25.34 0.00 2.42 17.10 4.59 0.82 1.45 2.31 1.23 0.00 1.23 Precision machinery 4.05 3.33 2.28 0.00 0.09 2.00 0.19 0.00 0.19 0.00 0.00 0.00 0.00 Motor vehicles 72.28 35.54 33.32 0.04 0.02 32.92 0.27 0.20 0.07 0.00 0.07 0.01 0.06 Furniture 9.15 4.23 0.54 0.02 0.02 0.29 0.21 0.00 0.21 0.00 0.01 0.00 0.01 Jewelry 4.47 1.95 0.87 0.07 0.36 0.06 0.00 0.00 0.00 0.00 0.38 0.09 0.29 Other manufacturing industries 120.14 78.44 34.78 1.54 2.96 10.81 2.44 0.62 1.07 0.75 17.04 0.47 16.57 Beverages 69.94 39.33 18.47 0.00 2.59 0.07 0.49 0.49 0.00 0.00 15.32 0.00 15.32 Tobacco 0.69 0.39 0.10 0.00 0.10 0.00 0.00 0.00 0.00 0.00 0.00 0.00 0.00 Wood products 5.50 4.14 0.53 0.09 0.00 0.22 0.15 0.04 0.12 0.00 0.07 0.04 0.03 Paper products 11.70 10.10 3.04 0.00 0.16 1.50 0.40 0.00 0.39 0.01 0.97 0.08 0.90 Printing & publishing 8.23 2.92 0.18 0.04 0.05 0.02 0.06 0.02 0.04 0.00 0.00 0.00 0.00 Oil, coal, nuclear, etc. 1.16 0.96 0.08 0.00 0.00 0.08 0.00 0.00 0.00 0.00 0.00 0.00 0.00 Basic metals 9.97 10.27 3.88 0.40 0.02 3.05 0.09 0.08 0.01 0.00 0.31 0.07 0.25 Misc. transportation machinery 3.99 1.21 1.00 0.09 0.00 0.90 0.00 0.00 0.00 0.00 0.00 0.00 0.00 Other misc. manufacturing 11.77 9.13 7.51 0.91 0.03 4.97 1.25 0.00 0.50 0.74 0.35 0.28 0.07Notes: EU=Europe; US=United States; JP=Japan; N3=N3si+N3tw+N3kr; N3si=Singapore, N3tw=Taiwan, KR=Korea; OT=OTch+OTot; OTch=China; OTot=Others. Sources: Author's calculations from plant-level data underlying National Statistical Office (2001a).
46

Appendix Table 2f: Estimates of Value Added in Large Sample Plants by Foreign Ownership Share or Foreign Nationality and Industry, 2000 (million baht)Publi- All Foreign Foreign, by nationality
Industry cation plants total EU US JP N3 N3si N3tw N3kr OT OTch OTotManufacturing 766.83 230.38 110.85 30.55 8.73 51.35 11.46 4.26 6.48 0.73 8.76 0.97 7.78 Food - 29.99 9.20 0.91 0.26 4.50 1.48 0.98 0.49 0.02 2.05 0.12 1.93 Textiles 58.32 10.45 4.25 0.04 0.06 1.20 0.96 0.00 0.96 0.00 1.99 0.11 1.88 Apparel 21.70 2.51 0.81 0.00 0.10 0.31 0.03 0.00 0.03 0.00 0.37 0.11 0.26 Leather & footwear 14.73 3.13 0.50 0.00 0.00 0.10 0.36 0.00 0.19 0.17 0.04 0.00 0.04 Chemicals & products 47.00 10.69 5.23 2.89 0.39 1.39 0.09 0.04 0.05 0.00 0.48 0.00 0.48 Rubber products - 7.59 4.47 2.01 1.22 0.43 0.45 0.08 0.36 0.00 0.37 0.11 0.26 Plastics & products - 3.33 1.32 0.19 0.00 0.40 0.08 0.00 0.08 0.00 0.66 0.06 0.60 Non-metallic mineral products 48.69 12.09 3.68 2.30 0.11 0.64 0.59 0.10 0.48 0.00 0.05 0.00 0.05 Metal products 31.91 7.07 4.22 1.16 0.00 1.48 1.29 0.48 0.81 0.00 0.28 0.03 0.26 General machinery 28.99 10.62 9.17 0.14 0.00 8.90 0.08 0.02 0.06 0.00 0.06 0.03 0.02 Electric machinery, etc. 159.22 43.54 38.87 9.76 0.88 23.50 4.17 2.52 1.61 0.04 0.57 0.00 0.57 Office & computing machinery 41.93 13.35 13.22 8.77 0.30 4.04 0.05 0.00 0.05 0.00 0.07 0.00 0.07 Miscellaneous electric machinery 38.68 8.84 6.92 0.19 0.58 4.16 2.00 1.27 0.70 0.03 0.00 0.00 0.00 Radio, TV, communication 72.90 18.81 17.14 0.00 0.00 14.55 2.09 1.25 0.85 0.00 0.50 0.00 0.50 Precision machinery 5.71 2.54 1.58 0.80 0.00 0.75 0.03 0.00 0.02 0.01 0.00 0.00 0.00 Motor vehicles 49.93 7.89 7.35 0.86 0.02 6.33 0.13 0.02 0.11 0.00 0.01 0.00 0.01 Furniture - 3.11 0.91 0.00 0.14 0.38 0.31 0.00 0.31 0.00 0.08 0.06 0.01 Jewelry - 1.98 1.46 0.74 0.00 0.14 0.47 0.00 0.21 0.26 0.11 0.05 0.06 Other manufacturing industries - 76.39 19.40 9.57 5.55 1.66 0.98 0.01 0.72 0.25 1.65 0.30 1.35 Beverages - 15.15 13.04 8.02 4.99 0.03 0.00 0.00 0.00 0.00 0.00 0.00 0.00 Tobacco 32.92 38.88 1.00 0.92 0.06 0.00 0.00 0.00 0.00 0.00 0.03 0.00 0.03 Wood products 8.91 2.44 0.20 0.00 0.00 0.07 0.12 0.00 0.02 0.11 0.01 0.01 0.00 Paper products 22.48 9.45 1.10 0.01 0.00 0.23 0.22 0.00 0.22 0.00 0.64 0.00 0.64 Printing & publishing 13.67 2.07 0.50 0.00 0.03 0.02 0.06 0.01 0.05 0.00 0.38 0.00 0.38 Oil, coal, nuclear, etc. 29.13 1.28 0.21 0.20 0.00 0.00 0.00 0.00 0.00 0.00 0.01 0.00 0.01 Basic metals 17.57 2.83 0.96 0.13 0.31 0.51 0.00 0.00 0.00 0.00 0.01 0.01 0.01 Misc. transportation machinery 4.71 1.36 0.79 0.01 0.00 0.49 0.00 0.00 0.00 0.00 0.29 0.00 0.29 Other misc. manufacturing 28.13 2.93 1.60 0.28 0.16 0.32 0.57 0.00 0.43 0.14 0.28 0.28 0.00Notes: EU=Europe; US=United States; JP=Japan; N3=N3si+N3tw+N3kr; N3si=Singapore, N3tw=Taiwan, KR=Korea; OT=OTch+OTot; OTch=China; OTot=Others. Sources: Author's calculations from plant-level data underlying National Statistical Office (forthcoming).
47

Appendix Table 3: Estimates of Value Added per Hour (dependent variable = ln(V/E)), 1996All plants Large plants with Output >=25 million baht
Indepen- Equation 1 Equation 2 Equation 3 Equation 4 Equation 1 Equation 2 Equation 3 Equation 4dent Coeffi- Sig- Coeffi- Sig- Coeffi- Sig- Coeffi- Sig- Coeffi- Sig- Coeffi- Sig- Coeffi- Sig- Coeffi- Sig-Variables, cients, nifi- cients, nifi- cients, nifi- cients, nifi- cients, nifi- cients, nifi- cients, nifi- cients, nifi-Indicator etc. cance etc. cance etc. cance etc. cance etc. cance etc. cance etc. cance etc. cance
FOODConstant 2.963 0.00 2.959 0.00 2.957 0.00 2.961 0.00 3.011 0.00 3.010 0.00 3.006 0.00 3.008 0.00ln(EN/E) 0.128 0.00 0.127 0.00 0.126 0.00 0.128 0.00 0.103 0.03 0.101 0.04 0.098 0.04 0.104 0.03ln(K/E) 0.321 0.00 0.321 0.00 0.321 0.00 0.321 0.00 0.379 0.00 0.377 0.00 0.377 0.00 0.380 0.00Df -0.145 0.18 - - - - - - -0.279 0.02 - - - - - - Dftr - - -0.104 0.43 - - - - - - -0.203 0.14 - - - - Dfeu - - - - 0.016 0.95 - - - - - - -0.193 0.43 - - Dfus - - - - 0.381 0.23 - - - - - - 0.276 0.37 - - Dfjp - - - - -0.256 0.10 - - - - - - -0.339 0.04 - - Dfn3 - - -0.118 0.60 -0.123 0.58 - - - - -0.346 0.18 -0.351 0.17 - - Dfot - - -0.123 0.61 -0.123 0.61 - - - - -0.214 0.41 -0.215 0.40 - - Dfmn - - - - - - -0.143 0.24 - - - - - - -0.304 0.03Dfmj - - - - - - -0.101 0.67 - - - - - - -0.066 0.81Dfwh - - - - - - -0.228 0.45 - - - - - - -0.409 0.23Dboi 0.027 0.81 0.016 0.88 0.028 0.79 0.026 0.82 -0.105 0.37 -0.117 0.32 -0.107 0.36 -0.109 0.39Dold 0.113 0.10 0.114 0.11 0.110 0.11 0.113 0.11 0.191 0.05 0.187 0.06 0.182 0.06 0.191 0.05Dlarge 0.549 0.00 0.542 0.00 0.529 0.00 0.550 0.00 0.427 0.01 0.406 0.02 0.407 0.02 0.423 0.02F-test 44.75 0.00 33.40 0.00 27.10 0.00 33.53 0.00 21.65 0.00 16.05 0.00 13.11 0.00 16.32 0.00White 34.36 0.06 63.62 0.00 66.50 0.03 42.34 0.18 38.14 0.02 65.25 0.00 69.78 0.02 43.32 0.16Adj. R-sq. 0.150 - 0.149 - 0.150 - 0.149 - 0.128 - 0.125 - 0.126 - 0.127 - Obs. 1,483 - 1,483 - 1,483 - 1,483 - 844 - 844 - 844 - 844 -
TEXTILESConstant 3.303 0.00 3.308 0.00 3.299 0.00 3.324 0.00 3.954 0.00 3.984 0.00 3.966 0.00 3.970 0.00ln(EN/E) 0.204 0.00 0.203 0.00 0.201 0.00 0.210 0.00 0.177 0.01 0.181 0.01 0.177 0.01 0.185 0.01ln(K/E) 0.200 0.00 0.196 0.00 0.197 0.00 0.200 0.00 0.015 0.77 0.008 0.88 0.008 0.88 0.016 0.75Df 0.090 0.47 - - - - - - 0.175 0.25 - - - - - - Dftr - - 0.440 0.02 - - - - - - 0.506 0.01 - - - - Dfeu - - - - 0.745 0.00 - - - - - - 0.825 0.12 - - Dfus - - - - 1.233 0.02 - - - - - - 1.293 0.02 - - Dfjp - - - - 0.304 0.14 - - - - - - 0.385 0.08 - - Dfn3 - - 0.076 0.70 0.076 0.70 - - - - 0.076 0.72 0.081 0.70 - - Dfot - - -0.303 0.41 -0.311 0.40 - - - - -0.114 0.72 -0.121 0.71 - - Dfmn - - - - - - -0.068 0.61 - - - - - - 0.006 0.97Dfmj - - - - - - 0.675 0.01 - - - - - - 0.790 0.01Dfwh - - - - - - 0.877 0.00 - - - - - - 0.809 0.05Dboi -0.196 0.23 -0.317 0.07 -0.319 0.07 -0.320 0.06 -0.157 0.37 -0.272 0.14 -0.277 0.14 -0.262 0.14Dold 0.045 0.60 0.052 0.55 0.063 0.46 0.049 0.57 -0.113 0.37 -0.106 0.41 -0.086 0.50 -0.107 0.40Dlarge 0.170 0.51 0.184 0.45 0.203 0.41 0.270 0.28 0.488 0.07 0.494 0.07 0.498 0.07 0.632 0.02F-test 18.44 0.00 14.85 0.00 12.27 0.00 15.50 0.00 2.02 0.06 2.21 0.03 2.09 0.02 2.67 0.01White 58.05 0.00 86.37 0.00 90.67 0.00 61.91 0.00 27.55 0.23 36.48 0.40 40.39 0.63 29.63 0.64Adj. R-sq. 0.128 - 0.134 - 0.136 - 0.140 - 0.017 - 0.026 - 0.029 - 0.036 - Obs. 716 - 716 - 716 - 716 - 364 - 364 - 364 - 364 -
48

Appendix Table 3 (continued, 2/7)All plants Large plants with Output >=25 million baht
Indepen- Equation 1 Equation 2 Equation 3 Equation 4 Equation 1 Equation 2 Equation 3 Equation 4dent Coeffi- Sig- Coeffi- Sig- Coeffi- Sig- Coeffi- Sig- Coeffi- Sig- Coeffi- Sig- Coeffi- Sig- Coeffi- Sig-Variables, cients, nifi- cients, nifi- cients, nifi- cients, nifi- cients, nifi- cients, nifi- cients, nifi- cients, nifi-Indicator etc. cance etc. cance etc. cance etc. cance etc. cance etc. cance etc. cance etc. cance
APPARELConstant 3.663 0.00 3.670 0.00 3.668 0.00 3.664 0.00 3.901 0.00 3.926 0.00 3.930 0.00 3.906 0.00ln(EN/E) 0.132 0.00 0.134 0.00 0.134 0.00 0.132 0.00 0.097 0.08 0.101 0.08 0.102 0.07 0.096 0.09ln(K/E) 0.156 0.00 0.154 0.00 0.153 0.00 0.155 0.00 0.111 0.05 0.100 0.06 0.098 0.07 0.108 0.05Df -0.036 0.75 - - - - - - -0.078 0.58 - - - - - - Dftr - - -0.071 0.70 - - - - - - -0.105 0.64 - - - - Dfeu - - - - 0.164 0.70 - - - - - - 0.118 0.90 - - Dfus - - - - -1.084 0.05 - - - - - - -0.653 0.25 - - Dfjp - - - - -0.035 0.87 - - - - - - -0.091 0.71 - - Dfn3 - - 0.234 0.20 0.239 0.19 - - - - 0.303 0.15 0.312 0.14 - - Dfot - - -0.299 0.14 -0.298 0.14 - - - - -0.357 0.17 -0.355 0.17 - - Dfmn - - - - - - -0.030 0.83 - - - - - - -0.038 0.82Dfmj - - - - - - -0.214 0.32 - - - - - - -0.486 0.07Dfwh - - - - - - 0.396 0.12 - - - - - - 0.315 0.29Dboi -0.114 0.45 -0.102 0.49 -0.119 0.41 -0.138 0.38 -0.217 0.23 -0.207 0.25 -0.218 0.25 -0.218 0.25Dold 0.092 0.26 0.104 0.19 0.123 0.13 0.090 0.27 -0.056 0.61 -0.035 0.75 -0.021 0.85 -0.064 0.57Dlarge 0.272 0.05 0.263 0.05 0.275 0.04 0.278 0.05 0.296 0.13 0.286 0.14 0.279 0.15 0.284 0.15F-test 10.75 0.00 8.62 0.00 7.33 0.00 8.32 0.00 2.20 0.04 2.24 0.02 1.88 0.05 2.08 0.04White 39.07 0.02 62.68 0.00 68.57 0.01 45.76 0.04 60.46 0.00 100.31 0.00 112.24 0.00 71.17 0.00Adj. R-sq. 0.073 - 0.076 - 0.079 - 0.073 - 0.019 - 0.026 - 0.023 - 0.023 - Obs. 743 - 743 - 743 - 743 - 368 - 368 - 368 - 368 -
LEATHER & FOOTWEARConstant 3.941 0.00 3.935 0.00 3.936 0.00 3.946 0.00 3.816 0.00 3.822 0.00 3.830 0.00 3.812 0.00ln(EN/E) 0.099 0.10 0.097 0.11 0.098 0.11 0.098 0.11 -0.080 0.48 -0.079 0.49 -0.073 0.53 -0.083 0.47ln(K/E) 0.063 0.23 0.065 0.22 0.066 0.22 0.060 0.25 0.083 0.25 0.083 0.26 0.085 0.25 0.083 0.26Df -0.163 0.43 - - - - - - -0.144 0.56 - - - - - - Dftr - - -0.126 0.70 - - - - - - -0.223 0.52 - - - - Dfeu - - - - 0.200 0.81 - - - - - - -0.088 0.91 - - Dfus - - - - -0.349 0.67 - - - - - - -0.584 0.48 - - Dfjp - - - - -0.151 0.70 - - - - - - -0.173 0.68 - - Dfn3 - - -0.283 0.29 -0.280 0.30 - - - - -0.094 0.77 -0.091 0.78 - - Dfot - - 0.192 0.74 0.191 0.74 - - - - -0.048 0.95 -0.040 0.96 - - Dfmn - - - - - - -0.344 0.23 - - - - - - -0.070 0.84Dfmj - - - - - - 0.036 0.91 - - - - - - -0.037 0.92Dfwh - - - - - - -0.095 0.83 - - - - - - -0.392 0.37Dboi -0.101 0.62 -0.091 0.66 -0.101 0.63 -0.107 0.60 -0.430 0.06 -0.441 0.06 -0.453 0.05 -0.435 0.06Dold -0.084 0.62 -0.087 0.61 -0.085 0.62 -0.081 0.64 -0.075 0.77 -0.079 0.76 -0.074 0.78 -0.080 0.76Dlarge -0.060 0.85 -0.081 0.80 -0.060 0.85 -0.034 0.92 -0.151 0.73 -0.128 0.77 -0.096 0.83 -0.202 0.65F-test 1.03 0.41 0.86 0.55 0.71 0.72 0.88 0.53 1.11 0.36 0.84 0.57 0.68 0.74 0.89 0.53White 19.26 0.69 20.96 0.91 22.03 0.96 28.97 0.67 18.46 0.68 19.65 0.88 21.51 0.94 21.00 0.91Adj. R-sq. 0.001 - -0.004 - -0.010 - -0.003 - 0.005 - -0.010 - -0.025 - -0.007 - Obs. 289 - 289 - 289 - 289 - 132 - 132 - 132 - 132 -
49

Appendix Table 3 (continued, 3/7)All plants Large plants with Output >=25 million baht
Indepen- Equation 1 Equation 2 Equation 3 Equation 4 Equation 1 Equation 2 Equation 3 Equation 4dent Coeffi- Sig- Coeffi- Sig- Coeffi- Sig- Coeffi- Sig- Coeffi- Sig- Coeffi- Sig- Coeffi- Sig- Coeffi- Sig-Variables, cients, nifi- cients, nifi- cients, nifi- cients, nifi- cients, nifi- cients, nifi- cients, nifi- cients, nifi-Indicator etc. cance etc. cance etc. cance etc. cance etc. cance etc. cance etc. cance etc. cance
CHEMICALS & PRODUCTSConstant 3.403 0.00 3.416 0.00 3.419 0.00 3.397 0.00 3.687 0.00 3.711 0.00 3.713 0.00 3.672 0.00ln(EN/E) 0.117 0.04 0.116 0.05 0.113 0.05 0.119 0.04 0.146 0.06 0.140 0.07 0.137 0.08 0.153 0.05ln(K/E) 0.239 0.00 0.235 0.00 0.233 0.00 0.242 0.00 0.201 0.00 0.192 0.00 0.189 0.00 0.207 0.00Df 0.436 0.00 - - - - - - 0.390 0.01 - - - - - - Dftr - - 0.506 0.00 - - - - - - 0.516 0.01 - - - - Dfeu - - - - 0.724 0.03 - - - - - - 0.682 0.05 - - Dfus - - - - 0.489 0.13 - - - - - - 0.437 0.22 - - Dfjp - - - - 0.450 0.02 - - - - - - 0.489 0.03 - - Dfn3 - - 0.395 0.08 0.398 0.08 - - - - 0.304 0.24 0.307 0.24 - - Dfot - - 0.352 0.22 0.355 0.22 - - - - 0.259 0.39 0.260 0.39 - - Dfmn - - - - - - 0.340 0.03 - - - - - - 0.290 0.11Dfmj - - - - - - 0.450 0.07 - - - - - - 0.344 0.20Dfwh - - - - - - 0.815 0.00 - - - - - - 0.769 0.01Dboi -0.429 0.01 -0.441 0.01 -0.440 0.01 -0.420 0.02 -0.449 0.02 -0.469 0.01 -0.464 0.01 -0.433 0.03Dold 0.142 0.22 0.141 0.22 0.140 0.23 0.144 0.21 0.201 0.15 0.197 0.16 0.201 0.16 0.209 0.14Dlarge 1.132 0.00 1.129 0.00 1.121 0.00 1.098 0.00 1.148 0.00 1.137 0.00 1.129 0.00 1.130 0.00F-test 16.40 0.00 12.37 0.00 9.93 0.00 12.63 0.00 9.51 0.00 7.33 0.00 5.88 0.00 7.44 0.00White 13.24 0.95 17.39 0.99 26.35 0.99 17.94 0.99 13.20 0.95 16.99 0.99 26.86 0.99 17.45 0.99Adj. R-sq. 0.153 - 0.151 - 0.149 - 0.154 - 0.120 - 0.120 - 0.116 - 0.121 - Obs. 512 - 512 - 512 - 512 - 374 - 374 - 374 - 374 -
RUBBER PRODUCTSConstant 3.499 0.00 3.475 0.00 3.482 0.00 3.463 0.00 3.707 0.00 3.700 0.00 3.701 0.00 3.683 0.00ln(EN/E) 0.145 0.13 0.157 0.11 0.160 0.10 0.134 0.17 0.197 0.09 0.220 0.07 0.220 0.07 0.188 0.11ln(K/E) 0.211 0.00 0.228 0.00 0.224 0.00 0.216 0.00 0.260 0.00 0.279 0.00 0.277 0.00 0.262 0.00Df -0.301 0.16 - - - - - - -0.335 0.14 - - - - - - Dftr - - -0.591 0.08 - - - - - - -0.562 0.12 - - - - Dfeu - - - - 0.065 0.94 - - - - - - -0.172 0.85 - - Dfus - - - - 0.329 0.69 - - - - - - 0.152 0.86 - - Dfjp - - - - -0.846 0.02 - - - - - - -0.759 0.06 - - Dfn3 - - -0.068 0.84 -0.074 0.83 - - - - -0.027 0.94 -0.031 0.94 - - Dfot - - -0.364 0.23 -0.373 0.22 - - - - -0.473 0.14 -0.478 0.14 - - Dfmn - - - - - - -0.223 0.35 - - - - - - -0.270 0.30Dfmj - - - - - - -0.498 0.23 - - - - - - -0.424 0.33Dfwh - - - - - - -0.443 0.33 - - - - - - -0.517 0.27Dboi -0.016 0.94 0.004 0.99 0.035 0.87 -0.012 0.96 -0.202 0.42 -0.195 0.44 -0.172 0.50 -0.194 0.43Dold 0.147 0.44 0.142 0.46 0.153 0.42 0.134 0.49 0.029 0.90 0.025 0.91 0.037 0.87 0.019 0.93Dlarge 1.213 0.00 1.265 0.00 1.244 0.00 1.244 0.00 1.267 0.00 1.270 0.00 1.253 0.00 1.260 0.00F-test 4.23 0.00 3.41 0.00 2.99 0.00 3.22 0.00 4.46 0.00 3.57 0.00 2.98 0.00 3.35 0.00White 20.84 0.59 33.38 0.55 32.24 0.83 32.64 0.53 18.86 0.71 29.42 0.69 31.55 0.83 30.85 0.62Adj. R-sq. 0.064 - 0.064 - 0.066 - 0.059 - 0.087 - 0.087 - 0.083 - 0.080 - Obs. 284 - 284 - 284 - 284 - 218 - 218 - 218 - 218 -
50
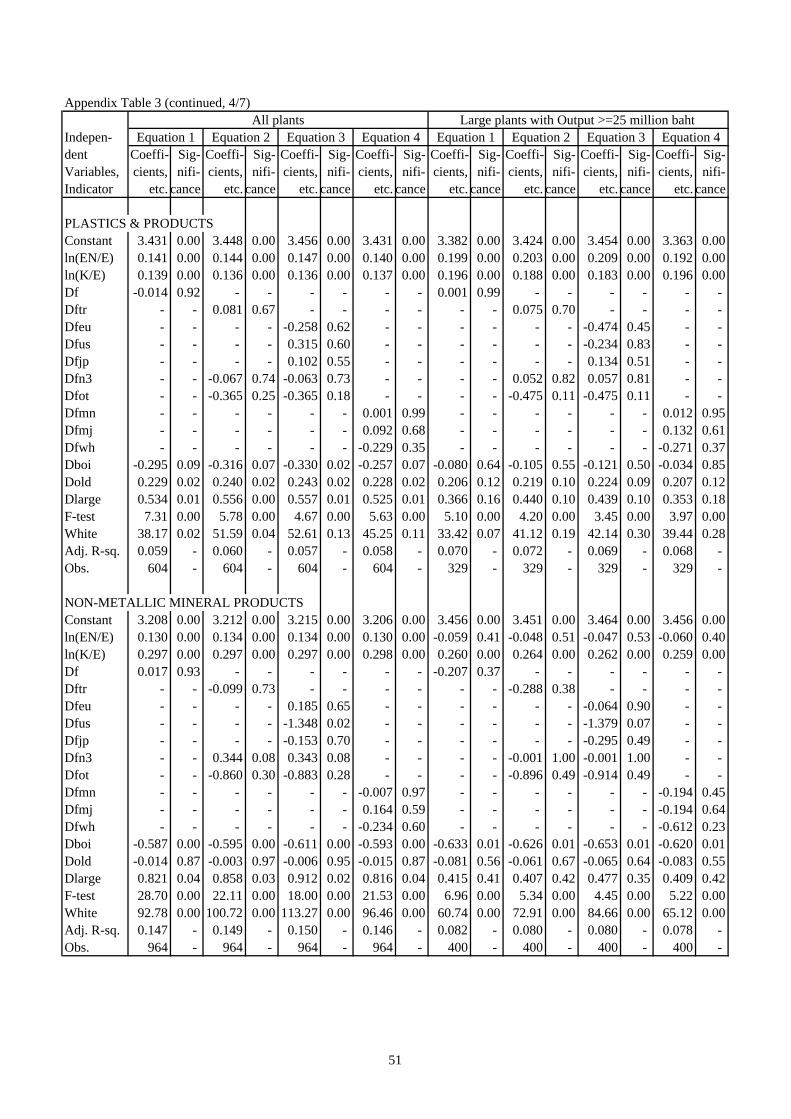
Appendix Table 3 (continued, 4/7)All plants Large plants with Output >=25 million baht
Indepen- Equation 1 Equation 2 Equation 3 Equation 4 Equation 1 Equation 2 Equation 3 Equation 4dent Coeffi- Sig- Coeffi- Sig- Coeffi- Sig- Coeffi- Sig- Coeffi- Sig- Coeffi- Sig- Coeffi- Sig- Coeffi- Sig-Variables, cients, nifi- cients, nifi- cients, nifi- cients, nifi- cients, nifi- cients, nifi- cients, nifi- cients, nifi-Indicator etc. cance etc. cance etc. cance etc. cance etc. cance etc. cance etc. cance etc. cance
PLASTICS & PRODUCTSConstant 3.431 0.00 3.448 0.00 3.456 0.00 3.431 0.00 3.382 0.00 3.424 0.00 3.454 0.00 3.363 0.00ln(EN/E) 0.141 0.00 0.144 0.00 0.147 0.00 0.140 0.00 0.199 0.00 0.203 0.00 0.209 0.00 0.192 0.00ln(K/E) 0.139 0.00 0.136 0.00 0.136 0.00 0.137 0.00 0.196 0.00 0.188 0.00 0.183 0.00 0.196 0.00Df -0.014 0.92 - - - - - - 0.001 0.99 - - - - - - Dftr - - 0.081 0.67 - - - - - - 0.075 0.70 - - - - Dfeu - - - - -0.258 0.62 - - - - - - -0.474 0.45 - - Dfus - - - - 0.315 0.60 - - - - - - -0.234 0.83 - - Dfjp - - - - 0.102 0.55 - - - - - - 0.134 0.51 - - Dfn3 - - -0.067 0.74 -0.063 0.73 - - - - 0.052 0.82 0.057 0.81 - - Dfot - - -0.365 0.25 -0.365 0.18 - - - - -0.475 0.11 -0.475 0.11 - - Dfmn - - - - - - 0.001 0.99 - - - - - - 0.012 0.95Dfmj - - - - - - 0.092 0.68 - - - - - - 0.132 0.61Dfwh - - - - - - -0.229 0.35 - - - - - - -0.271 0.37Dboi -0.295 0.09 -0.316 0.07 -0.330 0.02 -0.257 0.07 -0.080 0.64 -0.105 0.55 -0.121 0.50 -0.034 0.85Dold 0.229 0.02 0.240 0.02 0.243 0.02 0.228 0.02 0.206 0.12 0.219 0.10 0.224 0.09 0.207 0.12Dlarge 0.534 0.01 0.556 0.00 0.557 0.01 0.525 0.01 0.366 0.16 0.440 0.10 0.439 0.10 0.353 0.18F-test 7.31 0.00 5.78 0.00 4.67 0.00 5.63 0.00 5.10 0.00 4.20 0.00 3.45 0.00 3.97 0.00White 38.17 0.02 51.59 0.04 52.61 0.13 45.25 0.11 33.42 0.07 41.12 0.19 42.14 0.30 39.44 0.28Adj. R-sq. 0.059 - 0.060 - 0.057 - 0.058 - 0.070 - 0.072 - 0.069 - 0.068 - Obs. 604 - 604 - 604 - 604 - 329 - 329 - 329 - 329 -
NON-METALLIC MINERAL PRODUCTSConstant 3.208 0.00 3.212 0.00 3.215 0.00 3.206 0.00 3.456 0.00 3.451 0.00 3.464 0.00 3.456 0.00ln(EN/E) 0.130 0.00 0.134 0.00 0.134 0.00 0.130 0.00 -0.059 0.41 -0.048 0.51 -0.047 0.53 -0.060 0.40ln(K/E) 0.297 0.00 0.297 0.00 0.297 0.00 0.298 0.00 0.260 0.00 0.264 0.00 0.262 0.00 0.259 0.00Df 0.017 0.93 - - - - - - -0.207 0.37 - - - - - - Dftr - - -0.099 0.73 - - - - - - -0.288 0.38 - - - - Dfeu - - - - 0.185 0.65 - - - - - - -0.064 0.90 - - Dfus - - - - -1.348 0.02 - - - - - - -1.379 0.07 - - Dfjp - - - - -0.153 0.70 - - - - - - -0.295 0.49 - - Dfn3 - - 0.344 0.08 0.343 0.08 - - - - -0.001 1.00 -0.001 1.00 - - Dfot - - -0.860 0.30 -0.883 0.28 - - - - -0.896 0.49 -0.914 0.49 - - Dfmn - - - - - - -0.007 0.97 - - - - - - -0.194 0.45Dfmj - - - - - - 0.164 0.59 - - - - - - -0.194 0.64Dfwh - - - - - - -0.234 0.60 - - - - - - -0.612 0.23Dboi -0.587 0.00 -0.595 0.00 -0.611 0.00 -0.593 0.00 -0.633 0.01 -0.626 0.01 -0.653 0.01 -0.620 0.01Dold -0.014 0.87 -0.003 0.97 -0.006 0.95 -0.015 0.87 -0.081 0.56 -0.061 0.67 -0.065 0.64 -0.083 0.55Dlarge 0.821 0.04 0.858 0.03 0.912 0.02 0.816 0.04 0.415 0.41 0.407 0.42 0.477 0.35 0.409 0.42F-test 28.70 0.00 22.11 0.00 18.00 0.00 21.53 0.00 6.96 0.00 5.34 0.00 4.45 0.00 5.22 0.00White 92.78 0.00 100.72 0.00 113.27 0.00 96.46 0.00 60.74 0.00 72.91 0.00 84.66 0.00 65.12 0.00Adj. R-sq. 0.147 - 0.149 - 0.150 - 0.146 - 0.082 - 0.080 - 0.080 - 0.078 - Obs. 964 - 964 - 964 - 964 - 400 - 400 - 400 - 400 -
51

Appendix Table 3 (continued, 5/7)All plants Large plants with Output >=25 million baht
Indepen- Equation 1 Equation 2 Equation 3 Equation 4 Equation 1 Equation 2 Equation 3 Equation 4dent Coeffi- Sig- Coeffi- Sig- Coeffi- Sig- Coeffi- Sig- Coeffi- Sig- Coeffi- Sig- Coeffi- Sig- Coeffi- Sig-Variables, cients, nifi- cients, nifi- cients, nifi- cients, nifi- cients, nifi- cients, nifi- cients, nifi- cients, nifi-Indicator etc. cance etc. cance etc. cance etc. cance etc. cance etc. cance etc. cance etc. cance
METAL PRODUCTSConstant 3.603 0.00 3.611 0.00 3.609 0.00 3.609 0.00 3.986 0.00 3.981 0.00 3.979 0.00 3.991 0.00ln(EN/E) 0.111 0.00 0.109 0.00 0.110 0.00 0.116 0.00 0.116 0.02 0.111 0.03 0.111 0.03 0.125 0.01ln(K/E) 0.202 0.00 0.197 0.00 0.199 0.00 0.202 0.00 0.217 0.00 0.214 0.00 0.214 0.00 0.220 0.00Df 0.319 0.01 - - - - - - 0.283 0.05 - - - - - - Dftr - - 0.410 0.04 - - - - - - 0.316 0.16 - - - - Dfeu - - - - -0.063 0.88 - - - - - - -0.290 0.71 - - Dfus - - - - 0.598 0.17 - - - - - - 0.901 0.16 - - Dfjp - - - - 0.468 0.01 - - - - - - 0.352 0.14 - - Dfn3 - - 0.159 0.37 0.163 0.31 - - - - 0.197 0.35 0.199 0.34 - - Dfot - - 1.064 0.00 1.067 0.00 - - - - 0.870 0.00 0.873 0.00 - - Dfmn - - - - - - 0.274 0.06 - - - - - - 0.254 0.15Dfmj - - - - - - 0.181 0.55 - - - - - - 0.115 0.72Dfwh - - - - - - 0.628 0.04 - - - - - - 0.527 0.05Dboi -0.311 0.07 -0.358 0.04 -0.356 0.02 -0.356 0.07 -0.571 0.00 -0.604 0.00 -0.603 0.00 -0.594 0.00Dold 0.004 0.96 -0.002 0.98 0.001 0.99 0.010 0.90 -0.186 0.13 -0.189 0.12 -0.183 0.12 -0.176 0.15Dlarge 0.396 0.07 0.387 0.07 0.351 0.08 0.434 0.05 0.108 0.72 0.099 0.74 0.079 0.78 0.138 0.65F-test 18.14 0.00 14.66 0.00 11.90 0.00 13.92 0.00 7.83 0.00 6.47 0.00 5.51 0.00 6.06 0.00White 43.16 0.01 50.48 0.04 59.51 0.07 62.95 0.00 49.66 0.00 61.10 0.00 72.75 0.00 67.41 0.00Adj. R-sq. 0.110 - 0.116 - 0.116 - 0.111 - 0.099 - 0.105 - 0.108 - 0.098 - Obs. 831 - 831 - 831 - 831 - 375 - 375 - 375 - 375 -
GENERAL MACHINERYConstant 3.447 0.00 3.442 0.00 3.423 0.00 3.440 0.00 3.608 0.00 3.586 0.00 3.557 0.00 3.594 0.00ln(EN/E) 0.105 0.02 0.107 0.01 0.099 0.02 0.102 0.02 0.120 0.09 0.127 0.07 0.111 0.11 0.109 0.13ln(K/E) 0.270 0.00 0.268 0.00 0.269 0.00 0.270 0.00 0.313 0.00 0.320 0.00 0.321 0.00 0.310 0.00Df 0.182 0.16 - - - - - - 0.080 0.63 - - - - - - Dftr - - 0.109 0.49 - - - - - - -0.043 0.82 - - - - Dfeu - - - - 1.232 0.00 - - - - - - 1.100 0.02 - - Dfus - - - - 0.116 0.86 - - - - - - -0.166 0.82 - - Dfjp - - - - -0.048 0.77 - - - - - - -0.187 0.35 - - Dfn3 - - 0.466 0.02 0.443 0.03 - - - - 0.363 0.16 0.335 0.19 - - Dfot - - 0.475 0.13 0.458 0.15 - - - - 0.215 0.57 0.197 0.60 - - Dfmn - - - - - - 0.251 0.07 - - - - - - 0.203 0.26Dfmj - - - - - - -0.112 0.65 - - - - - - -0.278 0.33Dfwh - - - - - - 0.065 0.81 - - - - - - -0.091 0.76Dboi -0.061 0.70 -0.069 0.66 -0.036 0.82 -0.003 0.99 -0.254 0.18 -0.236 0.20 -0.214 0.24 -0.177 0.38Dold 0.030 0.76 0.047 0.63 0.038 0.70 0.025 0.80 0.040 0.77 0.062 0.66 0.045 0.75 0.034 0.81Dlarge 0.071 0.78 0.096 0.71 0.201 0.44 0.100 0.70 -0.041 0.89 -0.036 0.91 0.053 0.86 -0.016 0.96F-test 12.94 0.00 10.39 0.00 9.40 0.00 9.97 0.00 6.35 0.00 5.08 0.00 4.89 0.00 5.16 0.00White 13.48 0.94 19.17 0.98 20.09 1.00 16.74 1.00 21.00 0.58 24.98 0.87 26.49 0.96 27.24 0.82Adj. R-sq. 0.130 - 0.136 - 0.149 - 0.130 - 0.110 - 0.112 - 0.131 - 0.114 - Obs. 480 - 480 - 480 - 480 - 260 - 260 - 260 - 260 -
52

Appendix Table 3 (continued, 6/7)All plants Large plants with Output >=25 million baht
Indepen- Equation 1 Equation 2 Equation 3 Equation 4 Equation 1 Equation 2 Equation 3 Equation 4dent Coeffi- Sig- Coeffi- Sig- Coeffi- Sig- Coeffi- Sig- Coeffi- Sig- Coeffi- Sig- Coeffi- Sig- Coeffi- Sig-Variables, cients, nifi- cients, nifi- cients, nifi- cients, nifi- cients, nifi- cients, nifi- cients, nifi- cients, nifi-Indicator etc. cance etc. cance etc. cance etc. cance etc. cance etc. cance etc. cance etc. cance
ELECTRIC MACHINERY, ETC. (INCLUDES OFFICE & COMPUTING MACHINERY, PRECISION MACHINERY)Constant 3.517 0.00 3.501 0.00 3.513 0.00 3.496 0.00 3.666 0.00 3.639 0.00 3.664 0.00 3.623 0.00ln(EN/E) 0.100 0.02 0.098 0.02 0.096 0.03 0.093 0.03 0.119 0.07 0.116 0.08 0.115 0.05 0.099 0.09ln(K/E) 0.269 0.00 0.274 0.00 0.264 0.00 0.270 0.00 0.340 0.00 0.347 0.00 0.334 0.00 0.344 0.00Df -0.052 0.68 - - - - - - -0.319 0.04 - - - - - - Dftr - - -0.143 0.38 - - - - - - -0.364 0.03 - - - - Dfeu - - - - -0.060 0.92 - - - - - - -0.364 0.55 - - Dfus - - - - -0.585 0.09 - - - - - - -0.803 0.03 - - Dfjp - - - - -0.096 0.54 - - - - - - -0.296 0.08 - - Dfn3 - - 0.000 1.00 -0.004 0.98 - - - - -0.273 0.15 -0.269 0.11 - - Dfot - - -0.042 0.86 -0.039 0.87 - - - - -0.402 0.16 -0.392 0.11 - - Dfmn - - - - - - 0.031 0.84 - - - - - - -0.193 0.30Dfmj - - - - - - -0.072 0.66 - - - - - - -0.401 0.03Dfwh - - - - - - -0.225 0.17 - - - - - - -0.538 0.00Dboi -0.369 0.00 -0.337 0.01 -0.320 0.01 -0.327 0.02 -0.376 0.01 -0.364 0.01 -0.353 0.01 -0.312 0.04Dold 0.102 0.34 0.101 0.34 0.122 0.26 0.090 0.39 -0.080 0.61 -0.075 0.63 -0.048 0.74 -0.120 0.40Dlarge 0.728 0.00 0.752 0.00 0.834 0.00 0.767 0.00 0.534 0.02 0.552 0.01 0.655 0.01 0.572 0.02F-test 14.83 0.00 11.24 0.00 9.35 0.00 11.44 0.00 12.10 0.00 9.16 0.00 7.66 0.00 9.57 0.00White 41.15 0.01 66.51 0.00 145.36 0.00 62.48 0.00 27.88 0.22 45.09 0.12 132.72 0.00 49.46 0.05Adj. R-sq. 0.133 - 0.132 - 0.134 - 0.134 - 0.149 - 0.147 - 0.149 - 0.153 - Obs. 540 - 540 - 540 - 540 - 380 - 380 - 380 - 380 -
MOTOR VEHICLESConstant 3.614 0.00 3.635 0.00 3.630 0.00 3.617 0.00 3.593 0.00 3.554 0.00 3.544 0.00 3.587 0.00ln(EN/E) 0.074 0.13 0.075 0.12 0.074 0.12 0.074 0.13 0.112 0.42 0.095 0.50 0.094 0.51 0.111 0.44ln(K/E) 0.208 0.00 0.204 0.00 0.204 0.00 0.208 0.00 0.371 0.00 0.373 0.00 0.376 0.00 0.373 0.00Df 0.070 0.71 - - - - - - -0.247 0.26 - - - - - - Dftr - - 0.268 0.24 - - - - - - -0.126 0.62 - - - - Dfeu - - - - -0.311 0.34 - - - - - - -0.866 0.01 - - Dfus - - - - 1.222 0.07 - - - - - - 0.741 0.35 - - Dfjp - - - - 0.209 0.38 - - - - - - -0.176 0.49 - - Dfn3 - - -0.444 0.47 -0.451 0.46 - - - - -1.157 0.14 -1.171 0.14 - - Dfot - - -0.271 0.64 -0.278 0.64 - - - - 0.126 0.85 0.122 0.86 - - Dfmn - - - - - - 0.053 0.80 - - - - - - -0.249 0.31Dfmj - - - - - - 0.073 0.82 - - - - - - -0.211 0.53Dfwh - - - - - - 0.254 0.24 - - - - - - -0.423 0.08Dboi 0.319 0.14 0.219 0.35 0.248 0.29 0.324 0.14 0.075 0.77 -0.001 1.00 0.028 0.92 0.067 0.80Dold 0.155 0.12 0.150 0.13 0.144 0.15 0.155 0.12 0.088 0.57 0.068 0.66 0.055 0.72 0.082 0.59Dlarge 1.652 0.00 1.552 0.00 1.585 0.00 1.661 0.00 1.698 0.00 1.655 0.00 1.671 0.00 1.696 0.00F-test 28.52 0.00 21.94 0.00 17.98 0.00 21.31 0.00 15.67 0.00 12.23 0.00 10.14 0.00 11.64 0.00White 43.56 0.00 66.09 0.00 65.99 0.00 58.11 0.00 46.97 0.00 60.86 0.00 62.02 0.00 60.41 0.00Adj. R-sq. 0.267 - 0.270 - 0.272 - 0.264 - 0.313 - 0.318 - 0.321 - 0.306 - Obs. 455 - 455 - 455 - 455 - 194 - 194 - 194 - 194 -
53

Appendix Table 3 (continued, 7/7)All plants Large plants with Output >=25 million baht
Indepen- Equation 1 Equation 2 Equation 3 Equation 4 Equation 1 Equation 2 Equation 3 Equation 4dent Coeffi- Sig- Coeffi- Sig- Coeffi- Sig- Coeffi- Sig- Coeffi- Sig- Coeffi- Sig- Coeffi- Sig- Coeffi- Sig-Variables, cients, nifi- cients, nifi- cients, nifi- cients, nifi- cients, nifi- cients, nifi- cients, nifi- cients, nifi-Indicator etc. cance etc. cance etc. cance etc. cance etc. cance etc. cance etc. cance etc. cance
FURNITUREConstant 3.440 0.00 3.442 0.00 3.446 0.00 3.442 0.00 3.801 0.00 3.817 0.00 3.855 0.00 3.798 0.00ln(EN/E) 0.274 0.00 0.276 0.00 0.277 0.00 0.275 0.00 0.056 0.54 0.066 0.48 0.076 0.41 0.054 0.56ln(K/E) 0.403 0.00 0.405 0.00 0.404 0.00 0.403 0.00 0.213 0.00 0.215 0.00 0.211 0.00 0.211 0.00Df -0.210 0.28 - - - - - - -0.333 0.14 - - - - - - Dftr - - -0.144 0.58 - - - - - - -0.272 0.37 - - - - Dfeu - - - - 0.049 0.87 - - - - - - -0.473 0.55 - - Dfus - - - - -0.589 0.60 - - - - - - -0.855 0.29 - - Dfjp - - - - -0.106 0.73 - - - - - - -0.121 0.74 - - Dfn3 - - -0.225 0.44 -0.227 0.44 - - - - -0.271 0.46 -0.264 0.47 - - Dfot - - -0.804 0.26 -0.803 0.26 - - - - -0.866 0.09 -0.868 0.09 - - Dfmn - - - - - - -0.258 0.25 - - - - - - -0.561 0.03Dfmj - - - - - - -0.026 0.96 - - - - - - 0.412 0.36Dfwh - - - - - - -0.150 0.68 - - - - - - -0.145 0.77Dboi -0.610 0.00 -0.588 0.00 -0.595 0.00 -0.630 0.00 -0.706 0.00 -0.726 0.00 -0.763 0.00 -0.767 0.00Dold -0.295 0.02 -0.293 0.02 -0.292 0.02 -0.291 0.02 0.101 0.58 0.108 0.56 0.110 0.55 0.143 0.43Dlarge 0.983 0.00 0.990 0.00 1.002 0.00 0.978 0.00 0.556 0.08 0.559 0.09 0.589 0.08 0.519 0.10F-test 36.95 0.00 28.05 0.00 22.40 0.00 27.64 0.00 4.76 0.00 3.76 0.00 3.07 0.00 4.14 0.00White 57.72 0.00 67.00 0.00 69.59 0.00 63.74 0.00 22.55 0.49 28.84 0.72 29.51 0.84 24.53 0.86Adj. R-sq. 0.319 - 0.320 - 0.317 - 0.317 - 0.105 - 0.103 - 0.097 - 0.116 - Obs. 461 - 461 - 461 - 461 - 193 - 193 - 193 - 193 -
JEWELRYConstant 3.747 0.00 3.758 0.00 3.763 0.00 3.746 0.00 4.292 0.00 4.181 0.00 4.177 0.00 4.269 0.00ln(EN/E) 0.151 0.03 0.154 0.02 0.152 0.03 0.151 0.03 0.161 0.16 0.148 0.19 0.138 0.23 0.158 0.17ln(K/E) 0.247 0.00 0.247 0.00 0.242 0.00 0.248 0.00 0.226 0.00 0.257 0.00 0.251 0.00 0.232 0.00Df 0.333 0.04 - - - - - - -0.026 0.90 - - - - - - Dftr - - 0.390 0.02 - - - - - - -0.141 0.54 - - - - Dfeu - - - - 0.281 0.25 - - - - - - -0.282 0.33 - - Dfus - - - - 0.455 0.13 - - - - - - -0.027 0.93 - - Dfjp - - - - 0.608 0.10 - - - - - - 0.004 0.99 - - Dfn3 - - 0.034 0.91 0.036 0.92 - - - - -0.286 0.47 -0.283 0.47 - - Dfot - - 0.365 0.16 0.366 0.11 - - - - 0.300 0.26 0.297 0.27 - - Dfmn - - - - - - 0.340 0.07 - - - - - - 0.012 0.96Dfmj - - - - - - 0.334 0.22 - - - - - - -0.048 0.88Dfwh - - - - - - 0.311 0.26 - - - - - - -0.145 0.66Dboi -0.157 0.40 -0.179 0.37 -0.184 0.34 -0.153 0.44 0.000 1.00 0.015 0.94 0.011 0.96 0.023 0.91Dold -0.075 0.70 -0.083 0.72 -0.082 0.68 -0.078 0.69 0.141 0.52 0.109 0.62 0.109 0.62 0.128 0.57Dlarge 1.820 0.00 1.852 0.00 1.870 0.00 1.819 0.00 1.705 0.00 1.685 0.00 1.718 0.00 1.712 0.00F-test 14.43 0.00 10.89 0.00 8.73 0.00 10.70 0.00 6.51 0.00 5.34 0.00 4.28 0.00 4.81 0.00White 29.01 0.18 49.56 0.04 52.63 0.15 39.75 0.19 11.96 0.96 17.43 0.99 20.87 1.00 16.14 0.99Adj. R-sq. 0.314 - 0.310 - 0.305 - 0.306 - 0.252 - 0.262 - 0.251 - 0.237 - Obs. 177 - 177 - 177 - 177 - 99 - 99 - 99 - 99 - Note: Heteroscedasticity-consistent standard errors used if White is significant at 0.05 or less.- = not relevant or no plants in this category; n<30 = sample size smaller than 30.
54

Appendix Table 4: Estimates of Compensation per Hour (dependent variable = ln(W/E)), 1996All plants Large plants with Output >=25 million baht
Indepen- Equation 5 Equation 6 Equation 7 Equation 8 Equation 5 Equation 6 Equation 7 Equation 8dent Coeffi- Sig- Coeffi- Sig- Coeffi- Sig- Coeffi- Sig- Coeffi- Sig- Coeffi- Sig- Coeffi- Sig- Coeffi- Sig-Variables, cients, nifi- cients, nifi- cients, nifi- cients, nifi- cients, nifi- cients, nifi- cients, nifi- cients, nifi-Indicator etc. cance etc. cance etc. cance etc. cance etc. cance etc. cance etc. cance etc. cance
FOODConstant 2.645 0.00 2.648 0.00 2.648 0.00 2.644 0.00 2.823 0.00 2.831 0.00 2.831 0.00 2.821 0.00ln(EN/E) 0.122 0.00 0.122 0.00 0.122 0.00 0.122 0.00 0.109 0.00 0.107 0.00 0.107 0.00 0.110 0.00ln(K/E) 0.122 0.00 0.121 0.00 0.121 0.00 0.122 0.00 0.092 0.00 0.089 0.00 0.088 0.00 0.093 0.00Df 0.162 0.01 - - - - - - 0.102 0.12 - - - - - - Dftr - - 0.185 0.02 - - - - - - 0.148 0.07 - - - - Dfeu - - - - 0.173 0.35 - - - - - - 0.072 0.68 - - Dfus - - - - 0.305 0.15 - - - - - - 0.287 0.12 - - Dfjp - - - - 0.159 0.07 - - - - - - 0.133 0.19 - - Dfn3 - - 0.126 0.20 0.125 0.21 - - - - -0.022 0.85 -0.022 0.85 - - Dfot - - 0.130 0.38 0.130 0.38 - - - - 0.207 0.19 0.207 0.19 - - Dfmn - - - - - - 0.153 0.02 - - - - - - 0.079 0.28Dfmj - - - - - - 0.224 0.12 - - - - - - 0.268 0.07Dfwh - - - - - - 0.128 0.37 - - - - - - 0.026 0.89Dboi -0.041 0.54 -0.041 0.54 -0.039 0.56 -0.043 0.52 -0.037 0.59 -0.038 0.58 -0.038 0.58 -0.041 0.55Dold 0.089 0.03 0.090 0.02 0.089 0.03 0.089 0.03 0.135 0.01 0.134 0.01 0.133 0.01 0.135 0.01Dlarge 0.203 0.01 0.206 0.01 0.202 0.01 0.204 0.01 -0.007 0.94 -0.016 0.87 -0.016 0.87 -0.009 0.92F-test 33.47 0.00 25.06 0.00 20.08 0.00 25.11 0.00 9.41 0.00 7.35 0.00 5.96 0.00 7.25 0.00White 128.04 0.00 131.95 0.00 139.07 0.00 134.08 0.00 33.14 0.08 35.66 0.44 42.89 0.64 38.98 0.30Adj. R-sq. 0.116 - 0.115 - 0.114 - 0.115 - 0.056 - 0.057 - 0.056 - 0.056 - Obs. 1,483 - 1,483 - 1,483 - 1,483 - 844 - 844 - 844 - 844 -
TEXTILESConstant 3.142 0.00 3.143 0.00 3.134 0.00 3.149 0.00 3.499 0.00 3.511 0.00 3.501 0.00 3.507 0.00ln(EN/E) 0.203 0.00 0.203 0.00 0.202 0.00 0.205 0.00 0.259 0.00 0.260 0.00 0.257 0.00 0.260 0.00ln(K/E) 0.083 0.00 0.082 0.00 0.083 0.00 0.082 0.00 -0.009 0.78 -0.012 0.70 -0.012 0.70 -0.009 0.77Df 0.017 0.83 - - - - - - 0.044 0.61 - - - - - - Dftr - - 0.123 0.30 - - - - - - 0.180 0.15 - - - - Dfeu - - - - 0.657 0.01 - - - - - - 0.798 0.02 - - Dfus - - - - 0.217 0.51 - - - - - - 0.337 0.26 - - Dfjp - - - - 0.015 0.90 - - - - - - 0.087 0.51 - - Dfn3 - - 0.007 0.94 0.001 0.99 - - - - 0.012 0.91 0.011 0.91 - - Dfot - - -0.146 0.59 -0.155 0.57 - - - - 0.009 0.98 0.004 0.99 - - Dfmn - - - - - - -0.053 0.51 - - - - - - -0.054 0.56Dfmj - - - - - - 0.389 0.01 - - - - - - 0.467 0.00Dfwh - - - - - - 0.067 0.85 - - - - - - 0.233 0.52Dboi -0.241 0.02 -0.276 0.01 -0.266 0.02 -0.277 0.01 -0.140 0.21 -0.190 0.11 -0.188 0.12 -0.191 0.10Dold -0.005 0.93 -0.002 0.97 0.002 0.97 -0.007 0.89 0.008 0.92 0.005 0.94 0.010 0.90 0.005 0.95Dlarge -0.153 0.23 -0.147 0.25 -0.124 0.33 -0.117 0.35 -0.090 0.60 -0.092 0.58 -0.069 0.68 -0.002 0.99F-test 22.63 0.00 17.26 0.00 14.44 0.00 18.03 0.00 7.99 0.00 6.27 0.00 5.60 0.00 7.27 0.00White 128.10 0.00 171.11 0.00 182.65 0.00 178.41 0.00 106.58 0.00 167.05 0.00 179.54 0.00 133.66 0.00Adj. R-sq. 0.154 - 0.154 - 0.158 - 0.160 - 0.104 - 0.104 - 0.112 - 0.121 - Obs. 716 - 716 - 716 - 716 - 364 - 364 - 364 - 364 -
55

Appendix Table 4 (continued, 2/7)All plants Large plants with Output >=25 million baht
Indepen- Equation 5 Equation 6 Equation 7 Equation 8 Equation 5 Equation 6 Equation 7 Equation 8dent Coeffi- Sig- Coeffi- Sig- Coeffi- Sig- Coeffi- Sig- Coeffi- Sig- Coeffi- Sig- Coeffi- Sig- Coeffi- Sig-Variables, cients, nifi- cients, nifi- cients, nifi- cients, nifi- cients, nifi- cients, nifi- cients, nifi- cients, nifi-Indicator etc. cance etc. cance etc. cance etc. cance etc. cance etc. cance etc. cance etc. cance
APPARELConstant 3.281 0.00 3.285 0.00 3.284 0.00 3.279 0.00 3.327 0.00 3.328 0.00 3.331 0.00 3.324 0.00ln(EN/E) 0.132 0.00 0.133 0.00 0.133 0.00 0.132 0.00 0.096 0.00 0.095 0.00 0.096 0.00 0.096 0.00ln(K/E) 0.084 0.00 0.084 0.00 0.083 0.00 0.085 0.00 0.081 0.00 0.082 0.00 0.081 0.00 0.082 0.00Df 0.144 0.00 - - - - - - 0.124 0.03 - - - - - - Dftr - - 0.165 0.06 - - - - - - 0.101 0.21 - - - - Dfeu - - - - 0.187 0.31 - - - - - - 0.147 0.32 - - Dfus - - - - -0.353 0.27 - - - - - - -0.243 0.16 - - Dfjp - - - - 0.213 0.04 - - - - - - 0.124 0.17 - - Dfn3 - - 0.132 0.28 0.134 0.27 - - - - 0.076 0.54 0.081 0.51 - - Dfot - - 0.080 0.46 0.081 0.45 - - - - 0.121 0.08 0.122 0.08 - - Dfmn - - - - - - 0.101 0.14 - - - - - - 0.096 0.10Dfmj - - - - - - 0.233 0.09 - - - - - - 0.119 0.41Dfwh - - - - - - 0.475 0.03 - - - - - - 0.447 0.01Dboi -0.077 0.34 -0.072 0.39 -0.083 0.32 -0.112 0.19 -0.165 0.14 -0.155 0.17 -0.159 0.16 -0.187 0.10Dold 0.100 0.02 0.102 0.04 0.112 0.03 0.104 0.04 0.004 0.95 0.003 0.96 0.012 0.86 0.008 0.90Dlarge 0.063 0.45 0.066 0.48 0.074 0.43 0.085 0.37 0.031 0.79 0.034 0.77 0.029 0.80 0.046 0.70F-test 18.12 0.00 13.44 0.00 11.06 0.00 14.03 0.00 4.87 0.00 3.48 0.00 2.89 0.00 4.02 0.00White 42.45 0.01 44.37 0.13 44.84 0.44 43.34 0.07 61.78 0.00 71.00 0.00 71.74 0.00 65.95 0.00Adj. R-sq. 0.122 - 0.118 - 0.119 - 0.123 - 0.060 - 0.051 - 0.049 - 0.062 - Obs. 743 - 743 - 743 - 743 - 368 - 368 - 368 - 368 -
LEATHER & FOOTWEARConstant 3.517 0.00 3.517 0.00 3.519 0.00 3.518 0.00 3.415 0.00 3.408 0.00 3.412 0.00 3.438 0.00ln(EN/E) 0.130 0.00 0.130 0.00 0.133 0.00 0.130 0.00 0.065 0.25 0.064 0.27 0.071 0.21 0.073 0.21ln(K/E) 0.016 0.46 0.017 0.44 0.020 0.37 0.016 0.48 0.020 0.59 0.021 0.57 0.026 0.48 0.016 0.66Df 0.126 0.25 - - - - - - 0.159 0.20 - - - - - - Dftr - - 0.305 0.05 - - - - - - 0.235 0.18 - - - - Dfeu - - - - 0.109 0.66 - - - - - - 0.002 1.00 - - Dfus - - - - -0.281 0.45 - - - - - - -0.407 0.31 - - Dfjp - - - - 0.477 0.00 - - - - - - 0.452 0.03 - - Dfn3 - - 0.019 0.89 0.022 0.88 - - - - 0.137 0.39 0.142 0.37 - - Dfot - - 0.054 0.90 0.053 0.90 - - - - -0.111 0.78 -0.101 0.80 - - Dfmn - - - - - - 0.047 0.69 - - - - - - 0.007 0.97Dfmj - - - - - - 0.101 0.60 - - - - - - 0.259 0.17Dfwh - - - - - - 0.370 0.10 - - - - - - 0.271 0.21Dboi -0.178 0.19 -0.163 0.24 -0.175 0.21 -0.182 0.18 -0.150 0.18 -0.142 0.22 -0.156 0.17 -0.147 0.20Dold 0.103 0.14 0.101 0.16 0.102 0.16 0.108 0.13 0.211 0.10 0.214 0.10 0.225 0.08 0.222 0.09Dlarge -0.013 0.93 -0.037 0.79 -0.019 0.90 0.013 0.93 0.083 0.71 0.055 0.80 0.076 0.74 0.111 0.62F-test 4.45 0.00 3.59 0.00 3.20 0.00 3.54 0.00 1.77 0.11 1.40 0.20 1.58 0.12 1.51 0.16White 45.67 0.00 51.27 0.01 50.87 0.04 48.08 0.04 8.09 1.00 14.46 0.98 13.91 1.00 9.92 1.00Adj. R-sq. 0.067 - 0.067 - 0.071 - 0.066 - 0.034 - 0.024 - 0.043 - 0.030 - Obs. 289 - 289 - 289 - 289 - 132 - 132 - 132 - 132 -
56

Appendix Table 4 (continued, 3/7)All plants Large plants with Output >=25 million baht
Indepen- Equation 5 Equation 6 Equation 7 Equation 8 Equation 5 Equation 6 Equation 7 Equation 8dent Coeffi- Sig- Coeffi- Sig- Coeffi- Sig- Coeffi- Sig- Coeffi- Sig- Coeffi- Sig- Coeffi- Sig- Coeffi- Sig-Variables, cients, nifi- cients, nifi- cients, nifi- cients, nifi- cients, nifi- cients, nifi- cients, nifi- cients, nifi-Indicator etc. cance etc. cance etc. cance etc. cance etc. cance etc. cance etc. cance etc. cance
CHEMICALS & PRODUCTSConstant 3.488 0.00 3.497 0.00 3.499 0.00 3.480 0.00 3.659 0.00 3.674 0.00 3.674 0.00 3.640 0.00ln(EN/E) 0.207 0.00 0.205 0.00 0.202 0.00 0.206 0.00 0.248 0.00 0.242 0.00 0.239 0.00 0.249 0.00ln(K/E) 0.070 0.01 0.066 0.01 0.064 0.02 0.072 0.01 0.061 0.04 0.054 0.07 0.053 0.08 0.066 0.03Df 0.209 0.02 - - - - - - 0.182 0.07 - - - - - - Dftr - - 0.308 0.01 - - - - - - 0.297 0.02 - - - - Dfeu - - - - 0.462 0.07 - - - - - - 0.435 0.10 - - Dfus - - - - 0.290 0.20 - - - - - - 0.305 0.24 - - Dfjp - - - - 0.270 0.03 - - - - - - 0.252 0.08 - - Dfn3 - - 0.135 0.21 0.137 0.21 - - - - 0.076 0.54 0.077 0.53 - - Dfot - - 0.160 0.33 0.162 0.33 - - - - 0.122 0.45 0.123 0.45 - - Dfmn - - - - - - 0.127 0.17 - - - - - - 0.087 0.43Dfmj - - - - - - 0.346 0.04 - - - - - - 0.297 0.10Dfwh - - - - - - 0.385 0.02 - - - - - - 0.369 0.04Dboi -0.280 0.02 -0.303 0.01 -0.302 0.01 -0.285 0.01 -0.350 0.01 -0.375 0.00 -0.374 0.00 -0.352 0.01Dold 0.122 0.06 0.118 0.07 0.117 0.07 0.124 0.06 0.119 0.13 0.110 0.16 0.109 0.16 0.124 0.12Dlarge 0.571 0.01 0.546 0.01 0.540 0.01 0.554 0.01 0.509 0.03 0.487 0.04 0.479 0.04 0.495 0.03F-test 17.99 0.00 14.02 0.00 11.31 0.00 14.07 0.00 12.19 0.00 9.67 0.00 7.80 0.00 9.67 0.00White 55.28 0.00 59.39 0.00 64.06 0.04 56.27 0.01 90.88 0.00 98.33 0.00 102.11 0.00 94.52 0.00Adj. R-sq. 0.166 - 0.169 - 0.168 - 0.170 - 0.153 - 0.157 - 0.154 - 0.157 - Obs. 512 - 512 - 512 - 512 - 374 - 374 - 374 - 374 -
RUBBER PRODUCTSConstant 2.820 0.00 2.826 0.00 2.817 0.00 2.795 0.00 2.876 0.00 2.884 0.00 2.867 0.00 2.854 0.00ln(EN/E) 0.177 0.00 0.182 0.00 0.182 0.00 0.168 0.01 0.198 0.00 0.208 0.00 0.207 0.00 0.190 0.01ln(K/E) 0.115 0.00 0.116 0.00 0.119 0.00 0.117 0.00 0.110 0.01 0.114 0.01 0.119 0.00 0.112 0.02Df -0.166 0.11 - - - - - - -0.188 0.08 - - - - - - Dftr - - -0.128 0.44 - - - - - - -0.195 0.24 - - - - Dfeu - - - - -0.838 0.05 - - - - - - -0.891 0.03 - - Dfus - - - - 0.226 0.58 - - - - - - 0.226 0.57 - - Dfjp - - - - -0.087 0.64 - - - - - - -0.166 0.37 - - Dfn3 - - -0.087 0.61 -0.090 0.60 - - - - -0.059 0.74 -0.066 0.71 - - Dfot - - -0.245 0.11 -0.241 0.11 - - - - -0.267 0.08 -0.259 0.09 - - Dfmn - - - - - - -0.100 0.42 - - - - - - -0.134 0.31Dfmj - - - - - - -0.290 0.05 - - - - - - -0.272 0.08Dfwh - - - - - - -0.338 0.05 - - - - - - -0.326 0.06Dboi -0.067 0.53 -0.074 0.49 -0.091 0.40 -0.060 0.55 -0.061 0.57 -0.067 0.54 -0.084 0.43 -0.056 0.61Dold 0.254 0.01 0.253 0.01 0.254 0.01 0.244 0.01 0.230 0.03 0.226 0.04 0.229 0.03 0.221 0.04Dlarge -0.205 0.25 -0.224 0.22 -0.145 0.44 -0.192 0.14 -0.127 0.50 -0.149 0.44 -0.050 0.80 -0.131 0.38F-test 6.65 0.00 5.01 0.00 4.41 0.00 5.17 0.00 5.51 0.00 4.20 0.00 3.80 0.00 4.23 0.00White 24.72 0.37 34.85 0.48 39.30 0.55 48.71 0.05 29.73 0.16 46.15 0.08 50.22 0.13 61.11 0.00Adj. R-sq. 0.107 - 0.102 - 0.107 - 0.105 - 0.111 - 0.105 - 0.114 - 0.106 - Obs. 284 - 284 - 284 - 284 - 218 - 218 - 218 - 218 -
57

Appendix Table 4 (continued, 4/7)All plants Large plants with Output >=25 million baht
Indepen- Equation 5 Equation 6 Equation 7 Equation 8 Equation 5 Equation 6 Equation 7 Equation 8dent Coeffi- Sig- Coeffi- Sig- Coeffi- Sig- Coeffi- Sig- Coeffi- Sig- Coeffi- Sig- Coeffi- Sig- Coeffi- Sig-Variables, cients, nifi- cients, nifi- cients, nifi- cients, nifi- cients, nifi- cients, nifi- cients, nifi- cients, nifi-Indicator etc. cance etc. cance etc. cance etc. cance etc. cance etc. cance etc. cance etc. cance
PLASTICS & PRODUCTSConstant 3.467 0.00 3.486 0.00 3.490 0.00 3.463 0.00 3.202 0.00 3.246 0.00 3.242 0.00 3.200 0.00ln(EN/E) 0.265 0.00 0.265 0.00 0.266 0.00 0.262 0.00 0.202 0.00 0.205 0.00 0.204 0.00 0.202 0.00ln(K/E) -0.001 0.96 -0.006 0.81 -0.006 0.80 -0.003 0.91 0.026 0.45 0.016 0.65 0.016 0.64 0.026 0.45Df 0.177 0.02 - - - - - - 0.190 0.04 - - - - - - Dftr - - 0.295 0.00 - - - - - - 0.266 0.02 - - - - Dfeu - - - - 0.199 0.49 - - - - - - 0.366 0.34 - - Dfus - - - - 0.335 0.00 - - - - - - 0.285 0.67 - - Dfjp - - - - 0.304 0.01 - - - - - - 0.256 0.04 - - Dfn3 - - 0.105 0.45 0.107 0.45 - - - - 0.259 0.07 0.258 0.07 - - Dfot - - -0.260 0.13 -0.260 0.13 - - - - -0.275 0.13 -0.275 0.13 - - Dfmn - - - - - - 0.117 0.19 - - - - - - 0.089 0.39Dfmj - - - - - - 0.397 0.01 - - - - - - 0.414 0.01Dfwh - - - - - - 0.141 0.37 - - - - - - 0.279 0.13Dboi -0.132 0.13 -0.154 0.15 -0.158 0.15 -0.130 0.16 -0.020 0.84 -0.041 0.68 -0.037 0.72 -0.038 0.72Dold 0.044 0.51 0.057 0.39 0.057 0.39 0.050 0.46 0.078 0.33 0.089 0.26 0.089 0.27 0.089 0.27Dlarge 0.007 0.96 0.035 0.81 0.035 0.81 -0.004 0.98 -0.085 0.60 -0.012 0.94 -0.012 0.94 -0.113 0.48F-test 9.15 0.00 7.65 0.00 6.11 0.00 7.28 0.00 5.67 0.00 5.05 0.00 4.02 0.00 4.75 0.00White 29.26 0.17 56.43 0.01 62.68 0.01 41.33 0.21 20.16 0.63 28.85 0.72 31.45 0.76 26.01 0.86Adj. R-sq. 0.083 - 0.090 - 0.087 - 0.085 - 0.079 - 0.090 - 0.084 - 0.084 - Obs. 539 - 539 - 539 - 539 - 329 - 329 - 329 - 329 -
NON-METALLIC MINERAL PRODUCTSConstant 2.996 0.00 2.997 0.00 2.999 0.00 2.993 0.00 3.226 0.00 3.226 0.00 3.235 0.00 3.212 0.00ln(EN/E) 0.146 0.00 0.146 0.00 0.146 0.00 0.147 0.00 0.121 0.00 0.118 0.00 0.119 0.00 0.122 0.00ln(K/E) 0.085 0.00 0.084 0.00 0.084 0.00 0.086 0.00 0.055 0.11 0.053 0.08 0.051 0.09 0.059 0.05Df 0.441 0.00 - - - - - - 0.422 0.00 - - - - - - Dftr - - 0.491 0.00 - - - - - - 0.493 0.00 - - - - Dfeu - - - - 0.594 0.00 - - - - - - 0.578 0.01 - - Dfus - - - - -0.216 0.65 - - - - - - -0.273 0.59 - - Dfjp - - - - 0.510 0.01 - - - - - - 0.550 0.01 - - Dfn3 - - 0.458 0.00 0.459 0.00 - - - - 0.368 0.04 0.371 0.03 - - Dfot - - 0.225 0.51 0.215 0.53 - - - - 0.329 0.52 0.320 0.53 - - Dfmn - - - - - - 0.390 0.00 - - - - - - 0.378 0.00Dfmj - - - - - - 0.729 0.00 - - - - - - 0.680 0.01Dfwh - - - - - - 0.021 0.96 - - - - - - 0.108 0.83Dboi -0.077 0.43 -0.089 0.35 -0.102 0.29 -0.090 0.35 -0.146 0.22 -0.157 0.18 -0.181 0.13 -0.159 0.20Dold 0.049 0.32 0.050 0.31 0.049 0.31 0.048 0.32 0.055 0.51 0.054 0.48 0.053 0.49 0.054 0.48Dlarge 0.176 0.40 0.203 0.14 0.230 0.10 0.167 0.22 0.019 0.95 0.050 0.78 0.091 0.61 0.001 0.99F-test 28.42 0.00 21.48 0.00 17.44 0.00 21.83 0.00 5.37 0.00 4.15 0.00 3.58 0.00 4.26 0.00White 40.60 0.01 43.00 0.14 45.13 0.27 43.20 0.09 37.50 0.03 41.26 0.10 43.66 0.24 38.73 0.16Adj. R-sq. 0.146 - 0.145 - 0.146 - 0.148 - 0.062 - 0.059 - 0.061 - 0.061 - Obs. 964 - 964 - 964 - 964 - 400 - 400 - 400 - 400 -
58

Appendix Table 4 (continued, 5/7)All plants Large plants with Output >=25 million baht
Indepen- Equation 5 Equation 6 Equation 7 Equation 8 Equation 5 Equation 6 Equation 7 Equation 8dent Coeffi- Sig- Coeffi- Sig- Coeffi- Sig- Coeffi- Sig- Coeffi- Sig- Coeffi- Sig- Coeffi- Sig- Coeffi- Sig-Variables, cients, nifi- cients, nifi- cients, nifi- cients, nifi- cients, nifi- cients, nifi- cients, nifi- cients, nifi-Indicator etc. cance etc. cance etc. cance etc. cance etc. cance etc. cance etc. cance etc. cance
METAL PRODUCTSConstant 3.348 0.00 3.359 0.00 3.357 0.00 3.343 0.00 3.539 0.00 3.558 0.00 3.557 0.00 3.528 0.00ln(EN/E) 0.125 0.00 0.125 0.00 0.125 0.00 0.122 0.00 0.147 0.00 0.147 0.00 0.147 0.00 0.141 0.00ln(K/E) 0.072 0.00 0.068 0.00 0.069 0.00 0.071 0.00 0.056 0.03 0.049 0.06 0.049 0.06 0.056 0.03Df 0.139 0.05 - - - - - - 0.100 0.20 - - - - - - Dftr - - 0.279 0.00 - - - - - - 0.210 0.04 - - - - Dfeu - - - - 0.165 0.43 - - - - - - 0.062 0.79 - - Dfus - - - - 0.364 0.10 - - - - - - 0.492 0.09 - - Dfjp - - - - 0.286 0.00 - - - - - - 0.204 0.07 - - Dfn3 - - 0.060 0.46 0.061 0.46 - - - - 0.091 0.39 0.091 0.39 - - Dfot - - -0.017 0.92 -0.017 0.92 - - - - -0.089 0.62 -0.090 0.62 - - Dfmn - - - - - - 0.181 0.01 - - - - - - 0.141 0.11Dfmj - - - - - - 0.111 0.41 - - - - - - 0.048 0.74Dfwh - - - - - - -0.019 0.92 - - - - - - 0.002 0.99Dboi -0.177 0.07 -0.186 0.02 -0.185 0.02 -0.144 0.17 -0.207 0.04 -0.217 0.04 -0.217 0.04 -0.183 0.05Dold 0.075 0.08 0.074 0.07 0.075 0.07 0.070 0.10 0.124 0.06 0.125 0.05 0.126 0.05 0.118 0.07Dlarge -0.111 0.37 -0.137 0.18 -0.145 0.16 -0.129 0.31 -0.168 0.20 -0.175 0.18 -0.171 0.20 -0.190 0.16F-test 17.17 0.00 13.67 0.00 10.96 0.00 13.18 0.00 6.03 0.00 5.01 0.00 4.14 0.00 4.63 0.00White 35.60 0.05 38.49 0.31 53.79 0.17 78.70 0.00 17.15 0.80 18.53 0.99 32.53 0.90 27.19 0.82Adj. R-sq. 0.105 - 0.109 - 0.107 - 0.105 - 0.075 - 0.079 - 0.077 - 0.072 - Obs. 831 - 831 - 831 - 831 - 375 - 375 - 375 - 375 -
GENERAL MACHINERYConstant 3.449 0.00 3.471 0.00 3.470 0.00 3.462 0.00 3.416 0.00 3.445 0.00 3.435 0.00 3.440 0.00ln(EN/E) 0.137 0.00 0.141 0.00 0.141 0.00 0.143 0.00 0.132 0.01 0.134 0.01 0.130 0.00 0.144 0.00ln(K/E) 0.081 0.00 0.077 0.00 0.077 0.00 0.082 0.00 0.119 0.00 0.112 0.00 0.112 0.00 0.120 0.00Df 0.137 0.11 - - - - - - 0.056 0.61 - - - - - - Dftr - - 0.096 0.40 - - - - - - 0.041 0.75 - - - - Dfeu - - - - 0.088 0.80 - - - - - - 0.290 0.28 - - Dfus - - - - 0.221 0.39 - - - - - - 0.129 0.76 - - Dfjp - - - - 0.090 0.46 - - - - - - 0.001 0.99 - - Dfn3 - - 0.103 0.35 0.102 0.36 - - - - -0.015 0.92 -0.023 0.88 - - Dfot - - 0.578 0.00 0.577 0.00 - - - - 0.404 0.08 0.397 0.07 - - Dfmn - - - - - - 0.137 0.14 - - - - - - 0.064 0.59Dfmj - - - - - - -0.016 0.91 - - - - - - -0.131 0.44Dfwh - - - - - - 0.345 0.07 - - - - - - 0.249 0.24Dboi 0.017 0.88 0.007 0.95 0.010 0.93 0.001 0.99 -0.058 0.67 -0.069 0.61 -0.059 0.67 -0.068 0.63Dold 0.016 0.76 0.011 0.83 0.012 0.82 0.016 0.77 0.041 0.57 0.035 0.65 0.032 0.69 0.038 0.61Dlarge -0.291 0.11 -0.239 0.20 -0.236 0.22 -0.338 0.09 -0.345 0.13 -0.297 0.20 -0.276 0.12 -0.399 0.11F-test 10.61 0.00 9.00 0.00 7.18 0.00 8.51 0.00 4.67 0.00 3.91 0.00 3.23 0.00 3.98 0.00White 47.98 0.00 65.63 0.00 81.07 0.00 61.82 0.00 35.87 0.04 53.73 0.02 56.07 0.06 50.69 0.04Adj. R-sq. 0.107 - 0.118 - 0.114 - 0.111 - 0.078 - 0.082 - 0.079 - 0.084 - Obs. 480 - 480 - 480 - 480 - 260 - 260 - 260 - 260 -
59

Appendix Table 4 (continued, 6/7)All plants Large plants with Output >=25 million baht
Indepen- Equation 5 Equation 6 Equation 7 Equation 8 Equation 5 Equation 6 Equation 7 Equation 8dent Coeffi- Sig- Coeffi- Sig- Coeffi- Sig- Coeffi- Sig- Coeffi- Sig- Coeffi- Sig- Coeffi- Sig- Coeffi- Sig-Variables, cients, nifi- cients, nifi- cients, nifi- cients, nifi- cients, nifi- cients, nifi- cients, nifi- cients, nifi-Indicator etc. cance etc. cance etc. cance etc. cance etc. cance etc. cance etc. cance etc. cance
ELECTRIC MACHINERY, ETC. (INCLUDES OFFICE & COMPUTING MACHINERY, PRECISION MACHINERY)Constant 3.428 0.00 3.449 0.00 3.435 0.00 3.404 0.00 3.433 0.00 3.465 0.00 3.436 0.00 3.394 0.00ln(EN/E) 0.158 0.00 0.158 0.00 0.155 0.00 0.149 0.00 0.185 0.00 0.184 0.00 0.179 0.00 0.165 0.00ln(K/E) 0.088 0.00 0.082 0.00 0.085 0.00 0.089 0.00 0.108 0.00 0.099 0.01 0.107 0.00 0.111 0.00Df 0.031 0.69 - - - - - - -0.005 0.96 - - - - - - Dftr - - 0.072 0.44 - - - - - - 0.037 0.75 - - - - Dfeu - - - - 0.636 0.02 - - - - - - 0.571 0.05 - - Dfus - - - - 0.166 0.44 - - - - - - 0.143 0.55 - - Dfjp - - - - -0.027 0.77 - - - - - - -0.067 0.55 - - Dfn3 - - -0.072 0.39 -0.087 0.29 - - - - -0.121 0.26 -0.140 0.18 - - Dfot - - 0.185 0.39 0.168 0.43 - - - - 0.133 0.58 0.113 0.64 - - Dfmn - - - - - - 0.152 0.08 - - - - - - 0.121 0.27Dfmj - - - - - - -0.080 0.43 - - - - - - -0.133 0.28Dfwh - - - - - - -0.151 0.18 - - - - - - -0.189 0.15Dboi -0.233 0.01 -0.240 0.00 -0.216 0.01 -0.170 0.05 -0.204 0.04 -0.208 0.03 -0.185 0.05 -0.138 0.18Dold 0.099 0.18 0.096 0.19 0.086 0.24 0.079 0.28 0.139 0.15 0.132 0.17 0.118 0.22 0.097 0.31Dlarge -0.102 0.40 -0.116 0.34 -0.123 0.31 -0.070 0.57 -0.165 0.22 -0.185 0.18 -0.208 0.12 -0.144 0.29F-test 11.28 0.00 8.94 0.00 8.70 0.00 9.94 0.00 9.09 0.00 7.21 0.00 6.97 0.00 7.98 0.00White 71.77 0.00 126.96 0.00 150.96 0.00 90.19 0.00 78.34 0.00 117.50 0.00 137.53 0.00 100.47 0.00Adj. R-sq. 0.103 - 0.105 - 0.125 - 0.117 - 0.114 - 0.116 - 0.136 - 0.128 - Obs. 540 - 540 - 540 - 540 - 380 - 380 - 380 - 380 -
MOTOR VEHICLESConstant 3.445 0.00 3.468 0.00 3.465 0.00 3.447 0.00 3.495 0.00 3.535 0.00 3.527 0.00 3.492 0.00ln(EN/E) 0.090 0.00 0.093 0.00 0.092 0.00 0.090 0.00 0.146 0.01 0.150 0.00 0.148 0.01 0.146 0.01ln(K/E) 0.027 0.09 0.024 0.14 0.024 0.14 0.028 0.09 0.087 0.01 0.080 0.01 0.081 0.01 0.089 0.01Df 0.140 0.16 - - - - - - 0.031 0.79 - - - - - - Dftr - - 0.295 0.02 - - - - - - 0.148 0.31 - - - - Dfeu - - - - 0.283 0.52 - - - - - - 0.062 0.88 - - Dfus - - - - 0.579 0.12 - - - - - - 0.377 0.38 - - Dfjp - - - - 0.269 0.04 - - - - - - 0.129 0.41 - - Dfn3 - - -0.285 0.24 -0.287 0.23 - - - - -0.425 0.17 -0.429 0.16 - - Dfot - - -0.325 0.41 -0.327 0.41 - - - - -0.476 0.50 -0.477 0.50 - - Dfmn - - - - - - 0.112 0.27 - - - - - - 0.014 0.91Dfmj - - - - - - 0.243 0.27 - - - - - - 0.105 0.50Dfwh - - - - - - 0.023 0.94 - - - - - - -0.192 0.58Dboi 0.101 0.39 0.027 0.83 0.038 0.77 0.096 0.41 0.026 0.84 -0.040 0.79 -0.030 0.85 0.016 0.89Dold 0.088 0.12 0.084 0.14 0.083 0.15 0.083 0.14 0.136 0.13 0.134 0.16 0.132 0.17 0.126 0.17Dlarge 0.267 0.14 0.180 0.30 0.197 0.27 0.264 0.13 0.140 0.47 0.095 0.62 0.103 0.60 0.143 0.47F-test 8.83 0.00 8.25 0.00 6.69 0.00 6.74 0.00 4.99 0.00 4.76 0.00 3.84 0.00 3.82 0.00White 35.54 0.03 110.39 0.00 113.10 0.00 68.23 0.00 16.26 0.75 87.53 0.00 89.32 0.00 24.86 0.73Adj. R-sq. 0.094 - 0.113 - 0.111 - 0.092 - 0.110 - 0.135 - 0.128 - 0.105 - Obs. 455 - 455 - 455 - 455 - 194 - 194 - 194 - 194 -
60

Appendix Table 4 (continued, 7/7)All plants Large plants with Output >=25 million baht
Indepen- Equation 5 Equation 6 Equation 7 Equation 8 Equation 5 Equation 6 Equation 7 Equation 8dent Coeffi- Sig- Coeffi- Sig- Coeffi- Sig- Coeffi- Sig- Coeffi- Sig- Coeffi- Sig- Coeffi- Sig- Coeffi- Sig-Variables, cients, nifi- cients, nifi- cients, nifi- cients, nifi- cients, nifi- cients, nifi- cients, nifi- cients, nifi-Indicator etc. cance etc. cance etc. cance etc. cance etc. cance etc. cance etc. cance etc. cance
FURNITUREConstant 3.252 0.00 3.257 0.00 3.255 0.00 3.249 0.00 3.780 0.00 3.784 0.00 3.775 0.00 3.774 0.00ln(EN/E) 0.393 0.00 0.395 0.00 0.394 0.00 0.392 0.00 0.242 0.00 0.245 0.00 0.242 0.00 0.239 0.00ln(K/E) 0.326 0.00 0.327 0.00 0.327 0.00 0.326 0.00 0.067 0.05 0.070 0.04 0.071 0.04 0.066 0.05Df 0.105 0.36 - - - - - - 0.012 0.91 - - - - - - Dftr - - 0.195 0.04 - - - - - - 0.007 0.95 - - - - Dfeu - - - - 0.547 0.02 - - - - - - 0.206 0.04 - - Dfus - - - - 0.263 0.37 - - - - - - 0.050 0.85 - - Dfjp - - - - 0.128 0.24 - - - - - - -0.041 0.80 - - Dfn3 - - -0.068 0.72 -0.074 0.70 - - - - 0.056 0.77 0.049 0.80 - - Dfot - - -0.225 0.57 -0.230 0.56 - - - - -0.369 0.45 -0.370 0.45 - - Dfmn - - - - - - 0.125 0.37 - - - - - - -0.037 0.76Dfmj - - - - - - 0.136 0.44 - - - - - - 0.282 0.18Dfwh - - - - - - -0.084 0.74 - - - - - - -0.093 0.69Dboi -0.295 0.00 -0.271 0.00 -0.257 0.01 -0.280 0.00 -0.283 0.01 -0.285 0.01 -0.273 0.01 -0.287 0.01Dold -0.394 0.00 -0.394 0.00 -0.396 0.00 -0.396 0.00 -0.056 0.51 -0.049 0.61 -0.050 0.59 -0.045 0.60Dlarge 0.340 0.00 0.363 0.00 0.366 0.00 0.346 0.00 0.110 0.46 0.111 0.43 0.113 0.43 0.097 0.51F-test 60.29 0.00 45.22 0.00 36.09 0.00 45.08 0.00 7.99 0.00 6.34 0.00 5.07 0.00 6.29 0.00White 181.94 0.00 188.82 0.00 189.10 0.00 183.47 0.00 22.96 0.46 60.96 0.00 61.42 0.01 28.00 0.71Adj. R-sq. 0.436 - 0.435 - 0.433 - 0.434 - 0.179 - 0.182 - 0.175 - 0.181 - Obs. 461 - 461 - 461 - 461 - 193 - 193 - 193 - 193 -
JEWELRYConstant 3.601 0.00 3.622 0.00 3.629 0.00 3.577 0.00 4.120 0.00 4.126 0.00 4.144 0.00 4.109 0.00ln(EN/E) 0.223 0.00 0.226 0.00 0.226 0.00 0.218 0.00 0.246 0.00 0.248 0.00 0.250 0.00 0.242 0.00ln(K/E) 0.090 0.01 0.083 0.02 0.079 0.02 0.094 0.01 0.017 0.72 0.014 0.73 0.008 0.84 0.017 0.67Df 0.332 0.00 - - - - - - 0.110 0.29 - - - - - - Dftr - - 0.397 0.00 - - - - - - 0.133 0.32 - - - - Dfeu - - - - 0.331 0.04 - - - - - - 0.099 0.55 - - Dfus - - - - 0.321 0.10 - - - - - - 0.035 0.85 - - Dfjp - - - - 0.771 0.00 - - - - - - 0.431 0.06 - - Dfn3 - - 0.365 0.12 0.374 0.11 - - - - 0.181 0.42 0.191 0.40 - - Dfot - - 0.226 0.14 0.234 0.13 - - - - 0.091 0.55 0.095 0.53 - - Dfmn - - - - - - 0.412 0.00 - - - - - - 0.127 0.32Dfmj - - - - - - 0.150 0.41 - - - - - - 0.048 0.78Dfwh - - - - - - 0.252 0.17 - - - - - - 0.124 0.51Dboi 0.008 0.95 -0.003 0.98 -0.033 0.80 0.072 0.59 0.135 0.24 0.129 0.27 0.094 0.43 0.146 0.22Dold -0.039 0.76 -0.024 0.85 -0.014 0.91 -0.049 0.71 -0.098 0.47 -0.092 0.47 -0.075 0.55 -0.095 0.45Dlarge 0.442 0.04 0.454 0.04 0.477 0.03 0.392 0.07 0.296 0.19 0.302 0.18 0.322 0.16 0.288 0.21F-test 12.13 0.00 9.19 0.00 7.72 0.00 9.35 0.00 3.81 0.00 2.86 0.01 2.57 0.01 2.83 0.01White 20.33 0.62 31.43 0.59 33.16 0.86 33.43 0.45 34.36 0.05 36.80 0.30 42.54 0.45 41.46 0.12Adj. R-sq. 0.275 - 0.271 - 0.276 - 0.275 - 0.147 - 0.132 - 0.138 - 0.130 - Obs. 177 - 177 - 177 - 177 - 99 - 99 - 99 - 99 - Note: Heteroscedasticity-consistent standard errors used if White is significant at 0.05 or less.- = not relevant or no plants in this category; n<30 = sample size smaller than 30.
61
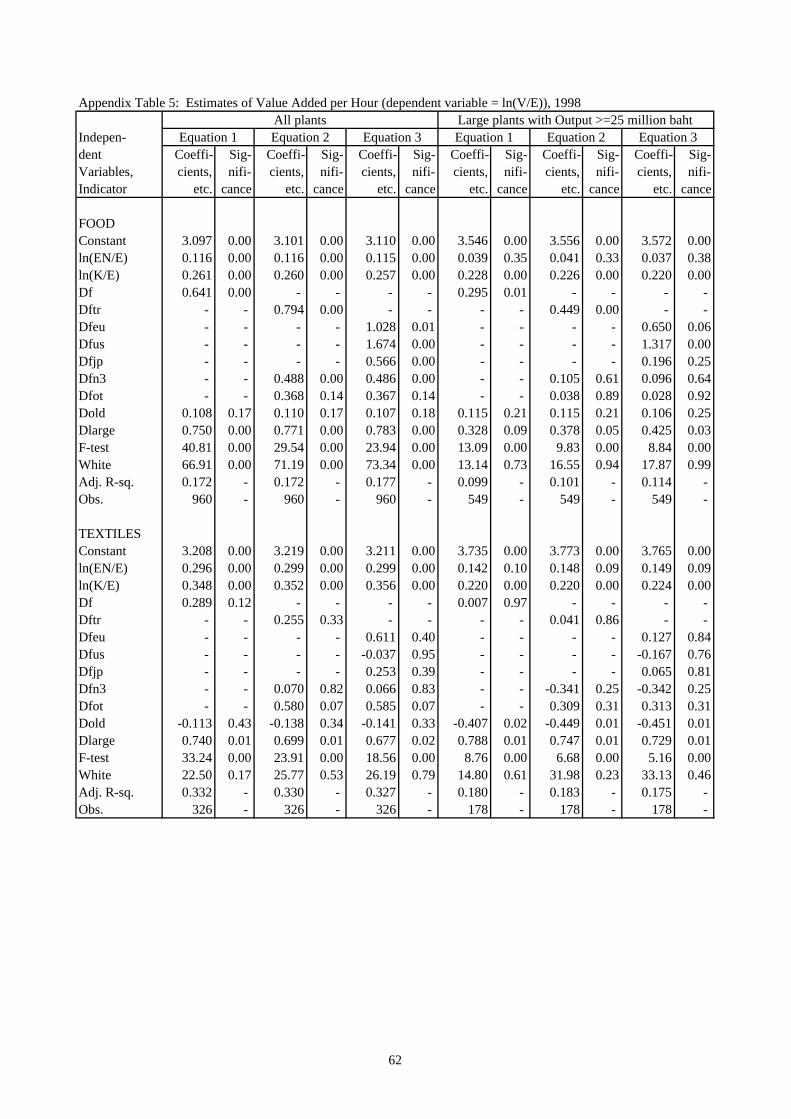
Appendix Table 5: Estimates of Value Added per Hour (dependent variable = ln(V/E)), 1998All plants Large plants with Output >=25 million baht
Indepen- Equation 1 Equation 2 Equation 3 Equation 1 Equation 2 Equation 3dent Coeffi- Sig- Coeffi- Sig- Coeffi- Sig- Coeffi- Sig- Coeffi- Sig- Coeffi- Sig-Variables, cients, nifi- cients, nifi- cients, nifi- cients, nifi- cients, nifi- cients, nifi-Indicator etc. cance etc. cance etc. cance etc. cance etc. cance etc. cance
FOODConstant 3.097 0.00 3.101 0.00 3.110 0.00 3.546 0.00 3.556 0.00 3.572 0.00ln(EN/E) 0.116 0.00 0.116 0.00 0.115 0.00 0.039 0.35 0.041 0.33 0.037 0.38ln(K/E) 0.261 0.00 0.260 0.00 0.257 0.00 0.228 0.00 0.226 0.00 0.220 0.00Df 0.641 0.00 - - - - 0.295 0.01 - - - - Dftr - - 0.794 0.00 - - - - 0.449 0.00 - - Dfeu - - - - 1.028 0.01 - - - - 0.650 0.06Dfus - - - - 1.674 0.00 - - - - 1.317 0.00Dfjp - - - - 0.566 0.00 - - - - 0.196 0.25Dfn3 - - 0.488 0.00 0.486 0.00 - - 0.105 0.61 0.096 0.64Dfot - - 0.368 0.14 0.367 0.14 - - 0.038 0.89 0.028 0.92Dold 0.108 0.17 0.110 0.17 0.107 0.18 0.115 0.21 0.115 0.21 0.106 0.25Dlarge 0.750 0.00 0.771 0.00 0.783 0.00 0.328 0.09 0.378 0.05 0.425 0.03F-test 40.81 0.00 29.54 0.00 23.94 0.00 13.09 0.00 9.83 0.00 8.84 0.00White 66.91 0.00 71.19 0.00 73.34 0.00 13.14 0.73 16.55 0.94 17.87 0.99Adj. R-sq. 0.172 - 0.172 - 0.177 - 0.099 - 0.101 - 0.114 - Obs. 960 - 960 - 960 - 549 - 549 - 549 -
TEXTILESConstant 3.208 0.00 3.219 0.00 3.211 0.00 3.735 0.00 3.773 0.00 3.765 0.00ln(EN/E) 0.296 0.00 0.299 0.00 0.299 0.00 0.142 0.10 0.148 0.09 0.149 0.09ln(K/E) 0.348 0.00 0.352 0.00 0.356 0.00 0.220 0.00 0.220 0.00 0.224 0.00Df 0.289 0.12 - - - - 0.007 0.97 - - - - Dftr - - 0.255 0.33 - - - - 0.041 0.86 - - Dfeu - - - - 0.611 0.40 - - - - 0.127 0.84Dfus - - - - -0.037 0.95 - - - - -0.167 0.76Dfjp - - - - 0.253 0.39 - - - - 0.065 0.81Dfn3 - - 0.070 0.82 0.066 0.83 - - -0.341 0.25 -0.342 0.25Dfot - - 0.580 0.07 0.585 0.07 - - 0.309 0.31 0.313 0.31Dold -0.113 0.43 -0.138 0.34 -0.141 0.33 -0.407 0.02 -0.449 0.01 -0.451 0.01Dlarge 0.740 0.01 0.699 0.01 0.677 0.02 0.788 0.01 0.747 0.01 0.729 0.01F-test 33.24 0.00 23.91 0.00 18.56 0.00 8.76 0.00 6.68 0.00 5.16 0.00White 22.50 0.17 25.77 0.53 26.19 0.79 14.80 0.61 31.98 0.23 33.13 0.46Adj. R-sq. 0.332 - 0.330 - 0.327 - 0.180 - 0.183 - 0.175 - Obs. 326 - 326 - 326 - 178 - 178 - 178 -
62

Appendix Table 5 (continued, 2/7)All plants Large plants with Output >=25 million baht
Indepen- Equation 1 Equation 2 Equation 3 Equation 1 Equation 2 Equation 3dent Coeffi- Sig- Coeffi- Sig- Coeffi- Sig- Coeffi- Sig- Coeffi- Sig- Coeffi- Sig-Variables, cients, nifi- cients, nifi- cients, nifi- cients, nifi- cients, nifi- cients, nifi-Indicator etc. cance etc. cance etc. cance etc. cance etc. cance etc. cance
APPARELConstant 3.319 0.00 3.318 0.00 3.303 0.00 3.038 0.00 3.124 0.00 3.046 0.00ln(EN/E) 0.148 0.10 0.148 0.11 0.145 0.12 -0.125 0.31 -0.095 0.47 -0.107 0.42ln(K/E) 0.124 0.10 0.123 0.11 0.128 0.10 0.192 0.02 0.179 0.03 0.200 0.02Df 0.812 0.00 - - - - 0.512 0.02 - - - - Dftr - - 0.818 0.03 - - - - 0.446 0.11 - - Dfeu - - - - 1.212 0.20 - - - - 1.164 0.09Dfus - - - - - - - - - - - - Dfjp - - - - 0.758 0.05 - - - - 0.348 0.22Dfn3 - - 0.792 0.13 0.802 0.13 - - 1.129 0.02 1.107 0.02Dfot - - 0.815 0.03 0.827 0.03 - - 0.301 0.36 0.356 0.29Dold 0.579 0.02 0.578 0.02 0.576 0.02 0.330 0.14 0.384 0.09 0.392 0.08Dlarge 0.983 0.05 0.985 0.06 0.915 0.09 0.679 0.16 0.836 0.10 0.576 0.30F-test 9.20 0.00 6.48 0.00 5.67 0.00 5.75 0.00 4.52 0.00 4.14 0.00White 3.24 1.00 6.26 1.00 6.24 1.00 2.52 1.00 11.28 0.98 11.36 0.99Adj. R-sq. 0.214 - 0.203 - 0.198 - 0.248 - 0.255 - 0.259 - Obs. 152 - 152 - 152 - 73 - 73 - 73 -
LEATHER & FOOTWEARConstant 3.245 0.00 3.223 0.00 3.147 0.00 3.261 0.00 3.187 0.00 3.141 0.00ln(EN/E) 0.025 0.74 0.020 0.79 -0.006 0.94 -0.020 0.80 -0.034 0.66 -0.038 0.61ln(K/E) 0.271 0.00 0.274 0.00 0.283 0.00 0.328 0.00 0.339 0.00 0.355 0.00Df 0.027 0.90 - - - - 0.006 0.98 - - - - Dftr - - 0.140 0.71 - - - - 0.015 0.96 - - Dfeu - - - - -1.109 0.26 - - - - - - Dfus - - - - -0.769 0.28 - - - - -0.938 0.07Dfjp - - - - 0.894 0.07 - - - - 0.644 0.12Dfn3 - - 0.115 0.71 0.126 0.68 - - 0.329 0.19 0.337 0.17Dfot - - -0.320 0.47 -0.337 0.45 - - -0.572 0.08 -0.587 0.07Dold 0.555 0.00 0.558 0.00 0.505 0.00 0.555 0.00 0.567 0.00 0.505 0.00Dlarge 0.170 0.54 0.186 0.51 0.271 0.34 -0.178 0.45 -0.128 0.58 -0.024 0.92F-test 9.21 0.00 6.64 0.00 5.91 0.00 10.36 0.00 8.34 0.00 8.36 0.00White 14.29 0.65 36.81 0.08 35.51 0.16 14.13 0.66 26.70 0.42 15.46 0.95Adj. R-sq. 0.206 - 0.200 - 0.219 - 0.299 - 0.318 - 0.349 - Obs. 159 - 159 - 159 - 111 - 111 - 111 -
63

Appendix Table 5 (continued, 3/7)All plants Large plants with Output >=25 million baht
Indepen- Equation 1 Equation 2 Equation 3 Equation 1 Equation 2 Equation 3dent Coeffi- Sig- Coeffi- Sig- Coeffi- Sig- Coeffi- Sig- Coeffi- Sig- Coeffi- Sig-Variables, cients, nifi- cients, nifi- cients, nifi- cients, nifi- cients, nifi- cients, nifi-Indicator etc. cance etc. cance etc. cance etc. cance etc. cance etc. cance
CHEMICALS & PRODUCTSConstant 3.833 0.00 3.838 0.00 3.837 0.00 4.356 0.00 4.365 0.00 4.361 0.00ln(EN/E) 0.158 0.00 0.152 0.00 0.145 0.01 0.105 0.09 0.096 0.12 0.087 0.16ln(K/E) 0.219 0.00 0.216 0.00 0.216 0.00 0.143 0.01 0.137 0.01 0.138 0.01Df 0.406 0.01 - - - - 0.360 0.02 - - - - Dftr - - 0.499 0.01 - - - - 0.456 0.02 - - Dfeu - - - - 0.935 0.01 - - - - 0.817 0.02Dfus - - - - 0.637 0.08 - - - - 0.556 0.13Dfjp - - - - 0.322 0.15 - - - - 0.307 0.16Dfn3 - - 0.343 0.15 0.338 0.15 - - 0.324 0.18 0.319 0.19Dfot - - 0.288 0.24 0.284 0.25 - - 0.203 0.41 0.198 0.42Dold 0.052 0.69 0.047 0.72 0.026 0.85 -0.041 0.77 -0.048 0.74 -0.072 0.62Dlarge 0.685 0.06 0.676 0.06 0.680 0.06 0.621 0.09 0.607 0.10 0.591 0.11F-test 14.75 0.00 10.59 0.00 8.53 0.00 6.93 0.00 5.06 0.00 4.15 0.00White 7.50 0.98 25.46 0.55 29.91 0.75 11.13 0.85 30.42 0.25 33.34 0.55Adj. R-sq. 0.190 - 0.186 - 0.188 - 0.121 - 0.117 - 0.117 - Obs. 294 - 294 - 294 - 216 - 216 - 216 -
RUBBER PRODUCTSConstant 3.571 0.00 3.604 0.00 3.587 0.00 3.534 0.00 3.641 0.00 3.611 0.00ln(EN/E) 0.109 0.16 0.128 0.06 0.129 0.06 0.031 0.73 0.061 0.49 0.061 0.50ln(K/E) 0.269 0.00 0.275 0.00 0.282 0.00 0.266 0.00 0.256 0.00 0.264 0.00Df 0.112 0.52 - - - - 0.097 0.58 - - - - Dftr - - -0.246 0.32 - - - - -0.191 0.45 - - Dfeu - - - - 0.225 0.66 - - - - 0.143 0.78Dfus - - - - 0.115 0.80 - - - - 0.068 0.89Dfjp - - - - -0.550 0.08 - - - - -0.425 0.19Dfn3 - - 0.666 0.02 0.654 0.02 - - 0.687 0.02 0.683 0.02Dfot - - 0.048 0.85 0.040 0.87 - - -0.047 0.85 -0.052 0.84Dold -0.116 0.37 -0.138 0.31 -0.144 0.29 -0.149 0.36 -0.178 0.27 -0.178 0.27Dlarge 0.272 0.27 0.360 0.14 0.404 0.11 0.081 0.78 0.272 0.36 0.299 0.33F-test 9.32 0.00 7.84 0.00 6.43 0.00 5.17 0.00 4.68 0.00 3.79 0.00White 27.77 0.05 36.00 0.12 37.01 0.33 16.52 0.49 25.45 0.49 26.02 0.80Adj. R-sq. 0.181 - 0.203 - 0.206 - 0.126 - 0.152 - 0.148 - Obs. 189 - 189 - 189 - 145 - 145 - 145 -
64

Appendix Table 5 (continued, 4/7)All plants Large plants with Output >=25 million baht
Indepen- Equation 1 Equation 2 Equation 3 Equation 1 Equation 2 Equation 3dent Coeffi- Sig- Coeffi- Sig- Coeffi- Sig- Coeffi- Sig- Coeffi- Sig- Coeffi- Sig-Variables, cients, nifi- cients, nifi- cients, nifi- cients, nifi- cients, nifi- cients, nifi-Indicator etc. cance etc. cance etc. cance etc. cance etc. cance etc. cance
PLASTICS & PRODUCTSConstant 2.428 0.00 2.469 0.00 2.461 0.00 2.627 0.00 2.669 0.00 2.667 0.00ln(EN/E) -0.082 0.27 -0.075 0.32 -0.075 0.32 -0.019 0.82 -0.015 0.86 -0.019 0.83ln(K/E) 0.276 0.00 0.267 0.00 0.269 0.00 0.358 0.00 0.348 0.00 0.346 0.00Df 0.404 0.03 - - - - 0.093 0.63 - - - - Dftr - - 0.562 0.02 - - - - 0.198 0.41 - - Dfeu - - - - 0.694 0.42 - - - - -0.121 0.91Dfus - - - - 0.391 0.74 - - - - 0.183 0.86Dfjp - - - - 0.559 0.03 - - - - 0.213 0.40Dfn3 - - 0.242 0.40 0.243 0.40 - - -0.006 0.98 -0.006 0.99Dfot - - 0.288 0.40 0.287 0.40 - - -0.049 0.90 -0.047 0.90Dold 0.225 0.26 0.247 0.23 0.253 0.22 0.254 0.27 0.268 0.26 0.268 0.28Dlarge 0.491 0.09 0.489 0.10 0.488 0.10 0.352 0.28 0.379 0.25 0.380 0.26F-test 4.96 0.00 3.67 0.00 2.83 0.00 3.84 0.00 2.79 0.01 2.14 0.03White 4.52 1.00 5.24 1.00 5.28 1.00 4.22 1.00 6.49 1.00 6.68 1.00Adj. R-sq. 0.093 - 0.088 - 0.079 - 0.107 - 0.096 - 0.080 - Obs. 194 - 194 - 194 - 119 - 119 - 119 -
NON-METALLIC MINERAL PRODUCTSConstant 3.196 0.00 3.214 0.00 3.217 0.00 3.309 0.00 3.345 0.00 3.361 0.00ln(EN/E) 0.082 0.03 0.084 0.03 0.085 0.03 -0.039 0.55 -0.030 0.64 -0.025 0.70ln(K/E) 0.229 0.00 0.225 0.00 0.225 0.00 0.236 0.00 0.232 0.00 0.231 0.00Df 0.655 0.00 - - - - 0.505 0.01 - - - - Dftr - - 1.061 0.00 - - - - 0.731 0.00 - - Dfeu - - - - 1.267 0.00 - - - - 0.951 0.01Dfus - - - - 1.038 0.04 - - - - 0.655 0.17Dfjp - - - - 0.890 0.01 - - - - 0.593 0.07Dfn3 - - 0.411 0.18 0.410 0.19 - - 0.350 0.32 0.351 0.32Dfot - - -0.414 0.36 -0.418 0.36 - - -0.475 0.36 -0.484 0.35Dold 0.046 0.66 0.050 0.64 0.046 0.66 0.157 0.30 0.151 0.32 0.144 0.34Dlarge 0.845 0.00 0.777 0.01 0.800 0.01 0.719 0.07 0.706 0.08 0.737 0.07F-test 22.03 0.00 17.40 0.00 13.56 0.00 9.34 0.00 7.54 0.00 5.89 0.00White 8.71 0.95 9.81 1.00 12.79 1.00 13.65 0.69 15.17 0.94 17.03 0.99Adj. R-sq. 0.179 - 0.192 - 0.190 - 0.173 - 0.186 - 0.180 - Obs. 483 - 483 - 483 - 201 - 201 - 201 -
65

Appendix Table 5 (continued, 5/7)All plants Large plants with Output >=25 million baht
Indepen- Equation 1 Equation 2 Equation 3 Equation 1 Equation 2 Equation 3dent Coeffi- Sig- Coeffi- Sig- Coeffi- Sig- Coeffi- Sig- Coeffi- Sig- Coeffi- Sig-Variables, cients, nifi- cients, nifi- cients, nifi- cients, nifi- cients, nifi- cients, nifi-Indicator etc. cance etc. cance etc. cance etc. cance etc. cance etc. cance
METAL PRODUCTSConstant 3.292 0.00 3.283 0.00 3.326 0.00 3.651 0.00 3.577 0.00 3.595 0.00ln(EN/E) 0.022 0.71 0.020 0.73 0.020 0.73 -0.025 0.74 -0.037 0.62 -0.041 0.59ln(K/E) 0.254 0.00 0.256 0.00 0.238 0.00 0.253 0.00 0.267 0.00 0.260 0.00Df 0.308 0.06 - - - - 0.241 0.16 - - - - Dftr - - 0.306 0.13 - - - - 0.104 0.60 - - Dfeu - - - - 0.555 0.39 - - - - 0.891 0.35Dfus - - - - -2.787 0.01 - - - - - - Dfjp - - - - 0.409 0.05 - - - - 0.084 0.68Dfn3 - - 0.421 0.12 0.439 0.10 - - 0.478 0.09 0.479 0.09Dfot - - -0.015 0.97 0.005 0.99 - - 0.482 0.31 0.481 0.31Dold 0.078 0.58 0.084 0.55 0.123 0.39 -0.082 0.62 -0.080 0.63 -0.083 0.62Dlarge 0.488 0.11 0.507 0.10 0.492 0.11 0.142 0.67 0.128 0.70 0.152 0.65F-test 11.35 0.00 8.19 0.00 7.42 0.00 7.28 0.00 5.43 0.00 4.83 0.00White 6.65 0.99 8.91 1.00 9.31 1.00 3.88 1.00 5.66 1.00 6.20 1.00Adj. R-sq. 0.140 - 0.137 - 0.154 - 0.161 - 0.159 - 0.157 - Obs. 318 - 318 - 318 - 165 - 165 - 165 -
GENERAL MACHINERYConstant 3.004 0.00 2.975 0.00 2.968 0.00 3.689 0.00 3.655 0.00 3.695 0.00ln(EN/E) 0.114 0.04 0.112 0.05 0.105 0.06 0.137 0.03 0.138 0.03 0.131 0.04ln(K/E) 0.408 0.00 0.415 0.00 0.413 0.00 0.368 0.00 0.377 0.00 0.365 0.00Df 0.397 0.01 - - - - 0.021 0.88 - - - - Dftr - - 0.348 0.03 - - - - -0.026 0.86 - - Dfeu - - - - 0.635 0.08 - - - - 0.132 0.67Dfus - - - - -0.619 0.32 - - - - -1.118 0.03Dfjp - - - - 0.359 0.04 - - - - 0.017 0.92Dfn3 - - 0.551 0.06 0.552 0.06 - - 0.344 0.24 0.342 0.24Dfot - - 0.440 0.11 0.445 0.11 - - -0.028 0.92 -0.026 0.92Dold -0.104 0.42 -0.097 0.45 -0.105 0.41 -0.142 0.32 -0.132 0.35 -0.156 0.27Dlarge 0.582 0.03 0.598 0.03 0.593 0.03 0.443 0.14 0.477 0.12 0.454 0.13F-test 31.75 0.00 22.59 0.00 18.01 0.00 14.09 0.00 10.26 0.00 8.71 0.00White 11.46 0.78 13.64 0.98 16.44 0.99 16.86 0.39 22.61 0.54 33.05 0.32Adj. R-sq. 0.407 - 0.403 - 0.406 - 0.330 - 0.328 - 0.343 - Obs. 225 - 225 - 225 - 134 - 134 - 134 -
66

Appendix Table 5 (continued, 6/7)All plants Large plants with Output >=25 million baht
Indepen- Equation 1 Equation 2 Equation 3 Equation 1 Equation 2 Equation 3dent Coeffi- Sig- Coeffi- Sig- Coeffi- Sig- Coeffi- Sig- Coeffi- Sig- Coeffi- Sig-Variables, cients, nifi- cients, nifi- cients, nifi- cients, nifi- cients, nifi- cients, nifi-Indicator etc. cance etc. cance etc. cance etc. cance etc. cance etc. cance
ELECTRIC MACHINERY, ETC. (INCL. OFFICE & COMPUTING MACHINERY, PRECISION MACHINERY)Constant 3.616 0.00 3.604 0.00 3.669 0.00 3.880 0.00 3.867 0.00 4.034 0.00ln(EN/E) 0.159 0.01 0.156 0.01 0.178 0.01 0.129 0.07 0.125 0.08 0.172 0.02ln(K/E) 0.259 0.00 0.260 0.00 0.251 0.00 0.249 0.00 0.250 0.00 0.222 0.00Df 0.310 0.03 - - - - 0.142 0.40 - - - - Dftr - - 0.284 0.08 - - - - 0.125 0.50 - - Dfeu - - - - 0.574 0.21 - - - - 0.810 0.13Dfus - - - - -0.481 0.16 - - - - -0.688 0.04Dfjp - - - - 0.372 0.03 - - - - 0.253 0.18Dfn3 - - 0.321 0.09 0.327 0.08 - - 0.118 0.56 0.141 0.48Dfot - - 0.417 0.16 0.417 0.16 - - 0.340 0.28 0.360 0.24Dold 0.002 0.99 0.003 0.99 0.032 0.84 0.043 0.80 0.049 0.78 0.103 0.55Dlarge 0.443 0.13 0.451 0.12 0.568 0.05 0.346 0.25 0.348 0.25 0.464 0.12F-test 11.74 0.00 8.36 0.00 7.33 0.00 6.23 0.00 4.50 0.00 4.73 0.00White 2.54 1.00 17.63 0.89 22.49 0.93 5.62 0.99 21.54 0.71 24.15 0.89Adj. R-sq. 0.165 - 0.160 - 0.174 - 0.111 - 0.104 - 0.138 - Obs. 272 - 272 - 272 - 211 - 211 - 211 -
MOTOR VEHICLESConstant 4.079 0.00 4.145 0.00 4.146 0.00 5.072 0.00 5.407 0.00 5.427 0.00ln(EN/E) 0.175 0.03 0.173 0.03 0.173 0.03 0.293 0.00 0.308 0.00 0.307 0.00ln(K/E) 0.090 0.17 0.067 0.33 0.067 0.33 0.028 0.71 -0.057 0.49 -0.062 0.47Df 0.860 0.00 - - - - 0.370 0.07 - - - - Dftr - - 0.971 0.00 - - - - 0.570 0.01 - - Dfeu - - - - 0.406 0.69 - - - - -0.003 1.00Dfus - - - - 1.019 0.32 - - - - 0.449 0.57Dfjp - - - - 0.983 0.00 - - - - 0.593 0.01Dfn3 - - 0.527 0.31 0.528 0.31 - - -0.030 0.94 -0.030 0.94Dfot - - 0.333 0.58 0.333 0.58 - - -0.613 0.30 -0.619 0.30Dold -0.179 0.33 -0.154 0.41 -0.157 0.40 0.032 0.87 0.110 0.58 0.101 0.61Dlarge 1.732 0.00 1.683 0.01 1.671 0.01 1.635 0.00 1.600 0.00 1.589 0.00F-test 14.95 0.00 10.87 0.00 8.39 0.00 7.74 0.00 6.44 0.00 4.99 0.00White 7.70 0.94 9.62 0.99 9.75 1.00 18.27 0.25 25.35 0.28 25.44 0.33Adj. R-sq. 0.316 - 0.314 - 0.306 - 0.291 - 0.317 - 0.304 - Obs. 152 - 152 - 152 - 83 - 83 - 83 -
67

Appendix Table 5 (continued, 7/7)All plants Large plants with Output >=25 million baht
Indepen- Equation 1 Equation 2 Equation 3 Equation 1 Equation 2 Equation 3dent Coeffi- Sig- Coeffi- Sig- Coeffi- Sig- Coeffi- Sig- Coeffi- Sig- Coeffi- Sig-Variables, cients, nifi- cients, nifi- cients, nifi- cients, nifi- cients, nifi- cients, nifi-Indicator etc. cance etc. cance etc. cance etc. cance etc. cance etc. cance
FURNITUREConstant 2.417 0.00 2.407 0.00 2.425 0.00 3.518 0.00 3.466 0.00 3.469 0.00ln(EN/E) 0.185 0.04 0.187 0.04 0.195 0.03 0.053 0.54 0.055 0.52 0.060 0.50ln(K/E) 0.579 0.00 0.580 0.00 0.584 0.00 0.305 0.00 0.319 0.00 0.323 0.00Df 0.167 0.61 - - - - -0.708 0.00 - - - - Dftr - - 0.217 0.62 - - - - -0.787 0.01 - - Dfeu - - - - -1.032 0.44 - - - - -1.104 0.20Dfus - - - - 0.186 0.89 - - - - -0.807 0.35Dfjp - - - - 0.375 0.44 - - - - -0.731 0.04Dfn3 - - 0.285 0.61 0.281 0.62 - - -0.397 0.31 -0.396 0.32Dfot - - -0.420 0.66 -0.419 0.66 - - -1.523 0.07 -1.522 0.08Dold -0.435 0.05 -0.406 0.07 -0.415 0.07 -0.288 0.13 -0.234 0.23 -0.242 0.23Dlarge 0.497 0.15 0.484 0.17 0.465 0.18 0.275 0.35 0.239 0.42 0.238 0.43F-test 22.19 0.00 15.76 0.00 12.29 0.00 4.69 0.00 3.57 0.00 2.73 0.01White 19.08 0.32 19.65 0.66 19.93 0.75 10.34 0.89 10.06 0.98 12.65 0.96Adj. R-sq. 0.388 - 0.382 - 0.378 - 0.178 - 0.175 - 0.155 - Obs. 168 - 168 - 168 - 86 - 86 - 86 -
JEWELRYConstant 3.635 0.00 3.638 0.00 3.664 0.00 Not estimated because there wereln(EN/E) 0.039 0.79 0.039 0.79 0.028 0.85 less than 30 observationsln(K/E) -0.001 0.99 -0.003 0.98 -0.039 0.82 - - - - - - Df 0.936 0.02 - - - - - - - - - - Dftr - - 0.950 0.03 - - - - - - - - Dfeu - - - - 0.927 0.11 - - - - - - Dfus - - - - 0.907 0.09 - - - - - - Dfjp - - - - 1.492 0.12 - - - - - - Dfn3 - - - - - - - - - - - - Dfot - - 0.914 0.08 0.938 0.08 - - - - - - Dold 0.540 0.20 0.543 0.21 0.594 0.19 - - - - - - Dlarge 1.307 0.09 1.317 0.09 1.362 0.09 - - - - - - F-test 4.20 0.00 3.41 0.01 2.51 0.03 - - - - - - White 8.66 0.89 9.52 0.96 - 0.69 - - - - - - Adj. R-sq. 0.267 - 0.248 - 0.215 - - - - - - - Obs. 45 - 45 - 45 - 27 - 27 - 27 - Notes: Heteroscedasticity-consistent standard errors used if White is significant at 0.05 or less.If White cannot be calculated, the significance of the LM heteroscedasticity test is reported and used.- = not relevant or no plants in this category; n<30 = sample size smaller than 30.
68

Appendix Table 6: Estimates of Compensation per Hour (dependent variable = ln(W/E)), 1998All plants Large plants with Output >=25 million baht
Indepen- Equation 1 Equation 2 Equation 3 Equation 1 Equation 2 Equation 3dent Coeffi- Sig- Coeffi- Sig- Coeffi- Sig- Coeffi- Sig- Coeffi- Sig- Coeffi- Sig-Variables, cients, nifi- cients, nifi- cients, nifi- cients, nifi- cients, nifi- cients, nifi-Indicator etc. cance etc. cance etc. cance etc. cance etc. cance etc. cance
FOODConstant 2.756 0.00 2.758 0.00 2.764 0.00 2.942 0.00 2.947 0.00 2.957 0.00ln(EN/E) 0.076 0.00 0.076 0.00 0.075 0.00 0.067 0.01 0.067 0.01 0.064 0.01ln(K/E) 0.072 0.00 0.072 0.00 0.070 0.00 0.053 0.01 0.053 0.01 0.049 0.02Df 0.391 0.00 - - - - 0.292 0.00 - - - - Dftr - - 0.412 0.00 - - - - 0.312 0.00 - - Dfeu - - - - 0.542 0.01 - - - - 0.416 0.05Dfus - - - - 0.977 0.00 - - - - 0.867 0.00Dfjp - - - - 0.270 0.00 - - - - 0.156 0.13Dfn3 - - 0.326 0.01 0.324 0.01 - - 0.233 0.06 0.228 0.07Dfot - - 0.420 0.00 0.420 0.00 - - 0.313 0.05 0.307 0.06Dold 0.099 0.02 0.096 0.02 0.094 0.03 0.114 0.04 0.110 0.05 0.104 0.06Dlarge 0.120 0.19 0.119 0.20 0.127 0.17 -0.042 0.72 -0.042 0.72 -0.013 0.91F-test 22.85 0.00 16.36 0.00 14.03 0.00 7.31 0.00 5.25 0.00 5.30 0.00White 18.44 0.36 19.99 0.83 26.92 0.89 19.95 0.28 22.90 0.69 26.64 0.84Adj. R-sq. 0.102 - 0.101 - 0.109 - 0.054 - 0.052 - 0.066 - Obs. 960 - 960 - 960 - 549 - 549 - 549 -
TEXTILESConstant 2.966 0.00 2.980 0.00 2.969 0.00 3.175 0.00 3.204 0.00 3.189 0.00ln(EN/E) 0.230 0.00 0.239 0.00 0.239 0.00 0.162 0.01 0.178 0.01 0.180 0.01ln(K/E) 0.170 0.00 0.177 0.00 0.183 0.00 0.055 0.22 0.063 0.15 0.070 0.11Df 0.190 0.14 - - - - 0.244 0.08 - - - - Dftr - - 0.010 0.95 - - - - 0.141 0.40 - - Dfeu - - - - 0.514 0.10 - - - - 0.425 0.03Dfus - - - - -0.327 0.38 - - - - -0.053 0.88Dfjp - - - - -0.007 0.97 - - - - 0.128 0.50Dfn3 - - 0.154 0.60 0.149 0.61 - - 0.119 0.74 0.117 0.74Dfot - - 0.511 0.08 0.517 0.07 - - 0.550 0.12 0.557 0.11Dold 0.051 0.56 0.026 0.78 0.022 0.81 -0.100 0.43 -0.134 0.26 -0.136 0.25Dlarge -0.113 0.62 -0.149 0.46 -0.178 0.38 0.154 0.49 0.119 0.66 0.094 0.73F-test 21.83 0.00 16.21 0.00 12.80 0.00 3.37 0.01 2.79 0.01 2.22 0.02White 38.03 0.00 60.91 0.00 61.41 0.00 18.57 0.35 49.21 0.01 49.60 0.03Adj. R-sq. 0.243 - 0.247 - 0.246 - 0.063 - 0.066 - 0.058 - Obs. 326 - 326 - 326 - 178 - 178 - 178 -
69

Appendix Table 6 (continued, 2/7)All plants Large plants with Output >=25 million baht
Indepen- Equation 1 Equation 2 Equation 3 Equation 1 Equation 2 Equation 3dent Coeffi- Sig- Coeffi- Sig- Coeffi- Sig- Coeffi- Sig- Coeffi- Sig- Coeffi- Sig-Variables, cients, nifi- cients, nifi- cients, nifi- cients, nifi- cients, nifi- cients, nifi-Indicator etc. cance etc. cance etc. cance etc. cance etc. cance etc. cance
APPARELConstant 3.183 0.00 3.199 0.00 3.212 0.00 3.080 0.00 3.194 0.00 3.199 0.00ln(EN/E) 0.161 0.00 0.161 0.00 0.163 0.00 0.033 0.64 0.068 0.36 0.069 0.37ln(K/E) 0.045 0.26 0.039 0.32 0.035 0.38 0.027 0.56 0.026 0.56 0.025 0.59Df 0.378 0.01 - - - - 0.383 0.00 - - - - Dftr - - 0.360 0.06 - - - - 0.263 0.09 - - Dfeu - - - - 0.031 0.95 - - - - 0.221 0.57Dfus - - - - - - - - - - - - Dfjp - - - - 0.411 0.04 - - - - 0.269 0.10Dfn3 - - -0.024 0.93 -0.032 0.91 - - 0.250 0.33 0.252 0.34Dfot - - 0.606 0.00 0.595 0.00 - - 0.657 0.00 0.653 0.00Dold 0.307 0.02 0.271 0.04 0.273 0.04 0.251 0.05 0.212 0.10 0.212 0.10Dlarge 0.436 0.10 0.418 0.12 0.477 0.09 0.021 0.94 -0.136 0.63 -0.121 0.70F-test 10.47 0.00 8.12 0.00 7.15 0.00 3.91 0.00 3.40 0.00 2.93 0.01White 8.19 0.96 20.35 0.73 20.32 0.82 19.99 0.17 29.02 0.18 29.23 0.25Adj. R-sq. 0.239 - 0.248 - 0.246 - 0.168 - 0.189 - 0.177 - Obs. 152 - 152 - 152 - 73 - 73 - 73 -
LEATHER & FOOTWEARConstant 3.181 0.00 3.171 0.00 3.160 0.00 3.289 0.00 3.252 0.00 3.234 0.00ln(EN/E) 0.085 0.02 0.082 0.02 0.080 0.04 0.082 0.11 0.074 0.14 0.072 0.15ln(K/E) 0.074 0.01 0.075 0.00 0.077 0.01 0.045 0.25 0.050 0.20 0.056 0.15Df 0.188 0.08 - - - - 0.257 0.03 - - - - Dftr - - 0.284 0.27 - - - - 0.302 0.16 - - Dfeu - - - - 0.264 0.58 - - - - - - Dfus - - - - -0.124 0.72 - - - - -0.074 0.83Dfjp - - - - 0.489 0.04 - - - - 0.551 0.05Dfn3 - - 0.213 0.31 0.217 0.15 - - 0.393 0.02 0.396 0.02Dfot - - 0.000 1.00 -0.005 0.98 - - -0.027 0.90 -0.033 0.88Dold 0.228 0.01 0.231 0.01 0.214 0.01 0.301 0.00 0.306 0.00 0.281 0.00Dlarge -0.121 0.37 -0.115 0.43 -0.079 0.57 -0.279 0.07 -0.258 0.09 -0.217 0.16F-test 5.98 0.00 4.40 0.00 3.67 0.00 3.99 0.00 3.24 0.00 3.12 0.00White 25.65 0.08 44.82 0.01 35.20 0.16 24.39 0.11 29.87 0.27 21.80 0.70Adj. R-sq. 0.136 - 0.131 - 0.132 - 0.120 - 0.125 - 0.133 - Obs. 159 - 159 - 159 - 111 - 111 - 111 -
70

Appendix Table 6 (continued, 3/7)All plants Large plants with Output >=25 million baht
Indepen- Equation 1 Equation 2 Equation 3 Equation 1 Equation 2 Equation 3dent Coeffi- Sig- Coeffi- Sig- Coeffi- Sig- Coeffi- Sig- Coeffi- Sig- Coeffi- Sig-Variables, cients, nifi- cients, nifi- cients, nifi- cients, nifi- cients, nifi- cients, nifi-Indicator etc. cance etc. cance etc. cance etc. cance etc. cance etc. cance
CHEMICALS & PRODUCTSConstant 3.585 0.00 3.598 0.00 3.592 0.00 3.578 0.00 3.606 0.00 3.592 0.00ln(EN/E) 0.118 0.01 0.114 0.01 0.108 0.01 0.090 0.12 0.086 0.12 0.074 0.18ln(K/E) 0.011 0.71 0.007 0.83 0.007 0.82 0.012 0.73 0.004 0.90 0.005 0.90Df 0.315 0.00 - - - - 0.335 0.00 - - - - Dftr - - 0.397 0.00 - - - - 0.414 0.00 - - Dfeu - - - - 0.639 0.07 - - - - 0.651 0.06Dfus - - - - 0.601 0.02 - - - - 0.695 0.01Dfjp - - - - 0.259 0.06 - - - - 0.255 0.10Dfn3 - - 0.148 0.30 0.146 0.31 - - 0.139 0.41 0.136 0.42Dfot - - 0.332 0.12 0.329 0.13 - - 0.379 0.11 0.375 0.12Dold 0.149 0.09 0.141 0.11 0.129 0.14 0.138 0.20 0.125 0.24 0.108 0.31Dlarge 0.559 0.11 0.555 0.11 0.566 0.10 0.329 0.31 0.344 0.28 0.347 0.28F-test 8.01 0.00 6.02 0.00 5.06 0.00 3.93 0.00 3.10 0.00 2.84 0.00White 54.91 0.00 61.29 0.00 84.30 0.00 32.64 0.01 44.52 0.01 69.42 0.00Adj. R-sq. 0.107 - 0.107 - 0.111 - 0.064 - 0.064 - 0.072 - Obs. 294 - 294 - 294 - 216 - 216 - 216 -
RUBBER PRODUCTSConstant 3.571 0.00 3.604 0.00 3.587 0.00 2.875 0.00 2.928 0.00 2.901 0.00ln(EN/E) 0.109 0.16 0.128 0.06 0.129 0.06 0.116 0.07 0.133 0.04 0.133 0.04ln(K/E) 0.269 0.00 0.275 0.00 0.282 0.00 0.132 0.01 0.128 0.02 0.136 0.01Df 0.112 0.52 - - - - -0.044 0.72 - - - - Dftr - - -0.246 0.32 - - - - -0.231 0.21 - - Dfeu - - - - 0.225 0.66 - - - - -0.072 0.84Dfus - - - - 0.115 0.80 - - - - 0.153 0.65Dfjp - - - - -0.550 0.08 - - - - -0.447 0.05Dfn3 - - 0.666 0.02 0.654 0.02 - - 0.268 0.21 0.263 0.22Dfot - - 0.048 0.85 0.040 0.87 - - -0.087 0.63 -0.089 0.62Dold -0.116 0.37 -0.138 0.31 -0.144 0.29 0.076 0.51 0.059 0.60 0.060 0.60Dlarge 0.272 0.27 0.360 0.14 0.404 0.11 0.074 0.72 0.185 0.38 0.183 0.40F-test 9.32 0.00 7.84 0.00 6.43 0.00 3.26 0.01 2.88 0.01 2.57 0.01White 27.77 0.05 36.00 0.12 37.01 0.33 14.04 0.66 20.14 0.78 43.63 0.10Adj. R-sq. 0.181 - 0.203 - 0.206 - 0.073 - 0.084 - 0.089 - Obs. 189 - 189 - 189 - 145 - 145 - 145 -
71

Appendix Table 6 (continued, 4/7)All plants Large plants with Output >=25 million baht
Indepen- Equation 1 Equation 2 Equation 3 Equation 1 Equation 2 Equation 3dent Coeffi- Sig- Coeffi- Sig- Coeffi- Sig- Coeffi- Sig- Coeffi- Sig- Coeffi- Sig-Variables, cients, nifi- cients, nifi- cients, nifi- cients, nifi- cients, nifi- cients, nifi-Indicator etc. cance etc. cance etc. cance etc. cance etc. cance etc. cance
PLASTICS & PRODUCTSConstant 2.784 0.00 2.798 0.00 2.805 0.00 2.763 0.00 2.793 0.00 2.782 0.00ln(EN/E) 0.067 0.13 0.069 0.13 0.069 0.13 0.033 0.63 0.035 0.61 0.030 0.67ln(K/E) 0.082 0.07 0.079 0.09 0.077 0.11 0.063 0.37 0.057 0.43 0.058 0.44Df 0.285 0.01 - - - - 0.261 0.06 - - - - Dftr - - 0.319 0.03 - - - - 0.269 0.15 - - Dfeu - - - - 0.171 0.74 - - - - -0.216 0.15Dfus - - - - 0.594 0.41 - - - - 0.534 0.02Dfjp - - - - 0.318 0.04 - - - - 0.276 0.18Dfn3 - - 0.209 0.23 0.208 0.23 - - 0.195 0.28 0.194 0.28Dfot - - 0.322 0.12 0.324 0.12 - - 0.340 0.30 0.344 0.29Dold 0.236 0.05 0.236 0.05 0.227 0.07 0.268 0.15 0.250 0.20 0.237 0.24Dlarge -0.108 0.54 -0.106 0.55 -0.103 0.56 -0.049 0.87 -0.045 0.89 -0.043 0.89F-test 3.31 0.01 2.39 0.02 1.87 0.06 1.33 0.26 0.96 0.46 0.80 0.62White 15.54 0.56 27.29 0.45 29.67 0.48 28.82 0.04 45.53 0.01 50.23 0.01Adj. R-sq. 0.056 - 0.048 - 0.039 - 0.014 - -0.002 - -0.015 - Obs. 194 - 194 - 194 - 119 - 119 - 119 -
NON-METALLIC MINERAL PRODUCTSConstant 3.020 0.00 3.007 0.00 3.009 0.00 2.952 0.00 2.924 0.00 2.930 0.00ln(EN/E) 0.113 0.00 0.114 0.00 0.114 0.00 0.071 0.06 0.083 0.03 0.083 0.03ln(K/E) 0.105 0.00 0.109 0.00 0.109 0.00 0.115 0.00 0.128 0.00 0.128 0.00Df 0.481 0.00 - - - - 0.485 0.00 - - - - Dftr - - 0.566 0.00 - - - - 0.528 0.00 - - Dfeu - - - - 0.590 0.02 - - - - 0.584 0.01Dfus - - - - 0.900 0.01 - - - - 0.869 0.00Dfjp - - - - 0.400 0.08 - - - - 0.351 0.06Dfn3 - - 0.610 0.00 0.611 0.00 - - 0.708 0.00 0.707 0.00Dfot - - -0.176 0.56 -0.175 0.56 - - -0.399 0.19 -0.391 0.20Dold 0.066 0.34 0.067 0.33 0.061 0.38 0.120 0.18 0.109 0.21 0.096 0.27Dlarge 0.001 1.00 -0.007 0.97 -0.018 0.93 -0.178 0.44 -0.111 0.63 -0.155 0.51F-test 17.06 0.00 13.08 0.00 10.35 0.00 9.11 0.00 8.25 0.00 6.75 0.00White 4.03 1.00 4.26 1.00 4.50 1.00 16.27 0.51 26.48 0.38 31.43 0.59Adj. R-sq. 0.143 - 0.149 - 0.149 - 0.169 - 0.202 - 0.206 - Obs. 483 - 483 - 483 - 201 - 201 - 201 -
72

Appendix Table 6 (continued, 5/7)All plants Large plants with Output >=25 million baht
Indepen- Equation 1 Equation 2 Equation 3 Equation 1 Equation 2 Equation 3dent Coeffi- Sig- Coeffi- Sig- Coeffi- Sig- Coeffi- Sig- Coeffi- Sig- Coeffi- Sig-Variables, cients, nifi- cients, nifi- cients, nifi- cients, nifi- cients, nifi- cients, nifi-Indicator etc. cance etc. cance etc. cance etc. cance etc. cance etc. cance
METAL PRODUCTSConstant 3.241 0.00 3.290 0.00 3.297 0.00 3.310 0.00 3.346 0.00 3.347 0.00ln(EN/E) 0.054 0.06 0.060 0.03 0.060 0.03 0.047 0.29 0.053 0.24 0.052 0.25ln(K/E) 0.086 0.00 0.076 0.00 0.072 0.00 0.091 0.01 0.085 0.01 0.084 0.01Df 0.159 0.05 - - - - 0.163 0.11 - - - - Dftr - - 0.285 0.00 - - - - 0.225 0.06 - - Dfeu - - - - 0.396 0.21 - - - - 0.295 0.60Dfus - - - - -0.191 0.72 - - - - - - Dfjp - - - - 0.295 0.00 - - - - 0.223 0.06Dfn3 - - -0.054 0.67 -0.051 0.69 - - 0.033 0.85 0.033 0.85Dfot - - 0.055 0.79 0.058 0.78 - - 0.125 0.66 0.125 0.66Dold 0.131 0.06 0.121 0.08 0.128 0.06 0.056 0.57 0.054 0.58 0.054 0.59Dlarge -0.106 0.48 -0.073 0.62 -0.073 0.63 -0.201 0.31 -0.200 0.32 -0.198 0.32F-test 7.01 0.00 5.84 0.00 4.63 0.00 3.31 0.01 2.50 0.02 2.18 0.03White 22.05 0.18 26.28 0.50 29.72 0.53 13.69 0.69 18.92 0.84 20.11 0.83Adj. R-sq. 0.087 - 0.097 - 0.093 - 0.066 - 0.060 - 0.054 - Obs. 318 - 318 - 318 - 165 - 165 - 165 -
GENERAL MACHINERYConstant 3.091 0.00 3.101 0.00 3.123 0.00 3.134 0.00 3.126 0.00 3.189 0.00ln(EN/E) 0.066 0.05 0.067 0.05 0.068 0.05 0.071 0.10 0.071 0.10 0.074 0.09ln(K/E) 0.156 0.00 0.154 0.00 0.149 0.00 0.167 0.00 0.168 0.00 0.155 0.00Df 0.247 0.00 - - - - 0.195 0.04 - - - - Dftr - - 0.261 0.01 - - - - 0.185 0.08 - - Dfeu - - - - 0.180 0.41 - - - - 0.087 0.69Dfus - - - - -0.204 0.58 - - - - -0.279 0.44Dfjp - - - - 0.307 0.00 - - - - 0.236 0.04Dfn3 - - 0.271 0.12 0.274 0.11 - - 0.229 0.26 0.229 0.26Dfot - - 0.171 0.30 0.174 0.29 - - 0.212 0.27 0.212 0.27Dold 0.083 0.28 0.082 0.28 0.076 0.32 0.151 0.12 0.153 0.12 0.137 0.17Dlarge 0.162 0.30 0.157 0.32 0.127 0.43 0.033 0.87 0.040 0.85 0.011 0.96F-test 15.87 0.00 11.28 0.00 9.00 0.00 7.76 0.00 5.47 0.00 4.50 0.00White 10.75 0.82 14.21 0.97 15.98 0.99 8.78 0.92 13.62 0.95 14.14 0.99Adj. R-sq. 0.249 - 0.243 - 0.243 - 0.203 - 0.190 - 0.191 - Obs. 225 - 225 - 225 - 134 - 134 - 134 -
73
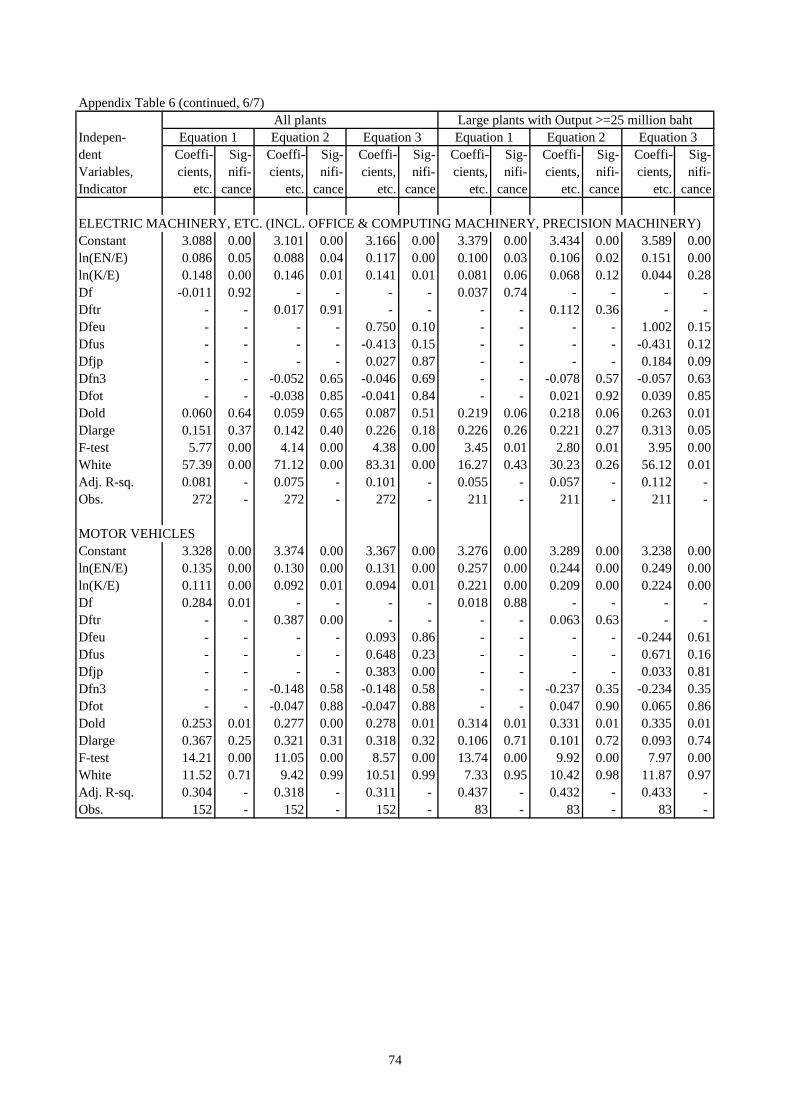
Appendix Table 6 (continued, 6/7)All plants Large plants with Output >=25 million baht
Indepen- Equation 1 Equation 2 Equation 3 Equation 1 Equation 2 Equation 3dent Coeffi- Sig- Coeffi- Sig- Coeffi- Sig- Coeffi- Sig- Coeffi- Sig- Coeffi- Sig-Variables, cients, nifi- cients, nifi- cients, nifi- cients, nifi- cients, nifi- cients, nifi-Indicator etc. cance etc. cance etc. cance etc. cance etc. cance etc. cance
ELECTRIC MACHINERY, ETC. (INCL. OFFICE & COMPUTING MACHINERY, PRECISION MACHINERY)Constant 3.088 0.00 3.101 0.00 3.166 0.00 3.379 0.00 3.434 0.00 3.589 0.00ln(EN/E) 0.086 0.05 0.088 0.04 0.117 0.00 0.100 0.03 0.106 0.02 0.151 0.00ln(K/E) 0.148 0.00 0.146 0.01 0.141 0.01 0.081 0.06 0.068 0.12 0.044 0.28Df -0.011 0.92 - - - - 0.037 0.74 - - - - Dftr - - 0.017 0.91 - - - - 0.112 0.36 - - Dfeu - - - - 0.750 0.10 - - - - 1.002 0.15Dfus - - - - -0.413 0.15 - - - - -0.431 0.12Dfjp - - - - 0.027 0.87 - - - - 0.184 0.09Dfn3 - - -0.052 0.65 -0.046 0.69 - - -0.078 0.57 -0.057 0.63Dfot - - -0.038 0.85 -0.041 0.84 - - 0.021 0.92 0.039 0.85Dold 0.060 0.64 0.059 0.65 0.087 0.51 0.219 0.06 0.218 0.06 0.263 0.01Dlarge 0.151 0.37 0.142 0.40 0.226 0.18 0.226 0.26 0.221 0.27 0.313 0.05F-test 5.77 0.00 4.14 0.00 4.38 0.00 3.45 0.01 2.80 0.01 3.95 0.00White 57.39 0.00 71.12 0.00 83.31 0.00 16.27 0.43 30.23 0.26 56.12 0.01Adj. R-sq. 0.081 - 0.075 - 0.101 - 0.055 - 0.057 - 0.112 - Obs. 272 - 272 - 272 - 211 - 211 - 211 -
MOTOR VEHICLESConstant 3.328 0.00 3.374 0.00 3.367 0.00 3.276 0.00 3.289 0.00 3.238 0.00ln(EN/E) 0.135 0.00 0.130 0.00 0.131 0.00 0.257 0.00 0.244 0.00 0.249 0.00ln(K/E) 0.111 0.00 0.092 0.01 0.094 0.01 0.221 0.00 0.209 0.00 0.224 0.00Df 0.284 0.01 - - - - 0.018 0.88 - - - - Dftr - - 0.387 0.00 - - - - 0.063 0.63 - - Dfeu - - - - 0.093 0.86 - - - - -0.244 0.61Dfus - - - - 0.648 0.23 - - - - 0.671 0.16Dfjp - - - - 0.383 0.00 - - - - 0.033 0.81Dfn3 - - -0.148 0.58 -0.148 0.58 - - -0.237 0.35 -0.234 0.35Dfot - - -0.047 0.88 -0.047 0.88 - - 0.047 0.90 0.065 0.86Dold 0.253 0.01 0.277 0.00 0.278 0.01 0.314 0.01 0.331 0.01 0.335 0.01Dlarge 0.367 0.25 0.321 0.31 0.318 0.32 0.106 0.71 0.101 0.72 0.093 0.74F-test 14.21 0.00 11.05 0.00 8.57 0.00 13.74 0.00 9.92 0.00 7.97 0.00White 11.52 0.71 9.42 0.99 10.51 0.99 7.33 0.95 10.42 0.98 11.87 0.97Adj. R-sq. 0.304 - 0.318 - 0.311 - 0.437 - 0.432 - 0.433 - Obs. 152 - 152 - 152 - 83 - 83 - 83 -
74

Appendix Table 6 (continued, 7/7)All plants Large plants with Output >=25 million baht
Indepen- Equation 1 Equation 2 Equation 3 Equation 1 Equation 2 Equation 3dent Coeffi- Sig- Coeffi- Sig- Coeffi- Sig- Coeffi- Sig- Coeffi- Sig- Coeffi- Sig-Variables, cients, nifi- cients, nifi- cients, nifi- cients, nifi- cients, nifi- cients, nifi-Indicator etc. cance etc. cance etc. cance etc. cance etc. cance etc. cance
FURNITUREConstant 2.591 0.00 2.606 0.00 2.622 0.00 3.470 0.00 3.490 0.00 3.490 0.00ln(EN/E) 0.302 0.00 0.301 0.00 0.309 0.00 0.211 0.00 0.211 0.00 0.216 0.00ln(K/E) 0.422 0.00 0.420 0.00 0.423 0.00 0.134 0.03 0.130 0.03 0.134 0.03Df 0.502 0.02 - - - - -0.042 0.78 - - - - Dftr - - 0.530 0.10 - - - - -0.076 0.69 - - Dfeu - - - - -0.638 0.00 - - - - -0.366 0.49Dfus - - - - 0.578 0.00 - - - - -0.069 0.90Dfjp - - - - 0.669 0.07 - - - - -0.029 0.89Dfn3 - - 0.251 0.33 0.248 0.34 - - -0.076 0.75 -0.076 0.75Dfot - - 1.093 0.00 1.093 0.00 - - 0.363 0.48 0.363 0.49Dold -0.500 0.01 -0.535 0.01 -0.543 0.00 -0.093 0.43 -0.112 0.35 -0.118 0.34Dlarge 0.282 0.07 0.299 0.06 0.282 0.09 0.150 0.40 0.153 0.40 0.152 0.41F-test 29.72 0.00 21.24 0.00 16.63 0.00 5.35 0.00 3.86 0.00 2.98 0.00White 39.94 0.00 40.82 0.01 41.03 0.02 11.01 0.86 11.55 0.95 11.63 0.98Adj. R-sq. 0.462 - 0.459 - 0.457 - 0.204 - 0.191 - 0.173 - Obs. 168 - 168 - 168 - 86 - 86 - 86 -
JEWELRYConstant 2.757 0.00 2.759 0.00 2.778 0.00 Not estimated because there wereln(EN/E) 0.048 0.52 0.048 0.53 0.040 0.61 less than 30 observationsln(K/E) 0.232 0.01 0.231 0.01 0.204 0.03 - - - - - - Df 0.363 0.06 - - - - - - - - - - Dftr - - 0.370 0.10 - - - - - - - - Dfeu - - - - 0.354 0.23 - - - - - - Dfus - - - - 0.338 0.21 - - - - - - Dfjp - - - - 0.770 0.12 - - - - - - Dfn3 - - - - - - - - - - - - Dfot - - 0.352 0.18 0.370 0.17 - - - - - - Dold 0.243 0.26 0.244 0.27 0.282 0.22 - - - - - - Dlarge 0.347 0.37 0.352 0.38 0.385 0.34 - - - - - - F-test 7.92 0.00 6.43 0.00 4.79 0.00 - - - - - - White 8.43 0.91 12.14 0.88 - 0.22 - - - - - - Adj. R-sq. 0.440 - 0.426 - 0.408 - - - - - - - Obs. 45 - 45 - 45 - 27 - 27 - 27 - Notes: Heteroscedasticity-consistent standard errors used if White is significant at 0.05 or less.If White cannot be calculated, the significance of the LM heteroscedasticity test is reported and used.- = not relevant or no plants in this category; n<30 = sample size smaller than 30.
75

Appendix Table 7: Estimates of Value Added per Hour (dependent variable = ln(V/E)), 2000All plants Large plants with Output >=25 million baht
Indepen- Equation 1 Equation 2 Equation 3 Equation 1 Equation 2 Equation 3dent Coeffi- Sig- Coeffi- Sig- Coeffi- Sig- Coeffi- Sig- Coeffi- Sig- Coeffi- Sig-Variables, cients, nifi- cients, nifi- cients, nifi- cients, nifi- cients, nifi- cients, nifi-Indicator etc. cance etc. cance etc. cance etc. cance etc. cance etc. cance
FOODConstant -4.138 0.00 -4.127 0.00 -4.128 0.00 -3.619 0.00 -3.597 0.00 -3.599 0.00ln(EN/E) 0.107 0.00 0.112 0.00 0.112 0.00 0.074 0.14 0.082 0.11 0.083 0.11ln(K/E) 0.335 0.00 0.336 0.00 0.335 0.00 0.268 0.00 0.268 0.00 0.267 0.00Df 0.187 0.19 - - - - 0.017 0.91 - - - - Dftr - - 0.145 0.42 - - - - -0.013 0.94 - - Dfeu - - - - -0.634 0.33 - - - - -0.709 0.05Dfus - - - - 0.875 0.08 - - - - 0.670 0.22Dfjp - - - - 0.253 0.12 - - - - 0.093 0.65Dfn3 - - 0.579 0.00 0.570 0.00 - - 0.381 0.25 0.379 0.25Dfot - - -0.238 0.40 -0.236 0.40 - - -0.388 0.36 -0.386 0.36Dboi -0.058 0.60 -0.049 0.66 -0.067 0.55 -0.256 0.08 -0.249 0.09 -0.263 0.07Dold 0.120 0.19 0.117 0.21 0.120 0.19 0.152 0.20 0.146 0.22 0.152 0.20Dlarge 0.254 0.14 0.243 0.16 0.323 0.04 -0.011 0.95 -0.017 0.93 0.036 0.85F-test 23.20 0.00 17.74 0.00 14.93 0.00 7.20 0.00 5.69 0.00 5.17 0.00White 50.27 0.00 55.31 0.02 71.85 0.01 20.43 0.62 23.43 0.93 33.76 0.89Adj. R-sq. 0.184 - 0.185 - 0.191 - 0.095 - 0.096 - 0.106 - Obs. 591 - 591 - 591 - 354 - 354 - 354 -
TEXTILESConstant -3.825 0.00 -3.817 0.00 -3.814 0.00 -3.380 0.00 -3.336 0.00 -3.358 0.00ln(EN/E) 0.254 0.00 0.257 0.00 0.260 0.00 0.065 0.59 0.072 0.56 0.070 0.57ln(K/E) 0.277 0.00 0.275 0.00 0.277 0.00 0.033 0.69 0.024 0.77 0.034 0.70Df 0.359 0.12 - - - - 0.481 0.06 - - - - Dftr - - 0.422 0.21 - - - - 0.603 0.09 - - Dfeu - - - - 0.879 0.24 - - - - 1.391 0.18Dfus - - - - 0.435 0.68 - - - - 0.413 0.70Dfjp - - - - 0.302 0.44 - - - - 0.515 0.19Dfn3 - - 0.179 0.63 0.167 0.66 - - 0.125 0.75 0.115 0.77Dfot - - 0.464 0.23 0.454 0.24 - - 0.727 0.09 0.713 0.10Dboi 0.329 0.19 0.337 0.18 0.362 0.16 0.366 0.17 0.372 0.16 0.383 0.16Dold 0.007 0.96 0.015 0.93 0.015 0.93 0.005 0.98 0.006 0.98 -0.012 0.96Dlarge -0.493 0.19 -0.517 0.18 -0.524 0.17 -0.410 0.31 -0.429 0.30 -0.433 0.29F-test 14.69 0.00 10.96 0.00 8.74 0.00 1.57 0.17 1.36 0.23 1.14 0.35White 18.78 0.71 30.58 0.68 30.74 0.79 18.35 0.74 24.41 0.91 24.86 0.94Adj. R-sq. 0.317 - 0.310 - 0.304 - 0.035 - 0.030 - 0.014 - Obs. 178 - 178 - 178 - 95 - 95 - 95 -
76

Appendix Table 7 (continued, 2/7)All plants Large plants with Output >=25 million baht
Indepen- Equation 1 Equation 2 Equation 3 Equation 1 Equation 2 Equation 3dent Coeffi- Sig- Coeffi- Sig- Coeffi- Sig- Coeffi- Sig- Coeffi- Sig- Coeffi- Sig-Variables, cients, nifi- cients, nifi- cients, nifi- cients, nifi- cients, nifi- cients, nifi-Indicator etc. cance etc. cance etc. cance etc. cance etc. cance etc. cance
APPARELConstant -3.259 0.00 -3.262 0.00 -3.264 0.00 -3.048 0.00 -3.002 0.00 -3.002 0.00ln(EN/E) 0.287 0.00 0.287 0.00 0.287 0.00 0.135 0.39 0.148 0.38 0.148 0.39ln(K/E) 0.288 0.00 0.291 0.00 0.290 0.00 0.262 0.10 0.262 0.11 0.262 0.13Df -0.190 0.60 - - - - -0.125 0.70 - - - - Dftr - - -0.311 0.50 - - - - -0.230 0.59 - - Dfeu - - - - - - - - - - - - Dfus - - - - -0.463 0.62 - - - - -0.234 0.79Dfjp - - - - -0.282 0.56 - - - - -0.229 0.63Dfn3 - - 0.446 0.61 0.444 0.61 - - 0.295 0.73 0.294 0.73Dfot - - -0.301 0.60 -0.306 0.60 - - -0.095 0.87 -0.095 0.87Dboi -0.035 0.88 -0.057 0.81 -0.052 0.83 -0.409 0.20 -0.430 0.20 -0.430 0.21Dold 0.189 0.42 0.198 0.44 0.195 0.45 -0.377 0.21 -0.385 0.24 -0.385 0.25Dlarge 0.242 0.49 0.310 0.39 0.323 0.38 0.461 0.26 0.457 0.29 0.457 0.30F-test 5.62 0.00 4.22 0.00 3.70 0.00 0.99 0.45 0.74 0.65 0.64 0.76White 9.71 0.99 9.99 1.00 10.39 1.00 11.89 0.96 - 0.73 - 0.73Adj. R-sq. 0.270 - 0.255 - 0.244 - -0.002 - -0.059 - -0.097 - Obs. 76 - 76 - 76 - 38 - 38 - 38 -
LEATHER & FOOTWEARConstant -3.580 0.00 -3.650 0.00 -3.650 0.00 -2.013 0.01 -2.046 0.01 -2.046 0.01ln(EN/E) 0.126 0.32 0.105 0.42 0.105 0.42 0.527 0.00 0.517 0.01 0.517 0.01ln(K/E) 0.048 0.63 0.043 0.67 0.043 0.67 0.014 0.91 0.012 0.93 0.012 0.93Df 0.976 0.01 - - - - 0.654 0.07 - - - - Dftr - - 0.859 0.17 - - - - 0.681 0.23 - - Dfeu - - - - - - - - - - - - Dfus - - - - - - - - - - - - Dfjp - - - - 0.859 0.17 - - - - 0.681 0.23Dfn3 - - 1.166 0.01 1.166 0.01 - - 0.685 0.12 0.685 0.12Dfot - - 0.048 0.97 0.048 0.97 - - 0.409 0.70 0.409 0.70Dboi 0.208 0.52 0.208 0.53 0.208 0.53 -0.102 0.77 -0.106 0.77 -0.106 0.77Dold 0.153 0.60 0.191 0.52 0.191 0.52 -0.333 0.32 -0.311 0.38 -0.311 0.38Dlarge -0.097 0.85 -0.099 0.85 -0.099 0.85 0.484 0.32 0.489 0.33 0.489 0.33F-test 2.00 0.08 1.58 0.15 1.58 0.15 3.20 0.01 2.28 0.04 2.28 0.04White 19.86 0.59 20.19 0.82 20.19 0.82 26.37 0.19 - 0.09 - 0.09Adj. R-sq. 0.074 - 0.058 - 0.058 - 0.231 - 0.189 - 0.189 - Obs. 76 - 76 - 76 - 45 - 45 - 45 -
77
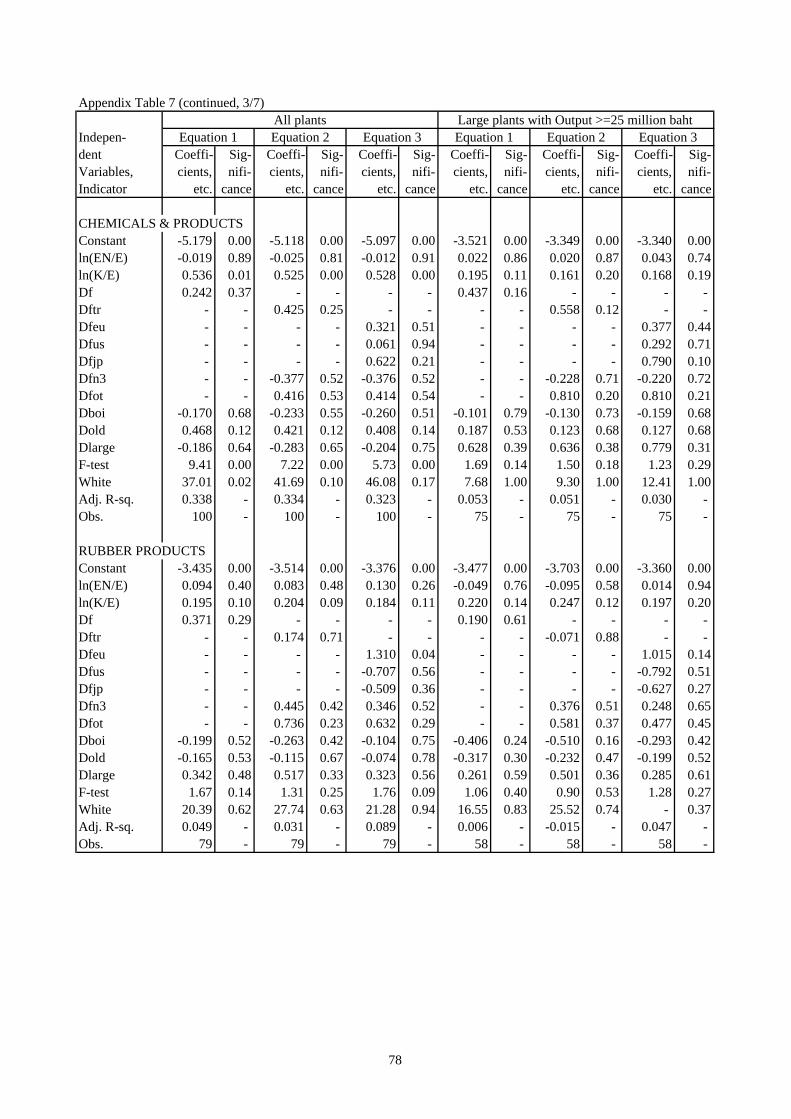
Appendix Table 7 (continued, 3/7)All plants Large plants with Output >=25 million baht
Indepen- Equation 1 Equation 2 Equation 3 Equation 1 Equation 2 Equation 3dent Coeffi- Sig- Coeffi- Sig- Coeffi- Sig- Coeffi- Sig- Coeffi- Sig- Coeffi- Sig-Variables, cients, nifi- cients, nifi- cients, nifi- cients, nifi- cients, nifi- cients, nifi-Indicator etc. cance etc. cance etc. cance etc. cance etc. cance etc. cance
CHEMICALS & PRODUCTSConstant -5.179 0.00 -5.118 0.00 -5.097 0.00 -3.521 0.00 -3.349 0.00 -3.340 0.00ln(EN/E) -0.019 0.89 -0.025 0.81 -0.012 0.91 0.022 0.86 0.020 0.87 0.043 0.74ln(K/E) 0.536 0.01 0.525 0.00 0.528 0.00 0.195 0.11 0.161 0.20 0.168 0.19Df 0.242 0.37 - - - - 0.437 0.16 - - - - Dftr - - 0.425 0.25 - - - - 0.558 0.12 - - Dfeu - - - - 0.321 0.51 - - - - 0.377 0.44Dfus - - - - 0.061 0.94 - - - - 0.292 0.71Dfjp - - - - 0.622 0.21 - - - - 0.790 0.10Dfn3 - - -0.377 0.52 -0.376 0.52 - - -0.228 0.71 -0.220 0.72Dfot - - 0.416 0.53 0.414 0.54 - - 0.810 0.20 0.810 0.21Dboi -0.170 0.68 -0.233 0.55 -0.260 0.51 -0.101 0.79 -0.130 0.73 -0.159 0.68Dold 0.468 0.12 0.421 0.12 0.408 0.14 0.187 0.53 0.123 0.68 0.127 0.68Dlarge -0.186 0.64 -0.283 0.65 -0.204 0.75 0.628 0.39 0.636 0.38 0.779 0.31F-test 9.41 0.00 7.22 0.00 5.73 0.00 1.69 0.14 1.50 0.18 1.23 0.29White 37.01 0.02 41.69 0.10 46.08 0.17 7.68 1.00 9.30 1.00 12.41 1.00Adj. R-sq. 0.338 - 0.334 - 0.323 - 0.053 - 0.051 - 0.030 - Obs. 100 - 100 - 100 - 75 - 75 - 75 -
RUBBER PRODUCTSConstant -3.435 0.00 -3.514 0.00 -3.376 0.00 -3.477 0.00 -3.703 0.00 -3.360 0.00ln(EN/E) 0.094 0.40 0.083 0.48 0.130 0.26 -0.049 0.76 -0.095 0.58 0.014 0.94ln(K/E) 0.195 0.10 0.204 0.09 0.184 0.11 0.220 0.14 0.247 0.12 0.197 0.20Df 0.371 0.29 - - - - 0.190 0.61 - - - - Dftr - - 0.174 0.71 - - - - -0.071 0.88 - - Dfeu - - - - 1.310 0.04 - - - - 1.015 0.14Dfus - - - - -0.707 0.56 - - - - -0.792 0.51Dfjp - - - - -0.509 0.36 - - - - -0.627 0.27Dfn3 - - 0.445 0.42 0.346 0.52 - - 0.376 0.51 0.248 0.65Dfot - - 0.736 0.23 0.632 0.29 - - 0.581 0.37 0.477 0.45Dboi -0.199 0.52 -0.263 0.42 -0.104 0.75 -0.406 0.24 -0.510 0.16 -0.293 0.42Dold -0.165 0.53 -0.115 0.67 -0.074 0.78 -0.317 0.30 -0.232 0.47 -0.199 0.52Dlarge 0.342 0.48 0.517 0.33 0.323 0.56 0.261 0.59 0.501 0.36 0.285 0.61F-test 1.67 0.14 1.31 0.25 1.76 0.09 1.06 0.40 0.90 0.53 1.28 0.27White 20.39 0.62 27.74 0.63 21.28 0.94 16.55 0.83 25.52 0.74 - 0.37Adj. R-sq. 0.049 - 0.031 - 0.089 - 0.006 - -0.015 - 0.047 - Obs. 79 - 79 - 79 - 58 - 58 - 58 -
78

Appendix Table 7 (continued, 4/7)All plants Large plants with Output >=25 million baht
Indepen- Equation 1 Equation 2 Equation 3 Equation 1 Equation 2 Equation 3dent Coeffi- Sig- Coeffi- Sig- Coeffi- Sig- Coeffi- Sig- Coeffi- Sig- Coeffi- Sig-Variables, cients, nifi- cients, nifi- cients, nifi- cients, nifi- cients, nifi- cients, nifi-Indicator etc. cance etc. cance etc. cance etc. cance etc. cance etc. cance
PLASTICS & PRODUCTSConstant -3.847 0.00 -3.857 0.00 -3.883 0.00 -3.213 0.00 -3.122 0.00 -3.185 0.00ln(EN/E) 0.063 0.51 0.059 0.54 0.076 0.43 0.141 0.31 0.131 0.36 0.164 0.25ln(K/E) 0.149 0.21 0.155 0.20 0.180 0.13 0.091 0.56 0.090 0.57 0.128 0.42Df 0.188 0.60 - - - - -0.184 0.63 - - - - Dftr - - 0.018 0.97 - - - - -0.355 0.40 - - Dfeu - - - - -1.429 0.12 - - - - -1.453 0.09Dfus - - - - - - - - - - - - Dfjp - - - - 0.445 0.35 - - - - 0.012 0.98Dfn3 - - -0.005 0.99 0.099 0.90 - - 0.653 0.60 0.774 0.53Dfot - - 0.665 0.27 0.655 0.27 - - 0.318 0.66 0.320 0.66Dboi -0.045 0.91 -0.020 0.96 -0.262 0.53 0.303 0.50 0.187 0.69 -0.036 0.94Dold -0.474 0.10 -0.529 0.08 -0.496 0.10 -0.468 0.21 -0.626 0.12 -0.571 0.15Dlarge 1.001 0.03 0.989 0.03 1.221 0.01 0.473 0.31 0.511 0.29 0.716 0.15F-test 2.19 0.05 1.75 0.10 1.97 0.05 1.40 0.24 1.18 0.33 1.32 0.26White 12.72 0.96 13.76 1.00 13.48 1.00 23.57 0.43 29.28 0.30 - 0.58Adj. R-sq. 0.076 - 0.065 - 0.091 - 0.047 - 0.029 - 0.056 - Obs. 88 - 88 - 88 - 50 - 50 - 50 -
NON-METALLIC MINERAL PRODUCTSConstant -3.469 0.00 -3.494 0.00 -3.474 0.00 -3.141 0.00 -3.170 0.00 -3.073 0.00ln(EN/E) 0.090 0.11 0.091 0.11 0.096 0.09 0.048 0.58 0.053 0.55 0.065 0.47ln(K/E) 0.103 0.05 0.111 0.04 0.108 0.05 0.086 0.27 0.095 0.27 0.076 0.38Df 0.446 0.05 - - - - 0.178 0.50 - - - - Dftr - - 0.292 0.33 - - - - 0.077 0.83 - - Dfeu - - - - 0.344 0.36 - - - - 0.176 0.68Dfus - - - - -1.305 0.19 - - - - -1.761 0.11Dfjp - - - - 0.553 0.26 - - - - 0.461 0.46Dfn3 - - 0.695 0.05 0.719 0.05 - - 0.351 0.37 0.382 0.33Dfot - - 0.421 0.47 0.444 0.44 - - -0.005 1.00 0.000 1.00Dboi -0.339 0.14 -0.360 0.12 -0.403 0.08 -0.450 0.10 -0.456 0.10 -0.524 0.06Dold 0.061 0.66 0.061 0.66 0.066 0.63 0.051 0.80 0.064 0.75 0.053 0.79Dlarge 0.544 0.10 0.576 0.09 0.716 0.04 0.571 0.22 0.576 0.22 0.927 0.07F-test 3.72 0.00 2.87 0.00 2.61 0.01 1.53 0.18 1.18 0.32 1.29 0.25White 16.38 0.84 18.15 0.97 19.57 0.98 8.46 1.00 9.70 1.00 9.96 1.00Adj. R-sq. 0.077 - 0.071 - 0.076 - 0.029 - 0.013 - 0.027 - Obs. 197 - 197 - 197 - 106 - 106 - 106 -
79

Appendix Table 7 (continued, 5/7)All plants Large plants with Output >=25 million baht
Indepen- Equation 1 Equation 2 Equation 3 Equation 1 Equation 2 Equation 3dent Coeffi- Sig- Coeffi- Sig- Coeffi- Sig- Coeffi- Sig- Coeffi- Sig- Coeffi- Sig-Variables, cients, nifi- cients, nifi- cients, nifi- cients, nifi- cients, nifi- cients, nifi-Indicator etc. cance etc. cance etc. cance etc. cance etc. cance etc. cance
METAL PRODUCTSConstant -3.131 0.00 -3.142 0.00 -3.162 0.00 -2.814 0.00 -2.833 0.00 -2.858 0.00ln(EN/E) 0.102 0.11 0.111 0.09 0.108 0.10 0.088 0.42 0.099 0.36 0.096 0.37ln(K/E) 0.126 0.05 0.135 0.04 0.138 0.03 0.107 0.30 0.116 0.28 0.121 0.27Df 0.285 0.23 - - - - 0.122 0.62 - - - - Dftr - - -0.107 0.74 - - - - -0.175 0.56 - - Dfeu - - - - 0.148 0.79 - - - - -0.005 0.99Dfus - - - - - - - - - - - - Dfjp - - - - -0.168 0.62 - - - - -0.218 0.50Dfn3 - - 0.571 0.06 0.572 0.06 - - 0.359 0.20 0.359 0.19Dfot - - 0.343 0.49 0.343 0.49 - - 0.137 0.87 0.138 0.87Dboi 0.235 0.34 0.346 0.18 0.340 0.18 0.171 0.51 0.271 0.29 0.264 0.30Dold 0.052 0.74 0.037 0.81 0.043 0.78 0.000 1.00 -0.016 0.94 -0.008 0.97Dlarge 0.078 0.81 0.145 0.66 0.144 0.66 0.008 0.99 0.056 0.90 0.048 0.92F-test 3.59 0.00 3.17 0.00 2.84 0.00 1.17 0.33 1.15 0.34 1.03 0.42White 15.04 0.89 17.19 0.99 12.16 1.00 35.33 0.05 46.73 0.04 51.87 0.04Adj. R-sq. 0.084 - 0.093 - 0.089 - 0.011 - 0.013 - 0.003 - Obs. 170 - 170 - 170 - 92 - 92 - 92 -
GENERAL MACHINERYConstant -3.263 0.00 -3.211 0.00 -3.144 0.00 -4.006 0.00 -3.949 0.00 -3.805 0.00ln(EN/E) 0.052 0.56 0.051 0.57 0.065 0.47 -0.170 0.23 -0.167 0.24 -0.144 0.32ln(K/E) 0.057 0.58 0.043 0.67 0.036 0.73 0.215 0.19 0.202 0.23 0.177 0.30Df 0.516 0.08 - - - - 0.391 0.33 - - - - Dftr - - 0.675 0.05 - - - - 0.467 0.30 - - Dfeu - - - - -0.063 0.92 - - - - -0.114 0.87Dfus - - - - - - - - - - - - Dfjp - - - - 0.855 0.02 - - - - 0.636 0.19Dfn3 - - 0.102 0.85 0.098 0.85 - - 0.161 0.84 0.154 0.84Dfot - - 0.461 0.50 0.458 0.51 - - 0.277 0.73 0.276 0.73Dboi 0.307 0.40 0.235 0.53 0.214 0.57 -0.133 0.78 -0.160 0.74 -0.166 0.74Dold 0.164 0.48 0.153 0.51 0.133 0.57 0.266 0.42 0.253 0.45 0.234 0.49Dlarge -0.091 0.87 -0.158 0.78 -0.313 0.58 -0.006 0.99 -0.038 0.95 -0.171 0.79F-test 1.96 0.08 1.58 0.14 1.65 0.11 0.94 0.48 0.70 0.69 0.75 0.67White 24.40 0.27 27.09 0.57 26.32 0.79 28.82 0.12 33.88 0.17 31.42 0.50Adj. R-sq. 0.052 - 0.042 - 0.053 - -0.006 - -0.038 - -0.037 - Obs. 106 - 106 - 106 - 66 - 66 - 66 -
80

Appendix Table 7 (continued, 6/7)All plants Large plants with Output >=25 million baht
Indepen- Equation 1 Equation 2 Equation 3 Equation 1 Equation 2 Equation 3dent Coeffi- Sig- Coeffi- Sig- Coeffi- Sig- Coeffi- Sig- Coeffi- Sig- Coeffi- Sig-Variables, cients, nifi- cients, nifi- cients, nifi- cients, nifi- cients, nifi- cients, nifi-Indicator etc. cance etc. cance etc. cance etc. cance etc. cance etc. cance
ELECTRIC MACHINERY, ETC. (INCL. OFFICE & COMPUTING MACHINERY, PRECISION MACHINERY)Constant -3.371 0.00 -3.448 0.00 -3.456 0.00 -3.215 0.00 -3.337 0.00 -3.350 0.00ln(EN/E) 0.107 0.20 0.087 0.29 0.088 0.29 0.102 0.29 0.083 0.39 0.084 0.39ln(K/E) 0.172 0.01 0.180 0.01 0.183 0.01 0.140 0.10 0.159 0.06 0.163 0.06Df -0.387 0.09 - - - - -0.398 0.10 - - - - Dftr - - -0.491 0.04 - - - - -0.525 0.04 - - Dfeu - - - - -0.553 0.21 - - - - -0.601 0.17Dfus - - - - -0.313 0.54 - - - - -0.362 0.47Dfjp - - - - -0.495 0.05 - - - - -0.527 0.05Dfn3 - - -0.179 0.56 -0.173 0.58 - - -0.188 0.54 -0.182 0.56Dfot - - 0.379 0.49 0.384 0.49 - - 0.447 0.46 0.454 0.46Dboi 0.461 0.05 0.448 0.05 0.440 0.06 0.450 0.06 0.455 0.06 0.448 0.07Dold 0.077 0.65 0.103 0.56 0.111 0.54 0.066 0.72 0.115 0.53 0.126 0.51Dlarge 0.624 0.09 0.659 0.07 0.647 0.08 0.518 0.17 0.569 0.13 0.558 0.14F-test 3.55 0.00 3.15 0.00 2.51 0.01 1.87 0.09 1.91 0.06 1.52 0.14White 11.72 0.95 13.13 1.00 20.96 1.00 10.76 0.97 11.69 1.00 18.12 1.00Adj. R-sq. 0.095 - 0.105 - 0.094 - 0.040 - 0.055 - 0.040 - Obs. 147 - 147 - 147 - 125 - 125 - 125 -
MOTOR VEHICLESConstant -3.413 0.00 -3.397 0.00 -3.342 0.00 -2.971 0.00 -2.834 0.00 -2.681 0.00ln(EN/E) 0.074 0.38 0.074 0.38 0.086 0.33 -0.005 0.97 -0.007 0.96 0.033 0.81ln(K/E) 0.090 0.35 0.084 0.39 0.075 0.45 0.014 0.94 -0.036 0.84 -0.059 0.67Df 0.299 0.39 - - - - 0.340 0.39 - - - - Dftr - - 0.356 0.33 - - - - 0.498 0.24 - - Dfeu - - - - 0.164 0.84 - - - - 0.915 0.69Dfus - - - - 0.998 0.35 - - - - 0.912 0.15Dfjp - - - - 0.347 0.36 - - - - 0.417 0.30Dfn3 - - 0.094 0.86 0.104 0.85 - - -0.111 0.84 -0.125 0.85Dfot - - 0.148 0.89 0.163 0.87 - - 0.055 0.96 0.030 0.95Dboi 0.165 0.63 0.171 0.62 0.164 0.64 -0.007 0.99 0.044 0.91 0.090 0.86Dold -0.256 0.24 -0.254 0.25 -0.246 0.27 -0.119 0.71 -0.111 0.73 -0.112 0.75Dlarge 1.859 0.00 1.816 0.01 1.897 0.01 1.217 0.12 1.192 0.13 1.282 0.37F-test 4.83 0.00 3.58 0.00 2.85 0.00 0.96 0.46 0.89 0.53 0.75 0.68White 13.80 0.84 22.12 0.63 24.20 0.62 15.36 0.70 - 0.26 - 0.02Adj. R-sq. 0.209 - 0.192 - 0.176 - -0.005 - -0.021 - -0.065 - Obs. 88 - 88 - 88 - 43 - 43 - 43 -
81

Appendix Table 7 (continued, 7/7)All plants Large plants with Output >=25 million baht
Indepen- Equation 1 Equation 2 Equation 3 Equation 1 Equation 2 Equation 3dent Coeffi- Sig- Coeffi- Sig- Coeffi- Sig- Coeffi- Sig- Coeffi- Sig- Coeffi- Sig-Variables, cients, nifi- cients, nifi- cients, nifi- cients, nifi- cients, nifi- cients, nifi-Indicator etc. cance etc. cance etc. cance etc. cance etc. cance etc. cance
FURNITUREConstant -3.106 0.00 -3.089 0.00 -3.091 0.00 -3.209 0.00 -3.221 0.00 -3.239 0.00ln(EN/E) 0.516 0.00 0.521 0.00 0.521 0.00 0.207 0.10 0.207 0.11 0.207 0.11ln(K/E) 0.455 0.00 0.455 0.00 0.455 0.00 0.154 0.16 0.158 0.16 0.152 0.17Df 0.956 0.02 - - - - 0.383 0.18 - - - - Dftr - - 1.116 0.05 - - - - 0.388 0.30 - - Dfeu - - - - - - - - - - - - Dfus - - - - 1.240 0.17 - - - - 0.752 0.20Dfjp - - - - 1.040 0.15 - - - - 0.164 0.72Dfn3 - - 0.936 0.19 0.936 0.19 - - 0.612 0.27 0.623 0.26Dfot - - 0.623 0.46 0.623 0.47 - - 0.182 0.73 0.188 0.72Dboi 0.294 0.55 0.258 0.60 0.245 0.63 0.543 0.10 0.524 0.13 0.479 0.17Dold -0.677 0.01 -0.675 0.01 -0.669 0.01 0.222 0.35 0.235 0.34 0.287 0.26Dlarge 0.271 0.57 0.273 0.57 0.289 0.56 0.249 0.49 0.222 0.55 0.306 0.43F-test 21.81 0.00 16.07 0.00 14.13 0.00 3.38 0.01 2.46 0.03 2.25 0.04White 12.84 0.96 13.15 0.99 13.21 0.99 23.65 0.42 - 0.77 - 0.89Adj. R-sq. 0.568 - 0.559 - 0.554 - 0.249 - 0.214 - 0.207 - Obs. 96 - 96 - 96 - 44 - 44 - 44 -
JEWELRYConstant -3.487 0.00 -3.866 0.00 -3.927 0.00 Not estimated because there wereln(EN/E) 0.211 0.21 0.173 0.29 0.166 0.32 less than 30 observationsln(K/E) 0.210 0.18 0.299 0.06 0.311 0.06 - - - - - - Df 0.123 0.78 - - - - - - - - - - Dftr - - -0.399 0.50 - - - - - - - - Dfeu - - - - -0.575 0.37 - - - - - - Dfus - - - - - - - - - - - - Dfjp - - - - -0.054 0.94 - - - - - - Dfn3 - - - - 0.807 0.19 - - - - - - Dfot - - -0.983 0.20 -0.997 0.20 - - - - - - Dboi 0.320 0.48 0.916 0.11 0.899 0.12 - - - - - - Dold 0.150 0.69 0.061 0.87 0.176 0.66 - - - - - - Dlarge 0.539 0.51 0.243 0.76 0.232 0.77 - - - - - - F-test 2.29 0.06 2.29 0.05 2.07 0.07 - - - - - - White 15.15 0.71 - 0.79 - 0.82 - - - - - - Adj. R-sq. 0.165 - 0.210 - 0.198 - - - - - - - Obs. 40 - 40 - 40 - 22 - 22 - 22 - Notes: Heteroscedasticity-consistent standard errors used if White is significant at 0.05 or less.If White cannot be calculated, the significance of the LM heteroscedasticity test is reported and used.- = not relevant or no plants in this category; n<30 = sample size smaller than 30.
82

Appendix Table 8: Estimates of Compensation per Hour (dependent variable = ln(W/E)), 2000All plants Large plants with Output >=25 million baht
Indepen- Equation 1 Equation 2 Equation 3 Equation 1 Equation 2 Equation 3dent Coeffi- Sig- Coeffi- Sig- Coeffi- Sig- Coeffi- Sig- Coeffi- Sig- Coeffi- Sig-Variables, cients, nifi- cients, nifi- cients, nifi- cients, nifi- cients, nifi- cients, nifi-Indicator etc. cance etc. cance etc. cance etc. cance etc. cance etc. cance
FOODConstant 2.489 0.00 2.501 0.00 2.500 0.00 2.934 0.00 2.957 0.00 2.956 0.00ln(EN/E) 0.099 0.00 0.103 0.00 0.103 0.00 0.087 0.00 0.095 0.00 0.095 0.00ln(K/E) 0.168 0.00 0.168 0.00 0.168 0.00 0.076 0.00 0.075 0.00 0.076 0.00Df 0.175 0.03 - - - - 0.127 0.14 - - - - Dftr - - 0.166 0.08 - - - - 0.128 0.19 - - Dfeu - - - - 0.150 0.45 - - - - 0.176 0.38Dfus - - - - 0.050 0.89 - - - - 0.013 0.97Dfjp - - - - 0.183 0.08 - - - - 0.129 0.25Dfn3 - - 0.446 0.00 0.446 0.00 - - 0.378 0.04 0.378 0.04Dfot - - -0.258 0.17 -0.259 0.17 - - -0.304 0.19 -0.304 0.19Dboi -0.141 0.06 -0.134 0.07 -0.134 0.07 -0.223 0.01 -0.218 0.01 -0.217 0.01Dold 0.104 0.06 0.103 0.06 0.104 0.06 0.130 0.05 0.126 0.05 0.127 0.05Dlarge 0.285 0.00 0.274 0.00 0.273 0.00 0.174 0.10 0.169 0.11 0.164 0.13F-test 23.45 0.00 18.30 0.00 14.61 0.00 6.28 0.00 5.47 0.00 4.38 0.00White 197.44 0.00 200.72 0.00 201.72 0.00 21.30 0.56 24.27 0.91 27.01 0.98Adj. R-sq. 0.186 - 0.190 - 0.187 - 0.082 - 0.092 - 0.087 - Obs. 591 - 591 - 591 - 354 - 354 - 354 -
TEXTILESConstant 2.654 0.00 2.663 0.00 2.663 0.00 2.884 0.00 2.899 0.00 2.915 0.00ln(EN/E) 0.192 0.00 0.195 0.00 0.196 0.00 0.034 0.72 0.035 0.64 0.037 0.63ln(K/E) 0.186 0.00 0.184 0.00 0.185 0.00 0.000 0.99 -0.004 0.93 -0.011 0.83Df 0.308 0.02 - - - - 0.412 0.01 - - - - Dftr - - 0.328 0.08 - - - - 0.504 0.02 - - Dfeu - - - - 0.478 0.21 - - - - -0.095 0.88Dfus - - - - 0.575 0.00 - - - - 0.654 0.31Dfjp - - - - 0.259 0.28 - - - - 0.570 0.02Dfn3 - - 0.160 0.50 0.153 0.53 - - 0.214 0.37 0.222 0.36Dfot - - 0.438 0.04 0.433 0.04 - - 0.508 0.06 0.519 0.05Dboi -0.068 0.72 -0.059 0.75 -0.043 0.82 -0.128 0.46 -0.123 0.45 -0.131 0.43Dold 0.065 0.61 0.071 0.58 0.074 0.57 0.074 0.60 0.078 0.60 0.092 0.54Dlarge -0.328 0.24 -0.359 0.19 -0.364 0.19 -0.271 0.31 -0.276 0.27 -0.273 0.28F-test 11.59 0.00 8.69 0.00 6.90 0.00 1.49 0.19 1.25 0.28 1.09 0.38White 55.76 0.00 56.19 0.01 56.26 0.03 34.78 0.05 42.15 0.19 44.08 0.20Adj. R-sq. 0.264 - 0.258 - 0.250 - 0.030 - 0.021 - 0.010 - Obs. 178 - 178 - 178 - 95 - 95 - 95 -
83
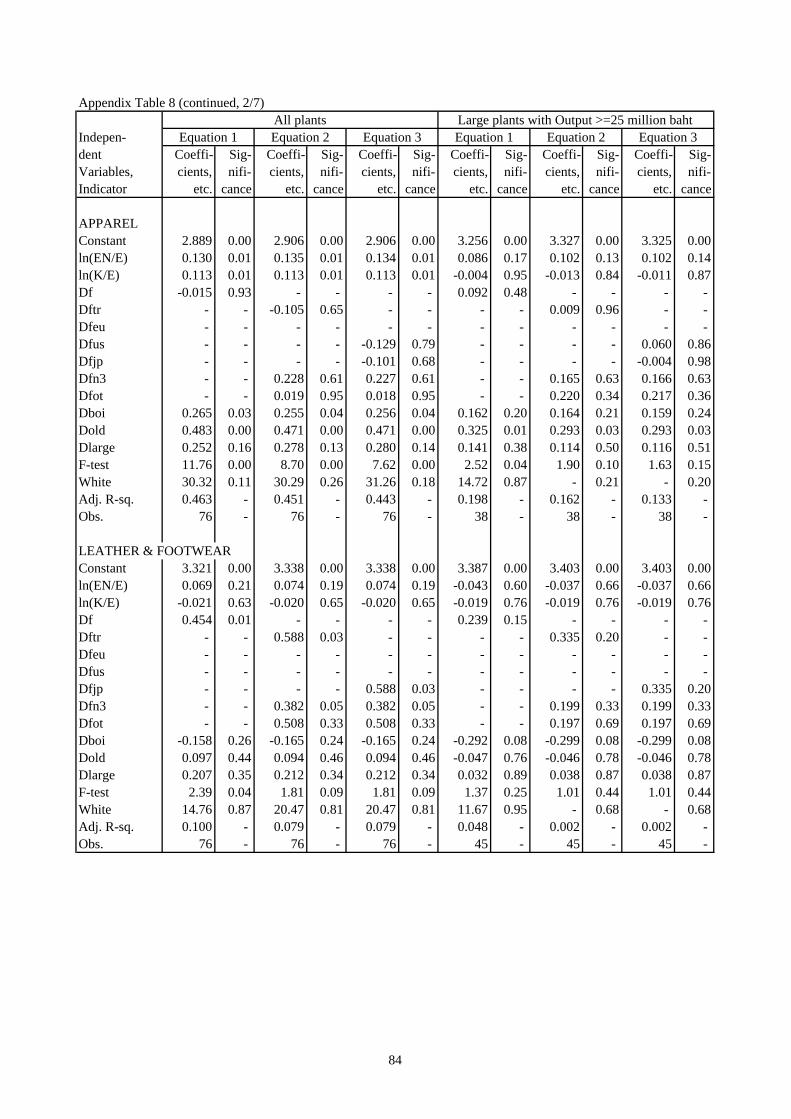
Appendix Table 8 (continued, 2/7)All plants Large plants with Output >=25 million baht
Indepen- Equation 1 Equation 2 Equation 3 Equation 1 Equation 2 Equation 3dent Coeffi- Sig- Coeffi- Sig- Coeffi- Sig- Coeffi- Sig- Coeffi- Sig- Coeffi- Sig-Variables, cients, nifi- cients, nifi- cients, nifi- cients, nifi- cients, nifi- cients, nifi-Indicator etc. cance etc. cance etc. cance etc. cance etc. cance etc. cance
APPARELConstant 2.889 0.00 2.906 0.00 2.906 0.00 3.256 0.00 3.327 0.00 3.325 0.00ln(EN/E) 0.130 0.01 0.135 0.01 0.134 0.01 0.086 0.17 0.102 0.13 0.102 0.14ln(K/E) 0.113 0.01 0.113 0.01 0.113 0.01 -0.004 0.95 -0.013 0.84 -0.011 0.87Df -0.015 0.93 - - - - 0.092 0.48 - - - - Dftr - - -0.105 0.65 - - - - 0.009 0.96 - - Dfeu - - - - - - - - - - - - Dfus - - - - -0.129 0.79 - - - - 0.060 0.86Dfjp - - - - -0.101 0.68 - - - - -0.004 0.98Dfn3 - - 0.228 0.61 0.227 0.61 - - 0.165 0.63 0.166 0.63Dfot - - 0.019 0.95 0.018 0.95 - - 0.220 0.34 0.217 0.36Dboi 0.265 0.03 0.255 0.04 0.256 0.04 0.162 0.20 0.164 0.21 0.159 0.24Dold 0.483 0.00 0.471 0.00 0.471 0.00 0.325 0.01 0.293 0.03 0.293 0.03Dlarge 0.252 0.16 0.278 0.13 0.280 0.14 0.141 0.38 0.114 0.50 0.116 0.51F-test 11.76 0.00 8.70 0.00 7.62 0.00 2.52 0.04 1.90 0.10 1.63 0.15White 30.32 0.11 30.29 0.26 31.26 0.18 14.72 0.87 - 0.21 - 0.20Adj. R-sq. 0.463 - 0.451 - 0.443 - 0.198 - 0.162 - 0.133 - Obs. 76 - 76 - 76 - 38 - 38 - 38 -
LEATHER & FOOTWEARConstant 3.321 0.00 3.338 0.00 3.338 0.00 3.387 0.00 3.403 0.00 3.403 0.00ln(EN/E) 0.069 0.21 0.074 0.19 0.074 0.19 -0.043 0.60 -0.037 0.66 -0.037 0.66ln(K/E) -0.021 0.63 -0.020 0.65 -0.020 0.65 -0.019 0.76 -0.019 0.76 -0.019 0.76Df 0.454 0.01 - - - - 0.239 0.15 - - - - Dftr - - 0.588 0.03 - - - - 0.335 0.20 - - Dfeu - - - - - - - - - - - - Dfus - - - - - - - - - - - - Dfjp - - - - 0.588 0.03 - - - - 0.335 0.20Dfn3 - - 0.382 0.05 0.382 0.05 - - 0.199 0.33 0.199 0.33Dfot - - 0.508 0.33 0.508 0.33 - - 0.197 0.69 0.197 0.69Dboi -0.158 0.26 -0.165 0.24 -0.165 0.24 -0.292 0.08 -0.299 0.08 -0.299 0.08Dold 0.097 0.44 0.094 0.46 0.094 0.46 -0.047 0.76 -0.046 0.78 -0.046 0.78Dlarge 0.207 0.35 0.212 0.34 0.212 0.34 0.032 0.89 0.038 0.87 0.038 0.87F-test 2.39 0.04 1.81 0.09 1.81 0.09 1.37 0.25 1.01 0.44 1.01 0.44White 14.76 0.87 20.47 0.81 20.47 0.81 11.67 0.95 - 0.68 - 0.68Adj. R-sq. 0.100 - 0.079 - 0.079 - 0.048 - 0.002 - 0.002 - Obs. 76 - 76 - 76 - 45 - 45 - 45 -
84

Appendix Table 8 (continued, 3/7)All plants Large plants with Output >=25 million baht
Indepen- Equation 1 Equation 2 Equation 3 Equation 1 Equation 2 Equation 3dent Coeffi- Sig- Coeffi- Sig- Coeffi- Sig- Coeffi- Sig- Coeffi- Sig- Coeffi- Sig-Variables, cients, nifi- cients, nifi- cients, nifi- cients, nifi- cients, nifi- cients, nifi-Indicator etc. cance etc. cance etc. cance etc. cance etc. cance etc. cance
CHEMICALS & PRODUCTSConstant 2.268 0.00 2.268 0.00 2.301 0.01 3.372 0.00 3.464 0.00 3.504 0.00ln(EN/E) 0.057 0.53 0.056 0.54 0.063 0.51 0.172 0.00 0.172 0.00 0.191 0.00ln(K/E) 0.239 0.13 0.239 0.14 0.234 0.16 0.031 0.59 0.013 0.83 0.007 0.90Df 0.102 0.52 - - - - 0.130 0.38 - - - - Dftr - - 0.116 0.54 - - - - 0.188 0.27 - - Dfeu - - - - -0.162 0.50 - - - - -0.158 0.47Dfus - - - - 0.451 0.05 - - - - 0.536 0.13Dfjp - - - - 0.331 0.15 - - - - 0.418 0.05Dfn3 - - 0.079 0.75 0.086 0.73 - - -0.213 0.46 -0.205 0.46Dfot - - 0.080 0.82 0.096 0.80 - - 0.347 0.24 0.357 0.22Dboi 0.141 0.60 0.136 0.62 0.084 0.76 0.294 0.10 0.282 0.12 0.243 0.17Dold 0.473 0.01 0.472 0.01 0.477 0.01 0.333 0.02 0.300 0.04 0.324 0.02Dlarge -0.515 0.10 -0.524 0.12 -0.481 0.16 0.004 0.99 0.012 0.97 0.046 0.89F-test 9.39 0.00 6.90 0.00 5.89 0.00 3.13 0.01 2.64 0.01 2.86 0.01White 83.96 0.00 84.35 0.00 90.00 0.00 30.99 0.07 33.55 0.26 45.62 0.11Adj. R-sq. 0.337 - 0.323 - 0.331 - 0.147 - 0.151 - 0.200 - Obs. 100 - 100 - 100 - 75 - 75 - 75 -
RUBBER PRODUCTSConstant 3.333 0.00 3.296 0.00 3.315 0.00 3.681 0.00 3.628 0.00 3.680 0.00ln(EN/E) 0.022 0.70 0.018 0.76 0.023 0.71 0.046 0.62 0.036 0.72 0.050 0.64ln(K/E) -0.048 0.43 -0.044 0.48 -0.048 0.44 -0.149 0.09 -0.150 0.10 -0.158 0.09Df 0.112 0.54 - - - - 0.264 0.23 - - - - Dftr - - -0.007 0.98 - - - - 0.162 0.56 - - Dfeu - - - - 0.080 0.82 - - - - 0.264 0.52Dfus - - - - -0.733 0.26 - - - - -0.576 0.42Dfjp - - - - 0.019 0.95 - - - - 0.196 0.56Dfn3 - - 0.075 0.80 0.073 0.80 - - 0.174 0.59 0.168 0.61Dfot - - 0.459 0.15 0.457 0.16 - - 0.730 0.05 0.727 0.06Dboi -0.359 0.03 -0.415 0.02 -0.408 0.02 -0.467 0.02 -0.557 0.01 -0.540 0.02Dold -0.190 0.17 -0.147 0.30 -0.153 0.28 -0.112 0.53 -0.032 0.86 -0.041 0.83Dlarge 0.356 0.16 0.480 0.09 0.555 0.06 0.460 0.11 0.616 0.06 0.686 0.05F-test 1.46 0.20 1.32 0.25 1.20 0.31 1.80 0.12 1.66 0.13 1.44 0.19White 25.23 0.34 34.86 0.29 41.33 0.15 25.10 0.34 36.83 0.22 - 0.18Adj. R-sq. 0.034 - 0.032 - 0.025 - 0.078 - 0.085 - 0.072 - Obs. 79 - 79 - 79 - 58 - 58 - 58 -
85

Appendix Table 8 (continued, 4/7)All plants Large plants with Output >=25 million baht
Indepen- Equation 1 Equation 2 Equation 3 Equation 1 Equation 2 Equation 3dent Coeffi- Sig- Coeffi- Sig- Coeffi- Sig- Coeffi- Sig- Coeffi- Sig- Coeffi- Sig-Variables, cients, nifi- cients, nifi- cients, nifi- cients, nifi- cients, nifi- cients, nifi-Indicator etc. cance etc. cance etc. cance etc. cance etc. cance etc. cance
PLASTICS & PRODUCTSConstant 2.794 0.00 2.794 0.00 2.786 0.00 3.107 0.00 3.195 0.00 3.172 0.00ln(EN/E) 0.034 0.50 0.033 0.53 0.039 0.44 0.110 0.18 0.121 0.15 0.133 0.12ln(K/E) 0.037 0.57 0.041 0.55 0.049 0.43 0.026 0.78 0.014 0.88 0.028 0.77Df 0.482 0.02 - - - - 0.379 0.09 - - - - Dftr - - 0.378 0.05 - - - - 0.303 0.22 - - Dfeu - - - - -0.067 0.89 - - - - -0.090 0.86Dfus - - - - - - - - - - - - Dfjp - - - - 0.509 0.05 - - - - 0.434 0.13Dfn3 - - 0.542 0.62 0.574 0.16 - - 0.045 0.95 0.089 0.90Dfot - - 0.695 0.08 0.692 0.03 - - 0.772 0.08 0.772 0.08Dboi -0.267 0.25 -0.270 0.21 -0.345 0.12 -0.205 0.43 -0.192 0.48 -0.272 0.35Dold -0.228 0.17 -0.261 0.11 -0.251 0.11 -0.366 0.09 -0.402 0.09 -0.383 0.11Dlarge 0.684 0.03 0.673 0.04 0.745 0.00 0.704 0.01 0.669 0.02 0.742 0.01F-test 2.88 0.01 2.24 0.03 2.12 0.04 2.12 0.07 1.75 0.12 1.63 0.14White 45.25 0.00 44.65 0.05 21.43 0.92 24.01 0.40 26.23 0.45 - 0.96Adj. R-sq. 0.115 - 0.102 - 0.104 - 0.121 - 0.109 - 0.104 - Obs. 88 - 88 - 88 - 50 - 50 - 50 -
NON-METALLIC MINERAL PRODUCTSConstant 2.872 0.00 2.846 0.00 2.838 0.00 2.935 0.00 2.883 0.00 2.859 0.00ln(EN/E) 0.107 0.00 0.105 0.00 0.102 0.00 0.082 0.09 0.077 0.12 0.075 0.14ln(K/E) 0.097 0.00 0.103 0.00 0.104 0.00 0.110 0.01 0.122 0.01 0.127 0.01Df 0.536 0.00 - - - - 0.335 0.03 - - - - Dftr - - 0.472 0.02 - - - - 0.275 0.17 - - Dfeu - - - - 0.512 0.08 - - - - 0.220 0.37Dfus - - - - 0.930 0.00 - - - - 0.836 0.17Dfjp - - - - 0.297 0.18 - - - - 0.209 0.55Dfn3 - - 0.535 0.00 0.526 0.00 - - 0.320 0.15 0.313 0.16Dfot - - 0.823 0.00 0.813 0.00 - - 0.718 0.08 0.718 0.09Dboi -0.294 0.12 -0.312 0.11 -0.294 0.14 -0.181 0.24 -0.188 0.22 -0.171 0.28Dold 0.066 0.37 0.064 0.39 0.062 0.40 0.044 0.69 0.038 0.74 0.040 0.72Dlarge 0.130 0.56 0.142 0.54 0.108 0.65 0.145 0.58 0.143 0.58 0.040 0.89F-test 10.14 0.00 7.69 0.00 6.24 0.00 3.76 0.00 2.92 0.01 2.41 0.01White 48.81 0.00 51.05 0.01 54.03 0.02 29.97 0.15 34.70 0.25 37.48 0.27Adj. R-sq. 0.219 - 0.214 - 0.211 - 0.136 - 0.128 - 0.118 - Obs. 197 - 197 - 197 - 106 - 106 - 106 -
86

Appendix Table 8 (continued, 5/7)All plants Large plants with Output >=25 million baht
Indepen- Equation 1 Equation 2 Equation 3 Equation 1 Equation 2 Equation 3dent Coeffi- Sig- Coeffi- Sig- Coeffi- Sig- Coeffi- Sig- Coeffi- Sig- Coeffi- Sig-Variables, cients, nifi- cients, nifi- cients, nifi- cients, nifi- cients, nifi- cients, nifi-Indicator etc. cance etc. cance etc. cance etc. cance etc. cance etc. cance
METAL PRODUCTSConstant 3.055 0.00 3.061 0.00 3.072 0.00 3.131 0.00 3.144 0.00 3.168 0.00ln(EN/E) 0.116 0.00 0.116 0.00 0.117 0.00 0.113 0.03 0.111 0.03 0.114 0.03ln(K/E) 0.115 0.00 0.113 0.00 0.111 0.00 0.129 0.01 0.125 0.01 0.121 0.01Df -0.027 0.81 - - - - -0.123 0.37 - - - - Dftr - - 0.048 0.76 - - - - -0.028 0.88 - - Dfeu - - - - -0.090 0.73 - - - - -0.192 0.53Dfus - - - - - - - - - - - - Dfjp - - - - 0.081 0.62 - - - - 0.013 0.94Dfn3 - - -0.025 0.86 -0.025 0.86 - - -0.138 0.42 -0.137 0.42Dfot - - -0.181 0.45 -0.182 0.45 - - -0.346 0.27 -0.346 0.27Dboi 0.062 0.59 0.033 0.79 0.036 0.77 0.094 0.51 0.057 0.70 0.063 0.67Dold 0.045 0.55 0.050 0.51 0.047 0.53 0.015 0.90 0.020 0.86 0.012 0.92Dlarge 0.378 0.02 0.366 0.02 0.367 0.02 0.119 0.56 0.100 0.63 0.107 0.60F-test 9.11 0.00 6.87 0.00 6.13 0.00 3.25 0.01 2.53 0.02 2.29 0.02White 22.05 0.52 41.24 0.15 20.59 0.99 19.28 0.69 31.28 0.50 35.45 0.49Adj. R-sq. 0.224 - 0.218 - 0.215 - 0.129 - 0.119 - 0.113 - Obs. 170 - 170 - 170 - 92 - 92 - 92 -
GENERAL MACHINERYConstant 3.771 0.00 3.789 0.00 3.809 0.00 3.544 0.00 3.573 0.00 3.613 0.00ln(EN/E) 0.177 0.00 0.176 0.00 0.179 0.00 0.145 0.01 0.139 0.01 0.146 0.01ln(K/E) -0.002 0.98 -0.006 0.94 -0.008 0.91 0.084 0.19 0.077 0.24 0.070 0.29Df 0.410 0.00 - - - - 0.211 0.18 - - - - Dftr - - 0.464 0.00 - - - - 0.252 0.15 - - Dfeu - - - - 0.248 0.28 - - - - 0.092 0.74Dfus - - - - - - - - - - - - Dfjp - - - - 0.517 0.00 - - - - 0.299 0.11Dfn3 - - 0.460 0.08 0.459 0.08 - - 0.361 0.24 0.359 0.25Dfot - - 0.031 0.89 0.030 0.89 - - -0.132 0.67 -0.132 0.67Dboi 0.033 0.85 0.013 0.94 0.007 0.97 0.030 0.87 0.007 0.97 0.006 0.98Dold -0.117 0.31 -0.137 0.25 -0.143 0.23 -0.178 0.17 -0.206 0.12 -0.211 0.11Dlarge -0.300 0.16 -0.327 0.13 -0.372 0.10 -0.330 0.18 -0.338 0.17 -0.375 0.14F-test 6.15 0.00 4.80 0.00 4.34 0.00 3.65 0.00 2.95 0.01 2.66 0.01White 67.23 0.00 70.48 0.00 71.61 0.00 25.31 0.23 29.25 0.35 28.85 0.63Adj. R-sq. 0.227 - 0.224 - 0.223 - 0.197 - 0.194 - 0.187 - Obs. 106 - 106 - 106 - 66 - 66 - 66 -
87

Appendix Table 8 (continued, 6/7)All plants Large plants with Output >=25 million baht
Indepen- Equation 1 Equation 2 Equation 3 Equation 1 Equation 2 Equation 3dent Coeffi- Sig- Coeffi- Sig- Coeffi- Sig- Coeffi- Sig- Coeffi- Sig- Coeffi- Sig-Variables, cients, nifi- cients, nifi- cients, nifi- cients, nifi- cients, nifi- cients, nifi-Indicator etc. cance etc. cance etc. cance etc. cance etc. cance etc. cance
ELECTRIC MACHINERY, ETC. (INCL. OFFICE & COMPUTING MACHINERY, PRECISION MACHINERY)Constant 3.101 0.00 3.063 0.00 3.058 0.00 3.148 0.00 3.082 0.00 3.061 0.00ln(EN/E) 0.100 0.03 0.089 0.05 0.091 0.05 0.138 0.01 0.128 0.02 0.130 0.02ln(K/E) 0.087 0.02 0.092 0.01 0.097 0.01 0.099 0.04 0.111 0.02 0.120 0.01Df -0.012 0.92 - - - - -0.096 0.48 - - - - Dftr - - -0.059 0.64 - - - - -0.162 0.25 - - Dfeu - - - - -0.044 0.85 - - - - -0.147 0.54Dfus - - - - 0.275 0.31 - - - - 0.201 0.47Dfjp - - - - -0.088 0.51 - - - - -0.198 0.18Dfn3 - - 0.046 0.78 0.050 0.76 - - -0.013 0.94 -0.012 0.94Dfot - - 0.616 0.04 0.621 0.04 - - 0.604 0.08 0.608 0.08Dboi 0.091 0.46 0.071 0.57 0.060 0.63 0.153 0.26 0.146 0.28 0.139 0.30Dold 0.277 0.00 0.280 0.00 0.278 0.01 0.295 0.00 0.317 0.00 0.316 0.00Dlarge 0.219 0.27 0.256 0.20 0.233 0.24 0.236 0.27 0.272 0.19 0.244 0.24F-test 5.00 0.00 4.60 0.00 3.88 0.00 4.45 0.00 4.21 0.00 3.61 0.00White 18.17 0.64 25.25 0.76 30.97 0.87 23.35 0.33 29.60 0.49 35.78 0.66Adj. R-sq. 0.141 - 0.165 - 0.165 - 0.143 - 0.171 - 0.174 - Obs. 147 - 147 - 147 - 125 - 125 - 125 -
MOTOR VEHICLESConstant 3.404 0.00 3.394 0.00 3.471 0.00 3.850 0.00 3.840 0.00 4.172 0.00ln(EN/E) 0.110 0.02 0.110 0.03 0.130 0.01 0.171 0.02 0.172 0.03 0.258 0.00ln(K/E) 0.049 0.38 0.054 0.35 0.043 0.45 0.045 0.60 0.050 0.58 -0.002 0.98Df -0.106 0.60 - - - - -0.266 0.18 - - - - Dftr - - -0.150 0.48 - - - - -0.283 0.19 - - Dfeu - - - - -0.082 0.86 - - - - 0.138 0.70Dfus - - - - 0.725 0.24 - - - - 0.839 0.13Dfjp - - - - -0.190 0.38 - - - - -0.384 0.07Dfn3 - - 0.073 0.82 0.081 0.80 - - -0.192 0.51 -0.197 0.47Dfot - - -0.169 0.78 -0.157 0.79 - - -0.440 0.40 -0.453 0.35Dboi 0.181 0.37 0.182 0.37 0.174 0.39 0.139 0.46 0.141 0.47 0.204 0.27Dold -0.010 0.93 -0.014 0.91 -0.006 0.96 -0.043 0.79 -0.048 0.77 -0.019 0.90Dlarge 0.849 0.02 0.882 0.02 0.891 0.03 0.579 0.14 0.580 0.15 0.710 0.06F-test 3.27 0.01 2.47 0.02 2.23 0.02 1.97 0.10 1.43 0.22 2.03 0.06White 17.89 0.59 20.37 0.73 20.77 0.80 18.15 0.51 - 0.24 - 0.57Adj. R-sq. 0.135 - 0.119 - 0.124 - 0.121 - 0.076 - 0.197 - Obs. 88 - 88 - 88 - 43 - 43 - 43 -
88

Appendix Table 8 (continued, 7/7)All plants Large plants with Output >=25 million baht
Indepen- Equation 1 Equation 2 Equation 3 Equation 1 Equation 2 Equation 3dent Coeffi- Sig- Coeffi- Sig- Coeffi- Sig- Coeffi- Sig- Coeffi- Sig- Coeffi- Sig-Variables, cients, nifi- cients, nifi- cients, nifi- cients, nifi- cients, nifi- cients, nifi-Indicator etc. cance etc. cance etc. cance etc. cance etc. cance etc. cance
FURNITUREConstant 3.109 0.00 3.118 0.00 3.121 0.00 3.125 0.00 3.097 0.00 3.106 0.00ln(EN/E) 0.543 0.00 0.545 0.00 0.544 0.00 0.149 0.07 0.138 0.07 0.138 0.07ln(K/E) 0.454 0.00 0.452 0.00 0.452 0.00 0.049 0.41 0.044 0.48 0.047 0.46Df 1.027 0.03 - - - - 0.378 0.01 - - - - Dftr - - 1.086 0.10 - - - - 0.255 0.24 - - Dfeu - - - - - - - - - - - - Dfus - - - - 0.860 0.40 - - - - 0.060 0.86Dfjp - - - - 1.227 0.13 - - - - 0.375 0.16Dfn3 - - 0.921 0.26 0.921 0.26 - - 0.376 0.24 0.370 0.25Dfot - - 1.038 0.29 1.038 0.29 - - 0.633 0.04 0.630 0.05Dboi -0.112 0.84 -0.117 0.84 -0.094 0.87 0.196 0.48 0.228 0.25 0.252 0.21Dold -0.400 0.15 -0.401 0.16 -0.413 0.15 0.246 0.06 0.253 0.08 0.225 0.13Dlarge 0.082 0.88 0.090 0.87 0.061 0.91 -0.005 0.99 0.003 0.99 -0.042 0.85F-test 14.90 0.00 10.93 0.00 9.62 0.00 2.92 0.02 2.27 0.04 2.07 0.06White 30.52 0.14 30.65 0.29 30.66 0.29 35.93 0.04 - 0.13 - 0.17Adj. R-sq. 0.467 - 0.455 - 0.450 - 0.211 - 0.192 - 0.182 - Obs. 96 - 96 - 96 - 44 - 44 - 44 -
JEWELRYConstant 3.667 0.00 3.717 0.00 3.658 0.00 Not estimated because there wereln(EN/E) 0.356 0.00 0.361 0.00 0.355 0.00 less than 30 observationsln(K/E) 0.040 0.67 0.027 0.79 0.039 0.70 - - - - - - Df 0.235 0.40 - - - - - - - - - - Dftr - - 0.284 0.46 - - - - - - - - Dfeu - - - - 0.115 0.78 - - - - - - Dfus - - - - - - - - - - - - Dfjp - - - - 0.614 0.21 - - - - - - Dfn3 - - - - 0.092 0.81 - - - - - - Dfot - - 0.423 0.39 0.410 0.40 - - - - - - Dboi 0.232 0.41 0.159 0.66 0.143 0.69 - - - - - - Dold 0.101 0.66 0.115 0.63 0.225 0.38 - - - - - - Dlarge -0.462 0.35 -0.418 0.42 -0.429 0.41 - - - - - - F-test 5.46 0.00 3.90 0.00 3.64 0.00 - - - - - - White 19.26 0.44 - 0.10 - 0.09 - - - - - - Adj. R-sq. 0.407 - 0.373 - 0.378 - - - - - - - Obs. 40 - 40 - 40 - 22 - 22 - 22 - Notes: Heteroscedasticity-consistent standard errors used if White is significant at 0.05 or less.If White cannot be calculated, the significance of the LM heteroscedasticity test is reported and used.- = not relevant or no plants in this category; n<30 = sample size smaller than 30.
89

Appendix Table 9a: Mean Value Added per Hour Worked in All Sample Plants by Foreign Ownership Share or Foreign Nationality and Industry, 1996 (baht)All Local Foreign Foreign, by nationality Foreign, by ownership
Industry plants plants total EU US JP N3 N3si N3tw N3kr OT OTch OTot MN MJ WHManufacturing 116 106 165 344 173 185 125 208 107 143 107 71 119 166 197 120 Food 136 137 128 116 286 105 111 96 119 77 129 35 162 124 141 138 Textiles 58 51 86 73 156 106 82 29 83 87 52 31 66 80 113 82 Apparel 58 57 66 104 23 75 75 80 79 48 48 70 42 71 43 71 Leather & footwear 73 74 68 51 41 109 55 - 62 42 67 68 67 54 97 46 Chemicals & products 183 119 341 344 309 558 177 409 120 162 123 72 135 228 711 301 Rubber products 173 132 285 2,765 146 73 405 989 81 221 105 207 89 241 616 31 Plastics & products 64 63 66 41 32 82 61 42 52 180 48 54 46 72 70 47 Non-metallic mineral products 135 137 109 164 48 98 101 65 109 95 73 64 78 123 82 23 Metal products 98 83 188 198 216 229 150 71 137 406 179 71 248 197 148 194 General machinery 104 95 136 278 77 121 137 187 116 205 150 31 197 147 132 105 Electric machinery, etc. 121 99 142 356 79 139 130 80 136 149 129 117 131 205 87 116 Office & computing machinery 184 169 186 - 56 69 335 46 355 378 217 - 217 779 100 136 Miscellaneous electric machinery 125 100 167 937 68 173 92 94 89 185 88 - 88 228 72 152 Radio, TV, communication 109 100 114 172 131 115 80 79 59 116 147 117 162 154 102 88 Precision machinery 103 93 115 50 17 142 53 - 53 - 126 - 126 128 69 126 Motor vehicles 151 101 387 85 386 449 70 - 85 8 187 24 210 394 403 148 Furniture 87 88 78 46 49 48 119 126 101 223 74 52 89 78 97 53 Jewelry 160 191 116 87 113 150 80 77 47 194 144 53 147 105 119 137 Other manufacturing industries 135 127 194 1,202 157 145 118 119 109 165 122 102 133 224 164 85 Beverages 291 311 166 - 142 - 426 426 - - 149 - 149 179 13 - Tobacco 85 86 78 109 - - - - - - 16 16 - 109 - 16 Wood products 107 106 119 404 - 221 38 35 38 - 100 178 56 130 72 - Paper products 177 124 474 15,560 29 153 73 - 76 47 111 89 132 605 73 34 Printing & publishing 159 158 178 350 332 77 37 37 - - 99 - 99 168 333 16 Oil, coal, nuclear, etc. 428 563 213 65 313 240 96 - - 96 140 - 140 188 313 - Basic metals 157 137 239 172 267 188 448 - 749 70 118 63 200 132 963 191 Misc. transportation machinery 87 81 122 99 - 166 79 131 27 - 92 177 50 136 31 23 Other misc. manufacturing 66 58 89 121 42 62 90 - 58 263 184 49 229 123 46 86Notes: EU=Europe; US=United States; JP=Japan; N3=N3si+N3tw+N3kr; N3si=Singapore, N3tw=Taiwan, KR=Korea; OT=OTch+OTot; OTch=China; OTot=Others. WH=wholly foreign, MJ.=50-99% foreign-owned; MN=1-49% foreign owned; .Sources: Author's calculations from plant-level data underlying National Statistical Office (1999).
90
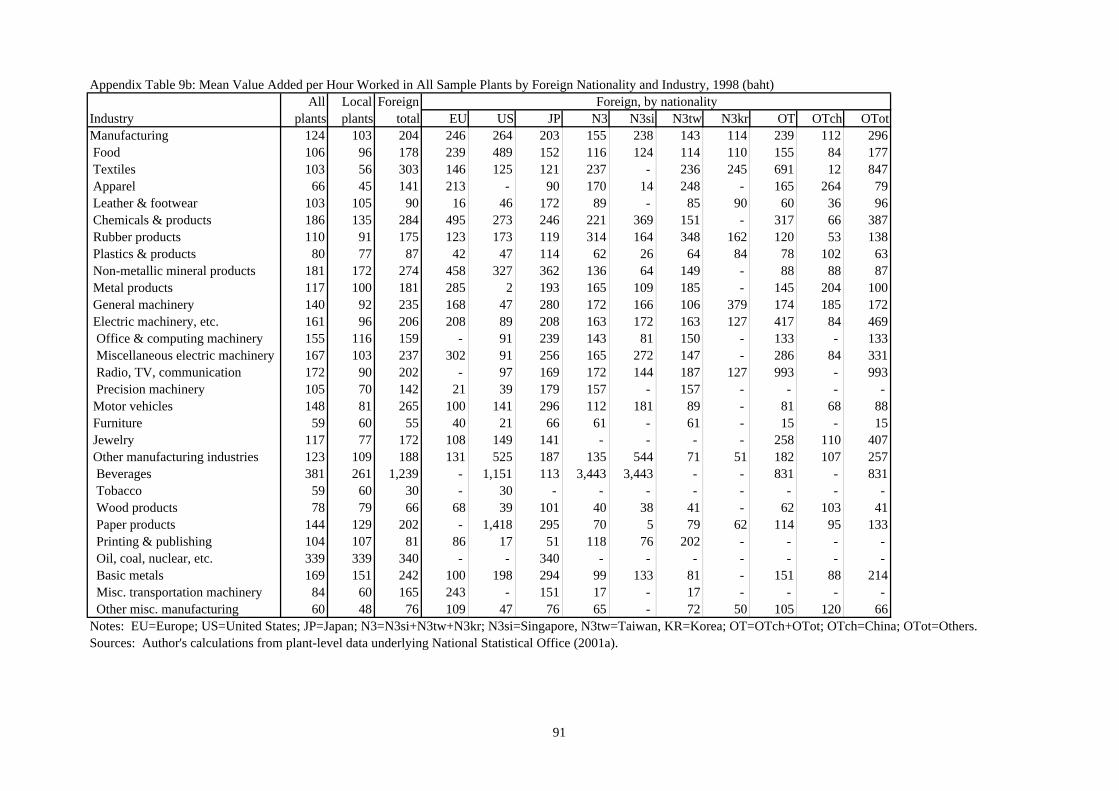
Appendix Table 9b: Mean Value Added per Hour Worked in All Sample Plants by Foreign Nationality and Industry, 1998 (baht)All Local Foreign Foreign, by nationality
Industry plants plants total EU US JP N3 N3si N3tw N3kr OT OTch OTotManufacturing 124 103 204 246 264 203 155 238 143 114 239 112 296 Food 106 96 178 239 489 152 116 124 114 110 155 84 177 Textiles 103 56 303 146 125 121 237 - 236 245 691 12 847 Apparel 66 45 141 213 - 90 170 14 248 - 165 264 79 Leather & footwear 103 105 90 16 46 172 89 - 85 90 60 36 96 Chemicals & products 186 135 284 495 273 246 221 369 151 - 317 66 387 Rubber products 110 91 175 123 173 119 314 164 348 162 120 53 138 Plastics & products 80 77 87 42 47 114 62 26 64 84 78 102 63 Non-metallic mineral products 181 172 274 458 327 362 136 64 149 - 88 88 87 Metal products 117 100 181 285 2 193 165 109 185 - 145 204 100 General machinery 140 92 235 168 47 280 172 166 106 379 174 185 172 Electric machinery, etc. 161 96 206 208 89 208 163 172 163 127 417 84 469 Office & computing machinery 155 116 159 - 91 239 143 81 150 - 133 - 133 Miscellaneous electric machinery 167 103 237 302 91 256 165 272 147 - 286 84 331 Radio, TV, communication 172 90 202 - 97 169 172 144 187 127 993 - 993 Precision machinery 105 70 142 21 39 179 157 - 157 - - - - Motor vehicles 148 81 265 100 141 296 112 181 89 - 81 68 88 Furniture 59 60 55 40 21 66 61 - 61 - 15 - 15 Jewelry 117 77 172 108 149 141 - - - - 258 110 407 Other manufacturing industries 123 109 188 131 525 187 135 544 71 51 182 107 257 Beverages 381 261 1,239 - 1,151 113 3,443 3,443 - - 831 - 831 Tobacco 59 60 30 - 30 - - - - - - - - Wood products 78 79 66 68 39 101 40 38 41 - 62 103 41 Paper products 144 129 202 - 1,418 295 70 5 79 62 114 95 133 Printing & publishing 104 107 81 86 17 51 118 76 202 - - - - Oil, coal, nuclear, etc. 339 339 340 - - 340 - - - - - - - Basic metals 169 151 242 100 198 294 99 133 81 - 151 88 214 Misc. transportation machinery 84 60 165 243 - 151 17 - 17 - - - - Other misc. manufacturing 60 48 76 109 47 76 65 - 72 50 105 120 66Notes: EU=Europe; US=United States; JP=Japan; N3=N3si+N3tw+N3kr; N3si=Singapore, N3tw=Taiwan, KR=Korea; OT=OTch+OTot; OTch=China; OTot=Others. Sources: Author's calculations from plant-level data underlying National Statistical Office (2001a).
91

Appendix Table 9c: Mean Value Added per Hour Worked in All Sample Plants by Foreign Nationality and Industry, 2000 (baht)All Local Foreign Foreign, by nationality
Industry plants plants total EU US JP N3 N3si N3tw N3kr OT OTch OTotManufacturing 81 74 110 163 130 107 86 108 78 96 96 80 104 Food 99 97 114 198 273 84 115 85 95 393 61 182 41 Textiles 47 41 77 73 49 93 56 - 56 - 85 66 109 Apparel 42 41 51 - 36 58 62 - 62 - 44 52 40 Leather & footwear 59 53 86 - - 62 104 - 69 132 24 - 24 Chemicals & products 118 92 179 146 234 234 84 66 88 - 207 - 207 Rubber products 88 64 157 255 35 41 98 32 114 - 278 51 619 Plastics & products 53 54 51 43 - 44 41 - 41 - 72 66 75 Non-metallic mineral products 61 58 83 129 30 79 65 69 63 - 43 - 43 Metal products 96 85 134 153 - 120 150 199 123 - 117 46 188 General machinery 120 88 181 98 - 225 58 59 58 - 140 320 49 Electric machinery, etc. 82 71 91 66 109 86 98 217 80 34 132 - 132 Office & computing machinery 120 30 136 172 75 175 67 - 67 - 173 - 173 Miscellaneous electric machinery 92 79 107 52 132 92 142 373 116 39 - - - Radio, TV, communication 74 59 79 - - 78 80 139 51 - 91 - 91 Precision machinery 61 68 53 47 - 61 32 - 35 29 - - - Motor vehicles 76 46 146 463 115 135 68 34 101 - 57 - 57 Furniture 47 44 75 - 71 57 113 - 113 - 46 53 38 Jewelry 66 55 80 94 - 95 69 - 74 54 44 72 31 Other manufacturing industries 81 79 91 238 100 68 57 22 64 53 59 72 55 Beverages 91 65 257 391 219 45 - - - - 46 - 46 Tobacco 177 173 194 745 11 - - - - - 9 - 9 Wood products 55 56 49 - - 82 37 - 25 61 20 20 - Paper products 90 87 97 63 - 129 100 - 100 - 62 - 62 Printing & publishing 63 64 59 - 24 83 48 22 125 - 111 - 111 Oil, coal, nuclear, etc. 138 132 148 194 - - - - - - 11 - 11 Basic metals 78 82 67 115 121 58 - - - - 42 37 47 Misc. transportation machinery 62 59 82 69 - 74 - - - - 119 - 119 Other misc. manufacturing 88 110 47 42 39 41 43 - 37 51 76 115 38Notes: EU=Europe; US=United States; JP=Japan; N3=N3si+N3tw+N3kr; N3si=Singapore, N3tw=Taiwan, KR=Korea; OT=OTch+OTot; OTch=China; OTot=Others. Sources: Author's calculations from plant-level data underlying National Statistical Office (forthcoming).
92

Appendix Table 9d: Mean Value Added per Hour Worked in Large Plants by Foreign Ownership Share or Foreign Nationality and Industry, 1996 (baht)All Local Foreign Foreign, by nationality Foreign, by ownership
Industry plants plants total EU US JP N3 N3si N3tw N3kr OT OTch OTot MN MJ WHManufacturing 177 173 189 398 189 204 147 238 125 167 123 83 134 194 222 130 Food 206 221 144 122 303 118 121 105 132 77 153 40 184 135 176 156 Textiles 74 64 96 83 156 107 95 25 95 103 63 34 77 92 122 87 Apparel 72 71 75 162 30 83 91 142 90 51 46 47 45 82 41 77 Leather & footwear 100 107 77 51 41 123 62 - 58 76 71 - 71 60 119 46 Chemicals & products 227 150 368 344 343 611 188 409 122 151 125 71 135 250 751 301 Rubber products 209 165 303 2,765 146 80 448 989 92 221 106 207 90 259 659 31 Plastics & products 79 80 77 47 20 93 75 47 65 180 50 69 44 83 76 58 Non-metallic mineral products 256 275 120 178 48 105 113 65 125 - 75 103 61 134 87 29 Metal products 150 124 219 221 311 240 197 99 181 406 193 73 248 243 161 205 General machinery 143 138 153 315 77 130 155 187 132 205 203 43 222 183 130 100 Electric machinery, etc. 148 139 153 378 81 149 143 77 153 161 134 117 137 241 90 120 Office & computing machinery 199 234 196 - 58 69 372 46 404 378 217 - 217 779 100 144 Miscellaneous electric machinery 161 140 179 937 68 185 98 94 96 185 93 - 93 260 74 154 Radio, TV, communication 126 142 121 172 131 123 86 74 62 126 147 117 162 176 106 91 Precision machinery 125 119 129 45 17 168 53 - 53 - 135 - 135 178 70 126 Motor vehicles 270 182 420 85 386 469 78 - 101 8 283 24 348 443 403 148 Furniture 146 160 87 46 49 52 128 - 110 223 96 68 113 88 111 53 Jewelry 251 412 134 96 122 158 89 99 47 194 175 53 181 116 135 182 Other manufacturing industries 227 225 234 1,483 167 164 148 126 139 196 141 114 156 265 200 107 Beverages 517 640 166 - 142 - 426 426 - - 149 - 149 179 13 - Tobacco 674 972 78 109 - - - - - - 16 16 - 109 - 16 Wood products 175 176 164 404 - 249 56 35 121 - 115 234 43 181 71 - Paper products 237 160 574 15,560 29 153 80 - 87 47 116 97 132 710 69 - Printing & publishing 292 301 210 350 408 97 37 37 - - 99 - 99 191 333 - Oil, coal, nuclear, etc. 463 641 213 65 313 240 96 - - 96 140 - 140 188 313 - Basic metals 233 217 276 207 267 213 632 - 916 64 118 63 200 142 1,194 347 Misc. transportation machinery 128 126 135 101 - 166 80 186 27 - 128 177 78 155 31 23 Other misc. manufacturing 94 87 103 167 45 64 99 - 57 306 329 11 435 147 52 104Notes: EU=Europe; US=United States; JP=Japan; N3=N3si+N3tw+N3kr; N3si=Singapore, N3tw=Taiwan, KR=Korea; OT=OTch+OTot; OTch=China; OTot=Others. WH=wholly foreign, MJ.=50-99% foreign-owned; MN=1-49% foreign owned; .Sources: Author's calculations from plant-level data underlying National Statistical Office (1999).
93

Appendix Table 9e: Mean Value Added per Hour Worked in Large Plants by Foreign Nationality and Industry, 1998 (baht)All Local Foreign Foreign, by nationality
Industry plants plants total EU US JP N3 N3si N3tw N3kr OT OTch OTotManufacturing 168 139 228 282 281 215 184 286 170 129 280 135 336 Food 155 146 190 239 489 161 121 124 121 110 177 133 183 Textiles 160 81 332 146 125 123 276 - 279 245 788 13 917 Apparel 105 70 160 213 - 90 248 - 248 - 199 479 79 Leather & footwear 128 136 92 - 46 152 101 - 113 95 60 36 96 Chemicals & products 229 172 308 495 294 261 256 369 187 - 342 60 409 Rubber products 127 105 181 123 173 128 340 164 384 162 120 53 138 Plastics & products 103 107 96 47 47 117 67 26 72 84 99 119 78 Non-metallic mineral products 167 133 318 511 327 362 177 64 210 - 114 103 125 Metal products 169 146 228 608 - 216 224 163 244 - 229 294 164 General machinery 197 143 248 168 47 280 219 166 147 379 203 311 188 Electric machinery, etc. 193 125 222 302 89 222 174 186 175 127 471 159 497 Office & computing machinery 155 116 159 - 91 239 143 81 150 - 133 - 133 Miscellaneous electric machinery 205 135 254 302 91 278 177 272 159 - 314 159 331 Radio, TV, communication 193 103 214 - 97 177 185 163 199 127 1,428 - 1,428 Precision machinery 161 118 188 - 39 204 202 - 202 - - - - Motor vehicles 222 135 275 100 141 305 112 181 89 - 88 68 109 Furniture 88 95 56 40 21 64 65 - 65 - 16 - 16 Jewelry 164 124 197 122 160 141 - - - - 301 142 407 Other manufacturing industries 193 180 228 158 645 209 191 918 87 66 196 107 308 Beverages 700 528 1,239 - 1,151 113 3,443 3,443 - - 831 - 831 Tobacco 135 149 30 - 30 - - - - - - - - Wood products 113 115 91 102 - 162 47 29 52 - 66 103 30 Paper products 181 161 249 - 1,418 295 106 - 114 62 114 95 133 Printing & publishing 131 142 75 63 17 51 135 67 202 - - - - Oil, coal, nuclear, etc. 339 339 340 - - 340 - - - - - - - Basic metals 245 235 268 100 198 326 127 133 121 - 151 88 214 Misc. transportation machinery 138 89 182 360 - 151 17 - 17 - - - - Other misc. manufacturing 84 82 85 109 42 80 74 - 77 67 114 120 81Notes: EU=Europe; US=United States; JP=Japan; N3=N3si+N3tw+N3kr; N3si=Singapore, N3tw=Taiwan, KR=Korea; OT=OTch+OTot; OTch=China; OTot=Others. Sources: Author's calculations from plant-level data underlying National Statistical Office (2001a).
94
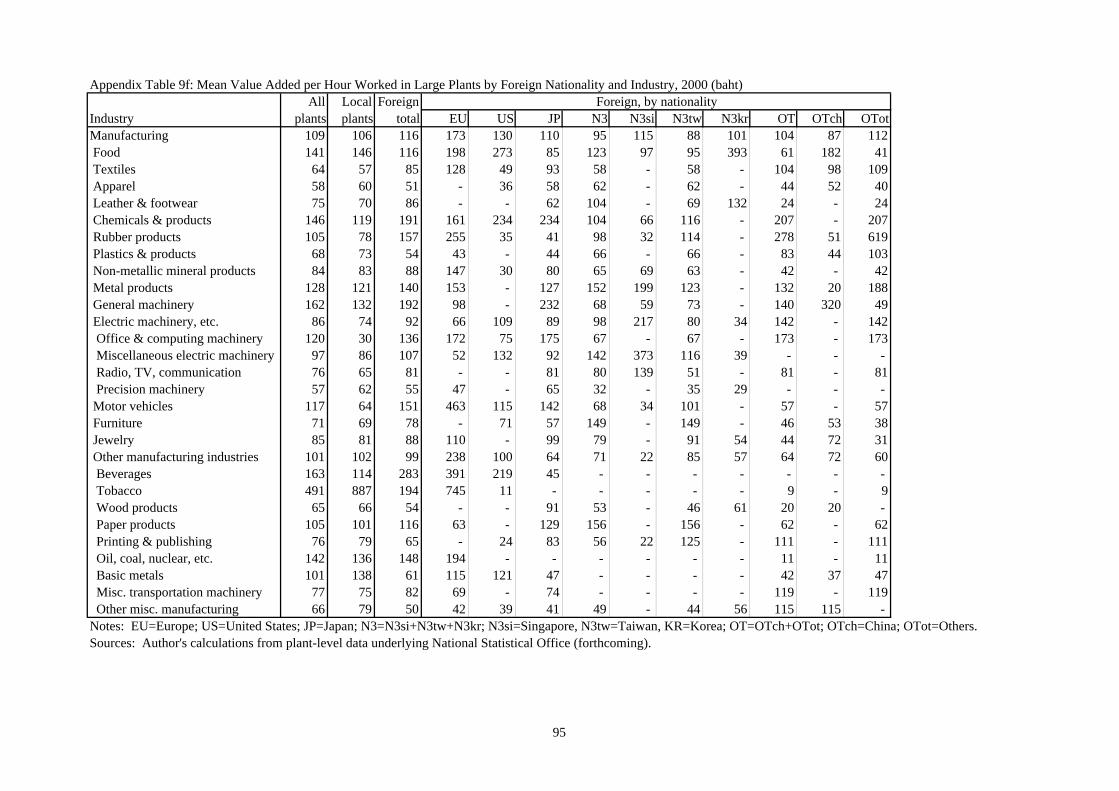
Appendix Table 9f: Mean Value Added per Hour Worked in Large Plants by Foreign Nationality and Industry, 2000 (baht)All Local Foreign Foreign, by nationality
Industry plants plants total EU US JP N3 N3si N3tw N3kr OT OTch OTotManufacturing 109 106 116 173 130 110 95 115 88 101 104 87 112 Food 141 146 116 198 273 85 123 97 95 393 61 182 41 Textiles 64 57 85 128 49 93 58 - 58 - 104 98 109 Apparel 58 60 51 - 36 58 62 - 62 - 44 52 40 Leather & footwear 75 70 86 - - 62 104 - 69 132 24 - 24 Chemicals & products 146 119 191 161 234 234 104 66 116 - 207 - 207 Rubber products 105 78 157 255 35 41 98 32 114 - 278 51 619 Plastics & products 68 73 54 43 - 44 66 - 66 - 83 44 103 Non-metallic mineral products 84 83 88 147 30 80 65 69 63 - 42 - 42 Metal products 128 121 140 153 - 127 152 199 123 - 132 20 188 General machinery 162 132 192 98 - 232 68 59 73 - 140 320 49 Electric machinery, etc. 86 74 92 66 109 89 98 217 80 34 142 - 142 Office & computing machinery 120 30 136 172 75 175 67 - 67 - 173 - 173 Miscellaneous electric machinery 97 86 107 52 132 92 142 373 116 39 - - - Radio, TV, communication 76 65 81 - - 81 80 139 51 - 81 - 81 Precision machinery 57 62 55 47 - 65 32 - 35 29 - - - Motor vehicles 117 64 151 463 115 142 68 34 101 - 57 - 57 Furniture 71 69 78 - 71 57 149 - 149 - 46 53 38 Jewelry 85 81 88 110 - 99 79 - 91 54 44 72 31 Other manufacturing industries 101 102 99 238 100 64 71 22 85 57 64 72 60 Beverages 163 114 283 391 219 45 - - - - - - - Tobacco 491 887 194 745 11 - - - - - 9 - 9 Wood products 65 66 54 - - 91 53 - 46 61 20 20 - Paper products 105 101 116 63 - 129 156 - 156 - 62 - 62 Printing & publishing 76 79 65 - 24 83 56 22 125 - 111 - 111 Oil, coal, nuclear, etc. 142 136 148 194 - - - - - - 11 - 11 Basic metals 101 138 61 115 121 47 - - - - 42 37 47 Misc. transportation machinery 77 75 82 69 - 74 - - - - 119 - 119 Other misc. manufacturing 66 79 50 42 39 41 49 - 44 56 115 115 - Notes: EU=Europe; US=United States; JP=Japan; N3=N3si+N3tw+N3kr; N3si=Singapore, N3tw=Taiwan, KR=Korea; OT=OTch+OTot; OTch=China; OTot=Others. Sources: Author's calculations from plant-level data underlying National Statistical Office (forthcoming).
95

Appendix Table 10a: Mean Compensation per Hour in All Sample Plants by Foreign Ownership Share or Foreign Nationality and Industry, 1996 (baht)All Local Foreign Foreign, by nationality Foreign, by ownership
Industry plants plants total EU US JP N3 N3si N3tw N3kr OT OTch OTot MN MJ WHManufacturing 29 27 37 60 44 38 29 32 28 34 34 26 37 37 39 34 Food 23 22 28 30 40 28 22 20 21 29 30 22 33 28 31 26 Textiles 21 21 23 42 23 22 21 23 21 22 21 19 21 21 29 22 Apparel 27 27 30 31 20 32 30 20 32 23 28 31 27 29 31 38 Leather & footwear 30 30 31 25 25 41 26 - 27 26 33 31 34 28 31 38 Chemicals & products 44 38 59 106 65 59 41 37 41 47 46 27 50 50 81 62 Rubber products 21 22 20 14 37 18 21 19 20 56 18 15 18 23 14 13 Plastics & products 23 22 27 37 20 29 26 26 25 37 23 32 19 26 33 23 Non-metallic mineral products 24 23 40 48 23 49 35 25 38 34 29 22 33 38 52 18 Metal products 32 30 38 45 61 41 33 31 32 55 31 33 30 40 35 34 General machinery 37 35 46 51 45 47 39 50 36 46 55 30 65 47 40 52 Electric machinery, etc. 36 34 39 93 41 32 27 28 26 32 74 36 81 50 29 33 Office & computing machinery 35 32 36 - 48 20 35 12 37 33 57 - 57 18 28 42 Miscellaneous electric machinery 40 33 51 213 22 39 26 41 25 21 180 - 180 62 34 48 Radio, TV, communication 30 34 28 50 48 25 25 25 21 34 24 36 19 38 24 21 Precision machinery 38 37 39 38 19 38 25 - 25 - 55 - 55 45 34 36 Motor vehicles 35 32 50 49 65 54 24 - 19 43 34 43 33 47 63 34 Furniture 27 26 30 38 39 25 33 26 31 47 30 33 28 31 35 23 Jewelry 39 33 47 46 44 67 47 53 36 58 44 34 44 48 44 48 Other manufacturing industries 30 29 38 106 44 40 29 54 25 35 29 21 34 41 37 28 Beverages 37 36 40 - 33 - 124 124 - - 34 - 34 40 50 - Tobacco 11 11 13 18 - - - - - - 4 4 - 18 - 4 Wood products 24 24 29 42 - 39 23 34 20 - 26 16 31 27 37 - Paper products 35 32 54 1,022 41 34 28 - 25 45 27 28 26 63 30 9 Printing & publishing 37 37 32 25 33 33 36 36 - - 35 - 35 33 33 27 Oil, coal, nuclear, etc. 62 50 81 32 111 97 45 - - 45 24 - 24 73 111 - Basic metals 29 28 34 39 16 36 30 - 22 40 32 28 38 36 17 41 Misc. transportation machinery 34 34 38 72 - 32 35 59 11 - 34 19 42 42 15 7 Other misc. manufacturing 27 25 33 46 49 38 27 - 27 27 34 15 41 32 38 30Notes: EU=Europe; US=United States; JP=Japan; N3=N3si+N3tw+N3kr; N3si=Singapore, N3tw=Taiwan, KR=Korea; OT=OTch+OTot; OTch=China; OTot=Others. WH=wholly foreign, MJ.=50-99% foreign-owned; MN=1-49% foreign owned; .Sources: Author's calculations from plant-level data underlying National Statistical Office (1999).
96

Appendix Table 10b: Mean Compensation per Hour in All Sample Plants by Foreign Ownership Share or Foreign Nationality and Industry, 1998 (baht)All Local Foreign Foreign, by nationality
Industry plants plants total EU US JP N3 N3si N3tw N3kr OT OTch OTotManufacturing 45 44 49 58 57 50 41 44 41 38 53 34 62 Food 25 23 34 36 82 28 27 21 27 45 37 34 38 Textiles 34 22 85 29 27 31 112 - 116 35 152 13 184 Apparel 24 20 36 29 - 33 25 9 33 - 45 54 38 Leather & footwear 30 29 37 26 34 50 38 - 25 45 27 25 30 Chemicals & products 51 41 70 115 90 59 47 70 37 - 81 30 95 Rubber products 27 26 30 30 49 23 35 31 37 21 25 27 24 Plastics & products 28 25 33 17 36 38 27 18 29 23 34 33 35 Non-metallic mineral products 152 162 53 63 83 53 46 34 48 - 28 25 30 Metal products 38 35 47 57 24 54 37 47 33 - 36 31 40 General machinery 46 38 62 52 27 71 49 62 40 63 48 44 48 Electric machinery, etc. 41 34 45 85 34 46 39 42 39 32 45 16 49 Office & computing machinery 38 44 37 - 15 39 38 14 40 - 67 - 67 Miscellaneous electric machinery 43 37 49 105 39 54 39 56 36 - 28 16 30 Radio, TV, communication 40 31 43 - 41 39 42 42 44 32 101 - 101 Precision machinery 35 27 43 46 22 51 33 - 33 - - - - Motor vehicles 48 38 65 41 54 70 35 28 38 - 35 43 32 Furniture 25 25 28 32 20 28 27 - 27 - 36 - 36 Jewelry 39 29 52 44 41 85 - - - - 58 51 65 Other manufacturing industries 31 28 43 50 57 56 31 48 28 31 27 33 22 Beverages 34 32 55 - 78 16 74 74 - - 30 - 30 Tobacco 13 12 35 - 35 - - - - - - - - Wood products 24 24 26 23 17 33 22 35 17 - 25 39 18 Paper products 32 30 43 - 173 62 30 14 30 42 19 16 22 Printing & publishing 38 37 41 54 9 54 34 32 38 - - - - Oil, coal, nuclear, etc. 53 38 127 - - 127 - - - - - - - Basic metals 41 36 64 15 52 76 55 114 26 - 28 32 23 Misc. transportation machinery 41 34 65 93 - 56 33 - 33 - - - - Other misc. manufacturing 27 23 32 38 23 35 30 - 31 29 32 38 16Notes: EU=Europe; US=United States; JP=Japan; N3=N3si+N3tw+N3kr; N3si=Singapore, N3tw=Taiwan, KR=Korea; OT=OTch+OTot; OTch=China; OTot=Others. Sources: Author's calculations from plant-level data underlying National Statistical Office (2001a).
97

Appendix Table 10c: Mean Compensation per Hour in All Sample Plants by Foreign Ownership Share or Foreign Nationality and Industry, 2000 (baht)All Local Foreign Foreign, by nationality
Industry plants plants total EU US JP N3 N3si N3tw N3kr OT OTch OTotManufacturing 26 24 35 37 38 37 30 34 27 42 34 37 33 Food 23 22 28 33 29 27 33 34 28 53 19 41 15 Textiles 19 18 27 22 31 31 23 - 23 - 28 27 30 Apparel 22 21 31 - 27 28 29 - 29 - 37 36 38 Leather & footwear 28 25 42 - - 40 42 - 21 59 39 - 39 Chemicals & products 37 32 48 38 67 63 28 42 25 - 50 - 50 Rubber products 23 23 24 38 12 18 21 8 25 - 24 27 19 Plastics & products 22 19 31 20 - 23 55 - 55 - 34 48 25 Non-metallic mineral products 24 23 36 47 81 26 27 33 25 - 35 - 35 Metal products 28 27 34 30 - 43 30 28 30 - 23 16 30 General machinery 39 35 48 46 - 49 56 123 39 - 33 31 34 Electric machinery, etc. 33 29 36 41 41 34 32 31 29 50 57 - 57 Office & computing machinery 43 42 43 47 39 38 38 - 38 - 59 - 59 Miscellaneous electric machinery 36 31 42 70 42 41 34 46 29 45 - - - Radio, TV, communication 29 26 30 - - 29 26 24 27 - 55 - 55 Precision machinery 29 26 33 25 - 36 38 - 21 55 - - - Motor vehicles 33 30 41 54 55 40 36 37 35 - 30 - 30 Furniture 18 17 28 - 18 31 28 - 28 - 37 42 31 Jewelry 30 24 37 32 - 46 29 - 26 38 50 65 43 Other manufacturing industries 28 27 33 34 34 40 23 24 22 26 37 53 31 Beverages 23 21 36 27 56 31 - - - - 18 - 18 Tobacco 18 18 19 15 22 - - - - - 16 - 16 Wood products 23 23 21 - - 23 16 - 22 3 30 30 - Paper products 29 29 29 34 - 47 21 - 21 - 21 - 21 Printing & publishing 30 29 36 - 18 25 26 24 31 - 104 - 104 Oil, coal, nuclear, etc. 44 44 45 56 - - - - - - 9 - 9 Basic metals 36 32 46 37 14 50 - - - - 52 40 64 Misc. transportation machinery 34 33 38 27 - 43 - - - - 36 - 36 Other misc. manufacturing 28 27 28 25 33 27 25 - 22 30 42 70 13Notes: EU=Europe; US=United States; JP=Japan; N3=N3si+N3tw+N3kr; N3si=Singapore, N3tw=Taiwan, KR=Korea; OT=OTch+OTot; OTch=China; OTot=Others. Sources: Author's calculations from plant-level data underlying National Statistical Office (forthcoming).
98
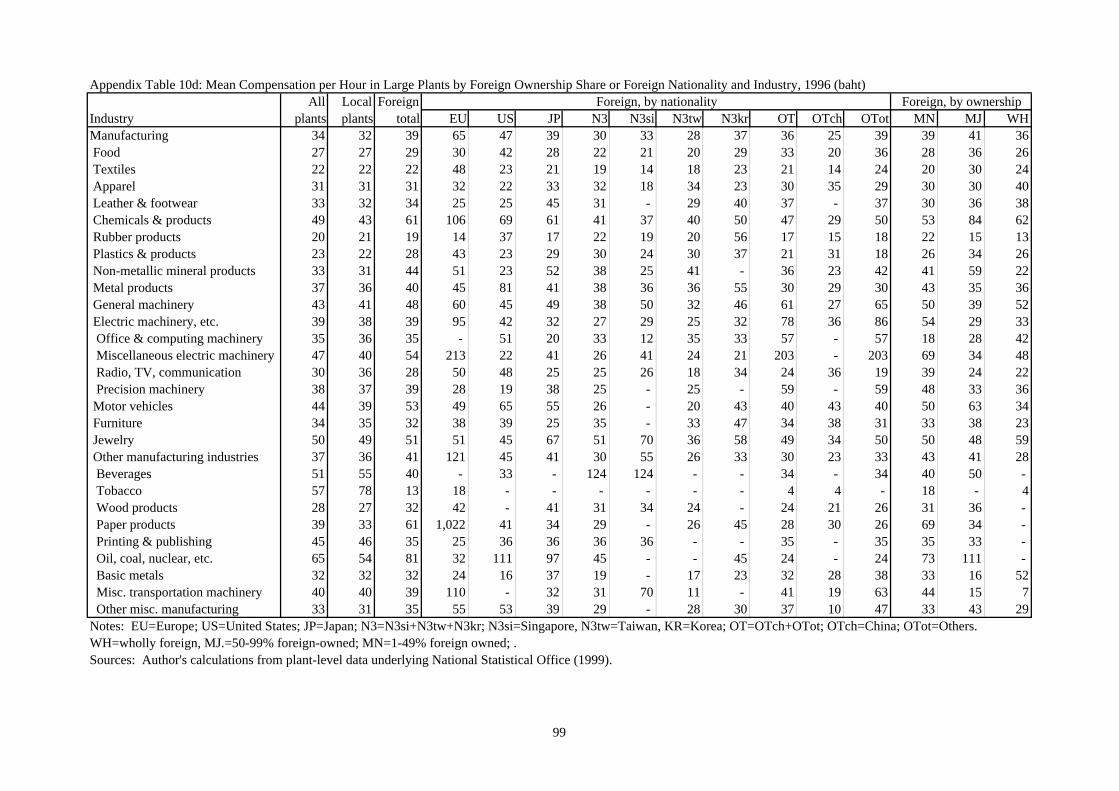
Appendix Table 10d: Mean Compensation per Hour in Large Plants by Foreign Ownership Share or Foreign Nationality and Industry, 1996 (baht)All Local Foreign Foreign, by nationality Foreign, by ownership
Industry plants plants total EU US JP N3 N3si N3tw N3kr OT OTch OTot MN MJ WHManufacturing 34 32 39 65 47 39 30 33 28 37 36 25 39 39 41 36 Food 27 27 29 30 42 28 22 21 20 29 33 20 36 28 36 26 Textiles 22 22 22 48 23 21 19 14 18 23 21 14 24 20 30 24 Apparel 31 31 31 32 22 33 32 18 34 23 30 35 29 30 30 40 Leather & footwear 33 32 34 25 25 45 31 - 29 40 37 - 37 30 36 38 Chemicals & products 49 43 61 106 69 61 41 37 40 50 47 29 50 53 84 62 Rubber products 20 21 19 14 37 17 22 19 20 56 17 15 18 22 15 13 Plastics & products 23 22 28 43 23 29 30 24 30 37 21 31 18 26 34 26 Non-metallic mineral products 33 31 44 51 23 52 38 25 41 - 36 23 42 41 59 22 Metal products 37 36 40 45 81 41 38 36 36 55 30 29 30 43 35 36 General machinery 43 41 48 60 45 49 38 50 32 46 61 27 65 50 39 52 Electric machinery, etc. 39 38 39 95 42 32 27 29 25 32 78 36 86 54 29 33 Office & computing machinery 35 36 35 - 51 20 33 12 35 33 57 - 57 18 28 42 Miscellaneous electric machinery 47 40 54 213 22 41 26 41 24 21 203 - 203 69 34 48 Radio, TV, communication 30 36 28 50 48 25 25 26 18 34 24 36 19 39 24 22 Precision machinery 38 37 39 28 19 38 25 - 25 - 59 - 59 48 33 36 Motor vehicles 44 39 53 49 65 55 26 - 20 43 40 43 40 50 63 34 Furniture 34 35 32 38 39 25 35 - 33 47 34 38 31 33 38 23 Jewelry 50 49 51 51 45 67 51 70 36 58 49 34 50 50 48 59 Other manufacturing industries 37 36 41 121 45 41 30 55 26 33 30 23 33 43 41 28 Beverages 51 55 40 - 33 - 124 124 - - 34 - 34 40 50 - Tobacco 57 78 13 18 - - - - - - 4 4 - 18 - 4 Wood products 28 27 32 42 - 41 31 34 24 - 24 21 26 31 36 - Paper products 39 33 61 1,022 41 34 29 - 26 45 28 30 26 69 34 - Printing & publishing 45 46 35 25 36 36 36 36 - - 35 - 35 35 33 - Oil, coal, nuclear, etc. 65 54 81 32 111 97 45 - - 45 24 - 24 73 111 - Basic metals 32 32 32 24 16 37 19 - 17 23 32 28 38 33 16 52 Misc. transportation machinery 40 40 39 110 - 32 31 70 11 - 41 19 63 44 15 7 Other misc. manufacturing 33 31 35 55 53 39 29 - 28 30 37 10 47 33 43 29Notes: EU=Europe; US=United States; JP=Japan; N3=N3si+N3tw+N3kr; N3si=Singapore, N3tw=Taiwan, KR=Korea; OT=OTch+OTot; OTch=China; OTot=Others. WH=wholly foreign, MJ.=50-99% foreign-owned; MN=1-49% foreign owned; .Sources: Author's calculations from plant-level data underlying National Statistical Office (1999).
99

Appendix Table 10e: Mean Compensation per Hour in Large Plants by Foreign Ownership Share or Foreign Nationality and Industry, 1998 (baht)All Local Foreign Foreign, by nationality
Industry plants plants total EU US JP N3 N3si N3tw N3kr OT OTch OTotManufacturing 39 33 52 61 60 52 44 48 44 40 59 35 68 Food 30 29 35 36 82 28 28 21 28 45 39 36 39 Textiles 45 23 91 29 27 30 128 - 135 35 172 11 199 Apparel 31 25 39 29 - 33 33 - 33 - 51 84 38 Leather & footwear 33 31 40 - 34 56 43 - 30 50 27 25 30 Chemicals & products 56 43 73 115 97 59 50 70 38 - 86 26 100 Rubber products 28 27 30 30 49 23 36 31 39 21 25 27 24 Plastics & products 29 26 33 14 36 37 26 18 28 23 38 30 46 Non-metallic mineral products 38 34 57 68 83 53 52 34 57 - 26 24 28 Metal products 43 40 52 67 - 56 45 65 38 - 41 36 46 General machinery 54 43 64 52 27 71 54 62 43 63 54 47 56 Electric machinery, etc. 44 39 47 105 34 49 40 40 41 32 47 23 49 Office & computing machinery 38 44 37 - 15 39 38 14 40 - 67 - 67 Miscellaneous electric machinery 48 44 52 105 39 59 41 56 38 - 29 23 30 Radio, TV, communication 41 30 44 - 41 41 41 37 44 32 125 - 125 Precision machinery 42 32 48 - 22 54 41 - 41 - - - - Motor vehicles 60 49 67 41 54 72 35 28 38 - 43 43 43 Furniture 32 33 27 32 20 26 26 - 26 - 42 - 42 Jewelry 49 41 55 41 42 85 - - - - 64 63 65 Other manufacturing industries 38 34 48 53 65 59 34 59 30 33 28 33 23 Beverages 47 45 55 - 78 16 74 74 - - 30 - 30 Tobacco 18 16 35 - 35 - - - - - - - - Wood products 28 27 28 31 - 44 18 17 18 - 25 39 11 Paper products 36 32 51 - 173 62 41 - 41 42 19 16 22 Printing & publishing 41 42 36 32 9 54 35 31 38 - - - - Oil, coal, nuclear, etc. 53 38 127 - - 127 - - - - - - - Basic metals 49 41 67 15 52 79 75 114 35 - 28 32 23 Misc. transportation machinery 55 40 69 127 - 56 33 - 33 - - - - Other misc. manufacturing 32 31 33 38 18 37 27 - 26 30 35 38 22Notes: EU=Europe; US=United States; JP=Japan; N3=N3si+N3tw+N3kr; N3si=Singapore, N3tw=Taiwan, KR=Korea; OT=OTch+OTot; OTch=China; OTot=Others. Sources: Author's calculations from plant-level data underlying National Statistical Office (2001a).
100

Appendix Table 10f: Mean Compensation per Hour in Large Sample Plants by Foreign Ownership Share or Foreign Nationality and Industry, 2000 (baht)All Local Foreign Foreign, by nationality
Industry plants plants total EU US JP N3 N3si N3tw N3kr OT OTch OTotManufacturing 31 29 35 37 38 37 31 36 27 43 35 38 34 Food 27 27 28 33 29 27 35 37 28 53 19 41 15 Textiles 22 20 27 17 31 31 23 - 23 - 29 26 30 Apparel 28 27 31 - 27 28 29 - 29 - 37 36 38 Leather & footwear 32 28 42 - - 40 42 - 21 59 39 - 39 Chemicals & products 42 37 50 42 67 63 27 42 22 - 50 - 50 Rubber products 24 24 24 38 12 18 21 8 25 - 24 27 19 Plastics & products 23 22 25 20 - 24 13 - 13 - 37 50 31 Non-metallic mineral products 31 29 37 48 81 30 27 33 25 - 38 - 38 Metal products 33 32 36 30 - 44 31 28 32 - 23 10 30 General machinery 42 36 48 46 - 49 63 123 33 - 33 31 34 Electric machinery, etc. 34 31 36 41 41 34 32 31 29 50 56 - 56 Office & computing machinery 43 42 43 47 39 38 38 - 38 - 59 - 59 Miscellaneous electric machinery 38 34 42 70 42 41 34 46 29 45 - - - Radio, TV, communication 28 27 29 - - 29 26 24 27 - 49 - 49 Precision machinery 31 27 33 25 - 36 38 - 21 55 - - - Motor vehicles 41 40 42 54 55 42 36 37 35 - 30 - 30 Furniture 24 23 28 - 18 31 27 - 27 - 37 42 31 Jewelry 36 32 38 34 - 46 29 - 25 38 50 65 43 Other manufacturing industries 34 33 35 34 34 40 26 24 27 25 42 53 37 Beverages 32 30 38 27 56 31 - - - - - - - Tobacco 37 61 19 15 22 - - - - - 16 - 16 Wood products 27 27 22 - - 22 17 - 31 3 30 30 - Paper products 32 32 33 34 - 47 26 - 26 - 21 - 21 Printing & publishing 40 41 38 - 18 25 27 24 31 - 104 - 104 Oil, coal, nuclear, etc. 42 41 45 56 - - - - - - 9 - 9 Basic metals 47 48 46 37 14 50 - - - - 52 40 64 Misc. transportation machinery 36 35 38 27 - 43 - - - - 36 - 36 Other misc. manufacturing 31 30 31 25 33 27 27 - 25 29 70 70 - Notes: EU=Europe; US=United States; JP=Japan; N3=N3si+N3tw+N3kr; N3si=Singapore, N3tw=Taiwan, KR=Korea; OT=OTch+OTot; OTch=China; OTot=Others. Sources: Author's calculations from plant-level data underlying National Statistical Office (forthcoming).
101

Appendix Table 11a: Number of Plants in Thai Manufacturing by Foreign Ownership Share or Foreign Nationality and Industry, 1996 (number)Sample plants
Publi- All Foreign Foreign, by nationality Foreign, by ownershipIndustry cation plants total EU US JP N3 N3si N3tw N3kr OT OTch OTot MN MJ WHManufacturing 23,677 10,494 1,822 140 124 696 527 68 388 71 335 86 249 1,142 379 301 Food 3,294 1,483 190 19 17 72 47 7 35 5 35 9 26 139 32 19 Textiles 1,520 716 136 7 5 46 49 2 37 10 29 12 17 105 21 10 Apparel 1,877 743 101 9 3 31 22 2 17 3 36 8 28 77 17 7 Leather & footwear 832 289 39 2 2 9 21 0 14 7 5 1 4 18 14 7 Chemicals & products 936 512 146 17 17 53 34 6 23 5 25 5 20 94 31 21 Rubber products 540 284 75 3 3 19 20 7 12 1 30 4 26 49 15 11 Plastics & products 1,272 604 114 4 3 49 36 7 26 3 22 7 15 67 24 23 Non-metallic mineral products 2,509 964 59 12 2 15 24 4 18 2 6 2 4 43 13 3 Metal products 2,261 831 125 7 6 44 50 6 40 4 18 7 11 80 21 24 General machinery 982 480 107 6 2 59 26 4 19 3 14 4 10 68 19 20 Electric machinery, etc. 890 540 276 14 21 136 79 11 58 10 26 4 22 104 75 97 Office & computing machinery 58 35 32 0 9 8 14 1 12 1 1 0 1 3 9 20 Miscellaneous electric machinery 442 264 102 4 3 53 35 3 31 1 7 0 7 51 30 21 Radio, TV, communication 258 165 109 6 7 56 28 7 13 8 12 4 8 37 29 43 Precision machinery 132 76 33 4 2 19 2 0 2 0 6 0 6 13 7 13 Motor vehicles 1,095 455 79 2 3 61 5 0 4 1 8 1 7 56 20 3 Furniture 988 461 45 2 2 14 15 1 12 2 12 5 7 31 8 6 Jewelry 380 177 73 21 12 8 8 4 3 1 24 1 23 38 18 17 Other manufacturing industries 4,301 1,955 257 15 26 80 91 7 70 14 45 16 29 173 51 33 Beverages 254 96 13 0 8 0 1 1 0 0 4 0 4 12 1 0 Tobacco 238 88 3 2 0 0 0 0 0 0 1 1 0 2 0 1 Wood products 945 491 31 1 0 8 11 3 8 0 11 4 7 25 6 0 Paper products 559 270 41 1 3 9 18 0 16 2 10 5 5 31 9 1 Printing & publishing 915 347 18 2 5 8 1 1 0 0 2 0 2 15 2 1 Oil, coal, nuclear, etc. 42 26 10 1 2 5 1 0 0 1 1 0 1 8 2 0 Basic metals 475 204 40 3 1 22 9 0 5 4 5 3 2 33 5 2 Misc. transportation machinery 216 107 16 2 0 7 4 2 2 0 3 1 2 14 1 1 Other misc. manufacturing 657 326 85 3 7 21 46 0 39 7 8 2 6 33 25 27Notes: EU=Europe; US=United States; JP=Japan; N3=N3si+N3tw+N3kr; N3si=Singapore, N3tw=Taiwan, KR=Korea; OT=OTch+OTot; OTch=China; OTot=Others. WH=wholly foreign, MJ.=50-99% foreign-owned; MN=1-49% foreign owned; .Sources: National Statistical Office (1999) and author's calculations from plant-level data underlying this publication.
102

Appendix Table 11b: Number of Plants in Thai Manufacturing by Foreign Nationality and Industry, 1998 (number)Sample plants
Publi- All Foreign Foreign, by nationalityIndustry cation plants total EU US JP N3 N3si N3tw N3kr OT OTch OTotManufacturing 20,807 4,773 1,026 73 68 440 270 42 203 25 175 54 121 Food 2,801 960 119 9 10 48 31 5 24 2 21 5 16 Textiles 1,316 326 62 3 4 21 18 0 17 1 16 3 13 Apparel 1,928 152 33 2 0 12 6 2 4 0 13 6 7 Leather & footwear 859 159 23 1 2 4 11 0 4 7 5 3 2 Chemicals & products 748 294 100 10 10 32 25 8 17 0 23 5 18 Rubber products 482 189 43 3 4 11 11 1 9 1 14 3 11 Plastics & products 1,279 194 62 2 1 27 19 2 15 2 13 5 8 Non-metallic mineral products 2,195 483 44 9 5 11 13 2 11 0 6 3 3 Metal products 2,139 318 66 3 1 36 19 5 14 0 7 3 4 General machinery 764 225 75 6 2 46 10 2 6 2 11 2 9 Electric machinery, etc. 655 272 161 6 11 81 48 7 39 2 15 2 13 Office & computing machinery 30 19 17 0 2 4 10 1 9 0 1 0 1 Miscellaneous electric machinery 355 133 64 4 3 32 14 2 12 0 11 2 9 Radio, TV, communication 190 89 65 0 5 37 20 4 14 2 3 0 3 Precision machinery 80 31 15 2 1 8 4 0 4 0 0 0 0 Motor vehicles 879 152 55 1 1 46 4 1 3 0 3 1 2 Furniture 915 168 18 1 1 8 6 0 6 0 2 0 2 Jewelry 339 45 19 5 6 2 0 0 0 0 6 3 3 Other manufacturing industries 3,508 836 146 12 10 55 49 7 34 8 20 10 10 Beverages 200 57 7 0 3 1 1 1 0 0 2 0 2 Tobacco 225 42 1 0 1 0 0 0 0 0 0 0 0 Wood products 796 262 21 2 1 7 8 2 6 0 3 1 2 Paper products 441 97 20 0 1 5 10 1 8 1 4 2 2 Printing & publishing 797 61 8 2 1 2 3 2 1 0 0 0 0 Oil, coal, nuclear, etc. 16 6 1 0 0 1 0 0 0 0 0 0 0 Basic metals 420 147 28 1 1 19 3 1 2 0 4 2 2 Misc. transportation machinery 154 43 10 3 0 6 1 0 1 0 0 0 0 Other misc. manufacturing 459 121 50 4 2 14 23 0 16 7 7 5 2Notes: EU=Europe; US=United States; JP=Japan; N3=N3si+N3tw+N3kr; N3si=Singapore, N3tw=Taiwan, KR=Korea; OT=OTch+OTot; OTch=China; OTot=Others. Sources: National Statistical Office (2001a) and author's calculations from plant-level data underlying this publication.
103
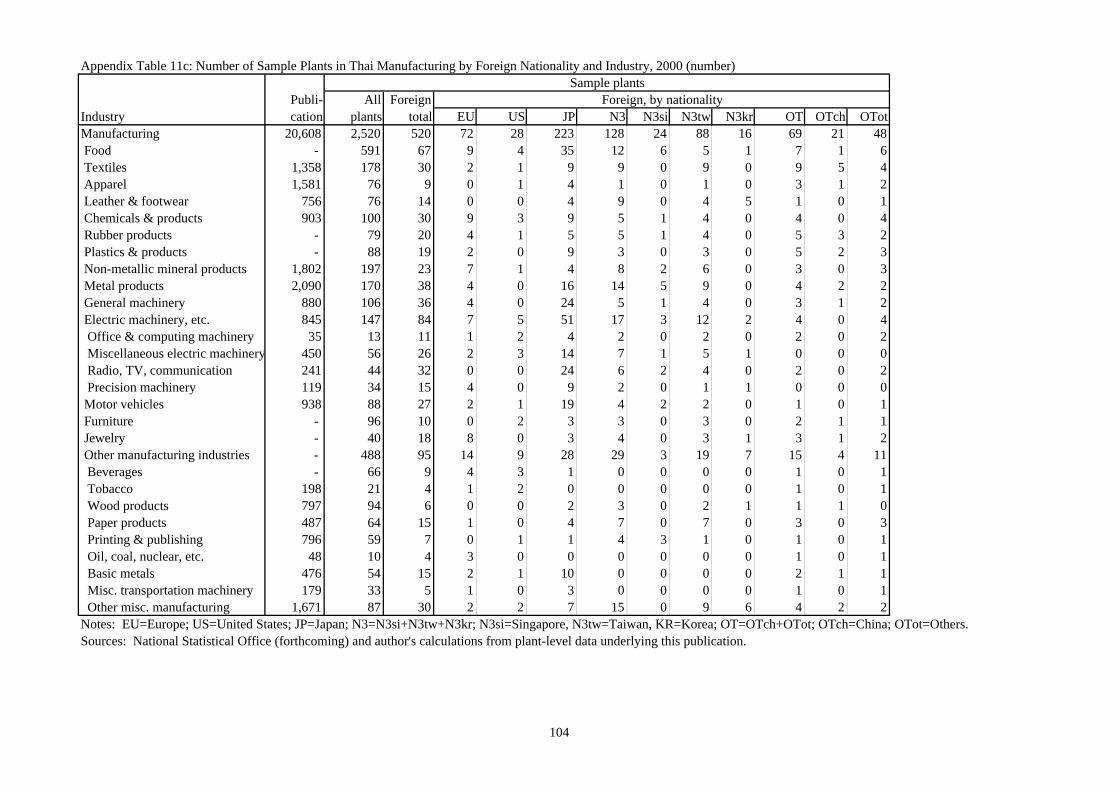
Appendix Table 11c: Number of Sample Plants in Thai Manufacturing by Foreign Nationality and Industry, 2000 (number)Sample plants
Publi- All Foreign Foreign, by nationalityIndustry cation plants total EU US JP N3 N3si N3tw N3kr OT OTch OTotManufacturing 20,608 2,520 520 72 28 223 128 24 88 16 69 21 48 Food - 591 67 9 4 35 12 6 5 1 7 1 6 Textiles 1,358 178 30 2 1 9 9 0 9 0 9 5 4 Apparel 1,581 76 9 0 1 4 1 0 1 0 3 1 2 Leather & footwear 756 76 14 0 0 4 9 0 4 5 1 0 1 Chemicals & products 903 100 30 9 3 9 5 1 4 0 4 0 4 Rubber products - 79 20 4 1 5 5 1 4 0 5 3 2 Plastics & products - 88 19 2 0 9 3 0 3 0 5 2 3 Non-metallic mineral products 1,802 197 23 7 1 4 8 2 6 0 3 0 3 Metal products 2,090 170 38 4 0 16 14 5 9 0 4 2 2 General machinery 880 106 36 4 0 24 5 1 4 0 3 1 2 Electric machinery, etc. 845 147 84 7 5 51 17 3 12 2 4 0 4 Office & computing machinery 35 13 11 1 2 4 2 0 2 0 2 0 2 Miscellaneous electric machinery 450 56 26 2 3 14 7 1 5 1 0 0 0 Radio, TV, communication 241 44 32 0 0 24 6 2 4 0 2 0 2 Precision machinery 119 34 15 4 0 9 2 0 1 1 0 0 0 Motor vehicles 938 88 27 2 1 19 4 2 2 0 1 0 1 Furniture - 96 10 0 2 3 3 0 3 0 2 1 1 Jewelry - 40 18 8 0 3 4 0 3 1 3 1 2 Other manufacturing industries - 488 95 14 9 28 29 3 19 7 15 4 11 Beverages - 66 9 4 3 1 0 0 0 0 1 0 1 Tobacco 198 21 4 1 2 0 0 0 0 0 1 0 1 Wood products 797 94 6 0 0 2 3 0 2 1 1 1 0 Paper products 487 64 15 1 0 4 7 0 7 0 3 0 3 Printing & publishing 796 59 7 0 1 1 4 3 1 0 1 0 1 Oil, coal, nuclear, etc. 48 10 4 3 0 0 0 0 0 0 1 0 1 Basic metals 476 54 15 2 1 10 0 0 0 0 2 1 1 Misc. transportation machinery 179 33 5 1 0 3 0 0 0 0 1 0 1 Other misc. manufacturing 1,671 87 30 2 2 7 15 0 9 6 4 2 2Notes: EU=Europe; US=United States; JP=Japan; N3=N3si+N3tw+N3kr; N3si=Singapore, N3tw=Taiwan, KR=Korea; OT=OTch+OTot; OTch=China; OTot=Others. Sources: National Statistical Office (forthcoming) and author's calculations from plant-level data underlying this publication.
104

Appendix Table 11d: Number of Large Sample Plants in Thai Manufacturing by Foreign Ownership Share or Foreign Nationality and Industry, 1996 (number)All Foreign Foreign, by nationality Foreign, by ownership
Industry plants total EU US JP N3 N3si N3tw N3kr OT OTch OTot MN MJ WHManufacturing 5,481 1,509 118 111 613 401 57 288 56 266 58 208 924 323 262 Food 844 163 18 16 60 41 6 30 5 28 6 22 122 25 16 Textiles 364 111 5 5 44 36 1 27 8 21 7 14 84 18 9 Apparel 368 72 4 2 26 16 1 14 1 24 4 20 55 11 6 Leather & footwear 132 29 2 2 8 15 0 12 3 2 0 2 12 10 7 Chemicals & products 374 132 17 15 48 28 6 18 4 24 4 20 82 29 21 Rubber products 218 70 3 3 17 18 7 10 1 29 4 25 45 14 11 Plastics & products 329 87 3 1 41 24 6 15 3 18 4 14 51 20 16 Non-metallic mineral products 400 49 11 2 14 19 4 15 0 3 1 2 37 10 2 Metal products 375 101 6 4 40 35 4 27 4 16 5 11 61 19 21 General machinery 260 84 5 2 49 19 4 12 3 9 1 8 48 17 19 Electric machinery, etc. 380 245 13 20 122 66 10 47 9 24 4 20 84 70 91 Office & computing machinery 31 29 0 8 8 12 1 10 1 1 0 1 3 9 17 Miscellaneous electric machinery 175 91 4 3 48 30 3 26 1 6 0 6 43 28 20 Radio, TV, communication 130 98 6 7 51 22 6 9 7 12 4 8 30 27 41 Precision machinery 44 27 3 2 15 2 0 2 0 5 0 5 8 6 13 Motor vehicles 194 72 2 3 58 4 0 3 1 5 1 4 49 20 3 Furniture 193 36 2 2 12 12 0 10 2 8 3 5 23 7 6 Jewelry 99 57 15 10 7 6 2 3 1 19 1 18 32 14 11 Other manufacturing industries 951 201 12 24 67 62 6 45 11 36 13 23 139 39 23 Beverages 50 13 0 8 0 1 1 0 0 4 0 4 12 1 0 Tobacco 9 3 2 0 0 0 0 0 0 1 1 0 2 0 1 Wood products 224 20 1 0 7 4 3 1 0 8 3 5 17 3 0 Paper products 177 33 1 3 9 11 0 9 2 9 4 5 26 7 0 Printing & publishing 147 15 2 4 6 1 1 0 0 2 0 2 13 2 0 Oil, coal, nuclear, etc. 24 10 1 2 5 1 0 0 1 1 0 1 8 2 0 Basic metals 120 33 2 1 19 6 0 4 2 5 3 2 28 4 1 Misc. transportation machinery 55 13 1 0 7 3 1 2 0 2 1 1 11 1 1 Other misc. manufacturing 145 61 2 6 14 35 0 29 6 4 1 3 22 19 20Notes: EU=Europe; US=United States; JP=Japan; N3=N3si+N3tw+N3kr; N3si=Singapore, N3tw=Taiwan, KR=Korea; OT=OTch+OTot; OTch=China; OTot=Others. WH=wholly foreign, MJ.=50-99% foreign-owned; MN=1-49% foreign owned; .Sources: Author's calculations from plant-level data underlying National Statistical Office (1999).
105

Appendix Table 11e: Number of Large Sample Plants in Thai Manufacturing by Foreign Nationality and Industry, 1998 (number)All Foreign Foreign, by nationality
Industry plants total EU US JP N3 N3si N3tw N3kr OT OTch OTotManufacturing 2,729 885 61 63 403 214 34 159 21 144 40 104 Food 549 107 9 10 42 29 5 22 2 17 2 15 Textiles 178 56 3 4 20 15 0 14 1 14 2 12 Apparel 73 28 2 0 12 4 0 4 0 10 3 7 Leather & footwear 111 19 0 2 3 9 0 3 6 5 3 2 Chemicals & products 216 91 10 9 30 21 8 13 0 21 4 17 Rubber products 145 41 3 4 10 10 1 8 1 14 3 11 Plastics & products 119 48 1 1 24 14 2 10 2 8 4 4 Non-metallic mineral products 201 37 8 5 11 9 2 7 0 4 2 2 Metal products 165 47 1 0 30 12 3 9 0 4 2 2 General machinery 134 69 6 2 46 7 2 3 2 8 1 7 Electric machinery, etc. 211 147 4 11 75 44 6 36 2 13 1 12 Office & computing machinery 19 17 0 2 4 10 1 9 0 1 0 1 Miscellaneous electric machinery 100 59 4 3 29 13 2 11 0 10 1 9 Radio, TV, communication 74 60 0 5 35 18 3 13 2 2 0 2 Precision machinery 18 11 0 1 7 3 0 3 0 0 0 0 Motor vehicles 83 52 1 1 44 4 1 3 0 2 1 1 Furniture 86 14 1 1 6 5 0 5 0 1 0 1 Jewelry 27 15 3 5 2 0 0 0 0 5 2 3 Other manufacturing industries 431 114 9 8 48 31 4 22 5 18 10 8 Beverages 29 7 0 3 1 1 1 0 0 2 0 2 Tobacco 9 1 0 1 0 0 0 0 0 0 0 0 Wood products 119 10 1 0 3 4 1 3 0 2 1 1 Paper products 71 16 0 1 5 6 0 5 1 4 2 2 Printing & publishing 35 6 1 1 2 2 1 1 0 0 0 0 Oil, coal, nuclear, etc. 6 1 0 0 1 0 0 0 0 0 0 0 Basic metals 88 25 1 1 17 2 1 1 0 4 2 2 Misc. transportation machinery 17 9 2 0 6 1 0 1 0 0 0 0 Other misc. manufacturing 57 39 4 1 13 15 0 11 4 6 5 1Notes: EU=Europe; US=United States; JP=Japan; N3=N3si+N3tw+N3kr; N3si=Singapore, N3tw=Taiwan, KR=Korea; OT=OTch+OTot; OTch=China; OTot=Others. Sources: Author's calculations from plant-level data underlying National Statistical Office (2001a).
106

Appendix Table 11f: Number of Large Sample Plants in Thai Manufacturing by Foreign Nationality and Industry, 2000 (number)All Foreign Foreign, by nationality
Industry plants total EU US JP N3 N3si N3tw N3kr OT OTch OTotManufacturing 1,487 476 67 28 212 110 22 73 15 59 17 42 Food 354 65 9 4 34 11 5 5 1 7 1 6 Textiles 95 26 1 1 9 8 0 8 0 7 3 4 Apparel 38 9 0 1 4 1 0 1 0 3 1 2 Leather & footwear 45 14 0 0 4 9 0 4 5 1 0 1 Chemicals & products 75 28 8 3 9 4 1 3 0 4 0 4 Rubber products 58 20 4 1 5 5 1 4 0 5 3 2 Plastics & products 50 14 2 0 8 1 0 1 0 3 1 2 Non-metallic mineral products 106 20 6 1 3 8 2 6 0 2 0 2 Metal products 92 35 4 0 15 13 5 8 0 3 1 2 General machinery 66 33 4 0 23 3 1 2 0 3 1 2 Electric machinery, etc. 125 81 7 5 49 17 3 12 2 3 0 3 Office & computing machinery 13 11 1 2 4 2 0 2 0 2 0 2 Miscellaneous electric machinery 49 26 2 3 14 7 1 5 1 0 0 0 Radio, TV, communication 41 30 0 0 23 6 2 4 0 1 0 1 Precision machinery 22 14 4 0 8 2 0 1 1 0 0 0 Motor vehicles 43 26 2 1 18 4 2 2 0 1 0 1 Furniture 44 9 0 2 3 2 0 2 0 2 1 1 Jewelry 22 14 6 0 2 3 0 2 1 3 1 2 Other manufacturing industries 274 82 14 9 26 21 2 13 6 12 4 8 Beverages 28 8 4 3 1 0 0 0 0 0 0 0 Tobacco 7 4 1 2 0 0 0 0 0 1 0 1 Wood products 51 4 0 0 1 2 0 1 1 1 1 0 Paper products 47 12 1 0 4 4 0 4 0 3 0 3 Printing & publishing 27 6 0 1 1 3 2 1 0 1 0 1 Oil, coal, nuclear, etc. 9 4 3 0 0 0 0 0 0 1 0 1 Basic metals 29 14 2 1 9 0 0 0 0 2 1 1 Misc. transportation machinery 21 5 1 0 3 0 0 0 0 1 0 1 Other misc. manufacturing 55 25 2 2 7 12 0 7 5 2 2 0Notes: EU=Europe; US=United States; JP=Japan; N3=N3si+N3tw+N3kr; N3si=Singapore, N3tw=Taiwan, KR=Korea; OT=OTch+OTot; OTch=China; OTot=Others. Sources: Author's calculations from plant-level data underlying National Statistical Office (forthcoming).
107