Insight Meditation Center of Pioneer Valley: Winter-Spring 2012 Brochure
A joint project of the Commonwealth Corporation and New England Public Policy Center of the Federal Reserve Bank of Boston
Labor Market Trends in the Pioneer Valley RegionNovember 2012

The Federal Reserve Bank of Boston has a decades-long tradi-tion of supporting the New England public policy community. In 2005, the Bank established the New England Public Policy Center to reinvigorate and institutionalize that support.
The Center promotes better public policy in New England by conducting and disseminating objective, high-quality research and analysis of strategically identified regional economic and policy issues and, when appropriate, works with regional and Bank partners to advance identified policy options.
The Center’s research investigates policy issues that are important to New England’s economy, focusing in two primary areas: demographic and labor markets trends and state and local public finance. For more information about the Center, visit our website, www.bostonfed.org/neppc.
COMMONWEALTH CORPORATION
Commonwealth Corporation strengthens the skills of Massachu-setts youth and adults by investing in innovative partnerships with industry, education, and workforce organizations. We seek to meet the immediate and emerging needs of businesses and workers so they can thrive in our dynamic economy.
Through its work, Commonwealth Corporation is known for its expertise in: meeting the needs of workers and businesses; developing nationally recognized and innovative programming; creating multiple education and employment pathways for teens and young adults to succeed; and building the Commonwealth’s workforce development capacity.
Commonwealth Corporation is a quasi-public organization with-in the Executive Office of Labor and Workforce Development. For more information about Commonwealth Corporation, visit our website, www.commcorp.org.
This profile was developed by Robert Clifford, a policy analyst at the New England Public Policy Center.
NEW ENGLAND PUBLIC POLICY CENTER AT THE FEDERAL RESERVE BANK OF BOSTON

OVERVIEW
3 Executive Summary
5 Geography of the Regional Labor Markets
6 Pioneer Valley Region
7 Employment Trends and Recessions
SECTION l: Measuring Labor Supply—Demographic Trends of Residents Who Live in Pioneer Valley
8 Population Growth Trends
9 Demographic Characteristics of the Resident Population of Pioneer Valley
10 Growth in the Working-Age Population by Nativity Status
11 Growth in the Civilian Labor Force by Nativity Status
12 The Age Profile of the Working-Age Population
13 The Age Profile of the Civilian Labor Force
14 Educational Attainment of the Working-Age Population
15 Educational Attainment of the Civilian Labor Force
16 Educational Attainment by Age Group, Pioneer Valley, 2008-2010
17 Unemployment Rate Trends
18 The Unemployed: Age Distribution (2000 and 2008-2010)
19 The Unemployed: Educational Attainment (2000 and 2008-2010)
20 Commuting Patterns of Residents and Workers: Pioneer Valley (2008-2010)
TABLE OF CONTENTS
SECTION ll: Measuring Labor Demand—Employment Trends of Jobs and Workers in Pioneer Valley
21 Employment Trends
22 Demographic Characteristics of the Population Employed in Pioneer Valley
23 Distribution of Employment by Supersector (Q4 2010)
24 Changes in Employment During the Economic Downturn by Major Industry: Pioneer Valley
25 Changes in Employment During the Economic Downturn by Major Industry: Massachusetts
26 Industries Driving the Recovery: Pioneer Valley
27 Industries Driving the Recovery: Massachusetts
28 Educational Attainment of Employees by Major Industry in Pioneer Valley (2008-2010)
29 Educational Attainment of Employees by Major Industry in Massachusetts (2008-2010)
30 Employment by Major Occupation: Pioneer Valley (2008-2010)
31 Employment by Major Occupation: Massachusetts (2008-2010)
32 Distribution of Occupations Across Supersectors Outside Greater Boston (2008-2010)
34 Distribution of Occupations Within Supersectors Outside Greater Boston (2008-2010)
36 Educational Attainment of Employees by Major Occupation in
Pioneer Valley (2000)

TABLE OF CONTENTS
37 Educational Attainment of Employees by Major Occupation in Pioneer Valley (2008-2010)
38 Educational Attainment of Employees by Major Occupation in Massachusetts (2008-2010)
39 Job Vacancies in the Great Recession and Recovery
40 Job Vacancies and Vacancy Rates by Major Occupation in Pioneer Valley (Q4 2010)
41 Job Vacancies and Vacancy Rates by Major Occupation in Massachusetts (Q4 2010)
42 Comparing Vacancy Rates and Educational Attainment: Peak Labor Market
43 Comparing Vacancy Rates and Educational Attainment: Recovering Labor Market
SECTION lll: Measuring the Pipeline—Educational Supply from Post-Secondary Degrees Granted by Institutions Located in Pioneer Valley
44 Growth in Potential Supply of Educated Workers: Full-Time Enrollment Trends in the Past Decade
45 Number of Full-Time Enrollees by Type of Degree Granting Institution in Pioneer Valley (2000-2010)
46 Growth in Potential Supply of Educated Workers: Part-Time Enrollment Trends in the Past Decade
47 Number of Part-Time Enrollees by Type of Degree Granting Institution in Pioneer Valley (2000-2010)
48 Graduation Rates by Type of Degree (2009)
49 Crossing the Finish Line: Trends in Degree Completions Over the Past Decade (2000-2010)
50 Educational Institutions Awarding the Most Degrees in Pioneer Valley (2010)
51 Number of Degree Completions by Degree Type: Pioneer Valley (2000-2010)
52 Certificates Awarded by Major Field of Study (2000-2010)
53 Annual Completions by Top Five Certificate Majors in Pioneer Valley (2000-2010)
54 Associate’s Degrees Awarded by Major Field of Study (2000-2010)
55 Annual Completions by Top Five Associate’s Degree Majors in Pioneer Valley (2000-2010)
56 Bachelor’s Degrees Awarded by Major Field of Study (2000-2010)
57 Annual Completions by Top Five Bachelor’s Degree Majors in Pioneer Valley (2000-2010)
Labor Market Trends in the Pioneer Valley Region www.bostonfed.org/neppc 3
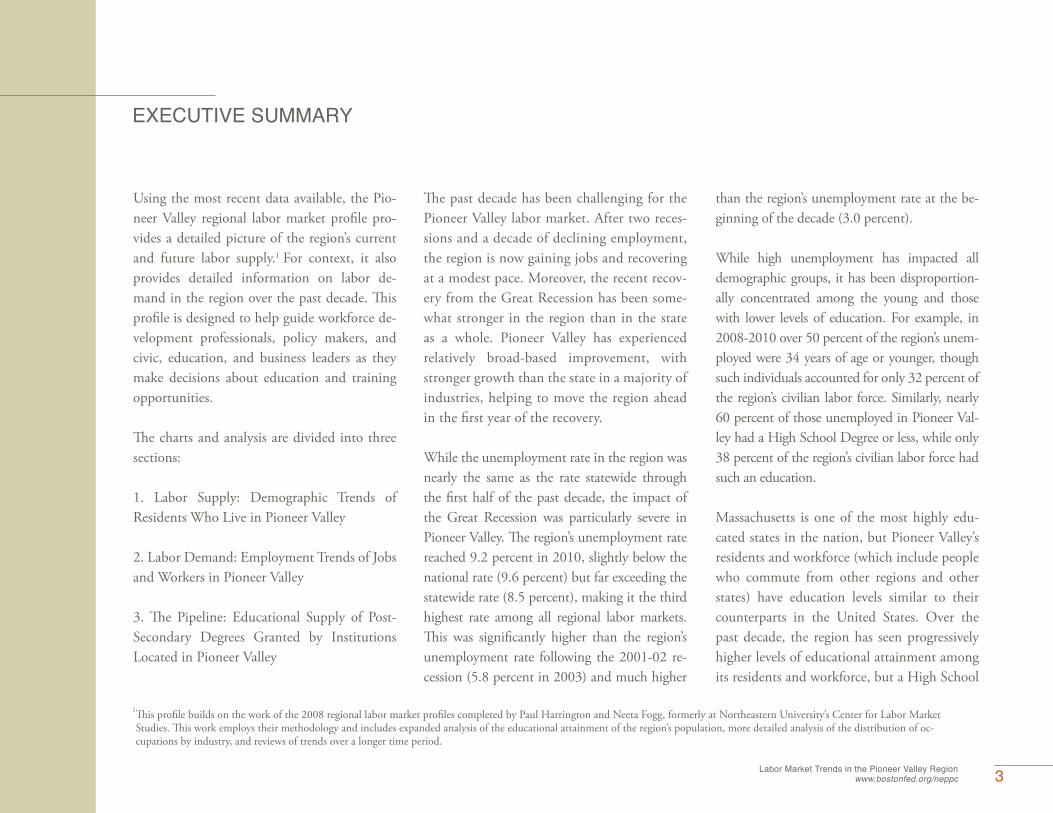
Using the most recent data available, the Pio-neer Valley regional labor market profile pro-vides a detailed picture of the region’s current and future labor supply.1 For context, it also provides detailed information on labor de-mand in the region over the past decade. This profile is designed to help guide workforce de-velopment professionals, policy makers, and civic, education, and business leaders as they make decisions about education and training opportunities.
The charts and analysis are divided into three sections:
1. Labor Supply: Demographic Trends of Residents Who Live in Pioneer Valley
2. Labor Demand: Employment Trends of Jobs and Workers in Pioneer Valley
3. The Pipeline: Educational Supply of Post-Secondary Degrees Granted by Institutions Located in Pioneer Valley
EXECUTIVE SUMMARY
The past decade has been challenging for the Pioneer Valley labor market. After two reces-sions and a decade of declining employment, the region is now gaining jobs and recovering at a modest pace. Moreover, the recent recov-ery from the Great Recession has been some-what stronger in the region than in the state as a whole. Pioneer Valley has experienced relatively broad-based improvement, with stronger growth than the state in a majority of industries, helping to move the region ahead in the first year of the recovery.
While the unemployment rate in the region was nearly the same as the rate statewide through the first half of the past decade, the impact of the Great Recession was particularly severe in Pioneer Valley. The region’s unemployment rate reached 9.2 percent in 2010, slightly below the national rate (9.6 percent) but far exceeding the statewide rate (8.5 percent), making it the third highest rate among all regional labor markets. This was significantly higher than the region’s unemployment rate following the 2001-02 re-cession (5.8 percent in 2003) and much higher
than the region’s unemployment rate at the be-ginning of the decade (3.0 percent).
While high unemployment has impacted all demographic groups, it has been disproportion-ally concentrated among the young and those with lower levels of education. For example, in 2008-2010 over 50 percent of the region’s unem-ployed were 34 years of age or younger, though such individuals accounted for only 32 percent of the region’s civilian labor force. Similarly, nearly 60 percent of those unemployed in Pioneer Val-ley had a High School Degree or less, while only 38 percent of the region’s civilian labor force had such an education.
Massachusetts is one of the most highly edu-cated states in the nation, but Pioneer Valley’s residents and workforce (which include people who commute from other regions and other states) have education levels similar to their counterparts in the United States. Over the past decade, the region has seen progressively higher levels of educational attainment among its residents and workforce, but a High School
1 This profile builds on the work of the 2008 regional labor market profiles completed by Paul Harrington and Neeta Fogg, formerly at Northeastern University’s Center for Labor Market Studies. This work employs their methodology and includes expanded analysis of the educational attainment of the region’s population, more detailed analysis of the distribution of oc-cupations by industry, and reviews of trends over a longer time period.
4 Labor Market Trends in the Pioneer Valley Regionwww.bostonfed.org/neppc
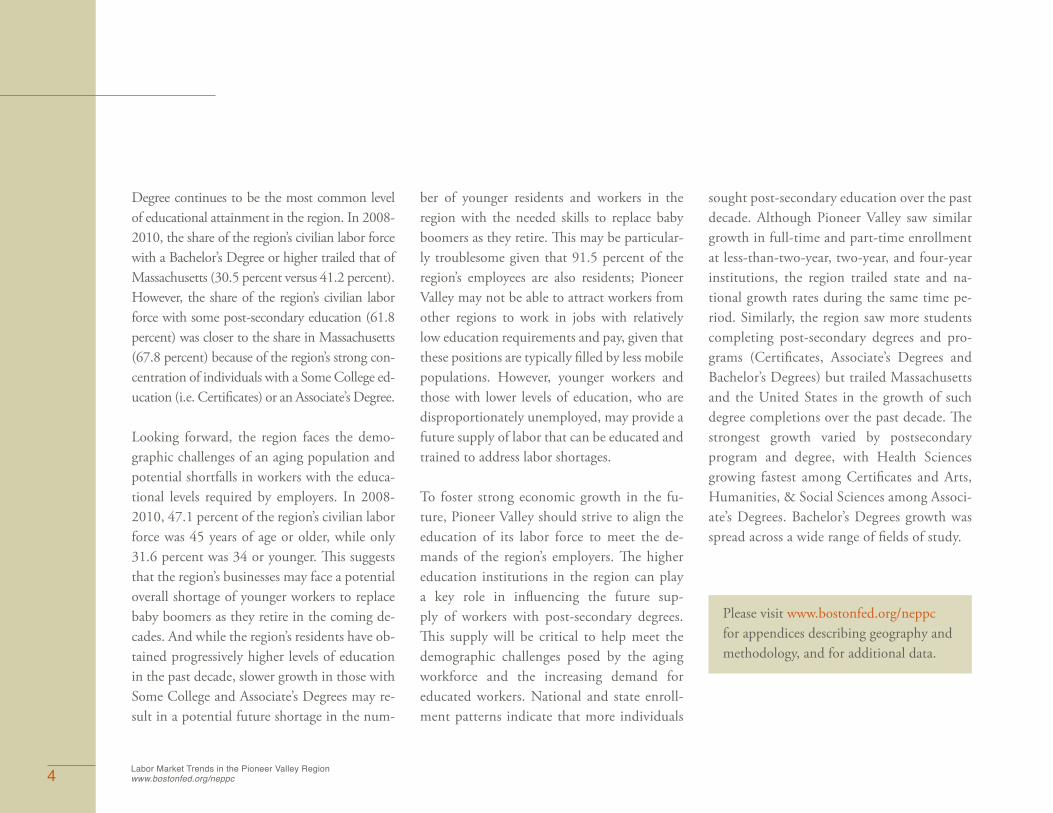
Degree continues to be the most common level of educational attainment in the region. In 2008-2010, the share of the region’s civilian labor force with a Bachelor’s Degree or higher trailed that of Massachusetts (30.5 percent versus 41.2 percent). However, the share of the region’s civilian labor force with some post-secondary education (61.8 percent) was closer to the share in Massachusetts (67.8 percent) because of the region’s strong con-centration of individuals with a Some College ed-ucation (i.e. Certificates) or an Associate’s Degree.
Looking forward, the region faces the demo-graphic challenges of an aging population and potential shortfalls in workers with the educa-tional levels required by employers. In 2008-2010, 47.1 percent of the region’s civilian labor force was 45 years of age or older, while only 31.6 percent was 34 or younger. This suggests that the region’s businesses may face a potential overall shortage of younger workers to replace baby boomers as they retire in the coming de-cades. And while the region’s residents have ob-tained progressively higher levels of education in the past decade, slower growth in those with Some College and Associate’s Degrees may re-sult in a potential future shortage in the num-
ber of younger residents and workers in the region with the needed skills to replace baby boomers as they retire. This may be particular-ly troublesome given that 91.5 percent of the region’s employees are also residents; Pioneer Valley may not be able to attract workers from other regions to work in jobs with relatively low education requirements and pay, given that these positions are typically filled by less mobile populations. However, younger workers and those with lower levels of education, who are disproportionately unemployed, may provide a future supply of labor that can be educated and trained to address labor shortages.
To foster strong economic growth in the fu-ture, Pioneer Valley should strive to align the education of its labor force to meet the de-mands of the region’s employers. The higher education institutions in the region can play a key role in influencing the future sup-ply of workers with post-secondary degrees. This supply will be critical to help meet the demographic challenges posed by the aging workforce and the increasing demand for educated workers. National and state enroll-ment patterns indicate that more individuals
Please visit www.bostonfed.org/neppc for appendices describing geography and methodology, and for additional data.
sought post-secondary education over the past decade. Although Pioneer Valley saw similar growth in full-time and part-time enrollment at less-than-two-year, two-year, and four-year institutions, the region trailed state and na-tional growth rates during the same time pe-riod. Similarly, the region saw more students completing post-secondary degrees and pro-grams (Certificates, Associate’s Degrees and Bachelor’s Degrees) but trailed Massachusetts and the United States in the growth of such degree completions over the past decade. The strongest growth varied by postsecondary program and degree, with Health Sciences growing fastest among Certificates and Arts, Humanities, & Social Sciences among Associ-ate’s Degrees. Bachelor’s Degrees growth was spread across a wide range of fields of study.

Labor Market Trends in the Pioneer Valley Region www.bostonfed.org/neppc 5
Eight Regional Labor Market Areas1 Berkshire Region
2 Pioneer Valley Region
3 Central Mass Region
4 Northeast Region
5 Boston/Metro North Region
6 Metro South/West Region
7 Southeast Region
8 Cape & Islands Region
GEOGRAPHY OF THE REGIONAL LABOR MARKETS
1 2 3
4
5
6
7
8
The Pioneer Valley labor market borders two regional labor markets: Berkshire and Central Mass. It is composed of 73 Massachusetts cit-ies and towns covering all of Hampden, Hampshire, and Franklin counties. In addition to Springfield, the third most populous city in Massachusetts, the region contains a number of other larger cities and towns, including: Chicopee, Westfield, Holyoke, Amherst, and Northampton. Because of data limitations, in certain aspects of this analysis, such as industry/occupational distributions, Pioneer Val-ley is combined with the Berkshire, Cape & Islands, Central Mass, Northeast, and Southeast regional labor markets and is referred to as the region Outside Greater Boston. See the on-line Geographic Definitions Appendix for further details.

6 Labor Market Trends in the Pioneer Valley Regionwww.bostonfed.org/neppc
PIONEER VALLEY REGION
PLAINFIELD ASHFIELD
CONWAY
CUMMINGTON
HAWLEY
CHARLEMONT
ROWE
WORHTINGTON
GOSHEN
CHESTERFIELD WILLIAMSBURG
MIDDLEFIELD
CHESTER
HU
NTI
NG
TON
SOUTHAMPTON EAST
HAM
PTO
NWES
THA
MPT
ON
NORTHAMPTON
BLANFORD
TOLLANDGRANVILLE
SOUTHWICK
WESTFIELD
RUSSELL
MONTGOM
ERY
MONROE
HEATH COLRAIN
BUCKLANDSHELBURNE
LEYDEN BERNARDSTONNORTHFIELD
WARWICK
ERVING
GILLGREENFIELD
DEERFIELD
MONTAGUE WENDELL
ORANGE
ROYALSTON
ATHOL
PHILLIPSTON
PETERSHAMNEW SALEMSHUTESBURY
LEVERETT
SUN
DER
LAN
D
WHATELY
HATFIELD
HADLEYAMHERST
PELHAM
SOU
TH H
ADLE
Y
GRANBYBELCHERTOWN WARE
PALMERLUDLOW
CHICOPEE
HOLYOKE
WEST SPRINGFIELD
AGAWAM
SPRINGFIELD
EAST LONGMEADOW
LONGMEADOW HAMPDEN
WILBRAHAM
MONSON
WALES HOLLAND
BRIMFIELD

Labor Market Trends in the Pioneer Valley Region www.bostonfed.org/neppc 7
EMPLOYMENT TRENDS AND RECESSIONS
Massachusetts reached peak employment in 2001 and remained 5.0 percent below its peak (a loss of 169,800 jobs) at the end of 2011. Over the same period, total employment in the United States ended at only 0.4 percent below its 2001 peak (a loss of 513,700 jobs). One reason for the difference was that the short na-tional recession at the beginning of the decade created a prolonged contraction and slow recovery in Massachusetts. By the start of the Great Recession, Massachusetts had still not recovered all of the jobs it had lost during the previous downturn. In contrast, the nation experienced a short labor market contraction in 2001, followed by a strong recovery that expanded employment up until the Great Recession. The Great Recession impacted the nation se-verely, while Massachusetts experienced a less pronounced down-turn, with a slightly stronger recovery through 2010 followed by slower employment growth in 2011.
These differences between Massachusetts and the United States over the economic cycles are important to keep in mind when evaluating the performances of the eight regional labor markets. When possible, these labor market profiles will look at labor mar-ket information for the beginning of the millennium, the period preceding the Great Recession, and the decline in and recovery from the Great Recession.
Source: US Bureau of Labor Statistics.
Note: Shaded bars are National Bureau of Economic Research dated national recessions.
0.92
0.94
0.96
0.98
1.00
1.02
1.04
1.06
Inde
x 20
00=1
Q1−20
00
Q1−20
01
Q1−20
02
Q1−20
03
Q1−20
04
Q1−20
05
Q1−20
06
Q1−20
07
Q1−20
08
Q1−20
09
Q1−20
10
Q1−20
11
NBER RecessionMassachusettsUnited States
Q1 2000 to Q4 2011Non−Agricultural Employment for United States and Massachusetts,
8 Labor Market Trends in the Pioneer Valley Regionwww.bostonfed.org/neppc
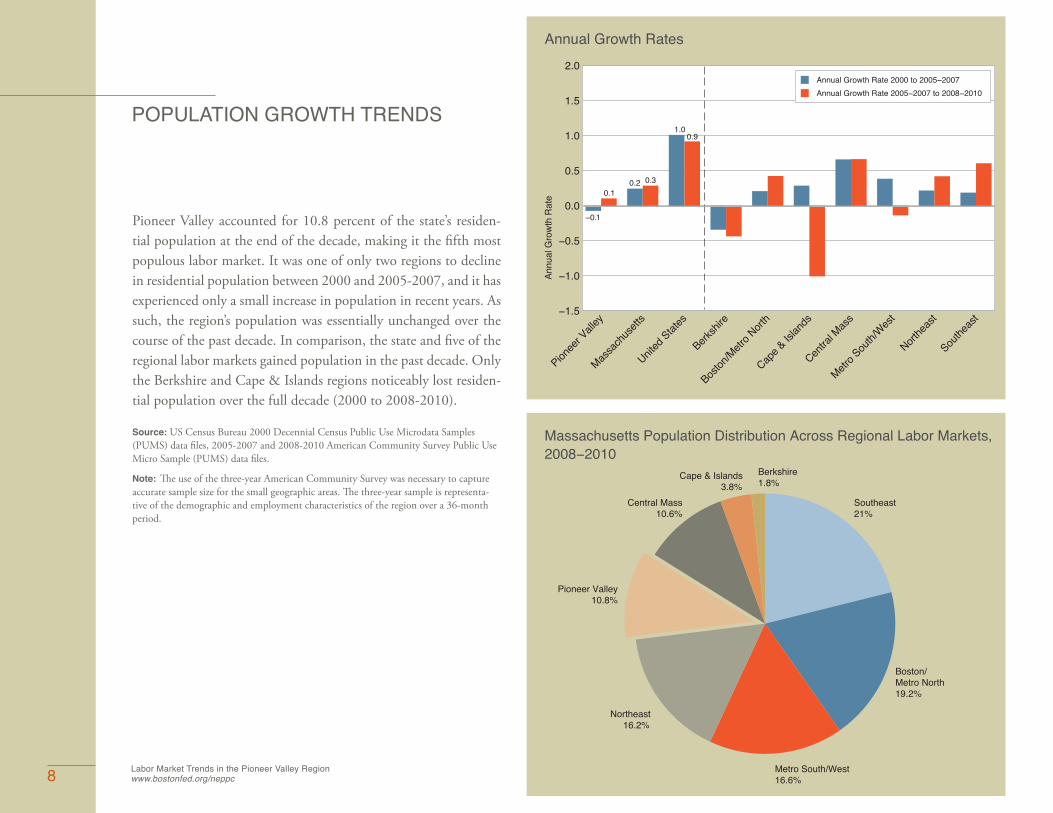
POPULATION GROWTH TRENDS
Pioneer Valley accounted for 10.8 percent of the state’s residen-tial population at the end of the decade, making it the fifth most populous labor market. It was one of only two regions to decline in residential population between 2000 and 2005-2007, and it has experienced only a small increase in population in recent years. As such, the region’s population was essentially unchanged over the course of the past decade. In comparison, the state and five of the regional labor markets gained population in the past decade. Only the Berkshire and Cape & Islands regions noticeably lost residen-tial population over the full decade (2000 to 2008-2010).
Source: US Census Bureau 2000 Decennial Census Public Use Microdata Samples (PUMS) data files, 2005-2007 and 2008-2010 American Community Survey Public Use Micro Sample (PUMS) data files.
Note: The use of the three-year American Community Survey was necessary to capture accurate sample size for the small geographic areas. The three-year sample is representa-tive of the demographic and employment characteristics of the region over a 36-month period.
−0.1
0.10.2 0.3
1.00.9
−1.5
−1.0
−0.5
0.0
0.5
1.0
1.5
2.0
Annu
al G
row
th R
ate
Pionee
r Valle
y
Massa
chus
etts
United
States
Berksh
ire
Boston
/Metr
o Nort
h
Cape &
Islan
ds
Centra
l Mas
s
Metro S
outh/
West
Northe
ast
Southe
ast
Annual Growth Rates
Annual Growth Rate 2000 to 2005−2007Annual Growth Rate 2005−2007 to 2008−2010
Southeast21%
Boston/Metro North19.2%
Metro South/West16.6%
Northeast 16.2%
Pioneer Valley 10.8%
Central Mass 10.6%
Cape & Islands 3.8%
Berkshire1.8%
2008−2010Massachusetts Population Distribution Across Regional Labor Markets,

Labor Market Trends in the Pioneer Valley Region www.bostonfed.org/neppc 9
DEMOGRAPHIC CHARACTERISTICS OF THE RESIDENT POPULATION OF PIONEER VALLEY
Over the past decade, the number of people living in Pioneer Valley remained essentially the same. There was modest annual growth in the region’s immigrant population (1.8 percent), but a declining native-born population offset such gains. The region became more diverse over the past decade, with strong growth among minority populations, most notably Asian and Hispanic residents. The region’s population also became considerably older as baby boomers (born between 1946 and 1964) neared retire-ment age. In particular, the 55-64-year-old age cohort grew at a robust annual rate of 5.0 percent over the course of the decade. In contrast, the region experienced only modest annual growth (0.3 percent) in 16-24-year-olds, the children of baby boomers who are commonly referred to as the echo-boom generation. This age group had much stronger growth in the Massachusetts re-gions that gained population in the past decade. With large losses among 25-44-year-olds and those 16 years of age or younger, the region’s population stagnated while it increased in age.
Source: US Census Bureau 2000 Decennial Census PUMS data files and 2008-2010 American Community Survey PUMS data files.
Note: Further data for racial/ethnic and gender characteristics for the residential popula-tion, as well as the working-age, civilian labor force, unemployed, and employed popula-tions, are available in the on-line Data Appendix.
2000 2008-2010Absolute Change
Annual Growth Rate
(Percent)Resident Population 680,610 679,768 -842 0.0
GenderMale 326,958 325,509 -1,449 0.0Female 353,652 354,259 607 0.0NativityNative Born 600,950 586,125 -14,825 -0.3
Immigrant 79,660 93,643 13,983 1.8Race/EthnicityWhite, non-Hispanic 547,634 515,440 -32,194 -0.7Black, non-Hispanic 35,871 37,056 1,185 0.4Asian, non-Hispanic 10,919 15,118 4,199 3.7Hispanic 74,134 100,538 26,404 3.4Other race, non-Hispanic 12,052 11,616 -436 -0.4
Age
Less than age 16 153,428 135,421 -18,007 -1.4Age 16-24 77,393 79,561 2,168 0.3Age 25-34 86,272 78,184 -8,088 -1.1Age 35-44 112,169 90,277 -21,892 -2.4Age 45-54 98,968 109,333 10,365 1.1Age 55-64 58,644 90,742 32,098 5.0Age 65+ 93,736 96,250 2,514 0.3

10 Labor Market Trends in the Pioneer Valley Regionwww.bostonfed.org/neppc
GROWTH IN WORKING-AGE POPULATION BY NATIVITY STATUS
Although the total population in Pioneer Valley remained essen-tially the same over the course of the past decade, there was growth in the region’s working-age population (a region’s potential labor supply, typically defined as people 16 years of age or older). Be-tween 2000 and 2005-2007, the number of working-age immi-grants in the region grew at an annual rate of 2.4 percent, while the region’s native-born working-age population increased by the slight annual rate of 0.1 percent. As a result, the total working-age population actually grew at an annual rate of 0.4 percent, com-pared to no change in the total population. Between 2005-2007 and 2008-2010, the region’s native-born, working-age population declined slightly. However, the total working-age population in-creased annually by a modest 0.2 percent due to a 2.0 percent an-nual growth in the immigrant population. Despite such gains, the region trailed Massachusetts and the United States in the growth of the working-age population in the past decade.
Source: US Census Bureau 2000 Decennial Census PUMS data files, 2005-2007 and 2008-2010 American Community Survey PUMS data files.
Note: The working-age population is defined as individuals 16 years of age or older, excluding institutionalized populations. Immigrants are individuals born outside the country.
0.4
0.1
2.4
0.5
0.0
2.8
1.2
0.9
3.2
−1.0
0.0
1.0
2.0
3.0
4.0
5.0
Annu
al G
row
th R
ate
Pioneer Valley Massachusetts United States
Annual Growth Rate, 2000 to 2005−2007
TotalNative BornImmigrant
0.2
−0.2
2.0
0.5
0.2
2.0
1.10.9
2.3
−1.0
0.0
1.0
2.0
3.0
4.0
5.0
Annu
al G
row
th R
ate
Pioneer Valley Massachusetts United States
Annual Growth Rate, 2005−2007 to 2008−2010
TotalNative BornImmigrant

GROWTH IN THE CIVILIAN LABOR FORCE BY NATIVITY STATUS
The civilian labor force consists of the people who live in a region and are either working or unemployed but actively looking for work (a region’s actual labor supply). And as was the case with the working-age population, immigrants are driving growth in Pioneer Valley’s civilian labor force. Despite little change in the number of native-born individuals in the civilian labor force between 2000 and 2005-2007, the overall labor force in the region continued to grow. This growth was a result of a 3.7 percent annual growth rate in the immigrant labor force. Between 2005-2007 and 2008-2010, the number of native-born people in the region’s civilian labor force barely increased. Meanwhile, immigrants in the labor force continued to grow, but at a slower rate than in the first part of the decade. As a result, the Pioneer Valley civilian labor force increased at an annual rate of 0.5 percent but trailed the growth rates of both Massachusetts and the United States.
Source: US Census Bureau 2000 Decennial Census PUMS data files, 2005-2007 and 2008-2010 American Community Survey PUMS data files.
Note: The civilian labor force consists of all individuals 16 years of age or older who are classified as employed or unemployed and actively looking for work. Immigrants are individuals born outside the country.
0.5
0.0
3.7
0.8
0.1
4.4
1.5
0.9
4.8
−1.0
0.0
1.0
2.0
3.0
4.0
5.0
Annu
al G
row
th R
ate
Pioneer Valley Massachusetts United States
Annual Growth Rate, 2000 to 2005−2007
TotalNative BornImmigrant
0.5
0.1
3.2
1.2
0.8
3.0
1.4
1.0
3.2
−1.0
0.0
1.0
2.0
3.0
4.0
5.0
Annu
al G
row
th R
ate
Pioneer Valley Massachusetts United States
Annual Growth Rate, 2005−2007 to 2008−2010
TotalNative BornImmigrant

12 Labor Market Trends in the Pioneer Valley Regionwww.bostonfed.org/neppc
THE AGE PROFILE OF THE WORKING- AGE POPULATION
Massachusetts is one of the oldest states in the country, and Pio-neer Valley is even slightly older. Nearly 55 percent of the region’s working-age population was 45 years of age or older in 2008-2010. In contrast, only 51.8 percent of the statewide working-age population was 45 or older. The region’s older population was largely due to two demographic trends over the course of the past decade: the slower growth of 16-24-year-olds and the faster growth of 55-64-year-olds in the region relative to Massachu-setts. Combined with the steep decline in the region’s popula-tion of 25-44-year-olds, the age distribution of the working-age population in Pioneer Valley in 2008-2010 was older than that of Massachusetts and far older than that of the United States.
Source: US Census Bureau 2000 Decennial Census PUMS data files and 2008-2010 American Community Survey PUMS data files.
2000 2008-2010Absolute Change
Annual Growth Rate (Percent)
Age 16-24 77,393 79,561 2,168 0.3
Age 25-34 86,272 78,184 -8,088 -1.1Age 35-44 112,169 90,277 -21,892 -2.4Age 45-54 98,968 109,333 10,365 1.1Age 55-64 58,644 90,742 32,098 5.0
Age 65+ 93,736 96,250 2,514 0.3
Growth of Working-Age Population by Age in Pioneer Valley
14.7
16.4
21.3
18.8
11.1
17.8
14.6
14.4
16.6
20.1
16.7
17.7
13.0
18.9
22.0
18.1
11.3
16.7
14.0
16.3
17.8
19.7
15.3
16.8
15.3
18.4
21.5
17.7
11.4
15.7
15.4
16.9
17.5
18.9
15.0
16.3
0
20
40
60
80
100
Perc
ent
Pioneer Valley Massachusetts United States
2000 2008−2010 2000 2008−2010 2000 2008−2010
2000 and 2008−2010Age Distribution of the Working-Age Population,
Age 65+Age 55−64Age 45−54Age 35−44Age 25−34Age 16−24

Labor Market Trends in the Pioneer Valley Region www.bostonfed.org/neppc 13
THE AGE PROFILE OF THE CIVILIAN LABOR FORCE
Given the age of the region’s population, it is not surprising that Pioneer Valley is also seeing a rising share of its civilian labor force in the older age groups. In the past decade, there has been particu-larly strong growth in the civilian labor force of 55-to-64-year-olds. The second fastest growing civilian labor force age cohort in the region has been those 65 or older. At the same time, there have been a declining number of individuals between the ages of 16 and 44 in the Pioneer Valley civilian labor force. As a result, the share of the labor force age 45 or older grew from 38.3 percent in 2000 to 47.1 percent in 2008-2010. The share of the Pioneer Valley civilian labor force age 45 or older was greater than that of Mas-sachusetts (44.5 percent) and the United States (42.0 percent).
Source: US Census Bureau 2000 Decennial Census PUMS data files and 2008-2010 American Community Survey PUMS data files.
2000 2008-2010Absolute Change
Annual Growth Rate (Percent)
Age 16-24 51,988 49,788 -2,200 -0.5
Age 25-34 69,785 66,374 -3,411 -0.6Age 35-44 93,293 76,470 -16,823 -2.2Age 45-54 83,305 89,861 6,556 0.8Age 55-64 37,717 64,105 26,388 6.1
Age 65+ 12,570 17,336 4,766 3.6
Growth of Civilian Labor Force Population by Age in Pioneer Valley
14.9
20.0
26.8
23.9
10.8
3.6
13.7
18.2
21.0
24.7
17.6
4.8
12.9
23.3
27.0
22.4
10.8
3.6
13.2
20.2
22.0
23.9
15.8
4.7
15.2
22.7
26.8
21.8
10.23.3
14.2
21.5
22.3
23.3
14.7
4.0
0
20
40
60
80
100
Perc
ent
Pioneer Valley Massachusetts United States
2000 2008−2010 2000 2008−2010 2000 2008−2010
2000 and 2008−2010Age Distribution of the Civilian Labor Force,
Age 65+Age 55−64Age 45−54Age 35−44Age 25−34Age 16−24
14 Labor Market Trends in the Pioneer Valley Regionwww.bostonfed.org/neppc
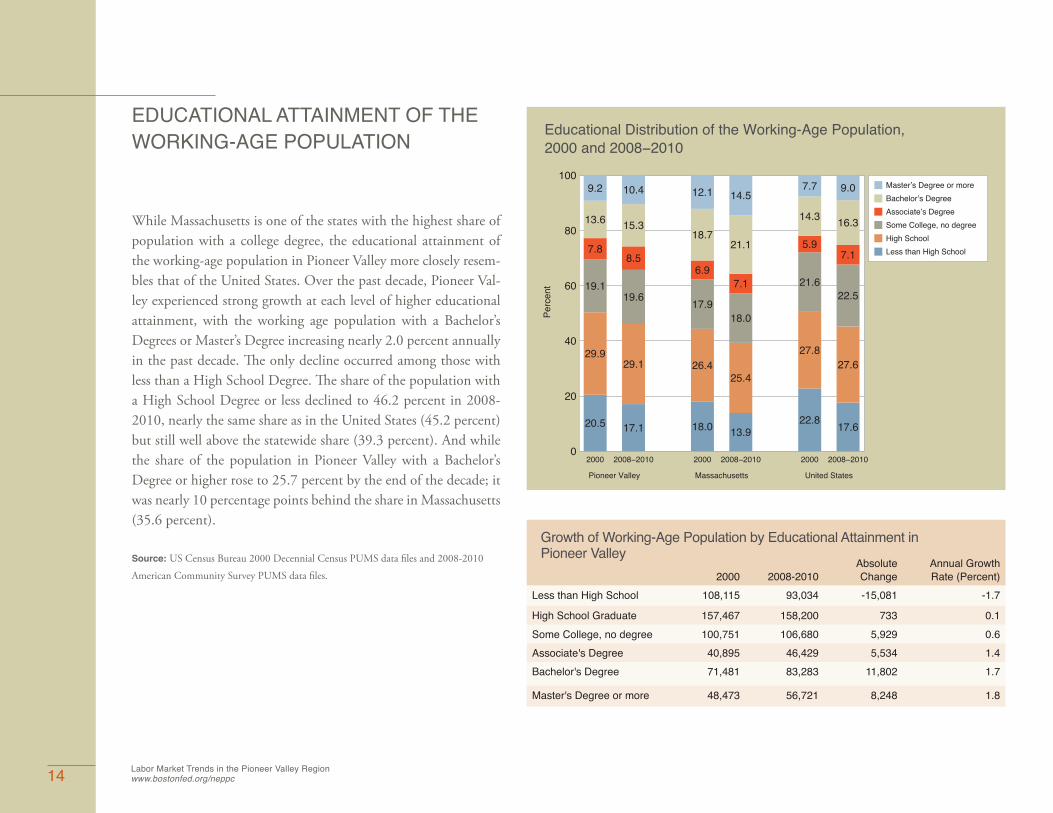
EDUCATIONAL ATTAINMENT OF THE WORKING-AGE POPULATION
While Massachusetts is one of the states with the highest share of population with a college degree, the educational attainment of the working-age population in Pioneer Valley more closely resem-bles that of the United States. Over the past decade, Pioneer Val-ley experienced strong growth at each level of higher educational attainment, with the working age population with a Bachelor’s Degrees or Master’s Degree increasing nearly 2.0 percent annually in the past decade. The only decline occurred among those with less than a High School Degree. The share of the population with a High School Degree or less declined to 46.2 percent in 2008-2010, nearly the same share as in the United States (45.2 percent) but still well above the statewide share (39.3 percent). And while the share of the population in Pioneer Valley with a Bachelor’s Degree or higher rose to 25.7 percent by the end of the decade; it was nearly 10 percentage points behind the share in Massachusetts (35.6 percent).
Source: US Census Bureau 2000 Decennial Census PUMS data files and 2008-2010
American Community Survey PUMS data files. 2000 2008-2010Absolute Change
Annual Growth Rate (Percent)
Less than High School 108,115 93,034 -15,081 -1.7
High School Graduate 157,467 158,200 733 0.1Some College, no degree 100,751 106,680 5,929 0.6Associate's Degree 40,895 46,429 5,534 1.4Bachelor's Degree 71,481 83,283 11,802 1.7
Master's Degree or more 48,473 56,721 8,248 1.8
Growth of Working-Age Population by Educational Attainment in Pioneer Valley
20.5
29.9
19.1
7.8
13.6
9.2
17.1
29.1
19.6
8.5
15.3
10.4
18.0
26.4
17.9
6.9
18.7
12.1
13.9
25.4
18.0
7.1
21.1
14.5
22.8
27.8
21.6
5.9
14.3
7.7
17.6
27.6
22.5
7.1
16.3
9.0
0
20
40
60
80
100
Perc
ent
Pioneer Valley Massachusetts United States
2000 2008−2010 2000 2008−2010 2000 2008−2010
2000 and 2008−2010Educational Distribution of the Working-Age Population,
Master’s Degree or moreBachelor’s DegreeAssociate’s DegreeSome College, no degreeHigh SchoolLess than High School

Labor Market Trends in the Pioneer Valley Region www.bostonfed.org/neppc 15
EDUCATIONAL ATTAINMENT OF THE CIVILIAN LABOR FORCE
When looking at those actually participating in the labor force, we see somewhat higher levels of educational attainment. And much like the region’s working-age population, the civilian labor force in Pioneer Valley has had progressively stronger growth at each high-er level of educational attainment. By 2008-2010, 30.5 percent of the Pioneer Valley labor force had a Bachelor’s Degree or higher, trailing the 41.2 percent in Massachusetts. However, 61.8 percent of the civilian labor force in Pioneer Valley had completed at least some post-secondary education (Some College or higher). This trailed the nearly 68 percent of Massachusetts labor force who had some post-secondary education but was identical to the 61.8 per-cent rate nationwide. While educational attainment increased over the course of the decade, the most common level of educational attainment among the civilian labor force in the region continued to be a High School Degree (28.0 percent in 2008-2010).
Source: US Census Bureau 2000 Decennial Census PUMS data files and 2008-2010 American Community Survey PUMS data files.
2000 2008-2010Absolute Change
Annual Growth Rate (Percent)
Less than High School 43,531 36,718 -6,813 -1.9
High School Graduate 99,351 102,076 2,725 0.3Some College, no degree 74,523 76,508 1,985 0.3Associate's Degree 33,331 37,413 4,082 1.3Bachelor's Degree 57,777 67,035 9,258 1.7
Master's Degree or more 40,145 44,184 4,039 1.1
Growth of Civilian Labor Force Population by Educational Attainment in Pioneer Valley
12.5
28.5
21.4
9.6
16.6
11.5
10.1
28.0
21.0
10.3
18.4
12.1
11.5
24.3
19.1
7.9
22.3
14.8
8.7
23.5
18.7
7.9
24.4
16.8
15.5
26.9
23.9
7.2
17.2
9.4
11.8
26.3
24.0
8.3
19.1
10.5
0
20
40
60
80
100
Perc
ent
Pioneer Valley Massachusetts United States
2000 2008−2010 2000 2008−2010 2000 2008−2010
2000 and 2008−2010Educational Distribution of the Civilian Labor Force,
Master’s Degree or moreBachelor’s DegreeAssociate’s DegreeSome College, no degreeHigh SchoolLess than High School

16 Labor Market Trends in the Pioneer Valley Regionwww.bostonfed.org/neppc
EDUCATIONAL ATTAINMENT BY AGE GROUP, PIONEER VALLEY, 2008-2010
If we look at the region’s population by both age and education, we get an understanding of the workers who will be replacing the baby boomers. As the baby boomers have increased in age, 45-54-year-olds have become the largest age cohort in nearly all educational attainment groups (the exception being those with a Master’s Degree or higher). As the boomers near retirement age and, over time, leave the labor force, nearly every educational cat-egory faces a potential shortfall of workers. For example, in 2008-2010 there were more than 12,200 individuals with an Associ-ate’s Degree between the ages of 45 and 54 in Pioneer Valley, but slightly less than 7,500 in the same category between the ages of 25 and 34. This amounts to a potential shortage of more than 4,700 individuals, which is equivalent to 38.8 percent of the 45-54 year-old population with such an education. However, such shortages may actually be much smaller, given the long-term trend of a shift toward employees with higher levels of education in most occupations and industries.
Source: US Census Bureau 2008-2010 American Community Survey PUMS data files.
0 8,000 16,000 24,000 32,000 40,000
Number of Working-Age Individuals Living in Region
Less than High School
High School
Some College, no degree
Associate’s Degree
Bachelor’s Degree
Master’s Degree or more
Age 55−64Age 45−54Age 35−44Age 25−34
Labor Market Trends in the Pioneer Valley Region www.bostonfed.org/neppc 17
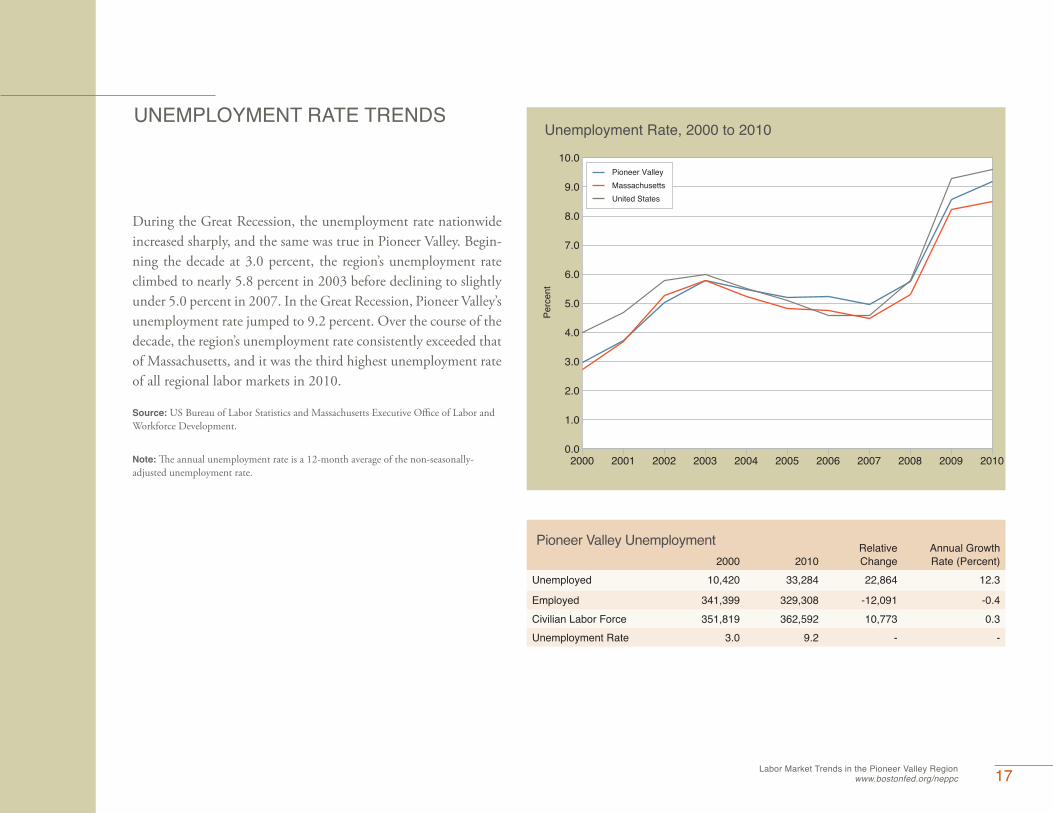
UNEMPLOYMENT RATE TRENDS
During the Great Recession, the unemployment rate nationwide increased sharply, and the same was true in Pioneer Valley. Begin-ning the decade at 3.0 percent, the region’s unemployment rate climbed to nearly 5.8 percent in 2003 before declining to slightly under 5.0 percent in 2007. In the Great Recession, Pioneer Valley’s unemployment rate jumped to 9.2 percent. Over the course of the decade, the region’s unemployment rate consistently exceeded that of Massachusetts, and it was the third highest unemployment rate of all regional labor markets in 2010.
Source: US Bureau of Labor Statistics and Massachusetts Executive Office of Labor and Workforce Development.
Note: The annual unemployment rate is a 12-month average of the non-seasonally-adjusted unemployment rate.
2000 2010Relative Change
Annual Growth Rate (Percent)
Unemployed 10,420 33,284 22,864 12.3
Employed 341,399 329,308 -12,091 -0.4Civilian Labor Force 351,819 362,592 10,773 0.3Unemployment Rate 3.0 9.2 - -
Pioneer Valley Unemployment
0.0
1.0
2.0
3.0
4.0
5.0
6.0
7.0
8.0
9.0
10.0
Perc
ent
2000 2001 2002 2003 2004 2005 2006 2007 2008 2009 2010
Pioneer ValleyMassachusettsUnited States
Unemployment Rate, 2000 to 2010
18 Labor Market Trends in the Pioneer Valley Regionwww.bostonfed.org/neppc
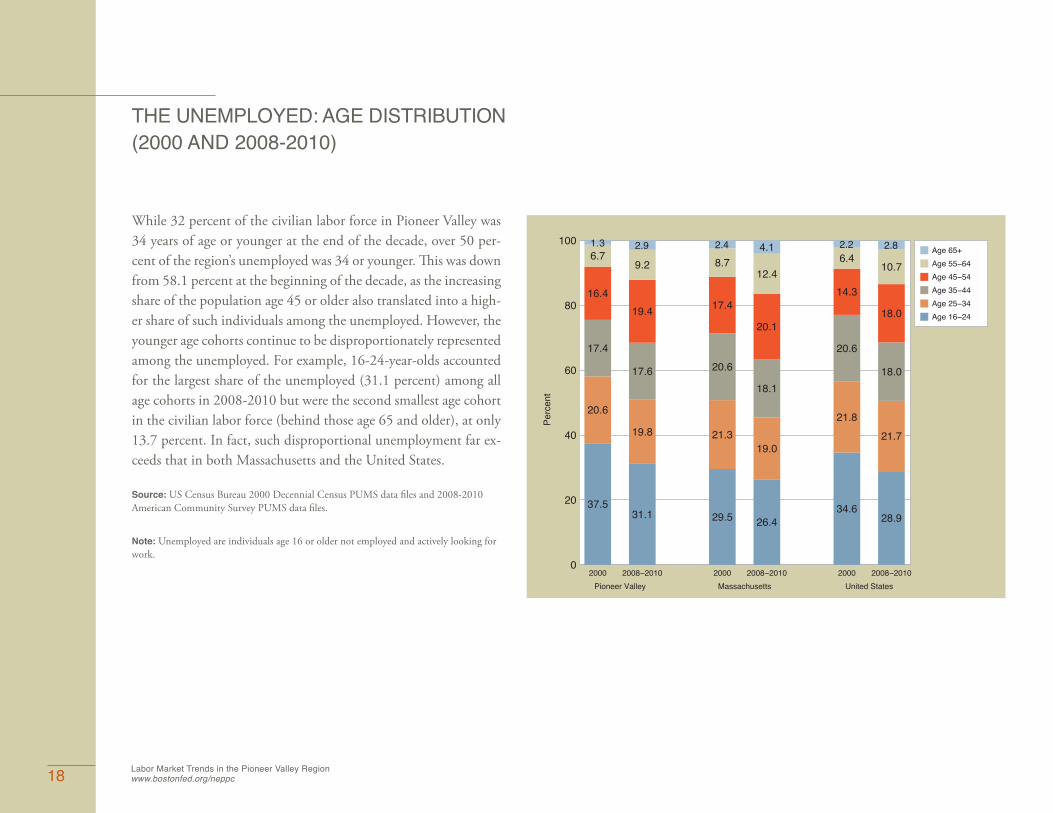
THE UNEMPLOYED: AGE DISTRIBUTION(2000 AND 2008-2010)
While 32 percent of the civilian labor force in Pioneer Valley was 34 years of age or younger at the end of the decade, over 50 per-cent of the region’s unemployed was 34 or younger. This was down from 58.1 percent at the beginning of the decade, as the increasing share of the population age 45 or older also translated into a high-er share of such individuals among the unemployed. However, the younger age cohorts continue to be disproportionately represented among the unemployed. For example, 16-24-year-olds accounted for the largest share of the unemployed (31.1 percent) among all age cohorts in 2008-2010 but were the second smallest age cohort in the civilian labor force (behind those age 65 and older), at only 13.7 percent. In fact, such disproportional unemployment far ex-ceeds that in both Massachusetts and the United States.
Source: US Census Bureau 2000 Decennial Census PUMS data files and 2008-2010 American Community Survey PUMS data files.
Note: Unemployed are individuals age 16 or older not employed and actively looking for work.
37.5
20.6
17.4
16.4
6.71.3
31.1
19.8
17.6
19.4
9.2
2.9
29.5
21.3
20.6
17.4
8.72.4
26.4
19.0
18.1
20.1
12.4
4.1
34.6
21.8
20.6
14.3
6.42.2
28.9
21.7
18.0
18.0
10.7
2.8
0
20
40
60
80
100
Perc
ent
Pioneer Valley Massachusetts United States2000 2008−2010 2000 2008−2010 2000 2008−2010
Age 65+Age 55−64Age 45−54Age 35−44Age 25−34Age 16−24

Labor Market Trends in the Pioneer Valley Region www.bostonfed.org/neppc 19
THE UNEMPLOYED: EDUCATIONAL ATTAINMENT (2000 AND 2008-2010)
Nearly 60 percent of those unemployed in Pioneer Valley had a High School Degree or less in 2008-2010, well above the share in both Massachusetts (50.5 percent) and the United States (56.0 percent). This was down slightly from 63.4 percent in 2000, as the share of the unemployed with Some College education and a Bachelor’s Degree increased. However, people with lower levels of education continue to be disproportionately represented among the unemployed. In particular, in 2008-2010, those with less than a high school education accounted for 24.4 percent of the unem-ployed in Pioneer Valley but were only 10.1 percent of the civilian labor force.
Source: US Census Bureau 2000 Decennial Census PUMS data files and 2008-2010 American Community Survey PUMS data files.
33.7
29.7
17.4
7.0
6.6
5.7
24.4
35.5
20.5
5.1
10.6
3.9
29.3
28.7
17.6
5.9
11.7
6.9
19.0
31.5
20.9
5.8
15.7
7.1
35.8
30.2
19.6
4.17.32.9
23.4
32.6
24.1
5.7
10.4
3.8
0
20
40
60
80
100
Perc
ent
Pioneer Valley Massachusetts United States2000 2008−2010 2000 2008−2010 2000 2008−2010
Master’s Degree or moreBachelor’s DegreeAssociate’s DegreeSome College, no degreeHigh SchoolLess than High School

20 Labor Market Trends in the Pioneer Valley Regionwww.bostonfed.org/neppc
COMMUTING PATTERNS OF RESIDENTS AND WORKERS IN PIONEER VALLEY (2008-2010)
An overwhelming majority of the employed residents of Pioneer Valley work in the region, making Pioneer Valley one of the labor markets least likely to rely on commuters as a large share of its workforce. With 85.5 percent of the employed residents in the region also working in the region, the largest share of outbound commuters (7.3 percent of all employed residents) cross the bor-der to Connecticut for work, while only 5.8 percent commute to other Massachusetts labor markets (mostly to Berkshire and Cen-tral Mass). Even smaller shares of workers commute into Pioneer Valley, with 91.5 percent of employees also being residents. The largest group of inbound commuters crosses the Connecticut bor-der into Pioneer Valley (3.6 percent of all workers in the region), while smaller shares commute from a number of regional labor markets in Massachusetts, led by Central Mass (1.9 percent). As a result, Pioneer Valley is a net exporter of workers, with nearly 21,200 more commuting out of the region every day than com-muting into the region.
Source: US Census Bureau 2008-2010 American Community Survey PUMS data files.
Number Percent of TotalTotal number of employed persons living in Pioneer Valley… 324,026 100.0…who work in: Pioneer Valley 277,172 85.5Central Mass 8,718 2.7Berkshire 5,431 1.7
Other parts of Massachusetts 4,714 1.5Connecticut 23,550 7.3Vermont 1,337 0.4New York 1,032 0.3Other places outside Massachusetts 2,072 0.6
Total number of persons working in Pioneer Valley… 302,831 100.0…who live in:Pioneer Valley 277,172 91.5Central Mass 5,902 1.9Berkshire 2,762 0.9Other parts of Massachusetts 2,309 0.8Connecticut 10,797 3.6New York 1,039 0.3Vermont 832 0.3Other places outside Massachusetts 2,018 0.7
Net in-commuting (Number of Persons Employed in Region minus Number of Persons Living in Region) -21,195 -

EMPLOYMENT TRENDS
While Pioneer Valley accounts for 10.8 percent of the state’s popu-lation the region accounts for only 9.1 percent of the state’s em-ployment, or more than 286,000 jobs. The employment trends in Pioneer Valley were similar to those in Massachusetts over the past decade. The region’s employment declined at a rate nearly identical to Massachusetts between 2001 and 2008 (2.2 percent versus 2.1 percent), compared with a 4.1 percent gain nationwide. Both the region and state experienced more modest employment losses than did the United States during the Great Recession, with employment in the region and state declining by 4.0 percent from 2007 to 2009, compared with 6.1 percent nationwide. But in the first year of the labor market recovery, employment in Pioneer Valley increased by 1.9 percent, exceeding the gains in both Mas-sachusetts (1.5 percent) and the United States (0.8 percent).
Source: US Bureau of Labor Statistics Quarterly Census of Employment and Wages (QCEW) and Massachusetts Executive Office of Labor and Workforce Development ES-202.
Note: ES-202 and QCEW are not seasonally adjusted. Therefore, comparisons need to be made across consistent time periods, such as the first quarter of one year to the first quarter of another. Comparisons between different quarters will be distorted, as seasonal employment in industries such as Retail Trade or Leisure & Hospitality vary considerably across regions.
−2.2
−4.0
1.9
−2.1
−4.0
1.5
4.1
−6.1
0.8
−8
−6
−4
−2
0
2
4
6
Perc
ent C
hang
e
Pionee
r Valle
y
Massa
chus
etts
United
States
Berksh
ire
Boston
/Metr
o Nort
h
Cape &
Islan
ds
Centra
l Mas
s
Metro S
outh/
West
Northe
ast
Southe
ast
Changes in Total Employment
Q1 2001−Q1 2008Q4 2007−Q4 2009Q4 2009−Q4 2010
Boston/Metro North29.6%
Metro South/West16.9%
Southeast 16.2%
Northeast 13.1%
Central Mass 10.2%
Pioneer Valley 9.1%
Cape & Islands 3.1%
Berkshire1.9%
Q4 2010Distribution of Employment Across Regional Labor Markets,
22 Labor Market Trends in the Pioneer Valley Regionwww.bostonfed.org/neppc
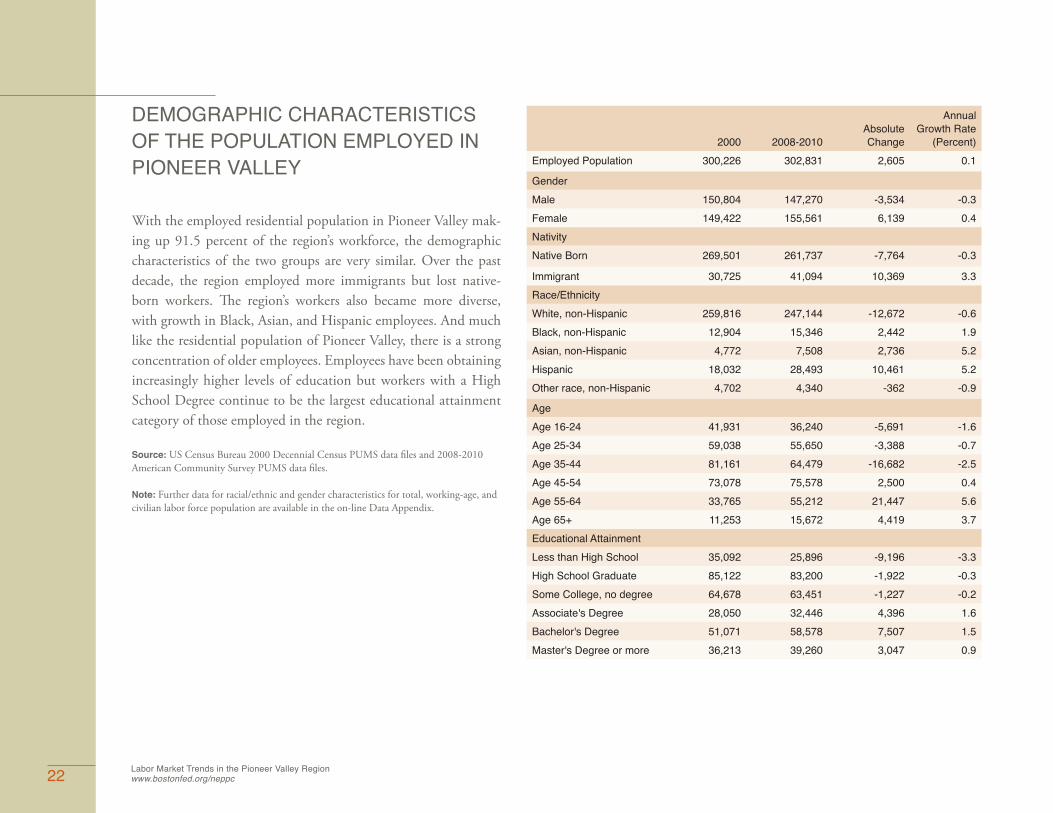
DEMOGRAPHIC CHARACTERISTICS OF THE POPULATION EMPLOYED IN PIONEER VALLEY
With the employed residential population in Pioneer Valley mak-ing up 91.5 percent of the region’s workforce, the demographic characteristics of the two groups are very similar. Over the past decade, the region employed more immigrants but lost native-born workers. The region’s workers also became more diverse, with growth in Black, Asian, and Hispanic employees. And much like the residential population of Pioneer Valley, there is a strong concentration of older employees. Employees have been obtaining increasingly higher levels of education but workers with a High School Degree continue to be the largest educational attainment category of those employed in the region.
Source: US Census Bureau 2000 Decennial Census PUMS data files and 2008-2010 American Community Survey PUMS data files.
Note: Further data for racial/ethnic and gender characteristics for total, working-age, and civilian labor force population are available in the on-line Data Appendix.
2000 2008-2010
Absolute Change
Annual Growth Rate
(Percent)Employed Population 300,226 302,831 2,605 0.1
GenderMale 150,804 147,270 -3,534 -0.3Female 149,422 155,561 6,139 0.4NativityNative Born 269,501 261,737 -7,764 -0.3
Immigrant 30,725 41,094 10,369 3.3Race/EthnicityWhite, non-Hispanic 259,816 247,144 -12,672 -0.6Black, non-Hispanic 12,904 15,346 2,442 1.9Asian, non-Hispanic 4,772 7,508 2,736 5.2Hispanic 18,032 28,493 10,461 5.2Other race, non-Hispanic 4,702 4,340 -362 -0.9
AgeAge 16-24 41,931 36,240 -5,691 -1.6Age 25-34 59,038 55,650 -3,388 -0.7Age 35-44 81,161 64,479 -16,682 -2.5Age 45-54 73,078 75,578 2,500 0.4Age 55-64 33,765 55,212 21,447 5.6Age 65+ 11,253 15,672 4,419 3.7Educational AttainmentLess than High School 35,092 25,896 -9,196 -3.3High School Graduate 85,122 83,200 -1,922 -0.3Some College, no degree 64,678 63,451 -1,227 -0.2Associate's Degree 28,050 32,446 4,396 1.6Bachelor's Degree 51,071 58,578 7,507 1.5Master's Degree or more 36,213 39,260 3,047 0.9

Labor Market Trends in the Pioneer Valley Region www.bostonfed.org/neppc 23
DISTRIBUTION OF EMPLOYMENT BY SUPERSECTOR (Q4 2010)
The largest sector of employment in Pioneer Valley is Education & Health Services. Accounting for 33.2 percent of jobs in the region, the sector is proportionately much larger in Pioneer Val-ley than it is statewide and nationally. Compared with the state, the region’s employment is also more concentrated in the Trade, Transportation, & Utilities supersector, albeit less concentrated than in the United States. The region also has smaller employ-ment concentrations in Information and Financial Activities, as employment in such industries tends to be concentrated in the Greater Boston regional labor markets. Pioneer Valley also has a notably smaller share of employment in Professional & Business Services (7.4 percent) than does Massachusetts (14.9 percent), making it the fifth largest supersector for employment in the re-gion. Like most regions outside of Greater Boston, Pioneer Val-ley has a higher employment concentration than does the state in Manufacturing (9.7 percent versus 8.1 percent), making it the region’s third largest sector for employment.
Source: US Bureau of Labor Statistics QCEW and Massachusetts Executive Office of Labor and Workforce Development ES-202.
Note: Supersectors are groupings of major industry categories. See the on-line Data Ap-pendix for the major industries that make up supersectors.
33.2
19.1
7.4
9.6
9.7
4.84.7
6.23.7
27.2
18.4
14.9
9.7
8.1
6.5
4.34.23.82.8
24.3
20.7
13.6
10.5
9.1
5.9
5.83.54.52.2
0
20
40
60
80
100
Perc
ent
Pioneer Valley Massachusetts United States
Information Manufacturing
Construction Leisure & Hospitality
Other Services Professional &Business Services
Government Trade, Transportation,& Utilities
Financial Activities Education & HealthServices

24
CHANGES IN EMPLOYMENT DURING THE ECONOMIC DOWNTURN BY MAJOR INDUSTRY: PIONEER VALLEY
While Pioneer Valley lost jobs between 2007 and 2009, five in-dustries were able to avoid losses. Health Care & Social Assis-tance, the largest industry in the region, increased employment by 2.5 percent and added over 1,200 jobs. The employment increases were mostly from the sub-industries of Ambulatory Health Care Services (1,090 jobs). An additional 1,200 jobs came from the other four industries that did not lose jobs. However, these gains were more than offset by a loss of nearly 8,700 jobs in industries hit hardest by the Great Recession: In-formation (-11.6 percent), Administrative & Support Services
(-14.1 percent), Manufacturing (-14.9 percent), and Construc-tion (-15.3 percent). Further employment contractions in the Trade, Transportation, & Utilities industries of Retail Trade (-5.9 percent), Wholesale Trade (-8.5 percent), and Transpor-tation & Warehousing (-9.4 percent) resulted in an additional loss of 3,950 jobs.
Source: Massachusetts Executive Office of Labor and Workforce Development ES-202.
Note: Industries are sorted by size in Massachusetts in Q4 2009. See the on-line Data Appendix for supersector and major industry employment trends.
2,024
4,375
3,744
4,619
10,666
10,094
8,126
16,361
13,392
8,644
13,880
22,345
7,312
27,550
42,779
33,159
50,970
0 10,000 20,000 30,000 40,000 50,000 60,000Total Employment
UtilitiesArts, Entertainment, & Recreation
Management of Companies & EnterprisesInformation
Transportation & WarehousingConstruction
Wholesale TradeOther Services
GovernmentAdministrative & Support Services
Financial ActivitiesAccommodation & Food ServicesProfessional & Technical Services
ManufacturingEducational Services
Retail TradeHealth Care & Social Assistance
Q4 2009 Industry Employment
5.5
2.7
−7.4
−11.6
−9.4
−15.3
−8.5
4.7
2.0
−14.1
−2.9
−0.2
−6.1
−14.9
−0.5
−5.9
2.5
−25 −20 −15 −10 −5 0 5 10
Percent Change
Percent Change in Employment, Q4 2007 to Q4 2009
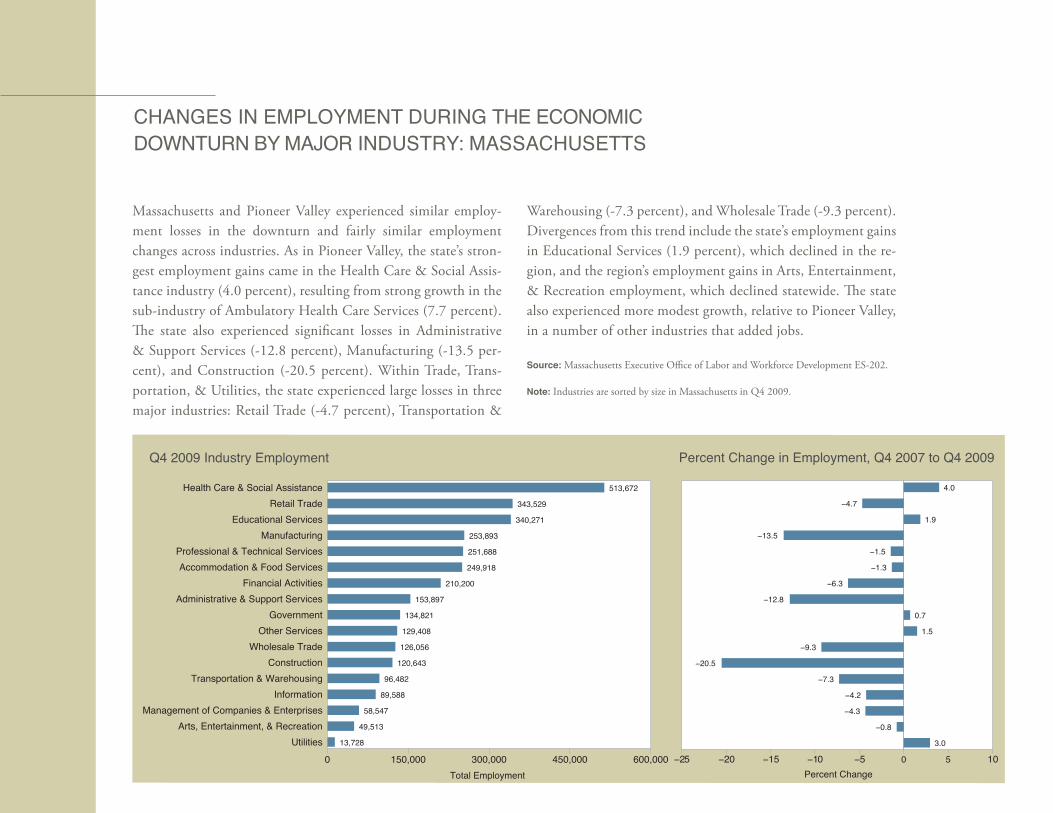
CHANGES IN EMPLOYMENT DURING THE ECONOMIC DOWNTURN BY MAJOR INDUSTRY: MASSACHUSETTS
Massachusetts and Pioneer Valley experienced similar employ-ment losses in the downturn and fairly similar employment changes across industries. As in Pioneer Valley, the state’s stron-gest employment gains came in the Health Care & Social Assis-tance industry (4.0 percent), resulting from strong growth in the sub-industry of Ambulatory Health Care Services (7.7 percent). The state also experienced significant losses in Administrative & Support Services (-12.8 percent), Manufacturing (-13.5 per-cent), and Construction (-20.5 percent). Within Trade, Trans-portation, & Utilities, the state experienced large losses in three major industries: Retail Trade (-4.7 percent), Transportation &
Warehousing (-7.3 percent), and Wholesale Trade (-9.3 percent). Divergences from this trend include the state’s employment gains in Educational Services (1.9 percent), which declined in the re-gion, and the region’s employment gains in Arts, Entertainment, & Recreation employment, which declined statewide. The state also experienced more modest growth, relative to Pioneer Valley, in a number of other industries that added jobs.
Source: Massachusetts Executive Office of Labor and Workforce Development ES-202.
Note: Industries are sorted by size in Massachusetts in Q4 2009.
13,728
49,513
58,547
89,588
96,482
120,643
126,056
129,408
134,821
153,897
210,200
249,918
251,688
253,893
340,271
343,529
513,672
0 150,000 300,000 450,000 600,000Total Employment
UtilitiesArts, Entertainment, & Recreation
Management of Companies & EnterprisesInformation
Transportation & WarehousingConstruction
Wholesale TradeOther Services
GovernmentAdministrative & Support Services
Financial ActivitiesAccommodation & Food Services
Professional & Technical ServicesManufacturing
Educational ServicesRetail Trade
Health Care & Social Assistance
Q4 2009 Industry Employment
3.0
−0.8
−4.3
−4.2
−7.3
−20.5
−9.3
1.5
0.7
−12.8
−6.3
−1.3
−1.5
−13.5
1.9
−4.7
4.0
−25 −20 −15 −10 −5 0 5 10Percent Change
Percent Change in Employment, Q4 2007 to Q4 2009
26
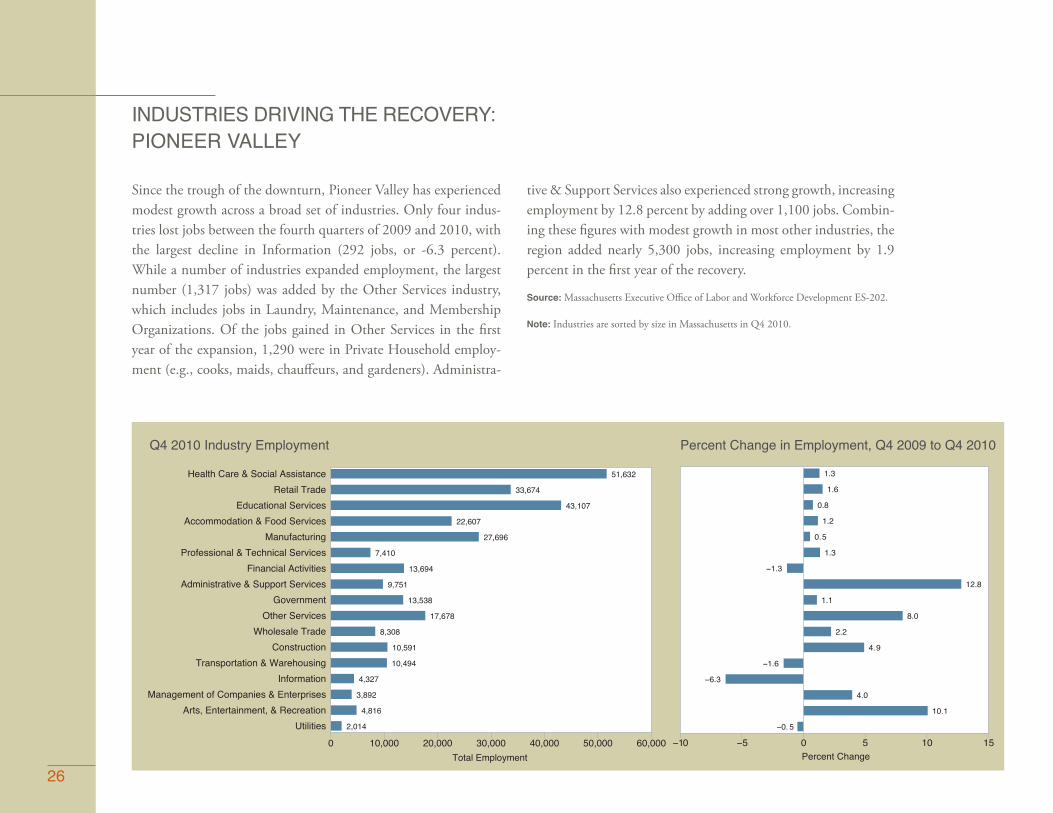
INDUSTRIES DRIVING THE RECOVERY: PIONEER VALLEY
Since the trough of the downturn, Pioneer Valley has experienced modest growth across a broad set of industries. Only four indus-tries lost jobs between the fourth quarters of 2009 and 2010, with the largest decline in Information (292 jobs, or -6.3 percent). While a number of industries expanded employment, the largest number (1,317 jobs) was added by the Other Services industry, which includes jobs in Laundry, Maintenance, and Membership Organizations. Of the jobs gained in Other Services in the first year of the expansion, 1,290 were in Private Household employ-ment (e.g., cooks, maids, chauffeurs, and gardeners). Administra-
tive & Support Services also experienced strong growth, increasing employment by 12.8 percent by adding over 1,100 jobs. Combin-ing these figures with modest growth in most other industries, the region added nearly 5,300 jobs, increasing employment by 1.9 percent in the first year of the recovery.
Source: Massachusetts Executive Office of Labor and Workforce Development ES-202.
Note: Industries are sorted by size in Massachusetts in Q4 2010.
2,014
4,816
3,892
4,327
10,494
10,591
8,308
17,678
13,538
9,751
13,694
7,410
27,696
22,607
43,107
33,674
51,632
0 10,000 20,000 30,000 40,000 50,000 60,000Total Employment
UtilitiesArts, Entertainment, & Recreation
Management of Companies & EnterprisesInformation
Transportation & WarehousingConstruction
Wholesale TradeOther Services
GovernmentAdministrative & Support Services
Financial ActivitiesProfessional & Technical Services
ManufacturingAccommodation & Food Services
Educational ServicesRetail Trade
Health Care & Social Assistance
Q4 2010 Industry Employment
−0.5
10.1
4.0
−6.3
−1.6
4.9
2.2
8.0
1.1
12.8
−1.3
1.3
0.5
1.2
0.8
1.6
1.3
−10 −5 0 5 10 15Percent Change
Percent Change in Employment, Q4 2009 to Q4 2010
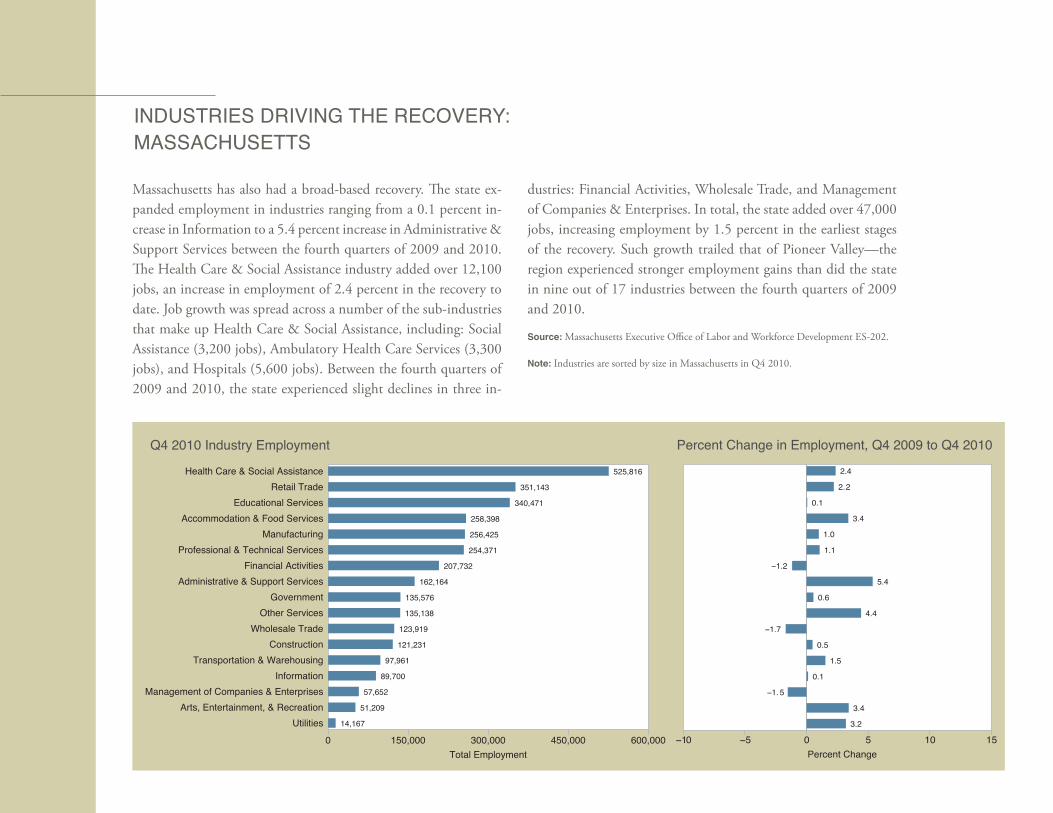
INDUSTRIES DRIVING THE RECOVERY: MASSACHUSETTS
Massachusetts has also had a broad-based recovery. The state ex-panded employment in industries ranging from a 0.1 percent in-crease in Information to a 5.4 percent increase in Administrative & Support Services between the fourth quarters of 2009 and 2010. The Health Care & Social Assistance industry added over 12,100 jobs, an increase in employment of 2.4 percent in the recovery to date. Job growth was spread across a number of the sub-industries that make up Health Care & Social Assistance, including: Social Assistance (3,200 jobs), Ambulatory Health Care Services (3,300 jobs), and Hospitals (5,600 jobs). Between the fourth quarters of 2009 and 2010, the state experienced slight declines in three in-
dustries: Financial Activities, Wholesale Trade, and Management of Companies & Enterprises. In total, the state added over 47,000 jobs, increasing employment by 1.5 percent in the earliest stages of the recovery. Such growth trailed that of Pioneer Valley—the region experienced stronger employment gains than did the state in nine out of 17 industries between the fourth quarters of 2009 and 2010.
Source: Massachusetts Executive Office of Labor and Workforce Development ES-202.
Note: Industries are sorted by size in Massachusetts in Q4 2010.
14,167
51,209
57,652
89,700
97,961
121,231
123,919
135,138
135,576
162,164
207,732
254,371
256,425
258,398
340,471
351,143
525,816
0 150,000 300,000 450,000 600,000Total Employment
UtilitiesArts, Entertainment, & Recreation
Management of Companies & EnterprisesInformation
Transportation & WarehousingConstruction
Wholesale TradeOther Services
GovernmentAdministrative & Support Services
Financial ActivitiesProfessional & Technical Services
ManufacturingAccommodation & Food Services
Educational ServicesRetail Trade
Health Care & Social Assistance
Q4 2010 Industry Employment
3.2
3.4
−1.5
0.1
1.5
0.5
−1.7
4.4
0.6
5.4
−1.2
1.1
1.0
3.4
0.1
2.2
2.4
−10 −5 0 5 10 15Percent Change
Percent Change in Employment, Q4 2009 to Q4 2010

28 Labor Market Trends in the Pioneer Valley Regionwww.bostonfed.org/neppc
An increasing number of workers in Pioneer Valley had a Bache-lor’s Degree or higher over the past decade, but the most common level of educational attainment among the region’s employees re-mains a High School Degree. As a result, the educational attain-ment level of employees by industries is fairly evenly split in Pio-neer Valley. In 2008-2010, seven of the 17 major industries in the region had a workforce where the largest share of employees had a Bachelor’s Degree or higher. Another eight industries had a High School Degree or less as the largest category. In a few industries, there was a clear majority of employees with a Bachelor’s Degree or higher, such as Professional & Technical Services, or a clear majority with a High School Degree or less, such as Construction. In most industries, however, the educational attainment of em-ployees was somewhat evenly distributed, including 15 industries having at least 25 percent of employees with Some College educa-tion or an Associate’s Degree.
Source: US Census Bureau 2008-2010 American Community Survey PUMS data files.
Note: Industries are sorted by size in Massachusetts in Q4 2010.
EDUCATIONAL ATTAINMENT OF EMPLOYEES BY MAJOR INDUSTRY IN PIONEER VALLEY (2008-2010)
26.8 34.1 39.1
32.0 29.7 38.3
58.4 41.6
23.6 34.0 42.5
48.5 37.1 14.3
57.4 29.2 13.4
41.0 35.8 23.3
47.9 32.5 19.6
22.0 38.4 39.7
49.1 32.4 18.5
20.6 36.5 42.8
13.6 21.2 65.1
51.6 27.9 20.5
58.0 32.7 9.3
15.8 19.8 64.4
47.5 35.2 17.3
27.2 38.2 34.6
0 10 20 30 40 50 60 70 80 90 100Percent
Utilities
Arts, Entertainment, & Recreation
Management of Companies & Enterprises
Information
Transportation & Warehousing
Construction
Wholesale Trade
Other Services
Government
Administrative & Support Services
Financial Activities
Professional & Technical Services
Manufacturing
Accommodation & Food Services
Educational Services
Retail Trade
Health Care & Social Assistance
High School Degree or Less
Some College or Associate’s Degree
Bachelor’s Degree or Higher

Labor Market Trends in the Pioneer Valley Region www.bostonfed.org/neppc 29
EDUCATIONAL ATTAINMENT OF EMPLOYEES BY MAJOR INDUSTRY IN MASSACHUSETTS (2008-2010)
The educational attainment across industries in Massachusetts was much higher than in Pioneer Valley in 2008-2010. In Massachu-setts, nine of the 17 major industries had a workforce where the largest share of employees had a Bachelor’s Degree or higher. And in nearly every major industry statewide (16 of the 17, all but Utili-ties), the share of employees with a Bachelor’s Degree or higher was greater than for their industrial counterparts in Pioneer Valley. Only two industries in Massachusetts had a higher share of employees with a High School Degree or less than in Pioneer Valley. Massa-chusetts also had a lower share of employees with Some College education or an Associate’s Degree than Pioneer Valley in nearly all industries. However, the share of employees with a post-secondary education (Some College or Higher) in Massachusetts was higher than in Pioneer Valley for 15 of the 17 major industries.
Source: US Census Bureau 2008-2010 American Community Survey PUMS data files.
Note: Industries are sorted by size in Massachusetts in Q4 2010. 31.9 35.4 32.7
29.2 27.1 43.8
4.7 34.7 60.6
18.1 25.8 56.1
45.5 35.8 18.7
56.5 27.6 16.0
38.0 28.4 33.7
47.5 26.6 25.9
20.2 31.2 48.6
46.7 26.8 26.5
16.6 26.3 57.1
8.0 15.9 76.1
37.3 23.8 38.8
52.9 30.4 16.7
11.7 15.5 72.7
42.1 33.1 24.8
23.0 33.2 43.8
0 10 20 30 40 50 60 70 80 90 100Percent
Utilities
Arts, Entertainment, & Recreation
Management of Companies & Enterprises
Information
Transportation & Warehousing
Construction
Wholesale Trade
Other Services
Government
Administrative & Support Services
Financial Activities
Professional & Technical Services
Manufacturing
Accommodation & Food Services
Educational Services
Retail Trade
Health Care & Social Assistance
High School Degree or Less
Some College or Associate’s Degree
Bachelor’s Degree or Higher
30 Labor Market Trends in the Pioneer Valley Regionwww.bostonfed.org/neppc
EMPLOYMENT BY MAJOR OCCUPATION: PIONEER VALLEY (2008-2010)
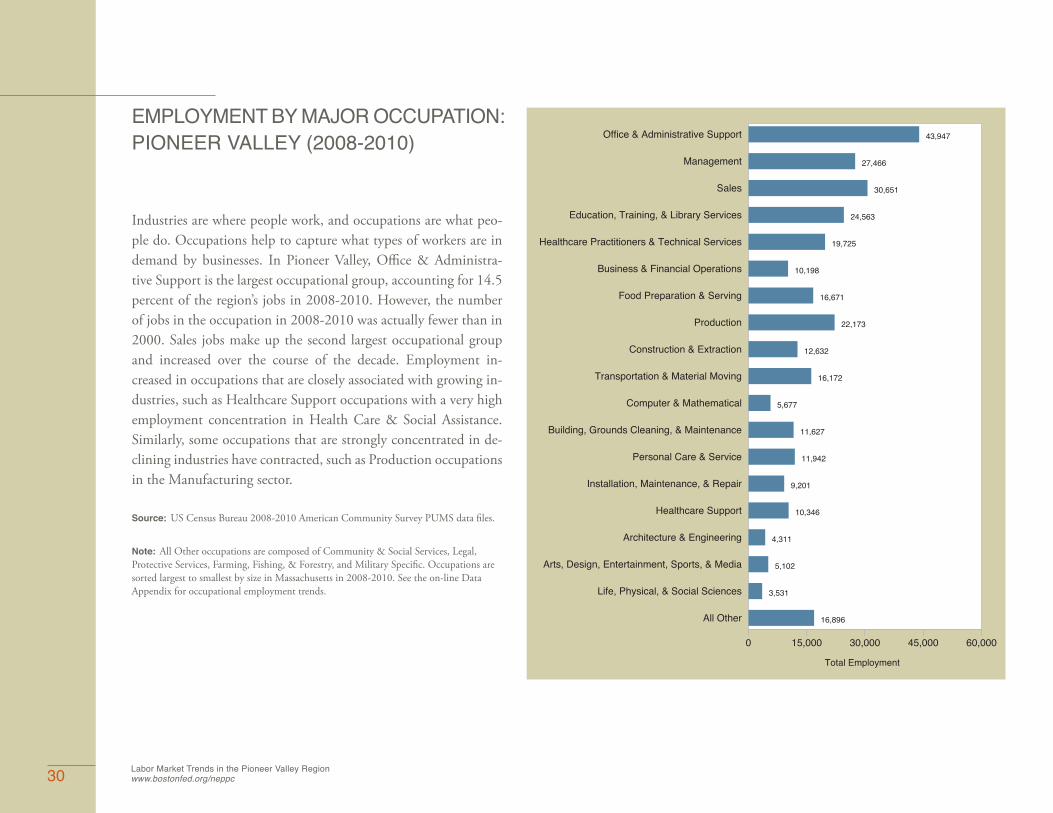
Industries are where people work, and occupations are what peo-ple do. Occupations help to capture what types of workers are in demand by businesses. In Pioneer Valley, Office & Administra-tive Support is the largest occupational group, accounting for 14.5 percent of the region’s jobs in 2008-2010. However, the number of jobs in the occupation in 2008-2010 was actually fewer than in 2000. Sales jobs make up the second largest occupational group and increased over the course of the decade. Employment in-creased in occupations that are closely associated with growing in-dustries, such as Healthcare Support occupations with a very high employment concentration in Health Care & Social Assistance. Similarly, some occupations that are strongly concentrated in de-clining industries have contracted, such as Production occupations in the Manufacturing sector.
Source: US Census Bureau 2008-2010 American Community Survey PUMS data files.
Note: All Other occupations are composed of Community & Social Services, Legal, Protective Services, Farming, Fishing, & Forestry, and Military Specific. Occupations are sorted largest to smallest by size in Massachusetts in 2008-2010. See the on-line Data Appendix for occupational employment trends.
16,896
3,531
5,102
4,311
10,346
9,201
11,942
11,627
5,677
16,172
12,632
22,173
16,671
10,198
19,725
24,563
30,651
27,466
43,947
0 15,000 30,000 45,000 60,000
Total Employment
All Other
Life, Physical, & Social Sciences
Arts, Design, Entertainment, Sports, & Media
Architecture & Engineering
Healthcare Support
Installation, Maintenance, & Repair
Personal Care & Service
Building, Grounds Cleaning, & Maintenance
Computer & Mathematical
Transportation & Material Moving
Construction & Extraction
Production
Food Preparation & Serving
Business & Financial Operations
Healthcare Practitioners & Technical Services
Education, Training, & Library Services
Sales
Management
Office & Administrative Support
Labor Market Trends in the Pioneer Valley Region www.bostonfed.org/neppc 31
EMPLOYMENT BY MAJOR OCCUPATION: MASSACHUSETTS (2008-2010)
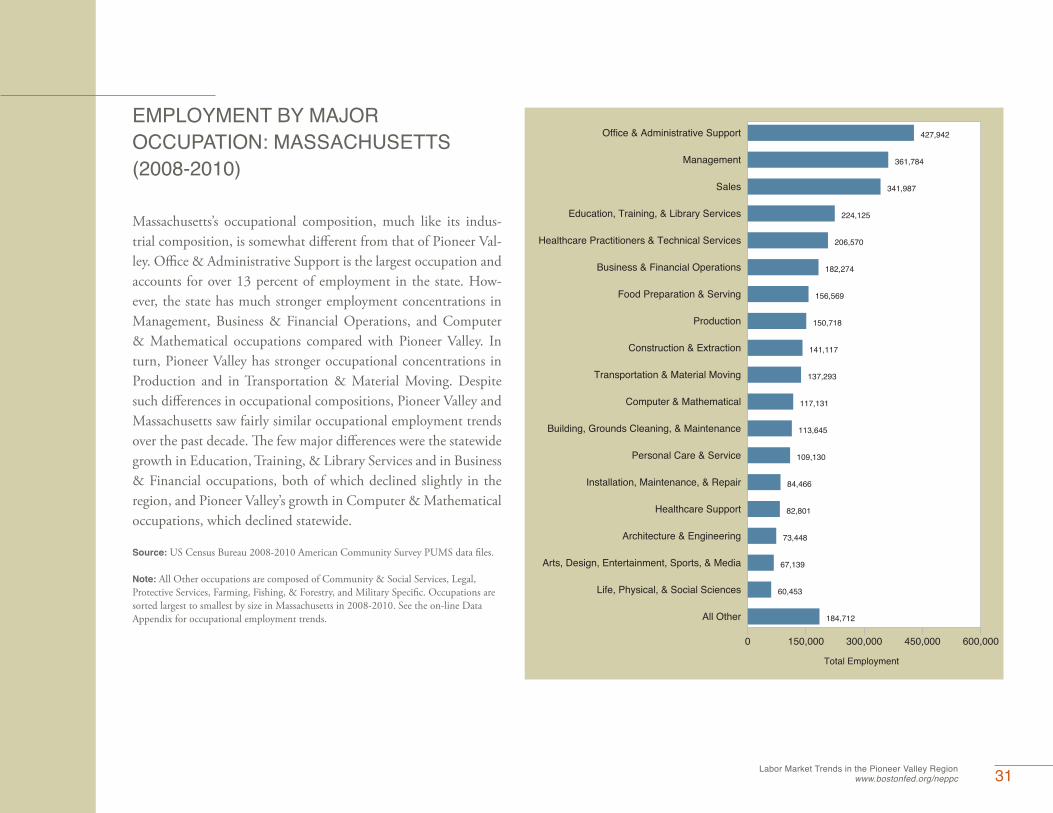
Massachusetts’s occupational composition, much like its indus-trial composition, is somewhat different from that of Pioneer Val-ley. Office & Administrative Support is the largest occupation and accounts for over 13 percent of employment in the state. How-ever, the state has much stronger employment concentrations in Management, Business & Financial Operations, and Computer & Mathematical occupations compared with Pioneer Valley. In turn, Pioneer Valley has stronger occupational concentrations in Production and in Transportation & Material Moving. Despite such differences in occupational compositions, Pioneer Valley and Massachusetts saw fairly similar occupational employment trends over the past decade. The few major differences were the statewide growth in Education, Training, & Library Services and in Business & Financial occupations, both of which declined slightly in the region, and Pioneer Valley’s growth in Computer & Mathematical occupations, which declined statewide.
Source: US Census Bureau 2008-2010 American Community Survey PUMS data files.
Note: All Other occupations are composed of Community & Social Services, Legal, Protective Services, Farming, Fishing, & Forestry, and Military Specific. Occupations are sorted largest to smallest by size in Massachusetts in 2008-2010. See the on-line Data Appendix for occupational employment trends. 184,712
60,453
67,139
73,448
82,801
84,466
109,130
113,645
117,131
137,293
141,117
150,718
156,569
182,274
206,570
224,125
341,987
361,784
427,942
0 150,000 300,000 450,000 600,000
Total Employment
All Other
Life, Physical, & Social Sciences
Arts, Design, Entertainment, Sports, & Media
Architecture & Engineering
Healthcare Support
Installation, Maintenance, & Repair
Personal Care & Service
Building, Grounds Cleaning, & Maintenance
Computer & Mathematical
Transportation & Material Moving
Construction & Extraction
Production
Food Preparation & Serving
Business & Financial Operations
Healthcare Practitioners & Technical Services
Education, Training, & Library Services
Sales
Management
Office & Administrative Support

32 Labor Market Trends in the Pioneer Valley Regionwww.bostonfed.org/neppc
DISTRIBUTION OF OCCUPATIONS ACROSS SUPERSECTORS OUTSIDE GREATER BOSTON (2008-2010)
Because changes in industries and occupations can impact each other, it is important to see how occupations are distributed across industries. Unfortunately, data limitations make it difficult to do this for small geographic regions. Due to the different composi-tions of Metro South/West and Boston/Metro North relative to the other labor markets, we have split Massachusetts into two labor markets: Greater Boston (Metro South/West and Boston/Metro North) and Outside Greater Boston (the other six labor markets, including Pioneer Valley). Some occupations in the Out-side Greater Boston labor market are concentrated in one or two industries, while other occupations are spread across a number of industries. Consider that nearly 95 percent of Education, Train-ing, & Library Service jobs are located in the Education & Health Services supersector. In contrast, Management jobs account for more than 10 percent of employment in every supersector except Construction.
Source: US Census Bureau 2008-2010 American Community Survey PUMS data files.
Note: Due to sample size limitations in the Census and American Community Survey, it is not possible to provide an occupational distribution across industries for small geo-graphic areas. Therefore, Metro South/West and Boston/Metro North were grouped to increase observations and provide an occupation/industry distribution for Greater Boston. With relatively strong concentrations in the occupational categories of Management and Business & Financial Operations, and in the supersectors of Professional & Technical Ser-vices and Financial Activities, the labor market compositions of Metro South/West and Boston/Metro North are fairly similar. When combined, these two regions account for 46.4 percent of the state’s employment. In comparison, the labor markets outside of the Greater Boston region (Berkshire, Pioneer Valley, Central Mass, Northeast, Southeast, and the Cape & Islands) tend to have stronger concentrations in the supersectors of Trade, Transportation, & Utilities, Leisure & Hospitality, and/or Manufacturing, and in the occu-pational categories of Sales, Office & Administrative Support, and Production. While there are differences among the regional labor markets exclusive of Greater Boston, industrial and occupational concentrations are likely similar enough to approximate their distribu-tions for these labor markets.

Labor Market Trends in the Pioneer Valley Region www.bostonfed.org/neppc 33
DISTRIBUTION OF OCCUPATIONS ACROSS SUPERSECTORS OUTSIDE GREATER BOSTON (2008-2010)
Education & Health Services
Trade, Transportation,
& Utilities
Professional & Business
Services ManufacturingLeisure
& HospitalityFinancial Activities Construction Other
All Industries
Office & Administrative Support 22.4 26.1 10.3 9.4 3.5 13.6 2.6 12.1 100.0
Management 19.6 10.7 10.5 17.3 10.2 11.2 8.7 11.8 100.0Sales 0.9 68.5 3.7 5.7 4.5 11.2 0.6 5.0 100.0Education, Training, & Library Services 94.8 0.2 0.4 0.2 1.1 0.2 0.0 3.1 100.0Healthcare Practitioners & Technical Services 86.4 6.5 4.0 0.2 0.1 0.4 0.1 2.3 100.0
Business & Financial Operations 10.0 12.1 22.4 12.7 1.4 27.9 2.7 10.8 100.0
Food Preparation & Serving 11.9 5.5 0.2 0.5 80.0 0.4 0.0 1.4 100.0Production 3.1 11.3 3.5 73.2 1.0 0.2 0.8 6.9 100.0Construction & Extraction 2.2 3.0 1.7 2.7 0.1 0.9 88.3 1.1 100.0Transportation & Material Moving 4.4 62.1 4.8 13.7 4.8 1.2 3.0 6.1 100.0Computer & Mathematical 9.8 7.5 38.4 20.7 0.8 12.4 0.1 10.5 100.0Building, Grounds Cleaning, & Maintenance 26.9 5.1 37.0 2.4 10.8 4.0 0.5 13.3 100.0Personal Care & Service 40.2 2.4 1.6 0.0 14.5 0.3 0.1 41.0 100.0
Installation, Maintenance, & Repair 3.3 26.3 4.6 13.5 2.5 2.6 8.4 38.7 100.0Healthcare Support 92.6 1.0 1.4 0.1 0.6 0.2 0.0 4.1 100.0Architecture & Engineering 2.5 5.8 31.8 50.6 0.2 0.4 3.6 5.2 100.0Arts, Design, Entertainment, Sports, & Media 12.0 11.6 22.6 8.6 20.4 1.4 0.5 22.9 100.0Life, Physical, & Social Sciences 36.7 2.8 28.5 18.2 0.9 1.9 0.3 10.6 100.0All Other 28.9 3.4 17.4 0.8 3.6 1.9 0.1 43.7 100.0
All Occupations 26.8 19.4 9.4 11.9 8.3 6.3 6.1 11.6 100.0

34 Labor Market Trends in the Pioneer Valley Regionwww.bostonfed.org/neppc
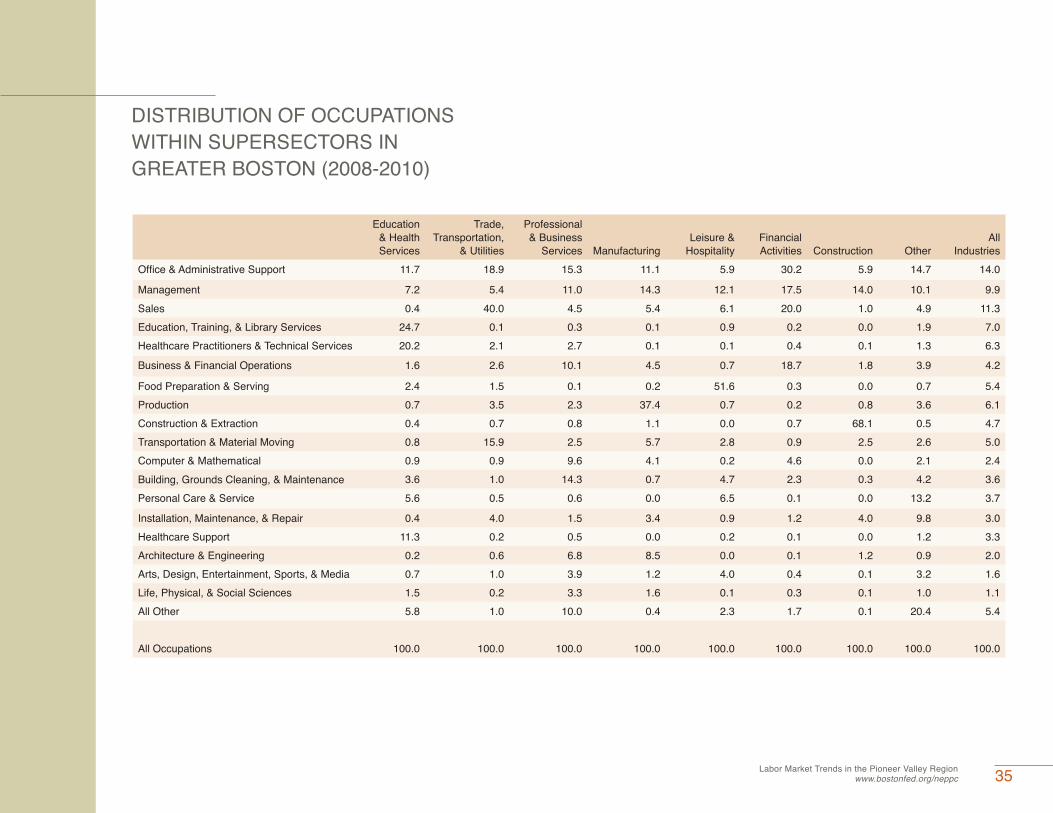
We can also consider what the distribution of occupations within a given supersector looks like. Certain occupations account for major shares of employment within a supersector. For example, Outside Greater Boston sees nearly 45 percent of its employment in the Education & Health Services supersector coming from two occupations: Education, Training, & Library Services and Health-care Practitioners & Technical Services. Further, the Construction supersector has over two-thirds of its employment in Construction & Extraction occupations. While some occupations account for an overwhelming majority of the employment in a given supersec-tor, others consistently account for a large share of employment in each supersector. In fact, the two largest occupational groups—Office & Administrative Support and Management—together ac-count for a sizable share of jobs within every supersector (ranging from 18.0 percent in Leisure & Hospitality to 47.7 percent of Financial Activities).
DISTRIBUTION OF OCCUPATIONS WITHIN SUPERSECTORS IN GREATER BOSTON (2008-2010)
Source: US Census Bureau 2008-2010 American Community Survey PUMS data files.
Note: Due to sample size limitations in the Census and American Community Survey, it is not possible to provide an occupational distribution across industries for small geographic areas. Therefore, Metro South/West and Boston/Metro North were grouped to increase observations and provide an occupation/industry distribution for Greater Bos-ton. With relatively strong concentrations in the occupational categories of Management and Business & Financial Operations, and in the supersectors of Professional & Technical Services and Financial Activities, the labor market compositions of Metro South/West and Boston/Metro North are fairly similar. When combined, these two regions account for 46.4 percent of the state’s employment. In comparison, the labor markets outside of the Greater Boston region (Berkshire, Pioneer Valley, Central Mass, Northeast, Southeast, and the Cape & Islands) tend to have stronger concentrations in the supersectors of Trade, Transportation, & Utilities, Leisure & Hospitality, and/or Manufacturing, and in the occupational categories of Sales, Office & Administrative Support, and Production. While there are differences among the regional labor markets exclusive of Greater Boston, industrial and occupational concentrations are likely similar enough to approximate their distributions for these labor markets.
Labor Market Trends in the Pioneer Valley Region www.bostonfed.org/neppc 35
DISTRIBUTION OF OCCUPATIONS WITHIN SUPERSECTORS IN GREATER BOSTON (2008-2010)
Education & Health Services
Trade, Transportation,
& Utilities
Professional & Business
Services ManufacturingLeisure &
HospitalityFinancial Activities Construction Other
All Industries
Office & Administrative Support 11.7 18.9 15.3 11.1 5.9 30.2 5.9 14.7 14.0
Management 7.2 5.4 11.0 14.3 12.1 17.5 14.0 10.1 9.9Sales 0.4 40.0 4.5 5.4 6.1 20.0 1.0 4.9 11.3Education, Training, & Library Services 24.7 0.1 0.3 0.1 0.9 0.2 0.0 1.9 7.0Healthcare Practitioners & Technical Services 20.2 2.1 2.7 0.1 0.1 0.4 0.1 1.3 6.3
Business & Financial Operations 1.6 2.6 10.1 4.5 0.7 18.7 1.8 3.9 4.2
Food Preparation & Serving 2.4 1.5 0.1 0.2 51.6 0.3 0.0 0.7 5.4Production 0.7 3.5 2.3 37.4 0.7 0.2 0.8 3.6 6.1Construction & Extraction 0.4 0.7 0.8 1.1 0.0 0.7 68.1 0.5 4.7Transportation & Material Moving 0.8 15.9 2.5 5.7 2.8 0.9 2.5 2.6 5.0Computer & Mathematical 0.9 0.9 9.6 4.1 0.2 4.6 0.0 2.1 2.4Building, Grounds Cleaning, & Maintenance 3.6 1.0 14.3 0.7 4.7 2.3 0.3 4.2 3.6Personal Care & Service 5.6 0.5 0.6 0.0 6.5 0.1 0.0 13.2 3.7
Installation, Maintenance, & Repair 0.4 4.0 1.5 3.4 0.9 1.2 4.0 9.8 3.0Healthcare Support 11.3 0.2 0.5 0.0 0.2 0.1 0.0 1.2 3.3Architecture & Engineering 0.2 0.6 6.8 8.5 0.0 0.1 1.2 0.9 2.0Arts, Design, Entertainment, Sports, & Media 0.7 1.0 3.9 1.2 4.0 0.4 0.1 3.2 1.6Life, Physical, & Social Sciences 1.5 0.2 3.3 1.6 0.1 0.3 0.1 1.0 1.1All Other 5.8 1.0 10.0 0.4 2.3 1.7 0.1 20.4 5.4
All Occupations 100.0 100.0 100.0 100.0 100.0 100.0 100.0 100.0 100.0
36 Labor Market Trends in the Pioneer Valley Regionwww.bostonfed.org/neppc
EDUCATIONAL ATTAINMENT OF EMPLOYEES BY MAJOR OCCUPATION IN PIONEER VALLEY (2000)
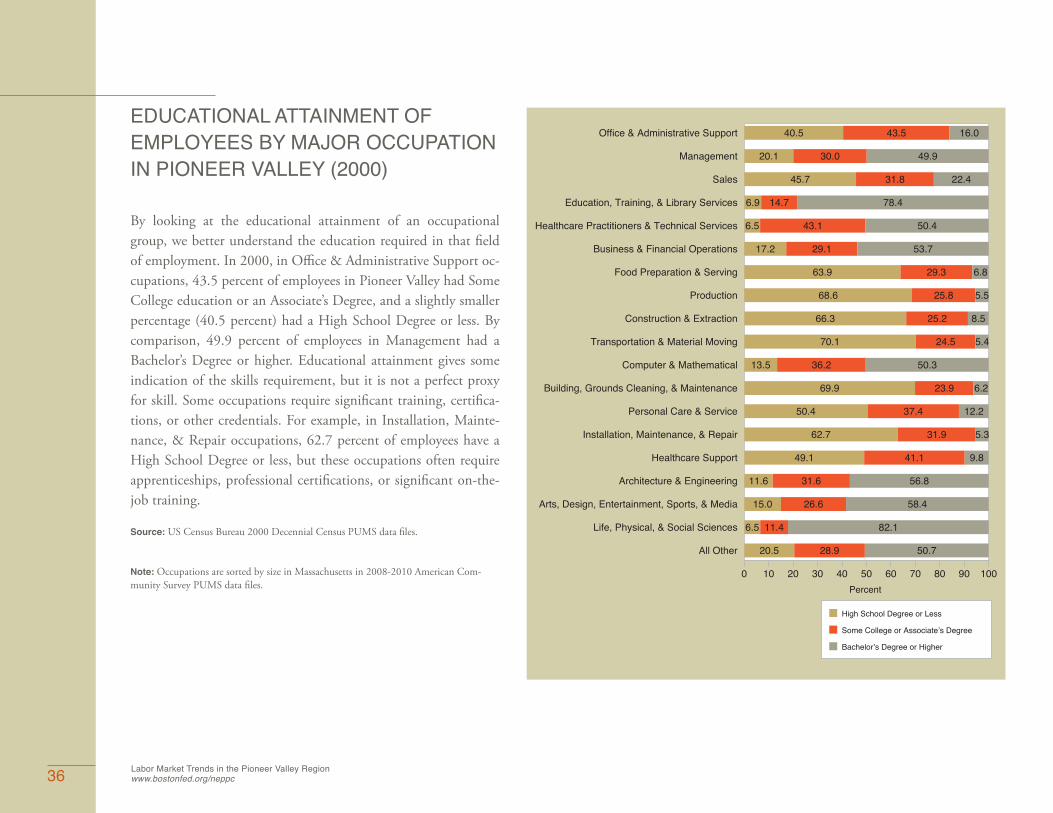
By looking at the educational attainment of an occupational group, we better understand the education required in that field of employment. In 2000, in Office & Administrative Support oc-cupations, 43.5 percent of employees in Pioneer Valley had Some College education or an Associate’s Degree, and a slightly smaller percentage (40.5 percent) had a High School Degree or less. By comparison, 49.9 percent of employees in Management had a Bachelor’s Degree or higher. Educational attainment gives some indication of the skills requirement, but it is not a perfect proxy for skill. Some occupations require significant training, certifica-tions, or other credentials. For example, in Installation, Mainte-nance, & Repair occupations, 62.7 percent of employees have a High School Degree or less, but these occupations often require apprenticeships, professional certifications, or significant on-the-job training.
Source: US Census Bureau 2000 Decennial Census PUMS data files.
Note: Occupations are sorted by size in Massachusetts in 2008-2010 American Com-munity Survey PUMS data files.
20.5 28.9 50.7
6.5 11.4 82.1
15.0 26.6 58.4
11.6 31.6 56.8
49.1 41.1 9.8
62.7 31.9 5.3
50.4 37.4 12.2
69.9 23.9 6.2
13.5 36.2 50.3
70.1 24.5 5.4
66.3 25.2 8.5
68.6 25.8 5.5
63.9 29.3 6.8
17.2 29.1 53.7
6.5 43.1 50.4
6.9 14.7 78.4
45.7 31.8 22.4
20.1 30.0 49.9
40.5 43.5 16.0
0 10 20 30 40 50 60 70 80 90 100Percent
All Other
Life, Physical, & Social Sciences
Arts, Design, Entertainment, Sports, & Media
Architecture & Engineering
Healthcare Support
Installation, Maintenance, & Repair
Personal Care & Service
Building, Grounds Cleaning, & Maintenance
Computer & Mathematical
Transportation & Material Moving
Construction & Extraction
Production
Food Preparation & Serving
Business & Financial Operations
Healthcare Practitioners & Technical Services
Education, Training, & Library Services
Sales
Management
Office & Administrative Support
High School Degree or Less
Some College or Associate’s Degree
Bachelor’s Degree or Higher

Labor Market Trends in the Pioneer Valley Region www.bostonfed.org/neppc 37
EDUCATIONAL ATTAINMENT OF EMPLOYEES BY MAJOR OCCUPATION IN PIONEER VALLEY (2008-2010)
Over the past decade, the share of employees with a Bachelor’s Degree or higher increased in 16 of the 19 major occupations in Pioneer Valley. For example, the share of Computer & Mathemat-ical employees with a Bachelor’s Degree or higher grew by more than 16 percentage points to reach 67.0 percent in 2008-2010. Even occupations with a mix of educational levels, such as Office & Administrative Support, saw declines in the share of employees with a High School Degree or less and growth in the share of employees with a Bachelor’s Degree or higher. The educational at-tainment of employees even increased in occupations where work-ers traditionally have less education, such as Production. As such, nine occupations in the region had a majority of employees with a Bachelor’s Degree or higher in 2008-2010, while six occupations had a majority of employees with a High School Degree or less.
Source: US Census Bureau 2008-2010 American Community Survey PUMS data files.
Note: Occupations are sorted by size in Massachusetts in 2008-2010 American Com-munity Survey PUMS data files.
20.1 22.2 57.6
13.7 82.6
12.2 23.2 64.6
15.2 31.8 53.0
43.9 42.0 14.1
55.0 37.6 7.5
43.2 39.2 17.6
65.5 25.1 9.4
8.7 24.3 67.0
67.7 26.2 6.1
63.0 29.1 7.9
64.2 28.1 7.7
61.2 31.4 7.4
13.1 28.6 58.3
6.3 39.6 54.1
6.4 16.2 77.4
38.6 36.5 24.9
18.1 29.0 52.9
38.9 43.5 17.6
0 10 20 30 40 50 60 70 80 90 100Percent
All Other
Life, Physical, & Social Sciences
Arts, Design, Entertainment, Sports, & Media
Architecture & Engineering
Healthcare Support
Installation, Maintenance, & Repair
Personal Care & Service
Building, Grounds Cleaning, & Maintenance
Computer & Mathematical
Transportation & Material Moving
Construction & Extraction
Production
Food Preparation & Serving
Business & Financial Operations
Healthcare Practitioners & Technical Services
Education, Training, & Library Services
Sales
Management
Office & Administrative Support
High School Degree or Less
Some College or Associate’s Degree
Bachelor’s Degree or Higher
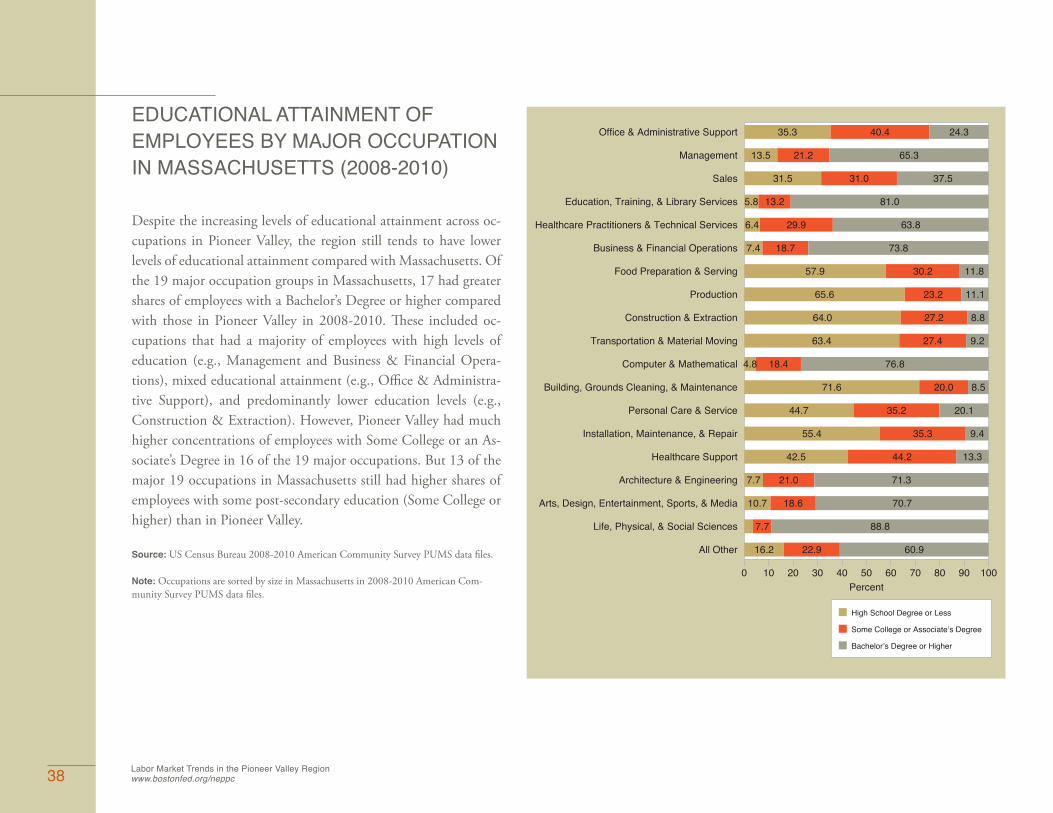
38 Labor Market Trends in the Pioneer Valley Regionwww.bostonfed.org/neppc
EDUCATIONAL ATTAINMENT OF EMPLOYEES BY MAJOR OCCUPATION IN MASSACHUSETTS (2008-2010)
Despite the increasing levels of educational attainment across oc-cupations in Pioneer Valley, the region still tends to have lower levels of educational attainment compared with Massachusetts. Of the 19 major occupation groups in Massachusetts, 17 had greater shares of employees with a Bachelor’s Degree or higher compared with those in Pioneer Valley in 2008-2010. These included oc-cupations that had a majority of employees with high levels of education (e.g., Management and Business & Financial Opera-tions), mixed educational attainment (e.g., Office & Administra-tive Support), and predominantly lower education levels (e.g., Construction & Extraction). However, Pioneer Valley had much higher concentrations of employees with Some College or an As-sociate’s Degree in 16 of the 19 major occupations. But 13 of the major 19 occupations in Massachusetts still had higher shares of employees with some post-secondary education (Some College or higher) than in Pioneer Valley.
Source: US Census Bureau 2008-2010 American Community Survey PUMS data files.
Note: Occupations are sorted by size in Massachusetts in 2008-2010 American Com-munity Survey PUMS data files.
16.2 22.9 60.9
7.7 88.8
10.7 18.6 70.7
7.7 21.0 71.3
42.5 44.2 13.3
55.4 35.3 9.4
44.7 35.2 20.1
71.6 20.0 8.5
4.8 18.4 76.8
63.4 27.4 9.2
64.0 27.2 8.8
65.6 23.2 11.1
57.9 30.2 11.8
7.4 18.7 73.8
6.4 29.9 63.8
5.8 13.2 81.0
31.5 31.0 37.5
13.5 21.2 65.3
35.3 40.4 24.3
0 10 20 30 40 50 60 70 80 90 100Percent
All Other
Life, Physical, & Social Sciences
Arts, Design, Entertainment, Sports, & Media
Architecture & Engineering
Healthcare Support
Installation, Maintenance, & Repair
Personal Care & Service
Building, Grounds Cleaning, & Maintenance
Computer & Mathematical
Transportation & Material Moving
Construction & Extraction
Production
Food Preparation & Serving
Business & Financial Operations
Healthcare Practitioners & Technical Services
Education, Training, & Library Services
Sales
Management
Office & Administrative Support
High School Degree or Less
Some College or Associate’s Degree
Bachelor’s Degree or Higher

JOB VACANCIES IN THE GREAT RECESSION AND RECOVERY
Job vacancies exist even in a healthy labor market due to turnover and constant flux in the labor market. As businesses expand, they need to hire individuals who meet specific skill requirements, and employees with skills that are in demand leave jobs for better posi-tions. As the economy enters a downturn, job vacancies decline due to an overall decline in labor demand, there is an increase in the number of applicants available to fill positions, and there is lower turnover as employees stay longer in jobs. At the end of 2007, the job vacancy rate in Pioneer Valley was 2.7 percent, the lowest of all regional labor markets. As a result of the Great Reces-sion, the regional vacancy rate declined to 2.0 percent by the end of 2009. But as the economy started to recover, the vacancy rate rose by more than half a percentage point, reaching 2.6 percent by the end of 2010. At that point, Pioneer Valley accounted for 9.1 percent of the state’s employment but only 8.5 percent of the job vacancies.
Source: Massachusetts Executive Office of Labor and Workforce Development Job Vacancy Survey.
Note: The Massachusetts Job Vacancy Survey is collected for seven regions in the state. Vacancy rates are calculated by taking the total number of job vacancies and dividing by the total number employed in the region. The Greater Boston region covers portions of the Northeast, Metro South/West, Central Mass, and Southeast regions of the regional labor market profiles. The vacancy information for the Greater Boston region is used as an approximation of the vacancies trends experienced in the Metro South/West and Boston/Metro North regions.
2.7
2.0
2.6
3.2
2.2
2.8
0
1
2
3
4
5
Vaca
ncy
Rat
e
Pionee
r Valle
y
Massa
chus
etts
Berksh
ire
Cape &
Islan
ds
Centra
l Mas
s
Greater
Boston
Northe
ast
Southe
ast
Job Vacancy Rates
Q4 2007Q4 2009Q4 2010
Greater Boston54.6%
Northeast 12.6%
Southeast 10.9%
Pioneer Valley 8.5%
Central Mass 8.2%
Cape & Islands 2.7%
Berkshire2.6%
Distribution of Job Vacancies Across Regional Labor Markets, Q4 2010

40 Labor Market Trends in the Pioneer Valley Regionwww.bostonfed.org/neppc
JOB VACANCIES AND VACANCY RATES BY MAJOR OCCUPATION IN GREATER BOSTON (Q4 2010)
Number of Vacancies
Share of Vacancy
(Percent)
Job Vacancy Rate
(Percent)Total 6,650 100.0 2.6Sales 1,469 22.1 5.4Office & Administrative Support 695 10.5 1.5
Food Preparation & Serving Related 916 13.8 3.8
Business & Financial Operations 384 5.8 4.3
Healthcare Practitioner & Technical 463 7.0 2.3
Computer & Mathematical * - 1.1
Management 136 2.0 1.1
Healthcare Support 446 6.7 4.4
Transportation & Material Moving 330 5.0 2.0
Education, Training & Library 218 3.3 0.8
Personal Care & Service * - 3.2
Production 359 5.4 1.7
Architecture & Engineering 41 0.6 1.5
Building, Grounds Cleaning & Maintenance 270 4.1 3.1
Arts, Design, Entertainment, Sports & Media 101 1.5 2.7
Community & Social Services 202 3.0 2.7
Life, Physical, & Social Services 21 0.3 0.8
Installation, Maintenance & Repair 84 1.3 0.8
Protective Service 99 1.5 1.5
Construction & Extraction 42 0.6 0.6
At the end of 2010, 46.3 percent of the vacancies in Pioneer Valley were concentrated in three occupations (Sales, Office & Adminis-trative Support, and Food Preparation & Serving). Sales positions accounted for the largest share of vacancies (22.1 percent) and the highest vacancy rate (5.4 percent) of all occupations in Pioneer Valley. However, some of these positions, especially in retail, are seasonal in nature. Other occupations with a large number of va-cancies and an above-average vacancy rate included Business & Fi-nancial Operations and Healthcare Support. In contrast, Office & Administrative Support was an example of an occupational group with a large share of total vacancies (10.5 percent) but a relatively low vacancy rate (1.5 percent). Not surprisingly, the region saw low numbers of vacancies and vacancy rates in occupations hit hardest by the Great Recession, such as Construction & Extrac-tion (with a vacancy rate of 0.6 percent).
Source: Massachusetts Executive Office of Labor and Workforce Development Job Vacancy Survey.
Note: Vacancy rates are calculated by taking the total number of job vacancies and divid-ing by the total number employed in the occupation. An asterisk (*) indicates there were vacancies in the occupation that were suppressed due to disclosure issues.

Labor Market Trends in the Pioneer Valley Region www.bostonfed.org/neppc 41
JOB VACANCIES AND VACANCY RATES BY MAJOR OCCUPATION IN MASSACHUSETTS (Q4 2010)
Number of Vacancies
Share of Vacancy
(Percent)
Job Vacancy Rate
(Percent)Total 78,589 100.0 2.8Sales 16,584 21.1 5.2Office & Administrative Support 8,650 11.0 1.6
Food Preparation & Serving Related 8,195 10.4 3.1
Business & Financial Operations 6,079 7.7 3.6
Healthcare Practitioner & Technical 5,249 6.7 2.3
Computer & Mathematical 4,950 6.3 4.0
Management 4,595 5.8 2.5
Healthcare Support 3,634 4.6 3.8
Transportation & Material Moving 3,214 4.1 2.1
Education, Training & Library 2,895 3.7 1.3
Personal Care & Service 2,055 2.6 2.4
Production 1,774 2.3 1.1
Architecture & Engineering 1,734 2.2 2.3
Building, Grounds Cleaning & Maintenance 1,555 2.0 1.5
Arts, Design, Entertainment, Sports & Media 1,421 1.8 2.7
Community & Social Services 1,411 1.8 2.2
Life, Physical, & Social Services 1,398 1.8 2.6
Installation, Maintenance & Repair 1,160 1.5 1.2
Protective Service 1,124 1.4 1.5
Construction & Extraction 583 0.7 0.6
Legal 244 0.3 1.0
As in Pioneer Valley, the largest number of job vacancies and high-est vacancy rate in Massachusetts are in Sales occupations, and at the end of 2010, over 40 percent of vacancies were concen-trated in the same three occupations in both the region and the state. However, Massachusetts had a lower vacancy rate and share of vacancies coming from Sales occupations, relative to Pioneer Valley. The state also had much smaller shares of vacancies and lower vacancy rates in Health Support, Production, and Build-ing, Grounds Cleaning, & Maintenance occupations compared with Pioneer Valley. However, Massachusetts tends to have higher concentration of vacancies in Office & Administrative Support, Management, and Computer & Mathematical occupations.
Source: Massachusetts Executive Office of Labor and Workforce Development Job Vacancy Survey.

42
COMPARING VACANCY RATES AND EDUCATIONAL ATTAINMENT: PEAK LABOR MARKET
Before the Great Recession, there was a correlation between edu-cational attainment and job vacancies in Massachusetts. That is, occupations with workers who had higher levels of educational attainment had higher vacancy rates. This was not surprising, as jobs in occupations that have larger shares of employees with a High School Degree or less can sometimes be filled by number of individuals with little training, and can be done at lower costs to employers. In contrast, jobs in highly specialized occupations that require specific educational requirements faced competition both regionally and globally for the limited number of individuals who can fill such positions. Further, strong growth in industries that employ large shares of individuals with high levels of educational attainment, such as Health Care & Social Assistance and Profes-sional & Technical Services, can lead to increased vacancies and demand for employees that can fill such positions. But the correla-tion between educational attainment and job vacancies was fairly weak in Pioneer Valley even during the peak labor market; this was due to occupations tending to having low shares of employees with post-secondary education in the region, as well as the region’s stronger employment concentrations in certain sectors with lower educational attainment, such as Manufacturing and Trade, Trans-portation, & Utilities.
Source: Massachusetts Executive Office of Labor and Workforce Development Job Vacancy Survey and US Census Bureau 2005-2007 American Community Survey.
Note: Occupational vacancy rates for Pioneer Valley in Q4 2007 proxy vacancy rates in a peak labor market, and educational attainment data by occupation in Pioneer Valley from the 2005-2007 American Community Survey proxy share of employees with a post-secondary education in a peak labor market. Workers have attained a post-secondary education if they have attended Some College or obtained an Associate’s Degree, Bach-elor’s Degree, or Master’s Degree or higher.
0
1
2
3
4
5
6
7
Occ
upat
iona
l Vac
ancy
Rat
e
10 20 30 40 50 60 70 80 90 100Share of Employees with Post−Secondary Education by Major Occupation
Pioneer Valley
Massachusetts
Linear (Pioneer Valley)
Linear (Massachusetts )

Labor Market Trends in the Pioneer Valley Region www.bostonfed.org/neppc 43
COMPARING VACANCY RATES AND EDUCATIONAL ATTAINMENT: RECOVERING LABOR MARKET
During the Great Recession, the relationship between vacancy rates and educational attainment weakened somewhat statewide and actually reversed in Pioneer Valley. This reversal of this re-lationship in the Pioneer Valley is likely driven by three factors: (1) the lower educational attainment levels of employees in the region relative to Massachusetts, (2) the region’s lower vacancy rates in occupations with predominantly higher levels of educa-tion, such as Management and Computer & Mathematical oc-cupations, and higher vacancy rates in occupations that typically require less education, such as Healthcare Support and Produc-tion, and (3) the region’s stronger growth (relative to Massachu-setts) in a number of industries with larger shares of employees that have lower levels of educational attainment, such Whole-sale Trade and Construction, resulting in increased demand and more vacancies in such occupations.
Source: Massachusetts Executive Office of Labor and Workforce Development Job Vacancy Survey and US Census Bureau 2008-2010 American Community Survey.
Note: Occupational vacancy rates for Pioneer Valley in Q4 2010 proxy vacancy rates in a recovering labor market, and educational attainment data by occupation in Pioneer Valley from the 2008-2010 American Community Survey proxy share of employees with a post-secondary education in a recovering labor market.
0
1
2
3
4
5
6
7
Occ
upat
iona
l Vac
ancy
Rat
e
10 20 30 40 50 60 70 80 90 100Share of Employees with Post−Secondary Education by Major Occupation
Pioneer Valley
Massachusetts
Linear (Pioneer Valley)
Linear (Massachusetts)
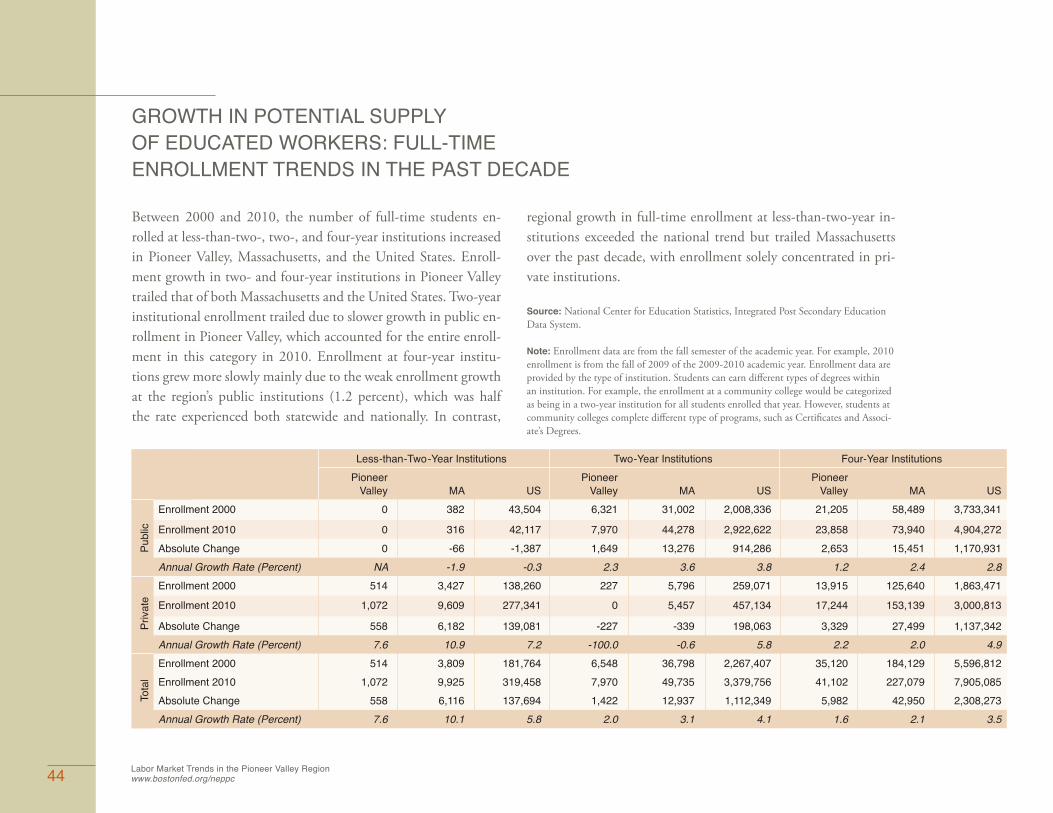
44 Labor Market Trends in the Pioneer Valley Regionwww.bostonfed.org/neppc
GROWTH IN POTENTIAL SUPPLY OF EDUCATED WORKERS: FULL-TIME ENROLLMENT TRENDS IN THE PAST DECADE
Less-than-Two-Year Institutions Two-Year Institutions Four-Year InstitutionsPioneer
Valley
MA USPioneer
Valley MA USPioneer
Valley MA USEnrollment 2000 0 382 43,504 6,321 31,002 2,008,336 21,205 58,489 3,733,341
Enrollment 2010 0 316 42,117 7,970 44,278 2,922,622 23,858 73,940 4,904,272Absolute Change 0 -66 -1,387 1,649 13,276 914,286 2,653 15,451 1,170,931Annual Growth Rate (Percent) NA -1.9 -0.3 2.3 3.6 3.8 1.2 2.4 2.8Enrollment 2000 514 3,427 138,260 227 5,796 259,071 13,915 125,640 1,863,471
Enrollment 2010 1,072 9,609 277,341 0 5,457 457,134 17,244 153,139 3,000,813
Absolute Change 558 6,182 139,081 -227 -339 198,063 3,329 27,499 1,137,342Annual Growth Rate (Percent) 7.6 10.9 7.2 -100.0 -0.6 5.8 2.2 2.0 4.9Enrollment 2000 514 3,809 181,764 6,548 36,798 2,267,407 35,120 184,129 5,596,812Enrollment 2010 1,072 9,925 319,458 7,970 49,735 3,379,756 41,102 227,079 7,905,085Absolute Change 558 6,116 137,694 1,422 12,937 1,112,349 5,982 42,950 2,308,273Annual Growth Rate (Percent) 7.6 10.1 5.8 2.0 3.1 4.1 1.6 2.1 3.5
Tot
al
P
rivat
e
P
ublic
Between 2000 and 2010, the number of full-time students en-rolled at less-than-two-, two-, and four-year institutions increased in Pioneer Valley, Massachusetts, and the United States. Enroll-ment growth in two- and four-year institutions in Pioneer Valley trailed that of both Massachusetts and the United States. Two-year institutional enrollment trailed due to slower growth in public en-rollment in Pioneer Valley, which accounted for the entire enroll-ment in this category in 2010. Enrollment at four-year institu-tions grew more slowly mainly due to the weak enrollment growth at the region’s public institutions (1.2 percent), which was half the rate experienced both statewide and nationally. In contrast,
regional growth in full-time enrollment at less-than-two-year in-stitutions exceeded the national trend but trailed Massachusetts over the past decade, with enrollment solely concentrated in pri-vate institutions.
Source: National Center for Education Statistics, Integrated Post Secondary Education Data System.
Note: Enrollment data are from the fall semester of the academic year. For example, 2010 enrollment is from the fall of 2009 of the 2009-2010 academic year. Enrollment data are provided by the type of institution. Students can earn different types of degrees within an institution. For example, the enrollment at a community college would be categorized as being in a two-year institution for all students enrolled that year. However, students at community colleges complete different type of programs, such as Certificates and Associ-ate’s Degrees.

Labor Market Trends in the Pioneer Valley Region www.bostonfed.org/neppc 45
NUMBER OF FULL-TIME ENROLLEES BY TYPE OF DEGREE GRANTING INSTITUTION IN PIONEER VALLEY (2000-2010)
Four-year institutions continued to account for most of the full-time enrollment in higher education institutions in Pioneer Valley, but their share fell slightly over the past decade, from 83.3 percent in 2000 to 82.0 percent in 2010. While full-time enroll-ment at four-year institutions grew at a fairly consistent pace in the past decade, there were sharp increases in enrollment at two-year and less-than-two-year institutions in recent years. Between 2000 and 2008, the annual rate of growth in full-time enroll-ment at two-year institutions grew at a fairly moderate pace (0.7 percent) before growing at an annual rate of 7.2 percent between 2008 and 2010. Enrollment at less-than-two-year institutions was more volatile over the course of the decade, growing from slightly over 500 full-time enrollees in 2000 to 986 in 2005, then dropping to 563 in 2008. From 2008 to 2010, however, full-time enrollment at such institutions nearly doubled to reach 1,072 in 2010.
Source: National Center for Education Statistics, Integrated Post Secondary Education Data System.
Note: In the above stacked-area chart, the different areas represent the number of enrollees by institution type. For example, enrollment at less-than-two-year institutions was nearly 1,100 in 2010, compared with more than 41,100 at four-year institutions that year. All three areas combined represent the total number of enrollees in post-secondary educational institutions in Pioneer Valley, of which there were more than 50,100 in 2010. The areas are stacked in order of size in 2010, with enrollment at four-year institutions, the largest enrollment group, on the bottom and enrollment at less-than-two-year institu-tions, the smallest group, at the top.
0
8,000
16,000
24,000
32,000
40,000
48,000
56,000Less-Than-Two-Year Institutions
Two-Year Institutions
Four-Year Institutions
2000 2001 2002 2003 2004 2005 2006 2007 2008 2009 2010
Num
ber o
f Par
t−Ti
me
Enro
llees

46 Labor Market Trends in the Pioneer Valley Regionwww.bostonfed.org/neppc
GROWTH IN POTENTIAL SUPPLY OF EDUCATED WORKERS: PART-TIME ENROLLMENT TRENDS IN THE PAST DECADE
Less-than-Two-Year Institutions Two-Year Institutions Four-Year InstitutionsPioneer
Valley MA USPioneer
Valley MA USPioneer
Valley MA USEnrollment 2000 0 25 31,407 8,046 48,506 3,509,639 2,449 22,160 1,045,388
Enrollment 2010 0 65 27,264 8,831 58,043 4,247,674 2,058 16,120 1,380,877Absolute Change 0 40 -4,143 785 9,537 738,035 -391 -6,040 335,489Annual Growth Rate (Percent) NA 10.0 -1.4 0.9 1.8 1.9 -1.7 -3.1 2.8Enrollment 2000 60 1,522 31,827 0 3,536 66,870 2,746 27,425 476,690
Enrollment 2010 404 2,633 44,382 0 1,554 61,006 1,433 19,155 775,694
Absolute Change 344 1,111 12,555 0 -1,982 -5,864 -1,313 -8,270 299,004Annual Growth Rate (Percent) 21.0 5.6 3.4 NA -7.9 -0.9 -6.3 -3.5 5.0Enrollment 2000 60 1,547 63,234 8,046 52,042 3,576,509 5,195 49,585 1,522,078Enrollment 2010 404 2,698 71,646 8,831 59,597 4,308,680 3,491 35,275 2,156,571Absolute Change 344 1,151 8,412 785 7,555 732,171 -1,704 -14,310 634,493Annual Growth Rate (Percent) 21.0 5.7 1.3 0.9 1.4 1.9 -3.9 -3.3 3.5
Tot
al
P
rivat
e
P
ublic
The majority of part-time enrollees at post-secondary educational institutions are in public two-year institutions. In Pioneer Valley, part-time enrollment at public two-year institutions increased at a sluggish annual rate of 1.0 percent between 2000 and 2010. The region’s enrollment growth lagged behind the rates in Massachu-setts and the United States. Part-time enrollment in both public and private four-year institutions in Pioneer Valley and the state declined over the past decade while growing nationwide. In com-parison, the small number of part-time enrollees at the region’s
private less-than-two-year institutions grew at a robust annual rate (21.0 percent) between 2000 and 2010, far exceeding both state and national enrollment patterns.
Source: National Center for Education Statistics, Integrated Post Secondary Education Data System.
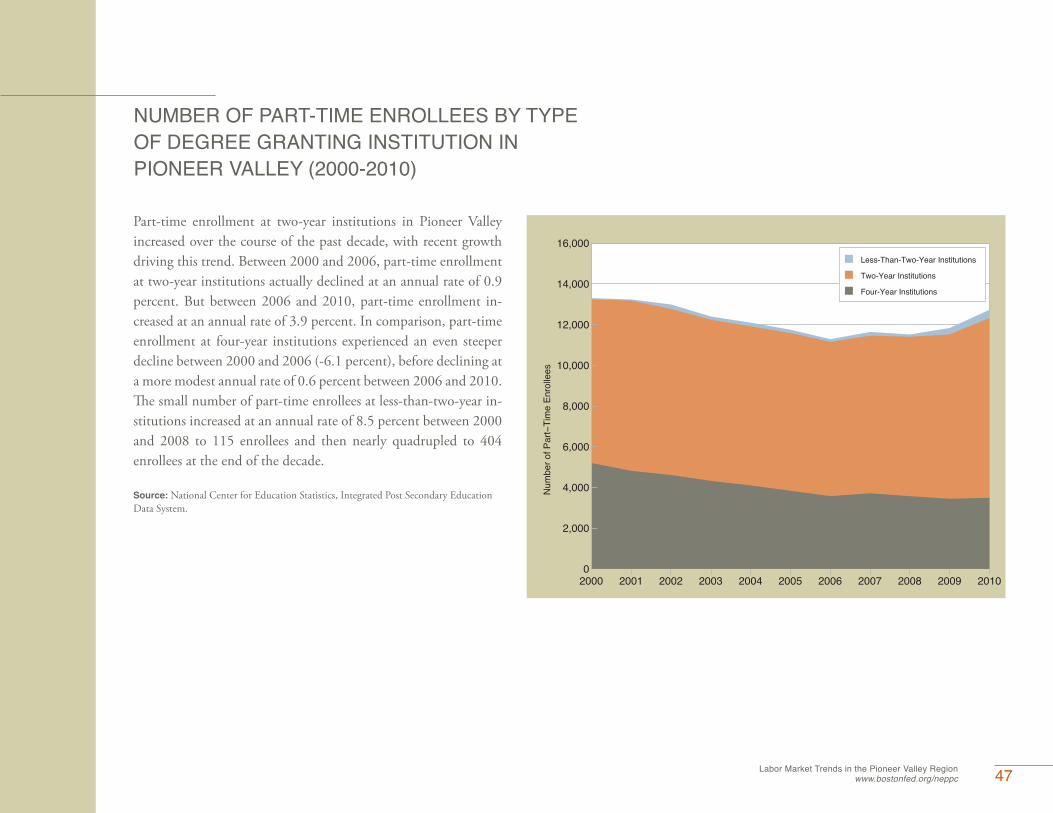
Labor Market Trends in the Pioneer Valley Region www.bostonfed.org/neppc 47
NUMBER OF PART-TIME ENROLLEES BY TYPE OF DEGREE GRANTING INSTITUTION IN PIONEER VALLEY (2000-2010)
Part-time enrollment at two-year institutions in Pioneer Valley increased over the course of the past decade, with recent growth driving this trend. Between 2000 and 2006, part-time enrollment at two-year institutions actually declined at an annual rate of 0.9 percent. But between 2006 and 2010, part-time enrollment in-creased at an annual rate of 3.9 percent. In comparison, part-time enrollment at four-year institutions experienced an even steeper decline between 2000 and 2006 (-6.1 percent), before declining at a more modest annual rate of 0.6 percent between 2006 and 2010. The small number of part-time enrollees at less-than-two-year in-stitutions increased at an annual rate of 8.5 percent between 2000 and 2008 to 115 enrollees and then nearly quadrupled to 404 enrollees at the end of the decade.
Source: National Center for Education Statistics, Integrated Post Secondary Education Data System.
0
2,000
4,000
6,000
8,000
10,000
12,000
14,000
16,000
Num
ber o
f Par
t−Ti
me
Enro
llees
Less-Than-Two-Year Institutions
Two-Year Institutions
Four-Year Institutions
2000 2001 2002 2003 2004 2005 2006 2007 2008 2009 2010

48
GRADUATION RATES BY TYPE OF DEGREE (2009)
Enrollment figures indicate a potential supply of post-secondary educated labor, but the actual supply depends on how many stu-dents complete their programs and earn a degree or a Certificate. In 2009, the graduation rate for first-time full-time students at four-year institutions in the Pioneer Valley region (e.g., those who earned a Bachelor’s Degree within six years) was 67.2 percent. This was slightly lower than the statewide rate but above the national rate. The six-year Bachelor’s Degree graduation rate at public in-stitutions (64.4 percent) was lower than those at private institu-tions in the region but higher than at public institutions in Mas-sachusetts and the United States. The three-year Associate’s Degree graduation rate (21.7 percent) was also fairly similar to the state-wide rate but trailed that in the United States. The Certificate pro-gram graduation rate in Pioneer Valley (63.7 percent) was the only category in which the region trailed both statewide and national rates. Because there are no graduates from public institutions, the region’s graduation rate for Certificates is based on private institu-tions. According to statewide data, private institutions granting Certificates tend to have slightly lower graduation rates than their public counterparts.
Source: National Center for Education Statistics, Integrated Post Secondary Education Data System.
Note: Graduation rates reflect the number of first-time full-time students who completed their degree/program within 150 percent of the time expected to complete the degree/program as a share of the number of first-time full-time students that started the degree/program (e.g., a Bachelor’s Degree is considered to have been earned on time if it is completed within six years or less, or 150 percent of four years). Comparisons of gradua-tion rates to enrollees or degree completions can be misleading as the first-time full-time students are a small subset of the student population, particularly for certain degrees/pro-grams. Graduation rates do not include part-time students and are excluded when there is an inadequate sample size of first-time full-time entrants for the degree/program to calculate a graduation rate. See the on-line Methodological Appendix for further details.
0
10
20
30
40
50
60
70
80
90
100
Gra
duat
ion
Rat
e
Certificate Programs Associate’s Degrees Bachelor’s Degrees
Pionee
r Valle
y
Massa
chus
etts
United
States
Pionee
r Valle
y
Massa
chus
etts
United
States
Pionee
r Valle
y
Massa
chus
etts
United
States
TotalPublicPrivate
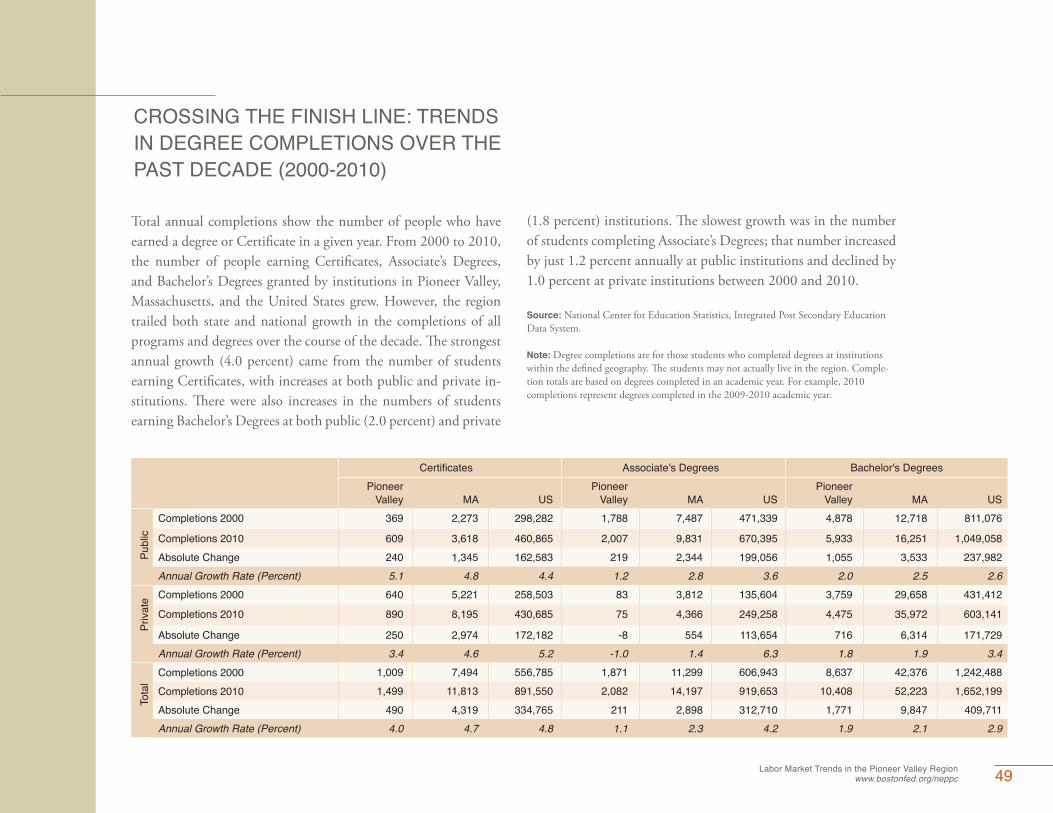
Labor Market Trends in the Pioneer Valley Region www.bostonfed.org/neppc 49
CROSSING THE FINISH LINE: TRENDS IN DEGREE COMPLETIONS OVER THE PAST DECADE (2000-2010)
Certificates Associate's Degrees Bachelor's DegreesPioneer
Valley MA USPioneer
Valley MA USPioneer
Valley MA USCompletions 2000 369 2,273 298,282 1,788 7,487 471,339 4,878 12,718 811,076
Completions 2010 609 3,618 460,865 2,007 9,831 670,395 5,933 16,251 1,049,058Absolute Change 240 1,345 162,583 219 2,344 199,056 1,055 3,533 237,982Annual Growth Rate (Percent) 5.1 4.8 4.4 1.2 2.8 3.6 2.0 2.5 2.6Completions 2000 640 5,221 258,503 83 3,812 135,604 3,759 29,658 431,412
Completions 2010 890 8,195 430,685 75 4,366 249,258 4,475 35,972 603,141
Absolute Change 250 2,974 172,182 -8 554 113,654 716 6,314 171,729Annual Growth Rate (Percent) 3.4 4.6 5.2 -1.0 1.4 6.3 1.8 1.9 3.4Completions 2000 1,009 7,494 556,785 1,871 11,299 606,943 8,637 42,376 1,242,488Completions 2010 1,499 11,813 891,550 2,082 14,197 919,653 10,408 52,223 1,652,199Absolute Change 490 4,319 334,765 211 2,898 312,710 1,771 9,847 409,711Annual Growth Rate (Percent) 4.0 4.7 4.8 1.1 2.3 4.2 1.9 2.1 2.9
Tota
l
Priv
ate
Publ
ic
Total annual completions show the number of people who have earned a degree or Certificate in a given year. From 2000 to 2010, the number of people earning Certificates, Associate’s Degrees, and Bachelor’s Degrees granted by institutions in Pioneer Valley, Massachusetts, and the United States grew. However, the region trailed both state and national growth in the completions of all programs and degrees over the course of the decade. The strongest annual growth (4.0 percent) came from the number of students earning Certificates, with increases at both public and private in-stitutions. There were also increases in the numbers of students earning Bachelor’s Degrees at both public (2.0 percent) and private
(1.8 percent) institutions. The slowest growth was in the number of students completing Associate’s Degrees; that number increased by just 1.2 percent annually at public institutions and declined by 1.0 percent at private institutions between 2000 and 2010.
Source: National Center for Education Statistics, Integrated Post Secondary Education Data System.
Note: Degree completions are for those students who completed degrees at institutions within the defined geography. The students may not actually live in the region. Comple-tion totals are based on degrees completed in an academic year. For example, 2010 completions represent degrees completed in the 2009-2010 academic year.

50 Labor Market Trends in the Pioneer Valley Regionwww.bostonfed.org/neppc
EDUCATIONAL INSTITUTIONS AWARDING THE MOST DEGREES IN PIONEER VALLEY (2010)
Public institutions play a large role in postsecondary educational attainment in Pioneer Valley, although the share they account for varies by degree type. Holyoke and Springfield Technical Com-munity Colleges together accounted for more than one-quarter of the Certificates completed in 2010. However, nearly 60 percent of Certificates were awarded by the region’s private institutions, led by the Branford Hall Career Institute (35.4 percent). In compari-son, the region’s three community colleges—Holyoke, Springfield Technical, and Greenfield—accounted for nearly all of the Associ-ate’s Degrees completed in the region in 2010 (92.9 percent). The region’s two public colleges, University of Massachusetts–Amherst and Westfield State University, also accounted for a majority (57.0 percent) of Bachelor’s Degree completions in Pioneer Valley that year. However, the region’s private institutions also played a con-siderable role in granting Bachelor’s Degrees. Led by Springfield College (9.6 percent), the nine private institutions in Pioneer Val-ley accounted for 43.0 percent of Bachelor’s Degree completions in 2010.
Source: National Center for Education Statistics, Integrated Post Secondary Education Data System.
Note: See the on-line Data Appendix for a full list of degree completions by institution.
Institution TypePublic or
PrivateDegrees Awarded
Share of Degree Type
Completed in Region
Branford Hall Career Institute
< Two Years Private 530 35.4
Springfield Technical Community College
Two Year Public 204 13.6
Holyoke Community College Two Year Public 189 12.6Holyoke Community College Two Year Public 906 43.5Springfield Technical Community College
Two Year Public 780 37.5
Greenfield Community College Two Year Public 249 12.0
University of Massachusetts - Amherst
Four Year Public 4,851 46.6
Westfield State University Four Year Public 1,082 10.4Springfield College Four Year Private 999 9.6Ba
chel
or’s
Asso
ciat
e’s
C
ertifi
cate
s
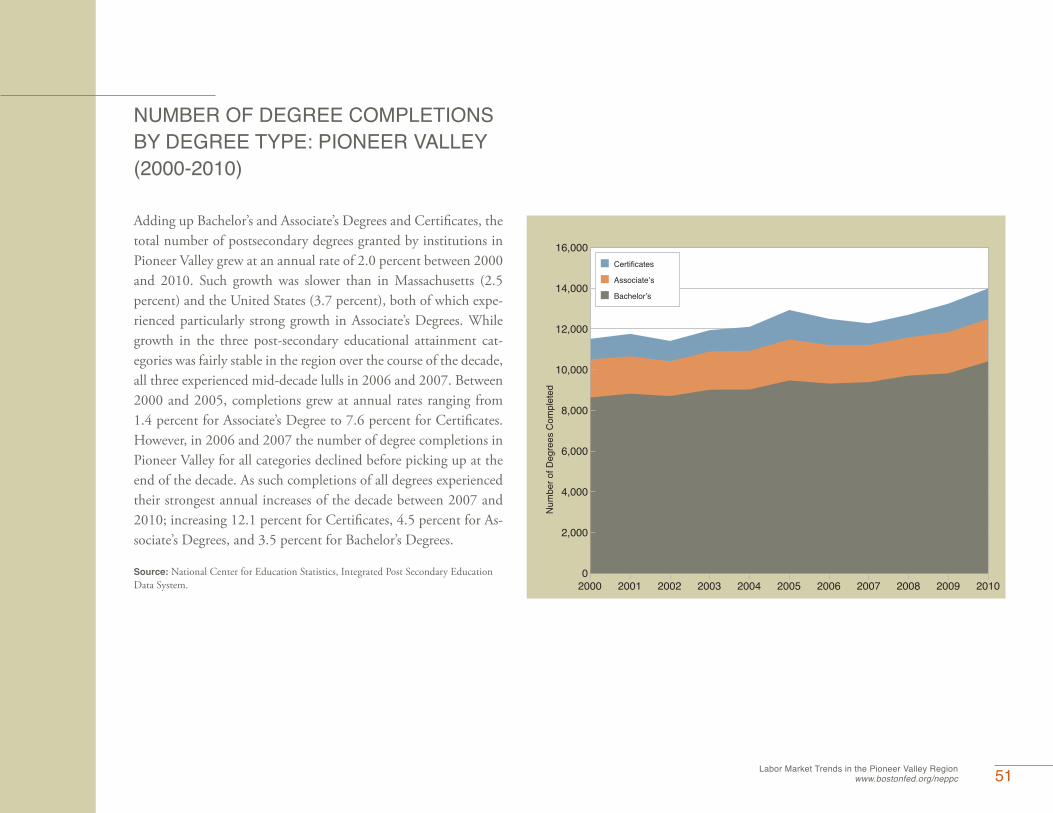
Labor Market Trends in the Pioneer Valley Region www.bostonfed.org/neppc 51
NUMBER OF DEGREE COMPLETIONS BY DEGREE TYPE: PIONEER VALLEY (2000-2010)
Adding up Bachelor’s and Associate’s Degrees and Certificates, the total number of postsecondary degrees granted by institutions in Pioneer Valley grew at an annual rate of 2.0 percent between 2000 and 2010. Such growth was slower than in Massachusetts (2.5 percent) and the United States (3.7 percent), both of which expe-rienced particularly strong growth in Associate’s Degrees. While growth in the three post-secondary educational attainment cat-egories was fairly stable in the region over the course of the decade, all three experienced mid-decade lulls in 2006 and 2007. Between 2000 and 2005, completions grew at annual rates ranging from 1.4 percent for Associate’s Degree to 7.6 percent for Certificates. However, in 2006 and 2007 the number of degree completions in Pioneer Valley for all categories declined before picking up at the end of the decade. As such completions of all degrees experienced their strongest annual increases of the decade between 2007 and 2010; increasing 12.1 percent for Certificates, 4.5 percent for As-sociate’s Degrees, and 3.5 percent for Bachelor’s Degrees.
Source: National Center for Education Statistics, Integrated Post Secondary Education Data System.
0
2,000
4,000
6,000
8,000
10,000
12,000
14,000
16,000
Num
ber o
f Deg
rees
Com
plet
ed
Certificates
Associate’s
Bachelor’s
2000 2001 2002 2003 2004 2005 2006 2007 2008 2009 2010

52 Labor Market Trends in the Pioneer Valley Regionwww.bostonfed.org/neppc
CERTIFICATES AWARDED BY MAJOR FIELD OF STUDY (2000-2010)
Pioneer Valley Massachusetts2000 2010 2000 2010
Major Field of StudyCertificates Completed
Major’s Share of Total
(Percent)Certificates Completed
Major’s Share of Total
(Percent)Certificates Completed
Major’s Share of Total
(Percent)Certificates Completed
Major’s Share of Total
(Percent)Health Sciences 346 34.3 578 38.6 2,080 27.8 5,638 47.7
Services 281 27.8 471 31.4 2,479 33.1 3,984 33.7Engineering & Computer Sciences 136 13.5 115 7.7 1,013 13.5 752 6.4Business 113 11.2 25 1.7 709 9.5 513 4.3Arts, Humanities, & Social Sciences 106 10.5 247 16.5 271 3.6 424 3.6
Legal 23 2.3 17 1.1 132 1.8 189 1.6
Education 4 0.4 1 0.1 129 1.7 87 0.7Science & Mathematics 0 0.0 23 1.5 248 3.3 80 0.7Other 0 0.0 22 1.5 81 1.1 146 1.2Total 1,009 100.0 1,499 100.0 7,494 100.0 11,813 100.0
In Pioneer Valley, the increase in the number of Certificates granted between 2000 and 2010 mostly came from the two larg-est fields of study: Health Sciences and Services. The number of Health Sciences Certificates increased by two-thirds, and this field’s share increased from 34.3 percent to 38.6 percent of all the region’s Certificates. But this increase trailed the numbers state-wide, where the number of Health Sciences Certificates more than doubled and accounted for almost 50 percent of Certificates in 2010. Services Certificates also increased by two-thirds in Pioneer Valley and accounted for 31.4 percent of the region’s Certificates in 2010. Services Certificates include a large range of specializa-tions, including Cosmetology, Law Enforcement, Construction Trades, Sports & Fitness Studies, Library Sciences, Social Work,
Appliance Installation & Repair, Welding Technology, and Con-struction Equipment Operations. The other major field of study to see a large increase in Certificate completions in Pioneer Valley was Arts, Humanities, & Social Sciences, with the number of pro-gram completions more than doubling between 2000 and 2010. As such, the Certificates in the field accounted for 16.5 percent of total Certificates completed in 2010, more than four times larger than their share statewide; this was due to a large number of de-grees in the Arts, such as Photography.
Source: National Center for Education Statistics, Integrated Post Secondary Education Data System.
Note: For major fields of study by degree type for the United States, see the on-line Data Appendix.
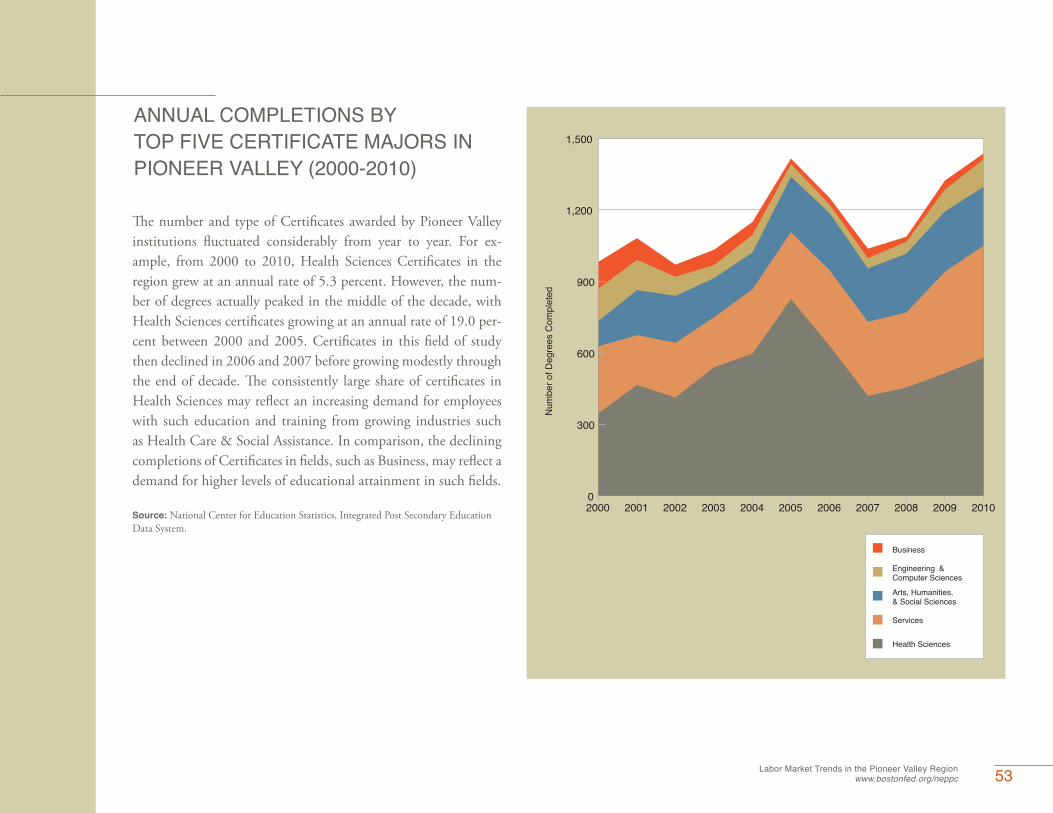
Labor Market Trends in the Pioneer Valley Region www.bostonfed.org/neppc 53
ANNUAL COMPLETIONS BY TOP FIVE CERTIFICATE MAJORS IN PIONEER VALLEY (2000-2010)
The number and type of Certificates awarded by Pioneer Valley institutions fluctuated considerably from year to year. For ex-ample, from 2000 to 2010, Health Sciences Certificates in the region grew at an annual rate of 5.3 percent. However, the num-ber of degrees actually peaked in the middle of the decade, with Health Sciences certificates growing at an annual rate of 19.0 per-cent between 2000 and 2005. Certificates in this field of study then declined in 2006 and 2007 before growing modestly through the end of decade. The consistently large share of certificates in Health Sciences may reflect an increasing demand for employees with such education and training from growing industries such as Health Care & Social Assistance. In comparison, the declining completions of Certificates in fields, such as Business, may reflect a demand for higher levels of educational attainment in such fields.
Source: National Center for Education Statistics, Integrated Post Secondary Education Data System.
0
300
600
900
1,200
1,500
Num
ber o
f Deg
rees
Com
plet
edBusiness
Engineering &Computer Sciences
Arts, Humanities,& Social Sciences
Services
Health Sciences
2000 2001 2002 2003 2004 2005 2006 2007 2008 2009 2010
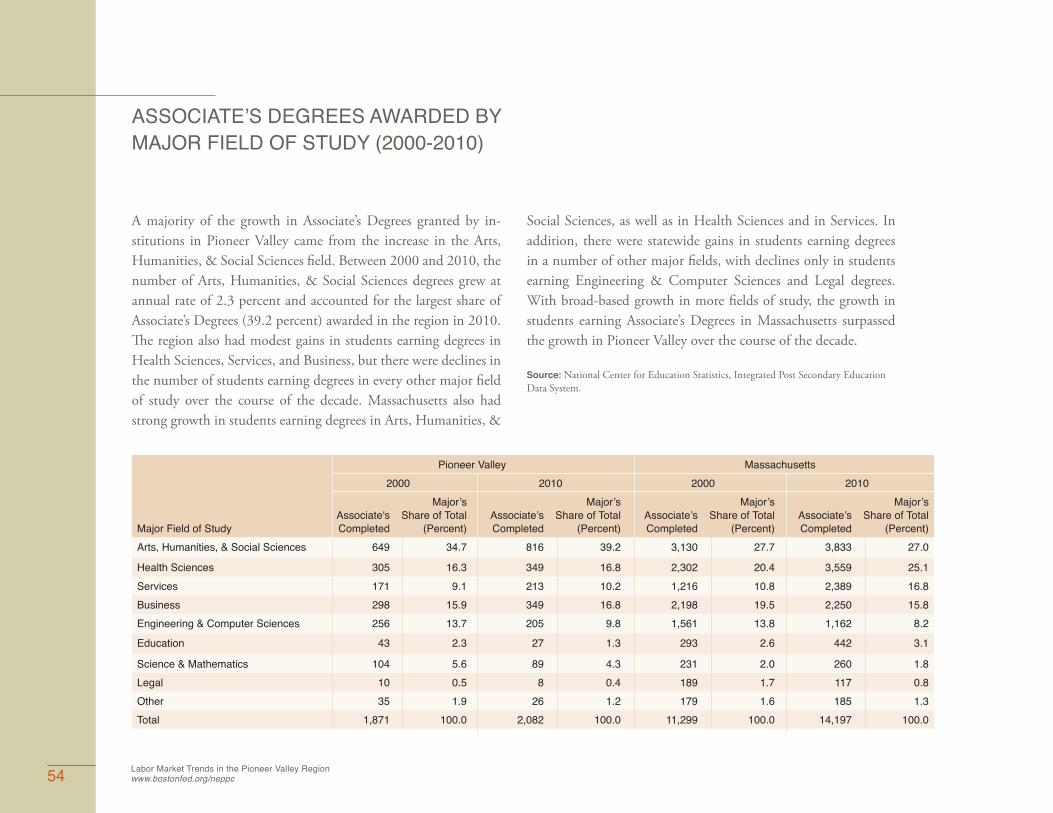
54 Labor Market Trends in the Pioneer Valley Regionwww.bostonfed.org/neppc
ASSOCIATE’S DEGREES AWARDED BY MAJOR FIELD OF STUDY (2000-2010)
Pioneer Valley Massachusetts 2000 2010 2000 2010
Major Field of StudyAssociate's Completed
Major’s Share of Total
(Percent)Associate’s Completed
Major’s Share of Total
(Percent)Associate’s Completed
Major’s Share of Total
(Percent)Associate’s Completed
Major’s Share of Total
(Percent)Arts, Humanities, & Social Sciences 649 34.7 816 39.2 3,130 27.7 3,833 27.0
Health Sciences 305 16.3 349 16.8 2,302 20.4 3,559 25.1Services 171 9.1 213 10.2 1,216 10.8 2,389 16.8Business 298 15.9 349 16.8 2,198 19.5 2,250 15.8Engineering & Computer Sciences 256 13.7 205 9.8 1,561 13.8 1,162 8.2
Education 43 2.3 27 1.3 293 2.6 442 3.1
Science & Mathematics 104 5.6 89 4.3 231 2.0 260 1.8Legal 10 0.5 8 0.4 189 1.7 117 0.8Other 35 1.9 26 1.2 179 1.6 185 1.3Total 1,871 100.0 2,082 100.0 11,299 100.0 14,197 100.0
A majority of the growth in Associate’s Degrees granted by in-stitutions in Pioneer Valley came from the increase in the Arts, Humanities, & Social Sciences field. Between 2000 and 2010, the number of Arts, Humanities, & Social Sciences degrees grew at annual rate of 2.3 percent and accounted for the largest share of Associate’s Degrees (39.2 percent) awarded in the region in 2010. The region also had modest gains in students earning degrees in Health Sciences, Services, and Business, but there were declines in the number of students earning degrees in every other major field of study over the course of the decade. Massachusetts also had strong growth in students earning degrees in Arts, Humanities, &
Social Sciences, as well as in Health Sciences and in Services. In addition, there were statewide gains in students earning degrees in a number of other major fields, with declines only in students earning Engineering & Computer Sciences and Legal degrees. With broad-based growth in more fields of study, the growth in students earning Associate’s Degrees in Massachusetts surpassed the growth in Pioneer Valley over the course of the decade.
Source: National Center for Education Statistics, Integrated Post Secondary Education Data System.
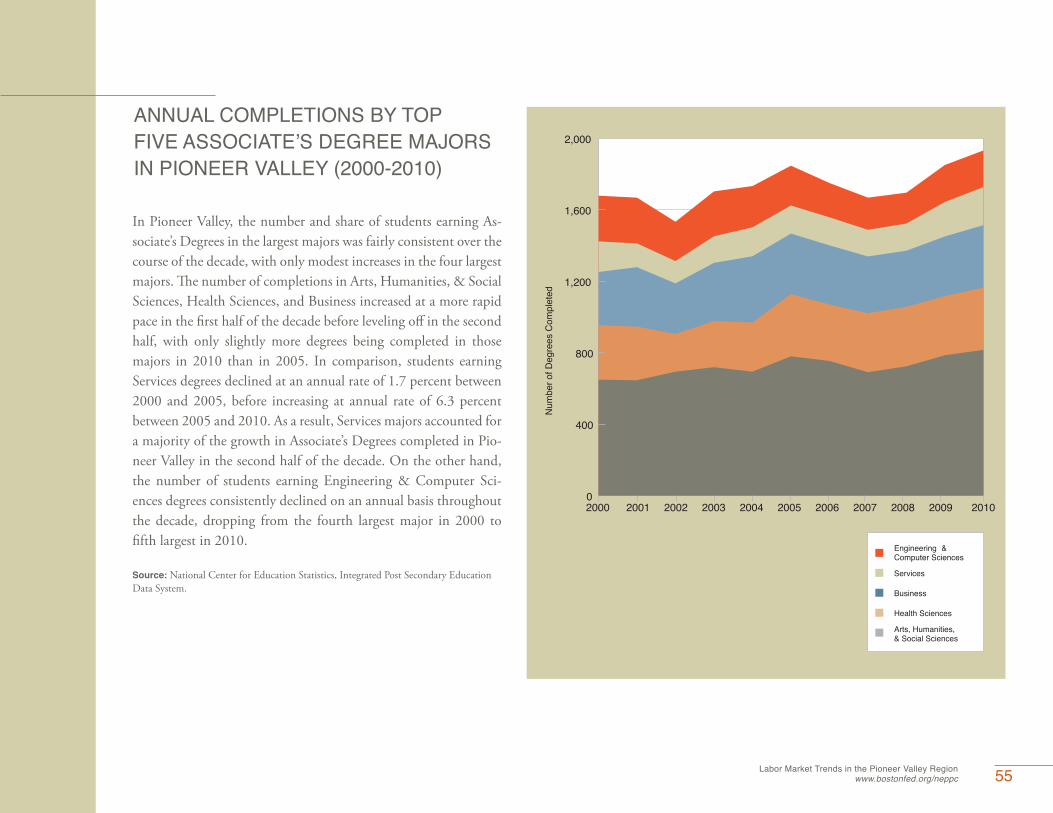
Labor Market Trends in the Pioneer Valley Region www.bostonfed.org/neppc 55
ANNUAL COMPLETIONS BY TOP FIVE ASSOCIATE’S DEGREE MAJORS IN PIONEER VALLEY (2000-2010)
In Pioneer Valley, the number and share of students earning As-sociate’s Degrees in the largest majors was fairly consistent over the course of the decade, with only modest increases in the four largest majors. The number of completions in Arts, Humanities, & Social Sciences, Health Sciences, and Business increased at a more rapid pace in the first half of the decade before leveling off in the second half, with only slightly more degrees being completed in those majors in 2010 than in 2005. In comparison, students earning Services degrees declined at an annual rate of 1.7 percent between 2000 and 2005, before increasing at annual rate of 6.3 percent between 2005 and 2010. As a result, Services majors accounted for a majority of the growth in Associate’s Degrees completed in Pio-neer Valley in the second half of the decade. On the other hand, the number of students earning Engineering & Computer Sci-ences degrees consistently declined on an annual basis throughout the decade, dropping from the fourth largest major in 2000 to fifth largest in 2010.
Source: National Center for Education Statistics, Integrated Post Secondary Education Data System.
0
400
800
1,200
1,600
2,000
Num
ber o
f Deg
rees
Com
plet
edEngineering &Computer Sciences
Services
Business
Health Sciences
Arts, Humanities,& Social Sciences
2000 2001 2002 2003 2004 2005 2006 2007 2008 2009 2010
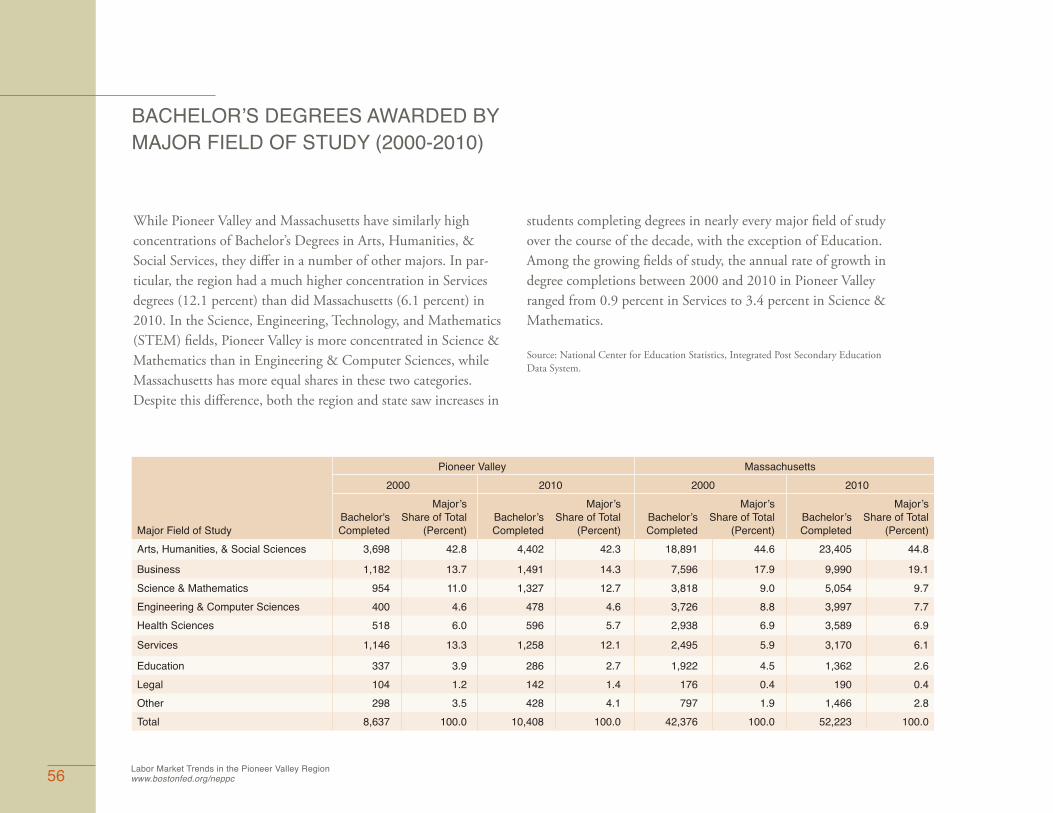
56 Labor Market Trends in the Pioneer Valley Regionwww.bostonfed.org/neppc
BACHELOR’S DEGREES AWARDED BY MAJOR FIELD OF STUDY (2000-2010)
Pioneer Valley Massachusetts 2000 2010 2000 2010
Major Field of StudyBachelor's Completed
Major’s Share of Total
(Percent)Bachelor’s Completed
Major’s Share of Total
(Percent)Bachelor’s Completed
Major’s Share of Total
(Percent)Bachelor’s Completed
Major’s Share of Total
(Percent)Arts, Humanities, & Social Sciences 3,698 42.8 4,402 42.3 18,891 44.6 23,405 44.8
Business 1,182 13.7 1,491 14.3 7,596 17.9 9,990 19.1Science & Mathematics 954 11.0 1,327 12.7 3,818 9.0 5,054 9.7Engineering & Computer Sciences 400 4.6 478 4.6 3,726 8.8 3,997 7.7Health Sciences 518 6.0 596 5.7 2,938 6.9 3,589 6.9
Services 1,146 13.3 1,258 12.1 2,495 5.9 3,170 6.1
Education 337 3.9 286 2.7 1,922 4.5 1,362 2.6Legal 104 1.2 142 1.4 176 0.4 190 0.4Other 298 3.5 428 4.1 797 1.9 1,466 2.8Total 8,637 100.0 10,408 100.0 42,376 100.0 52,223 100.0
While Pioneer Valley and Massachusetts have similarly high concentrations of Bachelor’s Degrees in Arts, Humanities, & Social Services, they differ in a number of other majors. In par-ticular, the region had a much higher concentration in Services degrees (12.1 percent) than did Massachusetts (6.1 percent) in 2010. In the Science, Engineering, Technology, and Mathematics (STEM) fields, Pioneer Valley is more concentrated in Science & Mathematics than in Engineering & Computer Sciences, while Massachusetts has more equal shares in these two categories. Despite this difference, both the region and state saw increases in
students completing degrees in nearly every major field of study over the course of the decade, with the exception of Education. Among the growing fields of study, the annual rate of growth in degree completions between 2000 and 2010 in Pioneer Valley ranged from 0.9 percent in Services to 3.4 percent in Science & Mathematics.
Source: National Center for Education Statistics, Integrated Post Secondary Education Data System.

Labor Market Trends in the Pioneer Valley Region www.bostonfed.org/neppc 57
ANNUAL COMPLETIONS BY TOP FIVE BACHELOR’S DEGREE MAJORS IN PIONEER VALLEY (2000-2010)
While the growth of Bachelor’s Degrees completions in Pioneer Valley has been fairly consistent over the past decade, growth in the region’s largest majors has varied over the years. The share of students completing Bachelor’s Degree in Arts, Humanities, & Social Sciences increased at a more rapid pace in the first half of the decade (3.5 percent annually) before leveling off in the second half, yielding only slightly more degrees completed in this field in 2010 than in 2005. The share of students earning Services de-grees grew between 2000 and 2005 (4.1 percent annually), but the number declined through the end of the decade (02.2 percent an-nually). Conversely, Health Sciences degree completions declined through the first half of the decade (-4.9 percent annually) but grew at a robust 8.1 percent annually between 2005 and 2010. The share of students earning Business and Science & Mathemat-ics degrees were virtually unchanged in the first half of the decade, but grew at robust annual rates of 5.7 percent and 6.5 percent, respectively, between 2005 and 2010.
Source: National Center for Education Statistics, Integrated Post Secondary Education Data System.
0
1,000
2,000
3,000
4,000
5,000
6,000
7,000
8,000
9,000
10,000
Num
ber o
f Deg
rees
Com
plet
edHealth Sciences
Services
Science &Mathematics
Business
Arts, Humanities,& Social Sciences
2000 2001 2002 2003 2004 2005 2006 2007 2008 2009 2010

58 Labor Market Trends in the Pioneer Valley Regionwww.bostonfed.org/neppc 58 Labor Market Trends in the Metro South/West Region www.bostonfed.org/neppc