Label-free compound characterization in drug … Toolbox...Label-free compound characterization in...
48
Label-free compound characterization in drug discovery and development Applications from validation of hits to selection and optimization of lead compounds
Transcript of Label-free compound characterization in drug … Toolbox...Label-free compound characterization in...
Label-free compound characterization in drug discovery and development
Applications from validation of hits to
selection and optimization of lead
compounds

2 / GE /
Which segments of the DD workflow?
Label-free compound characterization focused on applications in these two phases of the DD workflow
• What is most important during these stages?
CD2IN
Screen
to Hits
Hits to
Leads
Leads to
Optimiz . Leads
Leads to CD
selection
Primary
Screen
*L2CL2*LH2LS2HHTS
Investigational
new drug
Screen
to Hits
Hits to
Leads
Leads to
Optimiz . Leads
Leads to CD
selectionScreen
Investigational
new drug
INTERNAL USE SLIDE!!
affinity & kinetics
binding site data
early ADME data
kinetics
thermodynamics
selectivity

3 / GE /
Lead selection and optimization
”Hits to leads”: validated hits provide structural basis for selection of a small number of scaffolds (Impalcatura)
• Sub-libraries of related compounds generated from selected scaffolds (lead expansion)
• Can be difficult to distinguish between quality of multiple scaffolds
– requires detailed characterization of lead series (binding site info, affinity/kinetics, early
ADME)
“Leads to optimized leads”: extensive synthesis of hundreds of derivatives from lead scaffolds
• Aim to optimize target affinity/selectivity and ensure good PK properties
• Still a high failure rate of optimized leads in later development
– high quality characterization (kinetics, thermodynamics, selectivity) provides more
confident selection
INTERNAL USE SLIDE!!
4 / GE /
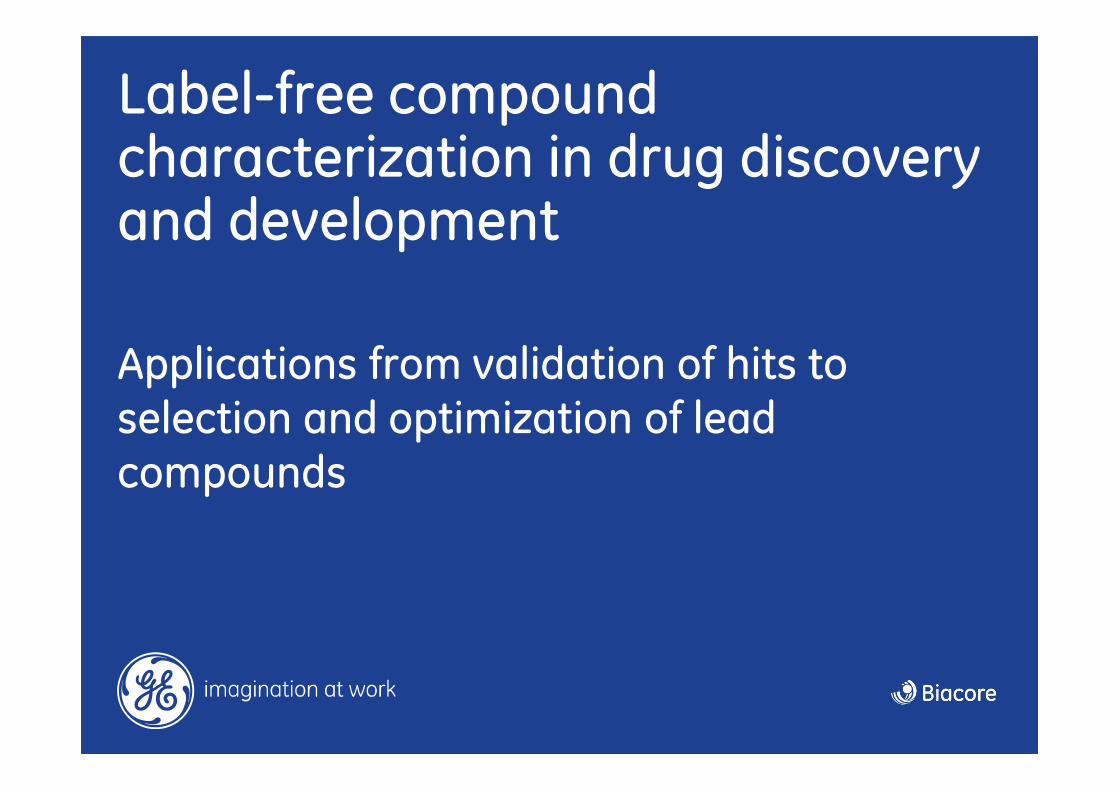
Recognized industry challenges
General problems for pharma industry
• Reduced productivity
• Increased costs
• Fewer new drugs to market
Challenges within lead selection area
• Current selection processes need to be improved
• Difficult to distinguish between quality of multiple scaffolds
5 / GE /
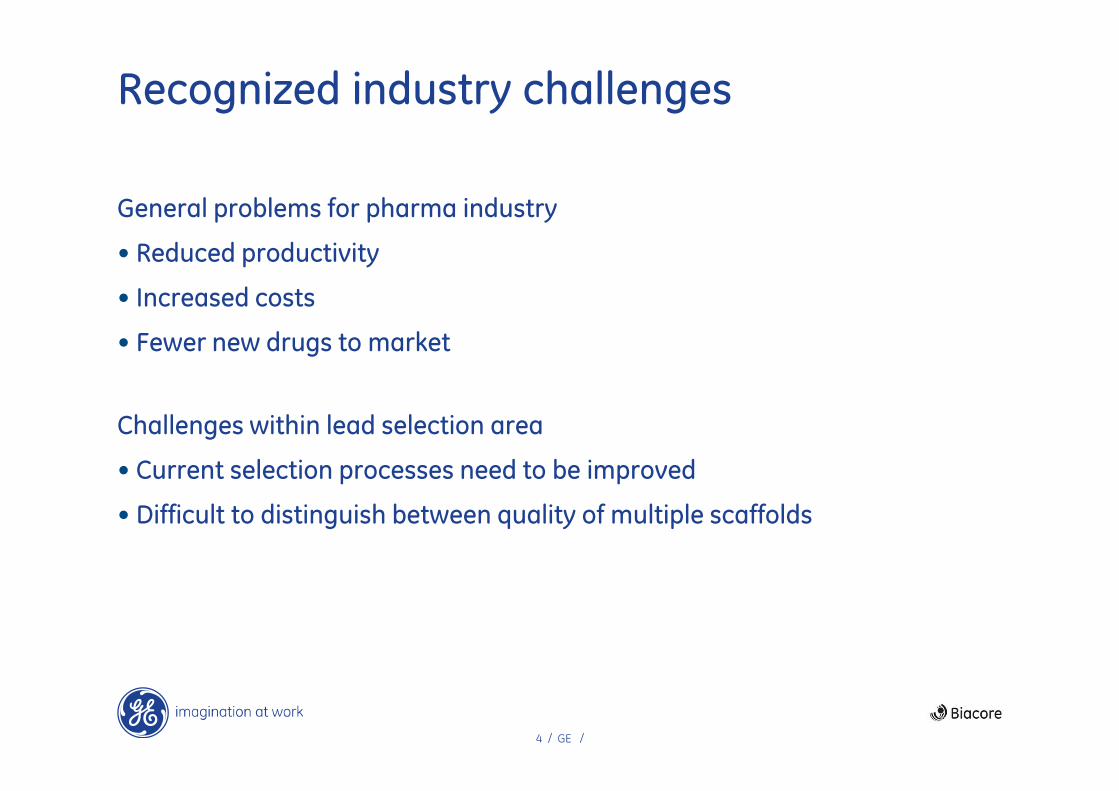
Label-free characterization of compound-target binding in lead selection/optimization
Increased productivity and reduced costs
• Comprehensive characterization of compounds during selection and optimization is vital to minimize downstream attrition of leads
More confident selection based on high information content data:
• Binding site information
• Kinetics and affinity
• Thermodynamics
• Binding selectivity
• Early in vitro ADME
efficacy/PD (Pharmacodynamics) issues
PK (Pharmacokinetics)/safety issues
Kinetic analysis of compound-target binding
7 / GE /
Kinetics in drug discovery and development
• Association (⇒ on-rate) and dissociation (⇒ off-rate ) are different processes that can be separately controlled
• Affinity depends on the ratio between on-rate and off-rate
– Steady-state data cannot discriminate between equal affinity compounds that may have
radically different binding characteristics
• Drug on- and off-rates may have different impacts on pharmacodynamics (PD) and pharmacokinetics (PK)
– Kinetic information can greatly faciltate selection and development of drug compounds
– Relevant for target binding in vivo (efficacy implications) and selectivity (safety implications)

8 / GE /
Equal affinity compounds with varying kinetics
• Example: 4 compounds:
– All 10 nM affinity – judged as ”equivalent” by equilibrium-based techniques
– On/off rates vary over 3 orders of magnitude – critical differences resolved by kinetics
kon koff
M-1s-1 s-1
106 10-2
105 10-3
104 10-4
103 10-5
Re
spo
nse
Time
Re
spo
nse
Time
Concentration = 100 nM Concentration = 1000 nM
*
**
*
– On-rate is concentration dependent: slow rates compensated by dose*
– Off-rate is concentration independent : compounds with fast off rates can
only be improved by chemical optimization
9 / GE /
Binding kinetics impact greatly on PK
2
0
100
4 6 8 h
% blocked target
0
Compound with rapid kinetics:- continuous supply needed to block target
- increasing concentration will not change profile much
- frequent adminstration of low doses required
Compound with slow kinetics:- will block a fraction of target sites long after injection
- increasing concentration will block a larger percentage of target sites for a long period
- infrequent adminstration of high doses required
This information is critical to therapeutic performance of drugs
Differences cannot be resolved using affinity alone!

10 / GE /
SAR/SKR/QSAR
• SAR = structure activity relationship
• Essential tool in lead optimization where chemists try to relate the ”activity” of compounds to their detailed structure
– activity usually assessed in terms of potency in an in vitro inhibition assay or cell-based
assay
INTERNAL USE SLIDE!!
• SAR analyses in Biacore terms usually means relating structural differences or modifications to target-binding kinetics
– sometimes referred to as ”structure-kinetic-relationships”, SKR
– high information content facilitates advanced analysis where mathematical descriptors
are applied to SAR data – potential for predictive modeling
= ”QSAR” (quantitative structure activity relationship)
11 / GE /
Kinetic characterization greatly facilitates SAR studies
SAR assessment based on equilibrium methods of potency may be impossible in some cases
• Dramatic structure-related changes in kinetics may cancel each other out at the affinity level (e.g. faster on but faster off)
Kinetics-based SAR enables focus on improvement of specific key binding properties
• For example, if off-rates are considered crucial for therapeutic performance, this can be focused on from the start
High resolution kinetic SAR data offers a powerful tool for selection of scaffolds and indentification of compounds for further development

12 / GE /
Kinetic analysis of compound-target binding
• Principle: monitor real-time binding curves over a range of compound concentrations
– Applicable to a wide range of target classes and over a broad kinetic range
-3
1
5
9
13
17
21
25
900 1100 1300 1500 1700 1900 2100
Time (s)
Res
po
nse
(R
U)
HIV protease
-2
-1
0
1
2
3
4
5
6
-100 -50 0 50 100 150 200
Fc=1 Spot=1-r corr
Estrogen receptor Albumin
• Curves from concentration series of each compound fitted to binding model
• Rate constants & affinity rapidly derived
– ka/kon : association (on) rate constant
– kd/koff : dissociation (off) rate constant
– KD : equilibrium dissociation constant (affinity)
13 / GE /
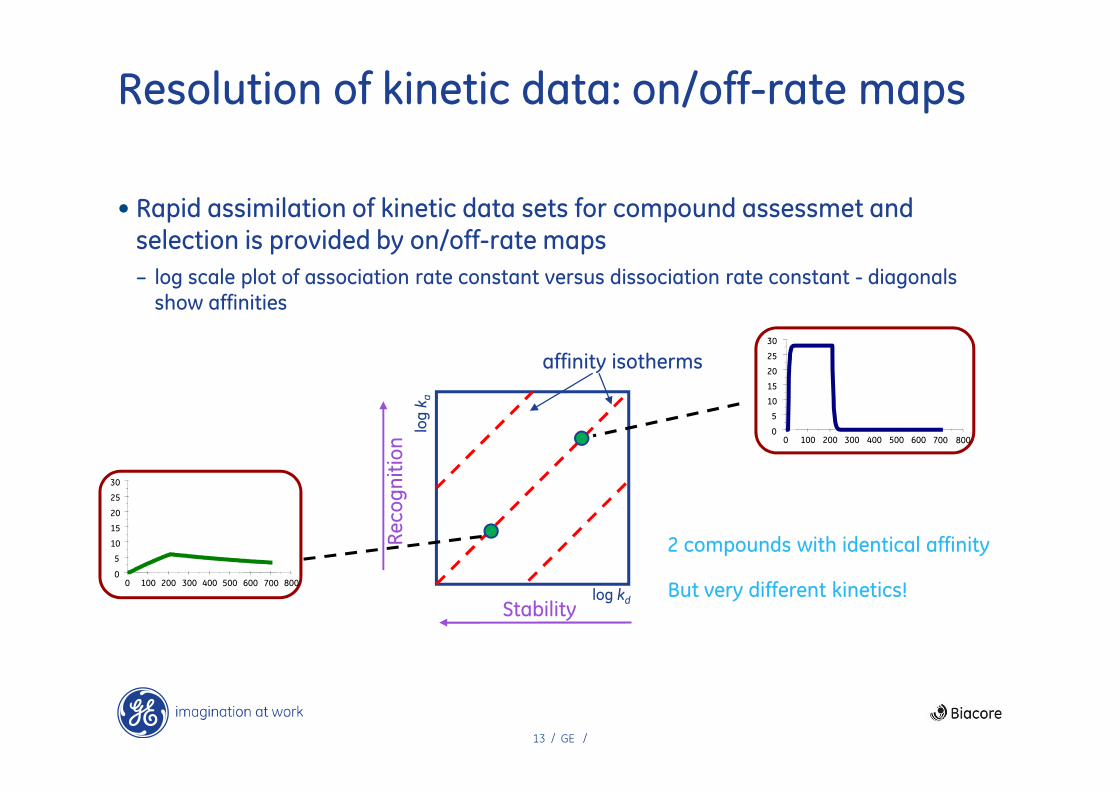
Resolution of kinetic data: on/off-rate maps
• Rapid assimilation of kinetic data sets for compound assessmet and selection is provided by on/off-rate maps
– log scale plot of association rate constant versus dissociation rate constant - diagonals
show affinities
Re
co
gn
itio
n
Stabilitylog kd
affinity isotherms
2 compounds with identical affinity
0
5
10
15
20
25
30
0 100 200 300 400 500 600 700 800
0
5
10
15
20
25
30
0 100 200 300 400 500 600 700 800But very different kinetics!

14 / GE /
Kinetic data facilitate better understanding of drug actions
The use of HIV-1 protease inhibitors in anti-HIV therapy is limited by rapid viral mutation leading to drug resistance
• How do mutations in the HIV protease affect drug action?
Shuman et al., Antiviral Research 58: 235-42 (2003)
Reduction in affinity (related to number of accumulated
target mutations) is driven by faster off-rates

15 / GE /
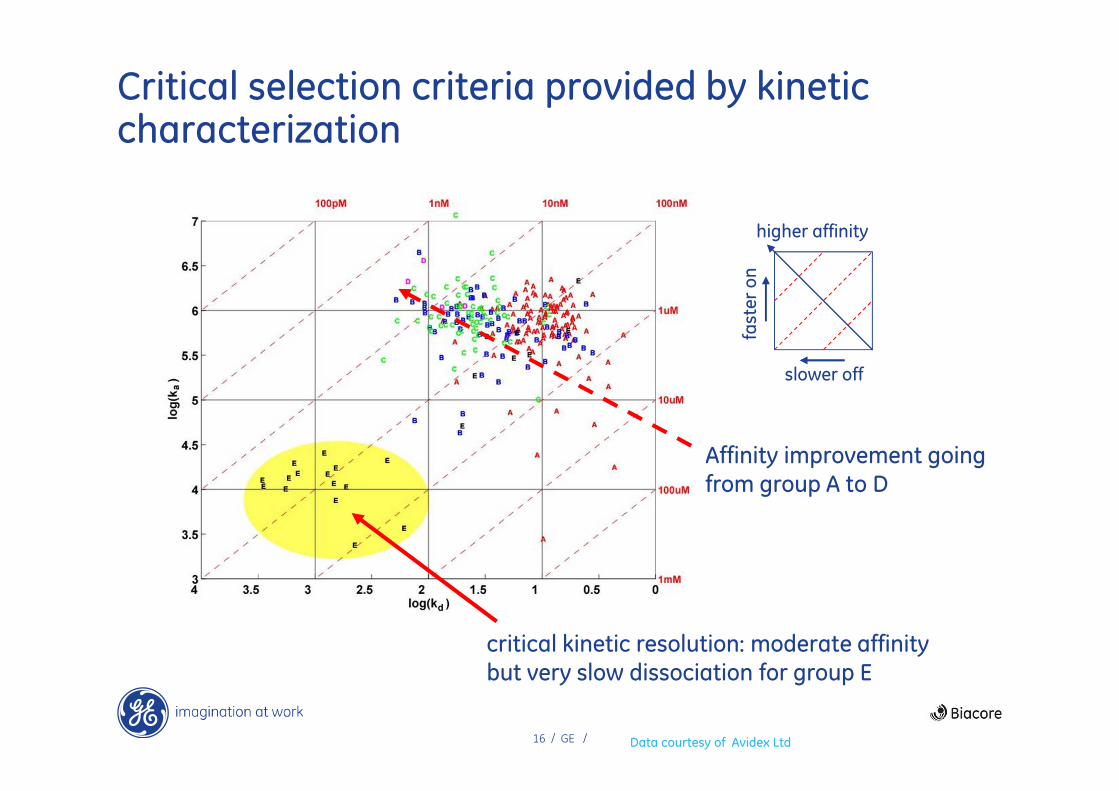
A critical role for kinetics in selection of a lead series for CD80 inhibitors
Avidex Ltd had 5 lead series of compounds in a rheumatoid arthritis project
• Inhibitors of CD80/CD28 signalling in T-cell activation (target = CD80)
• Label-free kinetic characterization of 259 compounds
• 5 structurally related lead series A-E
Data presented as an on/off plot for all compounds
• Excellent overview of lead series characteristics
• Enables identification of specific compounds of particular interest
Data courtesy of Avidex Ltd
16 / GE /
slower off
fast
er
on
higher affinity
Critical selection criteria provided by kinetic characterization
critical kinetic resolution: moderate affinity but very slow dissociation for group E
Data courtesy of Avidex Ltd
Affinity improvement going from group A to D

17 / GE /
Lead series with highly favored properties “rescued” by kinetic resolution
Lead series E showed no improvement over series A-D based on affinity for CD80
• Avidex would have discarded series E based on this assessment
Label-free kinetic characterization revealed very slow off-rates for series E compounds
• Highly valuable property for desired PD profile of drug
• Chemical optimization can be focused on improving on-rates
Series E was kept in the development process on basis of this off rate data
Data courtesy of Avidex Ltd

18 / GE /
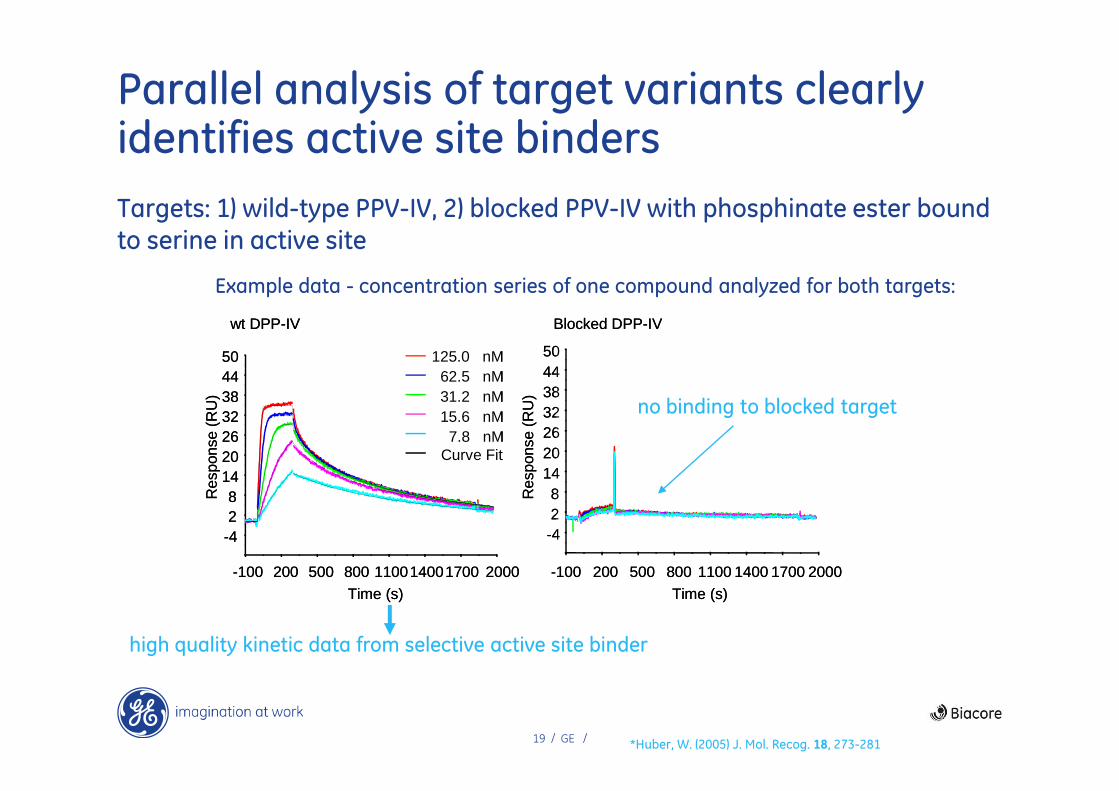
Binding selectivity and kinetics in validation of DPP-IV lead compound series
Study at Roche (Basel) to characterize DPP-IV inhibitor lead series during hit expansion process
• 160 compounds characterized by label-free analysis
*Huber, W. (2005) J. Mol. Recog. 18, 273-281
Binding site selectivity – wild type and blocked binding site DPP-IV targets assayed in parallel
• Blocking reaction carried out on immobilized protein within the instrument
High resolution kinetic analysis of active site binders
• To distinguish between lead scaffold properties and make selection decisions
19 / GE /
-428
14202632384450
-100 200 500 800 1100 1400 1700 2000
-428
14202632384450
-100 200 500 800 110014001700 2000
125.0 nM62.5 nM31.2 nM15.6 nM
7.8 nMCurve Fit
wt DPP-IV Blocked DPP-IV
Time (s) Time (s)
Res
pons
e (R
U)
Res
pons
e (R
U)
-428
14202632384450
-100 200 500 800 1100 1400 1700 2000
-428
14202632384450
-100 200 500 800 110014001700 2000
125.0 nM62.5 nM31.2 nM15.6 nM
7.8 nMCurve Fit
wt DPP-IV Blocked DPP-IV
Time (s) Time (s)
Res
pons
e (R
U)
Res
pons
e (R
U)
Example data - concentration series of one compound analyzed for both targets:
Parallel analysis of target variants clearly identifies active site binders
Targets: 1) wild-type PPV-IV, 2) blocked PPV-IV with phosphinate ester bound to serine in active site
no binding to blocked target
high quality kinetic data from selective active site binder
*Huber, W. (2005) J. Mol. Recog. 18, 273-281

20 / GE /
Kinetic analysis facilitates selection of lead series for PPV-IV
• Compounds cluster into three distinct regions on kinetic map
– correlate well with 3 structural classes
-4 -3.5 -3 -2.5 -2 -1.5 -1 -0.5 0-1
0
1
2
3
4
5
6
7
log(off-rate)
log
(on
-ra
te)
1 nM 10 nM 100 nM
1 µM
10 µM
1 mM
100 µM
KD
•
• Class II
• fast on/fast off
• potential for optimization by reducing off-rates
• Class I
• fast on/slow off
• best potential for drug candidates
• Class III
• very slow on/slow off
• excluded from project
Adapted from Huber, W. (2005) J. Mol. Recog. 18, 273-281

21 / GE /
Kinetics enables discrimination between compounds/scaffolds of similar affinity
Two compounds from mapping study exemplify resolving power of kinetic analysis
• Different structural scaffolds with
totally different binding properties
• Would be judged as ”equivalent”
using equibrium-based methods
-4 -3.5 -3 -2.5 -2 -1.5 -1 -0.50
-1
0
1
2
3
4
5
6
7
log(off-rate)
log
(on
-ra
te)
1 nM 10 nM 100 nM
1 µM
10 µM
1 mM
100 µM
KD
• Affinities ~2-fold difference
• Compound 2 has ~100-fold faster on & off rates
(KD 200 nM)
(KD 400 nM)
1
2
Adapted from Huber, W. (2005) J. Mol. Recog. 18, 273-281
22 / GE /
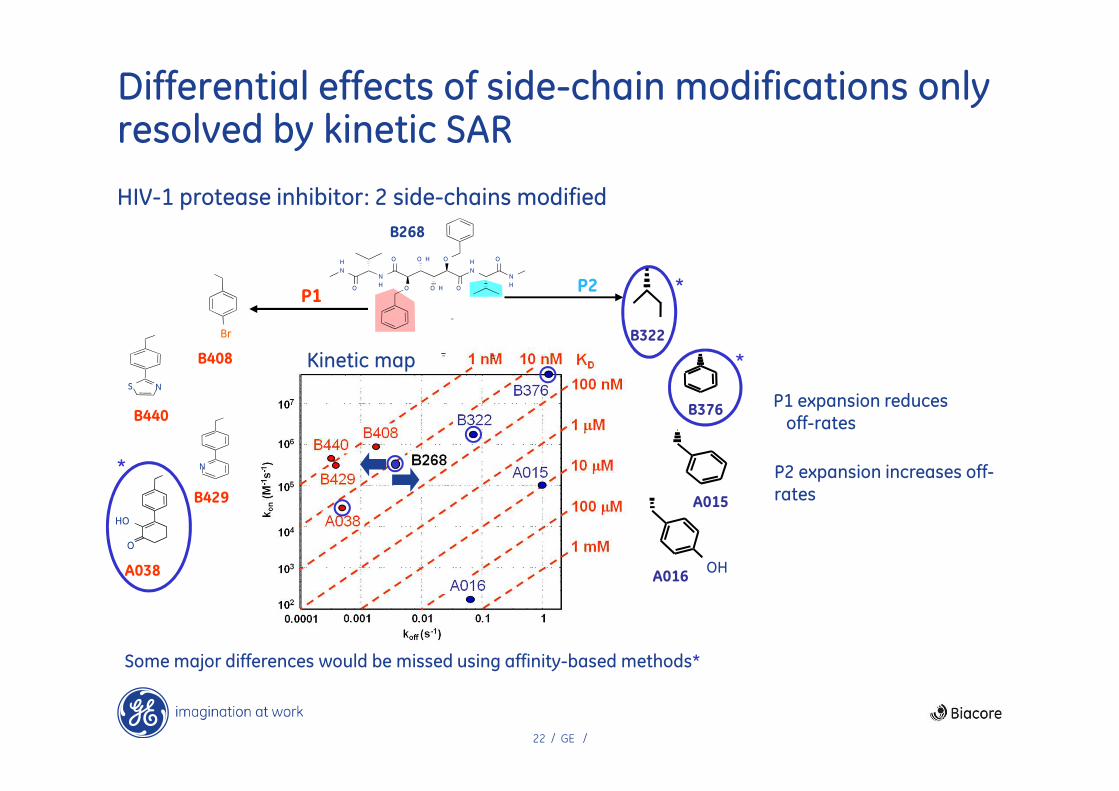
Differential effects of side-chain modifications only resolved by kinetic SAR
B408
OHA016
A015
B376
B322Br
S N
B440
A038
O
HO
N
B429
P1
H
NN
H
H
NN
HO
O O H
O HO
O
O
O
B268
P2
HIV-1 protease inhibitor: 2 side-chains modified
Kinetic map
P1 expansion reduces off-rates
P2 expansion increases off-rates
Some major differences would be missed using affinity-based methods*
*
*
*
23 / GE /
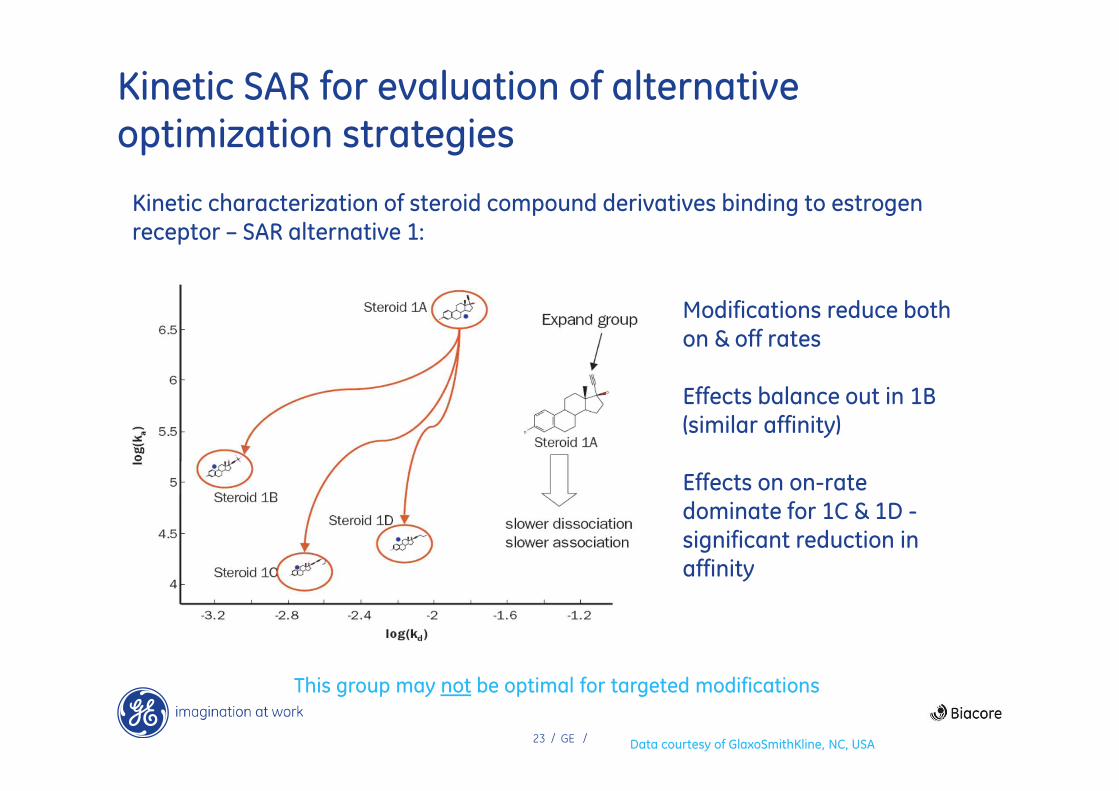
Kinetic SAR for evaluation of alternative optimization strategies
Kinetic characterization of steroid compound derivatives binding to estrogen receptor – SAR alternative 1:
This group may not be optimal for targeted modifications
Data courtesy of GlaxoSmithKline, NC, USA
Modifications reduce both on & off rates
Effects balance out in 1B (similar affinity)
Effects on on-rate dominate for 1C & 1D -significant reduction in affinity
24 / GE /
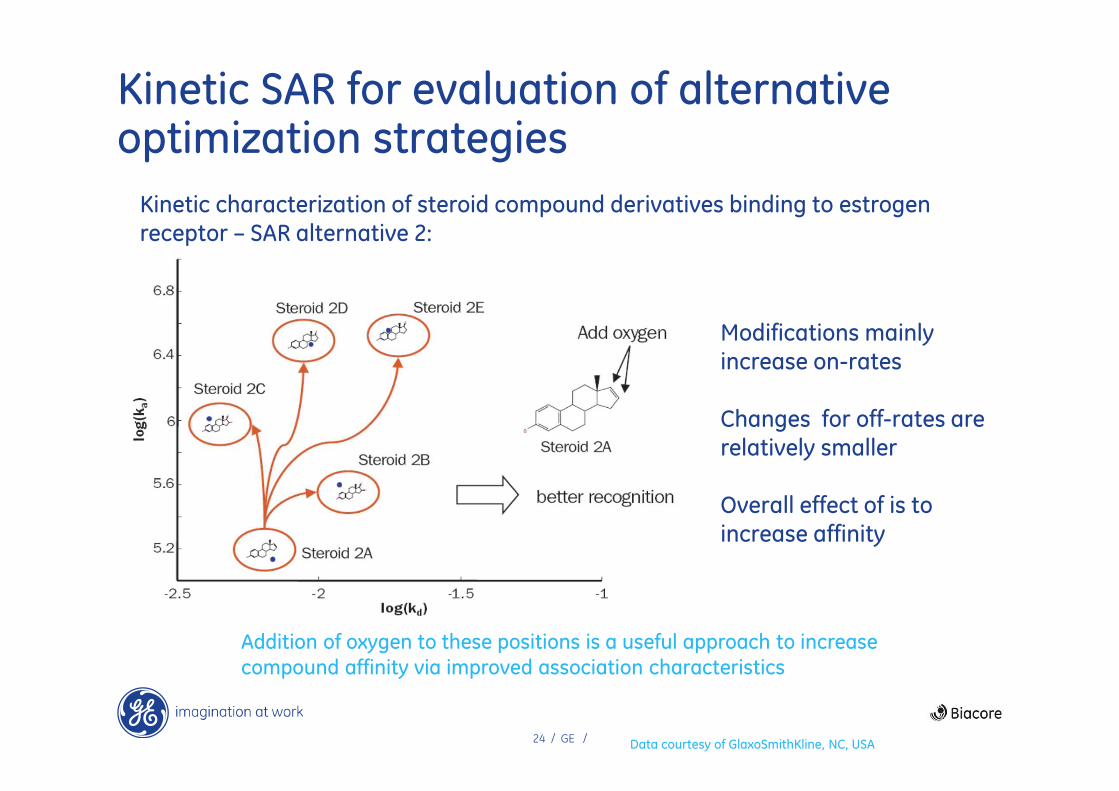
Kinetic SAR for evaluation of alternative optimization strategies
Kinetic characterization of steroid compound derivatives binding to estrogen receptor – SAR alternative 2:
Addition of oxygen to these positions is a useful approach to increase
compound affinity via improved association characteristics
Modifications mainly increase on-rates
Changes for off-rates are relatively smaller
Overall effect of is to increase affinity
Data courtesy of GlaxoSmithKline, NC, USA
25 / GE /
Label-free thermodynamic analysis in lead optimization
• Label-free characterization of compound-target interactions can also be extended to include thermodynamic analysis
– influence of temperature on binding kinetics
• Provides high resolution differentiation among lead compounds and insights into binding mechanims
• Biacore systems provide high quality thermodynamic data with much lower protein consumption that alternative methods
– e.g. compared to ITC

26 / GE /
Fre
e e
ne
rgy
(G
)
∆G(∝1/KD)
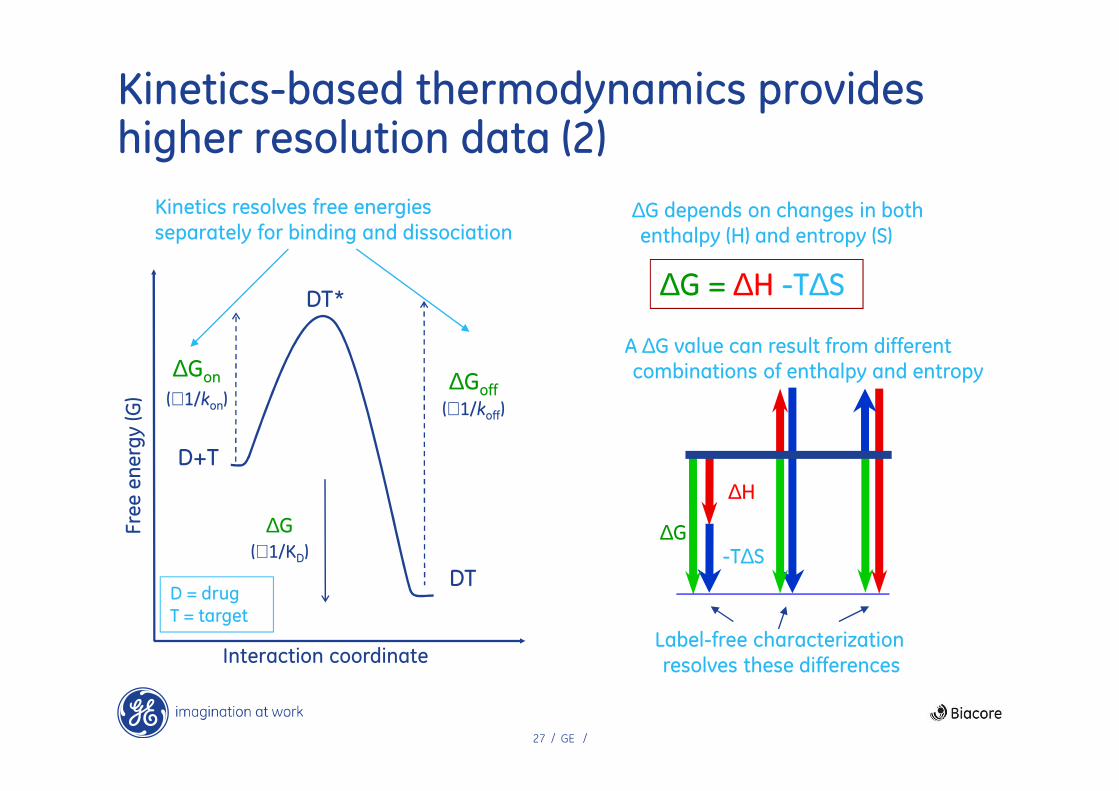
Kinetics-based thermodynamics provides higher resolution data (1)
∆Gon
(∝1/kon)∆Goff
(∝1/koff)
Kinetics resolves free energies
separately for binding and dissociation
Interaction coordinate
∆G = ∆H -T∆S
∆G depends on changes in both enthalpy (H) and entropy (S)
∆G
∆H
-T∆S
A ∆G value can result from different combinations of enthalpy and entropy
Label-free characterization
resolves these differences
27 / GE /
Fre
e e
ne
rgy
(G
)
∆G(∝1/KD)
Kinetics-based thermodynamics provides higher resolution data (2)
∆Gon
(∝1/kon)∆Goff
(∝1/koff)
Kinetics resolves free energies
separately for binding and dissociation
Interaction coordinate
∆G = ∆H -T∆S
∆G depends on changes in both enthalpy (H) and entropy (S)
∆G
∆H
-T∆S
A ∆G value can result from different combinations of enthalpy and entropy
Label-free characterization
resolves these differences
D+T
DT*
DTD = drugT = target
28 / GE /
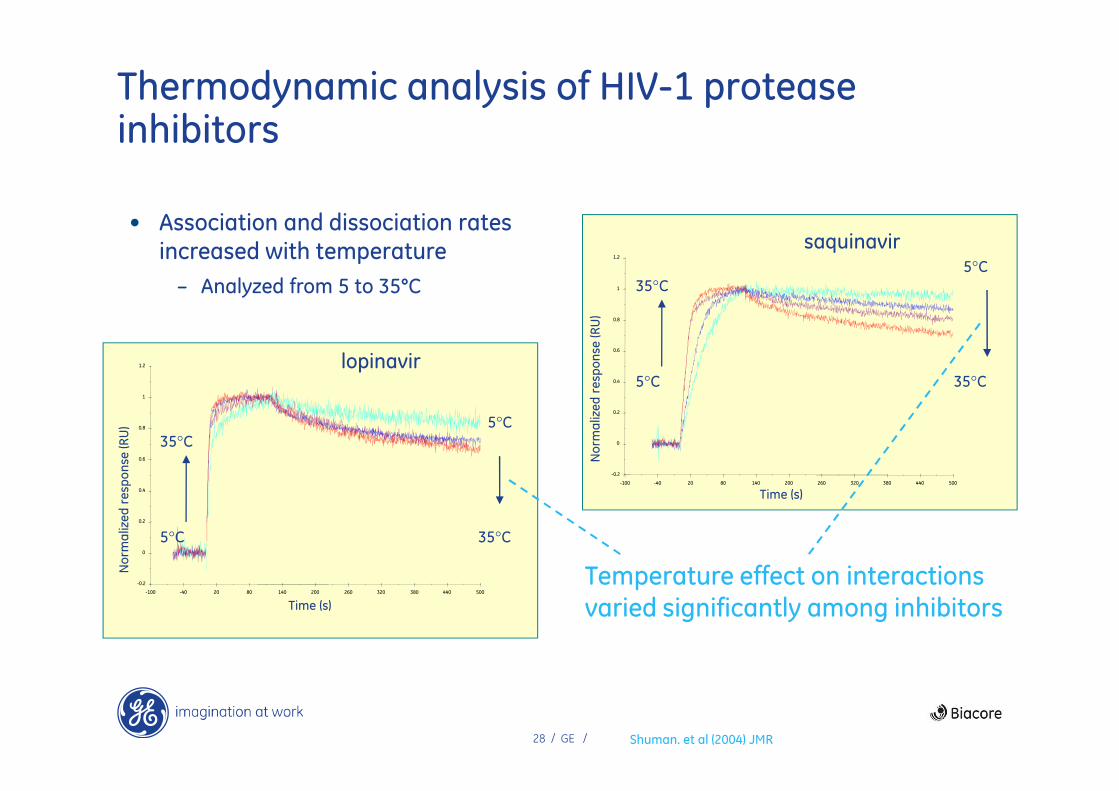
Thermodynamic analysis of HIV-1 protease inhibitors
-0.2
0
0.2
0.4
0.6
0.8
1
1.2
-100 -40 20 80 140 200 260 320 380 440 500
Time (s)
No
rma
lize
d r
esp
on
se (R
U)
saquinavir5°C
35°C5°C
35°C
-0.2
0
0.2
0.4
0.6
0.8
1
1.2
-100 -40 20 80 140 200 260 320 380 440 500
Time (s)
No
rma
lize
d r
esp
on
se (R
U)
lopinavir
Shuman. et al (2004) JMR
5°C
35°C5°C
35°C
• Association and dissociation rates increased with temperature
– Analyzed from 5 to 35°C
Temperature effect on interactions varied significantly among inhibitors

29 / GE /
Thermodynamics resolves inhibitor differences not seen using single temperature kinetics (1)
• Affinity increases with temp, i.eon-rates increase more than off-rate
• Lopinavir shows very small temp effect
• Amprenavir, ritonavir and indinavir show nonlinear temp effects
• Atanzanavir forms an extremely stable complex below 25oC
Shuman. et al (2004) JMR
2
2
1
1

30 / GE /
∆G = ∆H -T∆S
Thermodynamics resolves inhibitor differences not seen using single temperature kinetics (2)
Plots of ∆G and enthalpy/entropy characteristics for HIV protease inhibitors at equilibrium and during association:
Equilibrium ∆Gs very similar among different inhibitors
Lopinavir has a different ∆Gon: label-free kinetic characterization indentifies this unique binding property
Shuman. et al (2004) JMR

Binding site analysis

32 / GE /
Label-free analysis offers multiple approaches to binding site studies
In many screening approaches, analysis or confirmation of compound binding site in relation to target is important
Label-free compound characterization can be applied in a number of ways to address this issue:
• Use of site-directed mutations for parallel selectivity analysis
• Comparative binding to active/inactive forms of target
• Inhibition-type assays (e.g for allosteric site binders)
• Competitive kinetic analysis of inhibitor and natural substrates
33 / GE /
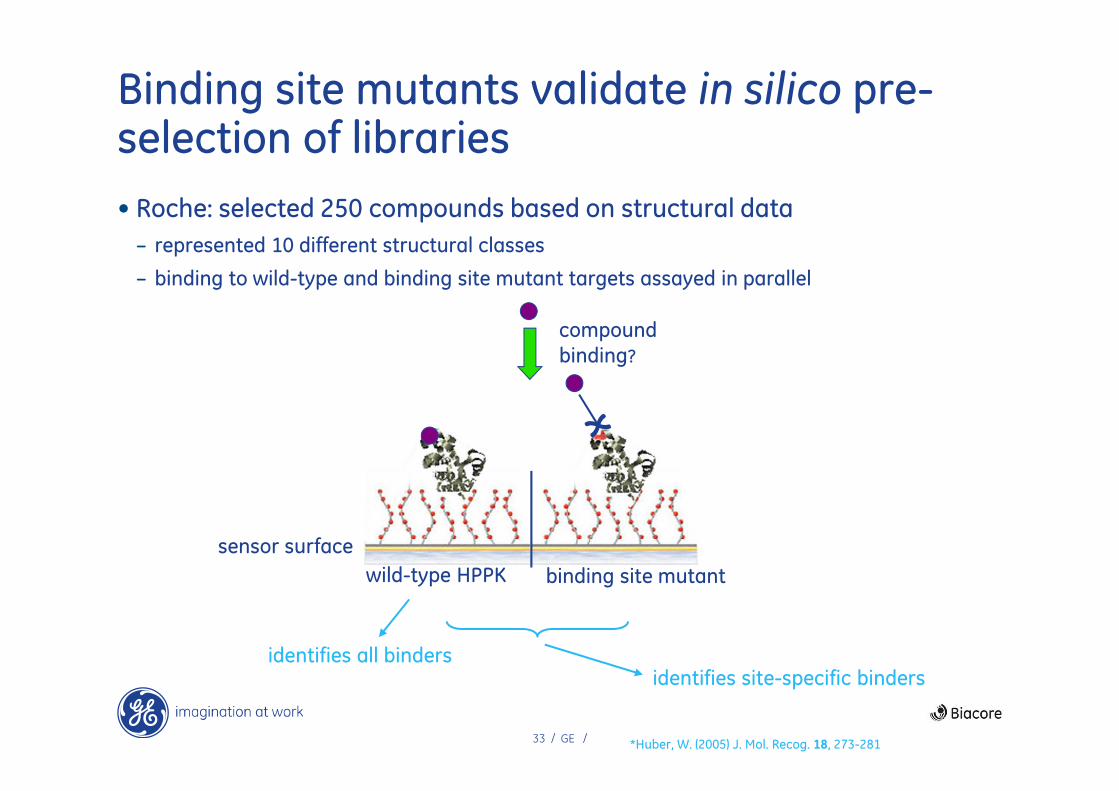
Binding site mutants validate in silico pre-selection of libraries
• Roche: selected 250 compounds based on structural data
– represented 10 different structural classes
– binding to wild-type and binding site mutant targets assayed in parallel
*Huber, W. (2005) J. Mol. Recog. 18, 273-281
sensor surface
wild-type HPPK binding site mutant
compound
binding?
identifies site-specific bindersidentifies all binders

34 / GE /
Parallel analysis of binding site mutant provides critical information for selection
Compound analysis based directly on binding site selectivity
5
25
45
65
Resp
on
se (R
U)
Compound
1 1514139 10 11 125 6 7 832 4 16
a)
Binding responses to both proteins
wild-typemutant
0
5
10
15
20
Compound
1 1514139 10 11 125 6 7 832 4 16
b)
Subtracted responses (wt-mutant)
• Highest responder (#5) revealed as worthless by binding site mutant
• Moderate responder (#14) revealed as best specific compound in set

35 / GE /
Binding selectivity to differentially phosphorylated kinase targets
Kinetic analysis of ATP and inhibitor binding to different forms of p38αactive p38α inactive p38α
inhibitor
(0.01-0.25 µM)• binds to both forms
• readily visible dissociation
ATP
(3-100 µM)
• specific for active form
• rapid ”square wave” kinetics
Label-free characterization shows key differences in both binding preferences and kinetics

36 / GE /
Label-free competition assays validate binding sites for hit compounds
• Do hit compounds really bind to the desired allosteric site in a specific target subunit, and not to a related site in another subunit?
– label-free competitive binding assay desiged to answer this question
Data courtesy of Hoffman La-Roche
immobilized HTPtest compound in solution
reference binder in solution
(saturation concentration)

37 / GE /
Distinguishing true allosteric site binders
Allosteric site binders Binders to other sites
Allosteric binders showed activity in cell assays
competitive binding: same site
responses < additive
non-competitive binding: different sites
responses are additive
180 & 203 bind allosteric site 165 does not bind allosteric site
Data courtesy of Hoffman La-Roche

38 / GE /
Kinetic profile-based competitive assays provide binding site information
An option when binders exhibit clearly distinct kinetics for the target
• Example – 4 inihibitors and ATP binding to a protein kinase target*
* all Schering AG proprietary compounds
focus on ATP and inihibitors A & B
- clearly distinct profiles
39 / GE /
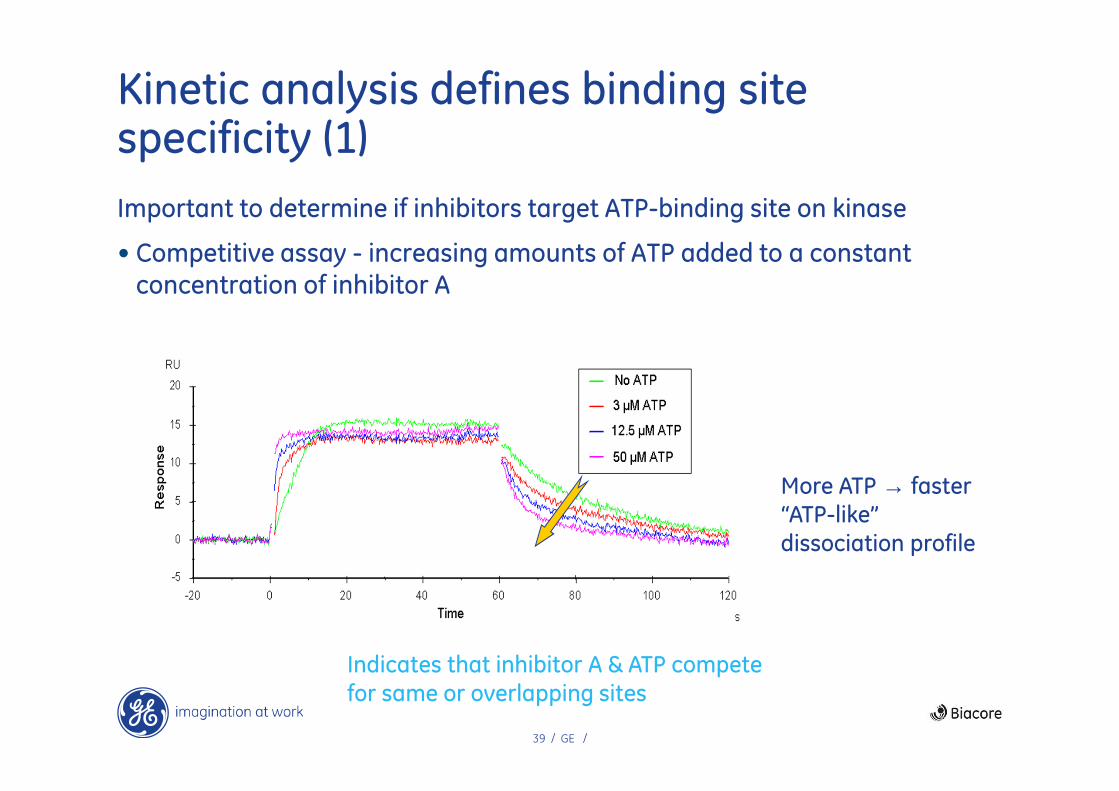
Kinetic analysis defines binding site specificity (1)
Important to determine if inhibitors target ATP-binding site on kinase
• Competitive assay - increasing amounts of ATP added to a constant concentration of inhibitor A
Indicates that inhibitor A & ATP compete for same or overlapping sites
More ATP → faster“ATP-like”dissociation profile

40 / GE /
Kinetic analysis defines binding site specificity (2)
Similar approach taken to see if inhibitors A & B had the same binding site on the kinase:
Indicate that inhibitors A & B (and therefore ATP) compete for same or overlapping sites
More B → faster“B-like”dissociation profile
ADME assays: (short version)
42 / GE /
Label-free characterization of early ADME properties
• Poor pharmacokinetic profiles remain a significant cause of compound failures during drug development
– Earlier assessment of ADME properties offers more efficient compound selection and optimization
• Label-free compound screening and characterization can readily accommodate ADME-related analyses:
• Binding to multiple plasma proteins
– Can measure ”problem” compounds with high affinity for plasma proteins
– Risk assessment of plasma binding properties in relation to target affinity
– Comparison of plasma proteins from different species – animal model issues
• Binding to liposomes of different compositions
– indications for Fraction absorbed (Fa)

43 / GE /
Binding to plasma proteins identifies potential risks for drug development
S6
Pyrimetamine
S7
S8
Quinine
S3 S5
S4 Warfarin
Naproxen
S1
S2
0
1
2
3
4
5
6
7
0 10 20 30 40 50 60
Response - HSA (100*RU/Da)
Resp
on
se –
AG
P (100*R
U/D
a)
Problems expected? - depends on affinity of
drug for target in relation to plasma proteins
Simultaneous analysis of compound binding to major human serum proteins, HSA and AGP
highest risk compound – unlikely
candidate for further development

44 / GE /
Liposome assays have predictive value for ADME properties
Fa ranking example using two types of liposome
2D plot of binding responses to 2 liposomes
Compounds with low, medium and high Fa values from literature cluster distinctly into corresponding areas of liposome plot
- set includes deviating compounds with known active transport mechanisms
Compounds with clear preference for one type of liposome

45 / GE /
-5
0
5
10
15
20
-60 -10 40 90 140
Kinetics: Fc=2 Spot=1-r corr
Res
po
nse
RU
Time s
K4
-2
0
2
4
6
8
10
12
14
16
-60 -10 40 90 140
Kinetics: Fc=2 Spot=1-r corr
Res
po
nse
RU
Time s
K9
-5
0
5
10
15
20
-60 -10 40 90 140
Kinetics: Fc=2 Spot=1-r corr
Res
po
nse
RU
Time s
K3
-2
0
2
4
6
8
10
12
-60 -10 40 90 140
Kinetics: Fc=1 Spot=1-r corr
Res
po
nse
RU
Time s
K5
-4
-2
0
2
4
6
8
10
12
-100 0 100 200 300 400 500
Kinetics: Fc=1 Spot=1-r corr
Res
po
nse
RU
Time s
K10
-20s
-50510152025
-20 0 20 40 60 80 100 120
RU
K2
-5
0
5
10
15
20
25
30
-20 0 20 40 60 80 100
Kinetics: Fc=1 Spot=1-r corr
Res
po
nse
RU
Time s
K7
-60 -10 40 90 140s
-5051015202530
-60 -10 40 90 140
RU
s
K11
K8
-5
0
5
10
15
20
25
30
-50 0 50 100 150 200 250 300
Kinetics: Fc=2 Spot=1-r corr
Res
pons
e
RU
Time s
K1
High plasma protein binding
Low liposome binding
Low plasma protein binding
-1
0
1
2
3
4
5
6
7
0 1e-6 2e-6 3e-6 4e-6 5e-6 6e-6 7e-6
Res
po
nse
RU
Conc M
Steady State: Fc=2 Spot=1-r corr
K6
K1, K7 & K8 show poor ADME properties
K2, K3, K10 & K11 show promising profiles
√√√√
√√√√
√√√√
√√√√
K4, K5, K6 & K9 dissociate rapidly
Combined target binding/ADME profilingReducing the risks of future PK failures for selected compounds
Kinase inhibitors: kinetic characterization of target binding combined with plasma protein and liposome binding data

46 / GE /
ADME assays - summary
Rapid, simple and reliable label-free measurement of ADME-related properties early during drug discovery
• plasma protein binding
• liposome binding
Real-time interaction analysis
• readily distinguish specific binding events
• discriminate among even high-affinity binders via dissociation signals

47 / GE /
ADME assays - summary
Multiple targets addressed simultaneously
• Higher information content for better decisions
Additional assay benefits
• Low compound consumptionThroughput tailored to specific application needs

48 / GE /
Summary: Label-free compound characterization for more efficient lead selection/optimization
Confident decision making based on high information content, real-time data:
• Binding selectivity
• Binding kinetics and affinity
• Binding site information
• Early in vitro ADME
Minimize downstream attrition of leads through better-informed selection based on high quality, information-rich data