
Lab6: Logistic Regression and Metrics
19
Lab6: Logistic Regression and Metrics Hao-Lun Sun & DataLab 2021.10.14
Transcript of Lab6: Logistic Regression and Metrics

Lab6: Logistic Regression and Metrics
Hao-Lun Sun & DataLab
2021.10.14

Outline
• Brief Review: Logistic Regression
- Maximum likelihood in Logistic Regression
- Implement
• Common Evaluation Metrics for Binary Classification
- Confusion Matrix
- Soft Classifiers – ROC Curve

Outline
• Brief Review: Logistic Regression
- Maximum likelihood in Logistic Regression
- Implement
• Common Evaluation Metrics for Binary Classification
- Confusion Matrix
- Soft Classifiers – ROC Curve

Maximum Likelihood
• Flipping coin: We have already known ground truth distribution. For
example, 𝑃 𝑥 = ℎ𝑒𝑎𝑑 =1
2and 𝑃 𝑥 = 𝑡𝑎𝑖𝑙 =
1
2.

Maximum Likelihood
• Flipping coin: We have already known ground truth distribution. For
example, 𝑃 𝑥 = ℎ𝑒𝑎𝑑 =1
2and 𝑃 𝑥 = 𝑡𝑎𝑖𝑙 =
1
2.
• However, in many tasks, the ground truth distributions are never known, e.g., probability distribution of getting COVID-19.
Maximum Likelihood
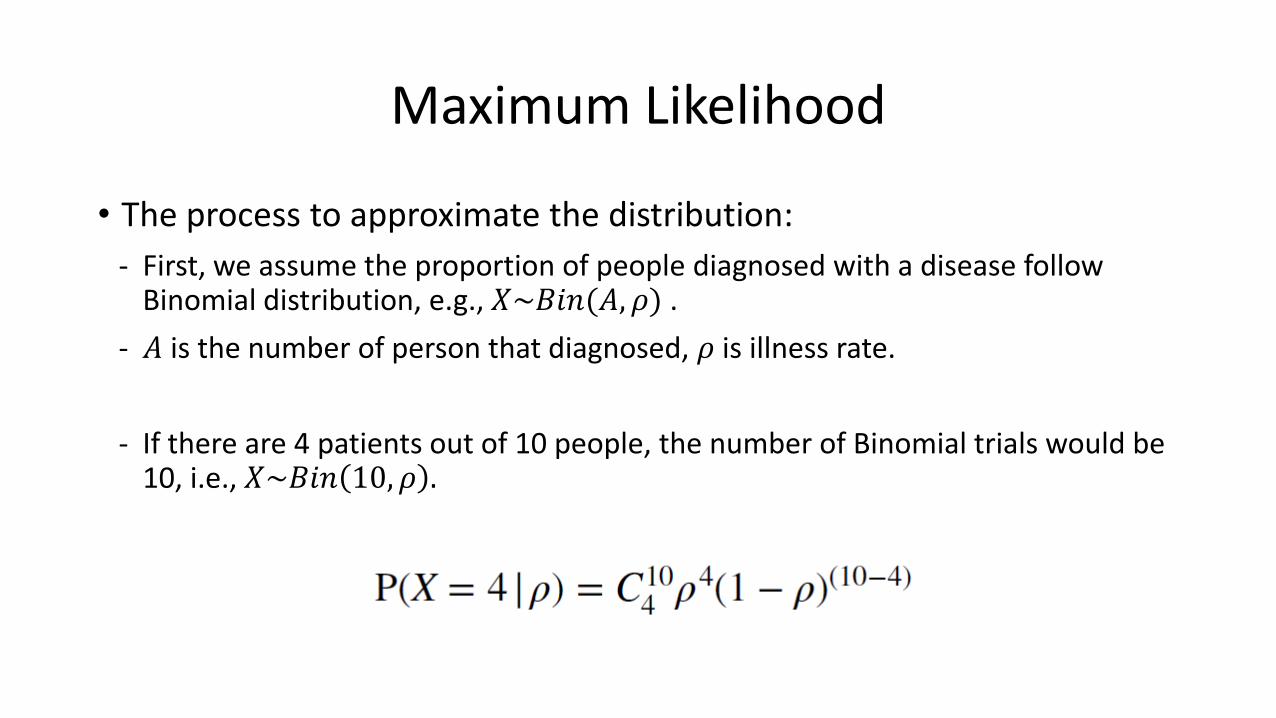
• The process to approximate the distribution:
- First, we assume the proportion of people diagnosed with a disease follow Binomial distribution, e.g., 𝑋~𝐵𝑖𝑛(𝐴, 𝜌) .
- 𝐴 is the number of person that diagnosed, 𝜌 is illness rate.
- If there are 4 patients out of 10 people, the number of Binomial trials would be 10, i.e., 𝑋~𝐵𝑖𝑛 10, 𝜌 .
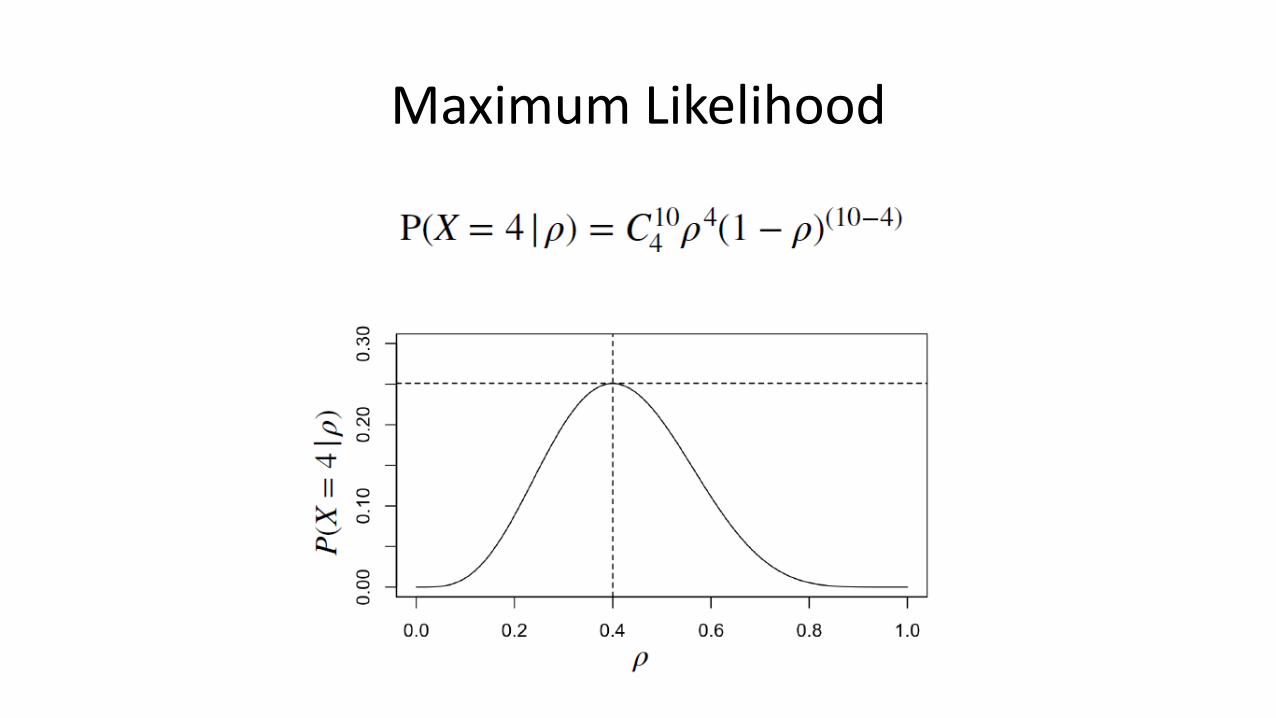
Maximum Likelihood

Outline
• Brief Review: Logistic Regression
- Maximum likelihood in Logistic Regression
- Implement
• Common Evaluation Metrics for Binary Classification
- Confusion Matrix
- Soft Classifiers – ROC Curve
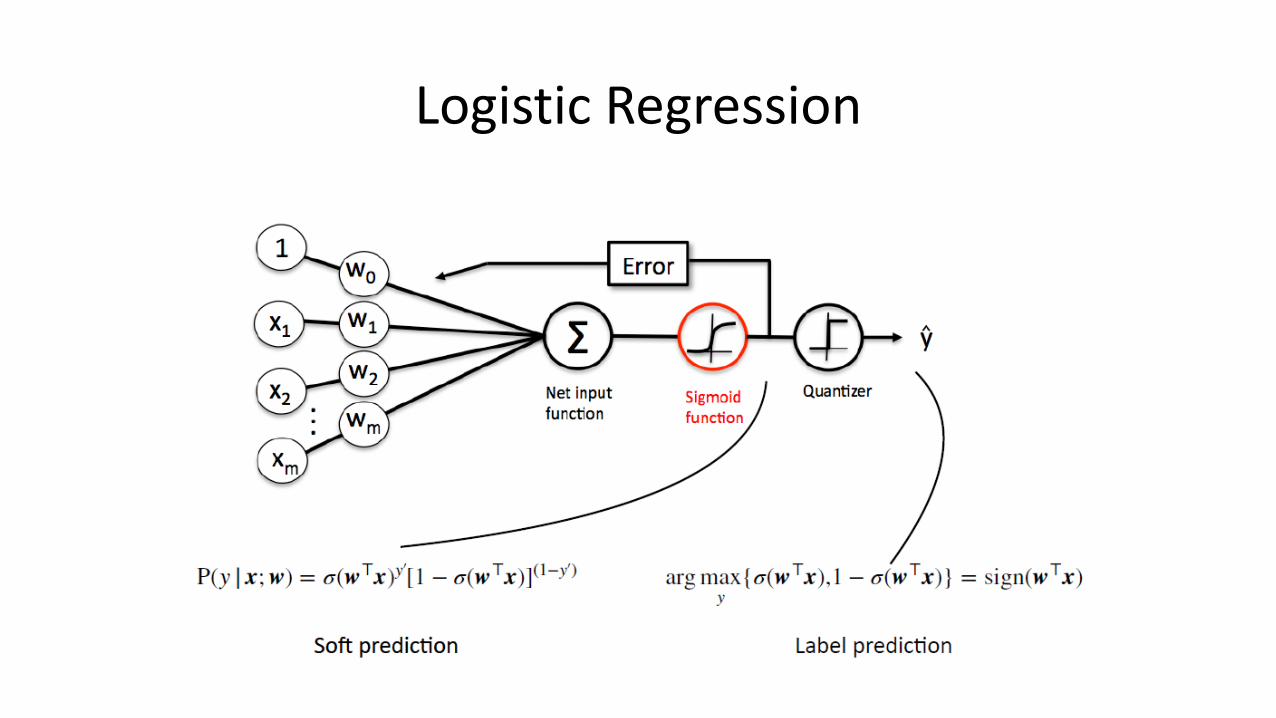
Logistic Regression
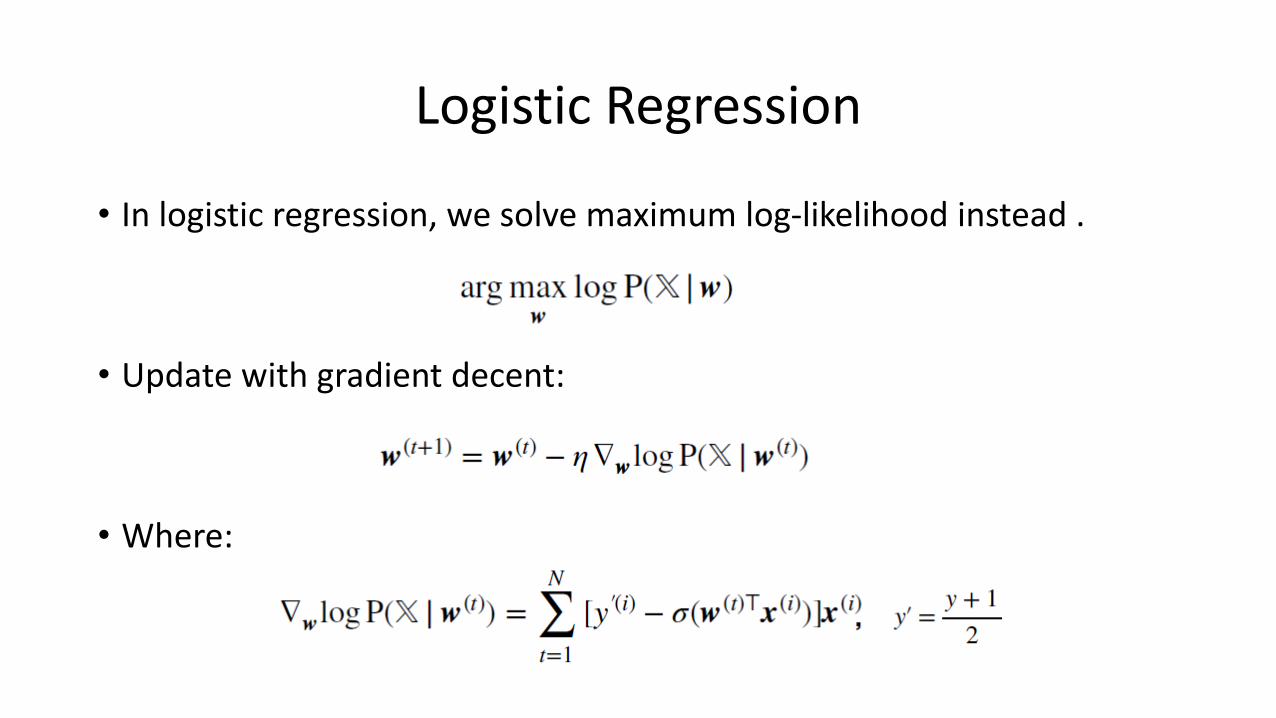
• In logistic regression, we solve maximum log-likelihood instead .
• Update with gradient decent:
• Where:
Logistic Regression

Outline
• Brief Review: Logistic Regression
- Maximum likelihood in Logistic Regression
- Implement
• Common Evaluation Metrics for Binary Classification
- Confusion Matrix
- Soft Classifiers – ROC Curve

Confusion Matrix
• It is important to know how the model make wrong prediction.
• In binary classification, confusion matrix is a common tool to analyze the predictions.

Confusion Matrix
• It is important to know how the model make wrong prediction.
• In binary classification, confusion matrix is a common tool to analyze the predictions.
• Other metrics we can use:

Outline
• Brief Review: Logistic Regression
- Maximum likelihood in Logistic Regression
- Implement
• Common Evaluation Metrics for Binary Classification
- Confusion Matrix
- Soft Classifiers – ROC Curve

ROC Curve
• ROC curve analyze the performance for every threshold in soft classifiers.
• In X-axis: FPR
• In Y-axis: TPR

ROC Curve
By cmglee, MartinThoma - Roc-draft-xkcd-style.svg, CC BY-SA 4.0, https://commons.wikimedia.org/w/index.php?curid=109730045
• ROC curve analyze the performance for every threshold in soft classifiers.
• In X-axis: FPR
• In Y-axis: TPR

ROC Curve
• AUC - Area Under the ROC Curve.
- ROC can be quantified using AUC.
https://developers.google.com/machine-learning/crash-course/classification/roc-and-auchttps://medium.com/acing-ai/what-is-auc-446a71810df9
Random guess
Homework
• Homework: Lab06
- Lab06: Logistic Regression, Metrics
• Bonus: Lab07 && Lab08
- Lab07: Support Vector Machine, k-Nearest Neighbors
- Lab08: Cross Validation, Ensemble

Reference
• https://bookdown.org/ccwang/medical_statistics6/section-43.html
• https://bookdown.org/ccwang/medical_statistics6/bernoulli.html
• https://bookdown.org/ccwang/medical_statistics6/binomial.html
• https://bookdown.org/ccwang/medical_statistics6/likelihood-definition.html
• https://en.wikipedia.org/wiki/Sensitivity_and_specificity
• https://commons.wikimedia.org/w/index.php?curid=109730045
• https://developers.google.com/machine-learning/crash-course/classification/roc-and-auc
• https://medium.com/acing-ai/what-is-auc-446a71810df9
• https://github.com/dariyasydykova/open_projects/tree/master/ROC_animation


