Lab on a Chip - Stanford Microfluidics Laboratorymicrofluidics.stanford.edu/Publications/ITP/Crystal...
10
Lab on a Chip PAPER Cite this: DOI: 10.1039/c4lc00374h Received 26th March 2014, Accepted 20th May 2014 DOI: 10.1039/c4lc00374h www.rsc.org/loc Increasing hybridization rate and sensitivity of DNA microarrays using isotachophoresis† Crystal M. Han, a Evaldas Katilius b and Juan G. Santiago* a We present an on-chip electrokinetic method to increase the reaction kinetics and sensitivity of DNA microarray hybridization. We use isotachophoresis (ITP) to preconcentrate target molecules in solution and transport them over the immobilized probe sites of a microarray, greatly increasing the binding reaction rate. We show theoretically and experimentally that ITP-enhanced microarrays can be hybridized much faster and with higher sensitivity than conventional methods. We demonstrate our assay using a microfluidic system consisting of a PDMS microchannel superstructure bonded onto a glass slide on which 60 spots of 20–27 nt ssDNA oligonucleotide probes are immobilized. Our 30 min assay results in an 8.2 fold higher signal than the conventional overnight hybridization at 100 fM target concentration. We show rapid and quantitative detection over 4 orders of magnitude dynamic range of target concen- tration with no increase in the nonspecific signal. Our technique can be further multiplexed for higher density microarrays and extended for other reactions of target-surface immobilized ligands. 1. Introduction The DNA microarray is now a mature technology that enables investigation of several millions of probe sequences in parallel. 1 Its high-throughput capability and sensitivity have been lever- aged in a wide range of applications including gene expression analysis, 2–4 diagnosis of diseases, 5–7 single nucleotide polymor- phisms (SNPs), 8,9 and aptamer-based analysis of protein bio- markers. 10,11 DNA arrays use hybridization between targets suspended in a bulk sample solution and probes immobilized on a solid substrate. Despite its proven success, application of DNA arrays to rapid screening of samples remains a chal- lenge. 12 In conventional microarray assays, the hybridization step alone typically requires overnight (15–24 h) incubation to yield a measurable signal from a wide range of target concen- trations. 13,14 This constraint has impeded the application of microarrays to point-of-care applications where short sample- to-answer turnaround time is desirable. Reduction in hybridi- zation time is also favorable because extended incubation times are associated with solution-dependent cleavage of the linkage chemistry between the probe and the solid support, negatively affecting the reproducibility and sensitivity. 15 There are two main challenges in speeding up hybridiza- tion processes: overcoming the slow diffusion-limited target transport and the slow reaction rates associated with low target concentrations. 16 The vast majority of work toward speeding up DNA array hybridization has involved addressing the first of these limitations with active pumping and/or mixing of liquid solution containing the target molecules. 17 Successful microarray hybridization speed-up has been demon- strated using a wide variety of approaches. These include syringe pump-driven mixing, 18 microfluidic integrated peristal- tic pump mixing, 19 mixing using 7 mm scale magnetic stirring bars, 20 pumping and mixing discrete sample plugs through serpentine microchannels, 21 acoustic microstreaming, 22 pumping with displacement micropumps, 23 centrifugal liquid pumping, 24–26 pneumatically driven mixing, 27,28 and electro- kinetic sample dispensing and washing. 29 The aforementioned methods of active pumping and vig- orous mixing can increase the hybridization rate as they prevent hybridization from being diffusion limited by driving the fresh sample at its original concentration toward ligands on the surface. However, these approaches do not address the challenge of slow 2nd order reactions whose reaction rate is dictated by the kinetic parameters and trace concentration of targets. Kinetically limited reactions between suspended DNA and surface-bound cDNA can take hours to reach equilibrium due to the inherent dynamics of bulk-to-surface reactions (even assuming the perfect mixing). 30,31 Kinetically limited hybridization is therefore not addressed by pumping or mixing but rather by preconcentration of target species or methods of increasing kinetic parameters themselves (e.g., by varying tem- perature). An example of preconcentration-driven microarray enhancement is the work of Edman et al., 32 who reported a 30-fold increased hybridization rate by electrophoretically Lab Chip This journal is © The Royal Society of Chemistry 2014 a Department of Mechanical Engineering, Stanford University, CA 94305, USA b SomaLogic Inc., CO 80301, USA. E-mail: [email protected] † Electronic supplementary information (ESI) available. See DOI: 10.1039/ c4lc00374h Published on 20 May 2014. Downloaded by Stanford University on 08/07/2014 04:12:04. View Article Online View Journal
Transcript of Lab on a Chip - Stanford Microfluidics Laboratorymicrofluidics.stanford.edu/Publications/ITP/Crystal...

Lab on a Chip
Publ
ishe
d on
20
May
201
4. D
ownl
oade
d by
Sta
nfor
d U
nive
rsity
on
08/0
7/20
14 0
4:12
:04.
PAPER View Article OnlineView Journal
This journal is © The Royal Society of Chemistry 2014
aDepartment of Mechanical Engineering, Stanford University, CA 94305, USAb SomaLogic Inc., CO 80301, USA. E-mail: [email protected]
† Electronic supplementary information (ESI) available. See DOI: 10.1039/c4lc00374h
Cite this: DOI: 10.1039/c4lc00374h
Received 26th March 2014,Accepted 20th May 2014
DOI: 10.1039/c4lc00374h
www.rsc.org/loc
Increasing hybridization rate and sensitivityof DNA microarrays using isotachophoresis†
Crystal M. Han,a Evaldas Katiliusb and Juan G. Santiago*a
We present an on-chip electrokinetic method to increase the reaction kinetics and sensitivity of DNA
microarray hybridization. We use isotachophoresis (ITP) to preconcentrate target molecules in solution
and transport them over the immobilized probe sites of a microarray, greatly increasing the binding
reaction rate. We show theoretically and experimentally that ITP-enhanced microarrays can be hybridized
much faster and with higher sensitivity than conventional methods. We demonstrate our assay using
a microfluidic system consisting of a PDMS microchannel superstructure bonded onto a glass slide on
which 60 spots of 20–27 nt ssDNA oligonucleotide probes are immobilized. Our 30 min assay results in
an 8.2 fold higher signal than the conventional overnight hybridization at 100 fM target concentration.
We show rapid and quantitative detection over 4 orders of magnitude dynamic range of target concen-
tration with no increase in the nonspecific signal. Our technique can be further multiplexed for higher
density microarrays and extended for other reactions of target-surface immobilized ligands.
1. Introduction
The DNA microarray is now a mature technology that enablesinvestigation of several millions of probe sequences in parallel.1
Its high-throughput capability and sensitivity have been lever-aged in a wide range of applications including gene expressionanalysis,2–4 diagnosis of diseases,5–7 single nucleotide polymor-phisms (SNPs),8,9 and aptamer-based analysis of protein bio-markers.10,11 DNA arrays use hybridization between targetssuspended in a bulk sample solution and probes immobilizedon a solid substrate. Despite its proven success, application ofDNA arrays to rapid screening of samples remains a chal-lenge.12 In conventional microarray assays, the hybridizationstep alone typically requires overnight (15–24 h) incubation toyield a measurable signal from a wide range of target concen-trations.13,14 This constraint has impeded the application ofmicroarrays to point-of-care applications where short sample-to-answer turnaround time is desirable. Reduction in hybridi-zation time is also favorable because extended incubationtimes are associated with solution-dependent cleavage of thelinkage chemistry between the probe and the solid support,negatively affecting the reproducibility and sensitivity.15
There are two main challenges in speeding up hybridiza-tion processes: overcoming the slow diffusion-limited targettransport and the slow reaction rates associated with low
target concentrations.16 The vast majority of work towardspeeding up DNA array hybridization has involved addressingthe first of these limitations with active pumping and/ormixing of liquid solution containing the target molecules.17
Successful microarray hybridization speed-up has been demon-strated using a wide variety of approaches. These includesyringe pump-driven mixing,18 microfluidic integrated peristal-tic pump mixing,19 mixing using 7 mm scale magnetic stirringbars,20 pumping and mixing discrete sample plugs throughserpentine microchannels,21 acoustic microstreaming,22
pumping with displacement micropumps,23 centrifugal liquidpumping,24–26 pneumatically driven mixing,27,28 and electro-kinetic sample dispensing and washing.29
The aforementioned methods of active pumping and vig-orous mixing can increase the hybridization rate as theyprevent hybridization from being diffusion limited by drivingthe fresh sample at its original concentration toward ligandson the surface. However, these approaches do not address thechallenge of slow 2nd order reactions whose reaction rate isdictated by the kinetic parameters and trace concentration oftargets. Kinetically limited reactions between suspended DNAand surface-bound cDNA can take hours to reach equilibriumdue to the inherent dynamics of bulk-to-surface reactions(even assuming the perfect mixing).30,31 Kinetically limitedhybridization is therefore not addressed by pumping or mixingbut rather by preconcentration of target species or methods ofincreasing kinetic parameters themselves (e.g., by varying tem-perature). An example of preconcentration-driven microarrayenhancement is the work of Edman et al.,32 who reported a30-fold increased hybridization rate by electrophoretically
Lab Chip

Fig. 1 Schematic and demonstration of ITP hybridization assay. (a)Illustration of the three step protocol of ITP hybridization: focusing,diffusion, and hybridization. Target ssDNA electromigrates andaccumulates at the interface of TE and LE under a high electric fieldduring the focusing step. When the ITP zone reaches the constrictionof the channel, electric current is turned off, and diffusion redistributestarget DNA for 2 min. In the subsequent hybridization step, a lowerelectric field is applied to avoid further instability, and the focusedtargets sweep over the immobilized probes. (b) Experimentaldemonstration of ITP microarray hybridization with fluorescenceimages taken three times. The ITP-focused Cy3 labeled ssDNA targetsmigrated on the surface immobilized complementary probes. After theITP zone swept by, we observed that the specific fluorescence signalincreases at the probe sites. The initial concentration of targets in thisvisualization was 100 pM. Note that these images are taken during thehybridization step of our method depicted in (a).
Lab on a ChipPaper
Publ
ishe
d on
20
May
201
4. D
ownl
oade
d by
Sta
nfor
d U
nive
rsity
on
08/0
7/20
14 0
4:12
:04.
View Article Online
accumulating DNA species at the capture probes immobilizedon the surface of positively biased microelectrodes. Thismethod received much attention for a brief time but has beenlargely abandoned by the field. We hypothesize that this aban-donment is due to its strict requirement of microfabricationand the strong sensitivity of hybridization reactions to theeffects of electrochemical reactions (which can damage DNA,dramatically change local pH, and/or generate bubbles).
Here we present a novel technique to accelerate and con-trol microarray hybridization using isotachophoresis (ITP)focusing of targets. We use ITP to focus and transport targetmolecules over an array of probe sites in relatively simplemicrofluidic devices. ITP strongly increases the local targetconcentration and simultaneously enhances the local mixingthrough secondary flows and non-axial electric field compo-nents near the ITP focus zone.33 ITP is an electrophoreticfocusing technique, where target analyte ions are focusedselectively between leading and trailing electrolyte ions of thetwo buffers. Relevant to the current work, ITP has been usedto enhance the speed and sensitivity of 2nd order hybridiza-tion between suspended species. For example, Persat andSantiago34 and Bercovici et al.35,36 used ITP to enhancehomogeneous DNA hybridization between a molecular bea-con probe and its complementary target species demonstrat-ing as much as 14 000 fold acceleration. Bahga et al.37
showed detection of two target species sharing a commonportion in their sequences by integrating ITP-enhancedhybridization with capillary zone electrophoresis. ITP hasbeen also used to enhance the surface hybridization reactionbetween a suspended target and an immobilized probe.Garcia-Schwarz and Santiago38,39 used ITP to speed up reac-tions between a single ssDNA species in solution and its com-plimentary capture probe immobilized into a polyacrylamidegel. In work published during the preparation of thismanuscript, Karsenty et al.40 showed an ITP aidedreaction between a single target DNA and a single comple-mentary cDNA immobilized on the surface of paramagneticbeads. Recently, Shkolnikov and Santiago41 developed a spa-tiotemporal model for ITP-aided capture of analytes on aporous semi-infinite column, presented experimental valida-tion of the model, and demonstrated ITP-aided sequencespecific purification of a single DNA target from 10 000×abundant fish sperm DNA in a porous polymer monolith.However, we know of no studies toward integration of ITPwith DNA arrays. Further, we also know of no studies com-bining ITP-enhanced reactions and multiplexed detectionwith more than two probe sequences.
In the current paper, we significantly extend theITP-accelerated reactions to multiplexed detection of20 target sequences using 60 spots of surface-immobilizedprobes (3 replicates for each target). We leverage high accu-mulation power of ITP to achieve both rapid and sensitivemicroarray hybridization. We present a simple analyticalmodel for ITP hybridization, which predicts an order of1000 fold speed up per column of spots and an approxi-mately 10 fold increase in sensitivity compared to the
Lab Chip
kinetically limited reaction with no preconcentration. Oursystem consists of a single layer PDMS superstructurebonded to a glass slide containing a standard microarraywith 60 probe spots exposed to the liquid within the PDMSchannel. Our technique enables quantitative detection of26 nt single-stranded DNA (ssDNA) over a dynamic range of4 orders of magnitude. We experimentally demonstrate30 min assay time with an 8.2 fold increase in sensitivitycompared to conventional overnight microarray hybridizationat 100 fM target concentration.
2. Overview of ITP-enhanced DNAarray hybridization
Fig. 1a presents the schematics of our ITP-enhanced microar-ray hybridization assay performed in three steps: initialfocusing, a diffusive homogenization step, and hybridizationand transport. In the focusing step, we apply a relatively highelectric field to rapidly extract DNA targets from the inputreservoir and accumulate them at the moving ITP interface.The number of molecules accumulated in this step is deter-mined by the volume of the focusing channel and buffercomposition.42,43 During this stage, a high electric field cancause some amount of Joule heating and electrokinetic flowinstabilities44 which result in non-uniform distribution of tar-gets along the spanwise width of the channel (vertical direc-tion in the figure). To correct this, the ITP zone is positionedwithin a narrow constriction in the channel wherein wedeactivated the electric field for about 2 min. This processredistributes the sample via molecular diffusion. We then re-apply a relatively low electric field, which avoids further
This journal is © The Royal Society of Chemistry 2014

Table 1 Typical parameter values for our ITP hybridization in SI units
Parameter Name Value
Dmol Molecular diffusion coefficient fortarget lengths 20–27 nt
9.2 × 10⁻¹⁰ m2 s−1
(ref. 52 and 53)kon Kinetic on-rate constant 76 m3 (mol s)−1
koff Kinetic off-rate constant 4.4 × 10⁻⁵ s−1
K Dissociation constant 5.7 × 10⁻⁷ mol m−3
a Array spot radius 3.0 × 10⁻⁵ md Channel height 4.0 × 10⁻⁵ mC̃H0 Molar surface concentration of
immobilized probes2 × 10−9 mol m−2
CT0 Reservoir concentration of target 10−9 mol m−3
tITP ITP hybridization time 235 sp ITP fold preconcentration level 549
Lab on a Chip Paper
Publ
ishe
d on
20
May
201
4. D
ownl
oade
d by
Sta
nfor
d U
nive
rsity
on
08/0
7/20
14 0
4:12
:04.
View Article Online
instabilities and migrates the focused targets at constant velocityover the microarray. See the ESI† for a visualization of ITPzones before and after the constriction shown in Fig. 1a.Microarray spots located immediately downstream of the con-striction are exposed to highly focused target DNA for afinite, local residence time of the moving ITP zone (typicallyon the order of 50–250 s depending on the applied electricfield). The hybridization reaction is greatly accelerated at theprobe sites within the ITP zone, and the progression of theITP zone downstream subsequently acts as an electrokinetic“wash” where unbound targets are removed from the probespots and collected at the migrating ITP zone. After thesequence of events depicted in Fig. 1a, the channel containingthe array is washed with wash buffers and dried in air prior toscanning on the microarray scanner.
3. Theory
We here present an analytical framework, which we used tocompare ITP-enhanced surface hybridization with conven-tional hybridization. Our analysis also serves to guide thedesign and optimization of ITP hybridization experiments. Inall cases, we model the surface binding reaction as a secondorder reaction with reaction off- and on-rate constants, koffand kon, respectively, and dissociation constant K = koff/kon.The reaction between an immobilized probe (P) and asuspended target (T) forming a hybrid species (H) can beexpressed as follows:45
i P T H dd
ii on
off
Hon T H0 H off H k
k
Ct
k C C C k C�
� � � (1)
where C̃H and C̃H0 denote molar surface concentration of hybridpairs and of free binding sites at t = 0 in units of mol m−2,respectively. CT is the volumetric target concentration at theimmediate vicinity of the immobilized probes with units ofmol m−3. The value of CT is determined by convection–diffusionprocesses in the bulk liquid.
We here develop an approximate relation to characterizethese reactions in the limit of perfect mixing where hybridiza-tion is entirely limited by reaction kinetics. In this regime,target concentration remains unchanged from the initial con-centration, CT0, everywhere above the immobilized probes atall times. Therefore, substituting CT0 for CT in eqn (1-ii)yields the solution for the fraction of surface probes hybrid-ized expressed as:
h CC
C k tkin0
00 off
*
*exp *
11 1 (2)
where C0* = CT0/K and hkin denotes the fraction of the hybrid-ized immobilized probe defined as C̃H/C̃H0. This is a well-established analytical solution for kinetically limited hybridi-zation reactions applicable to well-mixed cases.46–48 Fromeqn (2), the fraction of hybridized probes at the equilibrium,heq, can be easily derived by setting t → ∞:
This journal is © The Royal Society of Chemistry 2014
h CCeq
0
0
*
* 1(3)
The above relation shows that the fraction of the hybrid-ized probe at equilibrium is directly proportional to theinitial target concentration for cases of C0* ≪ 1, which is thedesired design criterion for quantitative microarray analyses.Further, the initial target concentration limits the theoreticalmaximum signal of the assay. This limitation has promptedthe use of long incubation times, in efforts to approach ther-modynamic equilibrium and maximize sensitivity.49,50 Wenote that eqn (3) is also applicable to the equilibrium state ofdiffusion-limited reactions under the assumption that spotsconsume negligible amounts of the target from the solutionthrough binding reactions.51
We model ITP hybridization assay as a kinetically limitedreaction at an elevated, characteristic target concentrationassociated with the ITP preconcentration. Increased concen-tration both improves the rate of capture and increases themaximum signal attainable from a given target concentra-tion. ITP is also known to cause secondary flows33 and thesehelp avoid diffusion-limited regimes. We assume that ITP-enhanced surface hybridization is kinetically limited becausethe typical ITP hybridization time scale (residence time ofITP zone) is smaller than the time scale of depletion zone for-mation, which indicates the onset of the diffusion limitation.We verified the validity of this assumption using typicalparameter values for our system and extrapolating fromPappaert and Desmet's51 nondimensional analysis on hetero-geneous DNA hybridization. We summarize the values of thetypical parameters for our system in Table 1, and with thesewe calculate the five dimensionless numbers, identified inPappaert and Desmet's work,51 and summarize these inTable 2. Da is the Damkohler number defined as the ratio ofthe reaction rate to the diffusive mass transfer rate. C0*denotes the ratio of the maximum forward to backward reac-tion rate. α is the ratio of the spot radius to the fluid layerheight, and C0′ is the ratio of the number of targets in solu-tion above the spot to the number of binding sites in the spotat t = 0. Lastly, τ is a dimensionless reaction time for ITPhybridization.
Lab Chip

Table 2 Estimates of nondimensional parameters as defined by the anal-ysis of Pappaert and Desmet51 and evaluated using the values given inTable 1
Nondimensional parameter Estimation
Da k C dD
on H
mol
�0
0.07
C C kk00* *
T on
off
0.0017
ad
0.75
C C dC0
0 T
H0�
2 × 10⁻⁵
τ = koff(1 + pC0*)tITP 0.01
Lab on a ChipPaper
Publ
ishe
d on
20
May
201
4. D
ownl
oade
d by
Sta
nfor
d U
nive
rsity
on
08/0
7/20
14 0
4:12
:04.
View Article Online
Pappaert and Desmet51 plot the fraction of hybridizedprobes versus dimensionless time for their numerical solu-tion of the microarray surface reaction problem for values ofC0′ ranging from 10−5 to 10−1. The transition from thereaction-limited phase to the diffusion-limited phase can befound as the time when the numerical solution deviates fromthe kinetically limited analytical solution. Based on theirsolution for C0′ = 1 × 10⁻⁵, we estimate that the dimension-less transition time is 0.01 for ITP hybridization associatedwith C0′ = 2 × 10⁻⁵. Other nondimensional parameters usedin their solution were C0* = 10-3, α = 5, and Da = 1. In com-parison, our α is 7 fold lower and Da is 14 fold lower, whileC0* is approximately the same. The same paper by Pappaertand Desmet51 also showed that the transition time fromkinetic- to diffusion-limited regime is increased for lower Daand α. The latter suggests that the dimensionless transitiontime associated with our parameters may be longer than0.01, implying that the reaction stays longer in the kineticallylimited regime. Thus we conclude that the dimensionlessITP reaction time, 0.01, is smaller than the transition time tothe diffusion limited phase, hence ITP hybridization is kineti-cally limited.
As a simple approximation, we model the concentrationprofile of ITP focused targets as a top-hat pulse with a charac-teristic target concentration value of pCT0 and a characteristicITP zone width of δITP, traveling at a known, constant velocityof VITP. Here p denotes the fold preconcentration level of thetarget species in the ITP zone compared to the reservoirconcentration. Using this simple model of an ITP zone, weestimate the duration during which an immobilized probeis exposed to the high concentration target as the formtITP = δITP/VITP. That is, we model that ITP hybridization isperformed at a concentration of pCT0 for a short, finite ITPreaction time of tITP, during which the reaction is yet kineti-cally limited. We derive an approximate analytical model forITP hybridization by simply substituting pCT0 for CT0 and tITPfor t in eqn (2) to obtain
h pCpC
pC k tITP off ITP
0
001
1 1**
exp * , (4)
Lab Chip
where hITP denotes the fraction of surface probes hybridizedafter the ITP zone passes. This simple model gives insight intoITP-aided hybridization dynamics and will serve as a compari-son case for the well-mixed surface hybridization with nopreconcentration. We will use these analytical models tocharacterize ITP enhanced hybridization in comparison tokinetically limited hybridization. A similar analysis on the ITPhybridization was provided recently by Karsenty et al.40
4. Materials and methods4.1. Buffers, reagents and DNA sequences
We used twenty synthetic target–probe molecule pairs com-posed of perfectly complementary DNA and cDNA. We pro-vide sequences of target and probe DNA oligonucleotides inthe ESI.† We arbitrarily named target–probe pairs as numbersfrom 1 to 20. The target sequences were synthesized with aCy3 dye at the 5′ terminus. Capture probes were synthesizedwith the amine group on a C6 linker at the 5′ end with anadditional hexa-ethylene glycol linker (HEG) that separatesamine group from the DNA sequence. Targets and the respec-tive partner probes had the same length ranging from 20 to27 nt. Additionally, we purchased and used as corner markerssynthetic DNA with the amino modifier C6 at the 5′ terminusand Cy3 at the 3′ terminus. All oligonucleotides were pur-chased from Integrated DNA Technologies (IDT, Coralville, IA),and 100 μM of their stock solutions were stored at −20 °C.
For ITP hybridization, the aqueous LE buffer inside thechannel, LE1, contained 250 mM HCl, 500 mM Tris, 5 mMMgCl2, 0.1% w/w 1 MDa poly(vinylpyrrolidone) (PVP), 10%formamide, and 0.01% w/w Tween20. We chose the concen-tration of HCl and Tris as a good compromise betweenstrong ITP focusing and Joule heating. The gel-phase LEbuffer in the LE reservoir, LE2, was composed of 250 mMHCl, 500 mM Tris, and 25% w/v Pluronic F-127. At 25% con-centration of Pluronic F-127, the solution is in liquid formbelow +4 °C but quickly changes to the solid-phase as it istransferred to the reservoir and exposed at room tempera-ture.54 We used this thermal gelation property to preventpressure driven flow in the channel during ITP.43,55 Theaqueous TE buffer contained 25 mM HEPES, 50 mM Bis–tris,1% PVP, and varying concentrations of a mixture of ssDNAtargets. The loading volume of the TE buffer in the reservoirwas 20 μl. Thus we used 2 attomoles of each sequence for thehybridization of 100 fM target concentration. For conven-tional hybridization, target DNA was mixed with the LE1buffer to final concentrations ranging from 100 fM to 10 nM.We used a total of 21.6 μl of the LE1 buffer for each experi-ment, and we estimate that the channel contained only 1.6 μl.So, for example, 2 attomoles and 0.16 attomoles of each targetsequence were used, respectively, in the reservoirs and in thechannel for the 100 fM target concentration experiments.
HCl, HEPES, Tris, Bis–tris, MgCl2, Pluronic F-127, andTween20 were purchased from Sigma-Aldrich (St. Louis, MO).PVP was obtained from Polysciences, Inc. (Warrington, PA).Formamide was purchased from Invitrogen (Grand Island, NY).
This journal is © The Royal Society of Chemistry 2014
Lab on a Chip Paper
Publ
ishe
d on
20
May
201
4. D
ownl
oade
d by
Sta
nfor
d U
nive
rsity
on
08/0
7/20
14 0
4:12
:04.
View Article Online
All solutions were prepared with UltraPure DNase free dis-tilled water (GIBCO Invitrogen, Carlsbad, CA).
4.2. Microarray
The microarrays were custom designed and manufactured byApplied Microarrays, Inc. (AMI, Tempe, AZ) using proprietarynon-contact piezoelectric spotting equipment. Glass slideswith epoxysaline coating (Schott Nexterion Slide E, Elmsford, NY)were used as the substrates for immobilization. Eachslide had 6 identical microarrays; each array consists of8 repeated spots for 20 probe sequences (a total of 160 spots).The spot diameter was 60 μm, and the center-to-center dis-tance between spots was 150 μm. The corner marker DNAwas immobilized to indicate the location and the direction ofthe microarrays. The detailed array geometry is described inthe ESI.† Since we purchased blocked arrays, we performedno further blocking before hybridization. Once opened fromtheir packaging, we stored the unused microarrays in a vac-uum chamber (Bel-Art Scienceware, Wayne, NJ).
4.3. Fabrication of the microfluidic device
We designed a single layer polydimethylsiloxane (PDMS)microfluidic superstructure. When bonded to the microarrayglass substrate, this structure created a simple channel overthe array consisting of an inlet and an outlet reservoir. Thissimple structure was used to extract target DNA from theinlet, focus it, and perform rapid ITP hybridization. We usedthe identical PDMS and glass substrate system to performconventional hybridization without ITP or mixing. The fluidicmicrochannel was 80 mm long and had a uniform depth of40 μm. The channel had a 500 μm width, except for asmooth, 200 μm wide constriction fabricated into the regionjust upstream of the probe sites. Optimized, low-dispersionturns (not shown in Fig. 1) were also used to minimize dis-persion of the sample at turns.55,56
We used a SU-8 master mold fabricated by the StanfordMicrofluidics Foundry (Stanford, CA) as a positive cast for themicrofluidic superstructure. To optimize bonding, weexperimented with several ratios of the precursor-to-curingagent (Sylgard 184, Dow Corning, Menlo Park, CA) and foundthat a ratio of 20 : 1 (w/w) formed a spontaneous seal betweenthe PDMS slab and epoxysaline-coated glass slide with noplasma treatment. We degassed the reagents for 30 min,thoroughly mixed, poured into the mold, and cured at 65 °Cfor at least 6 h. We then peeled off the PDMS slab and punchedholes to form inlet and outlet reservoirs. We manually alignedthe PDMS superstructure and microarray slide based on thealignment markers on the PDMS and created a reversible con-tact bond between them. We observed no leakage of thesebonds. The final microfluidic system contained 40–60 spotswithin the fluidic channel, depending on the alignment.
4.4. ITP hybridization and conventional hybridization
Immediately before each experiment, we primed a channel byflushing with 50% ethanol (Sigma-Aldrich, St. Louis, MO) for
This journal is © The Royal Society of Chemistry 2014
5 min. This mitigated problems with air bubble formationduring filling.57 We dried the ethanol by flowing air with avacuum line for 2 min before filling the channel with LE1. Asdepicted in Fig. 1a, ITP hybridization required three buffers:LE1, LE2, and TE. After filling the entire channel with LE1buffer, we rinsed the two reservoirs using distilled water andemptied the reservoirs thoroughly with vacuum. We pipetted20 μL of aqueous TE buffer and gel-phase LE buffer (LE2)into the input and output reservoirs, respectively. We thenplaced platinum wire electrodes into each reservoir. The LE2buffer changed from the liquid to solid phase immediatelyafter it was pipetted into the well from the ice bath,preventing unwanted pressure driven flow. We initiated ITPenhanced hybridization experiments by applying 1100 V tothe LE well and grounding the TE well using a high voltagesource meter (2410, Keithley Instruments, Cleveland, OH).We turned off the field as the ITP zone arrived at the con-striction and waited for 2 min. Hybridization was thenperformed at room temperature by applying constant cur-rents. For visualization experiments shown in Fig. 1b, weapplied 4 μA while we applied 2 μA for all other experiments.Higher currents result in a shorter assay time but lower sensi-tivity (as residence time over each spot is decreased). For allquantitative experiments, we selected 2 μA as a good compro-mise between the duration and sensitivity of assay.
For conventional hybridization experiments, we primed achannel in the same way, filled it with the LE1 buffercontaining target DNA, and then filled the two reservoirs with10 μl of the same buffer. We taped a PCR sealer film (Micro-seal B Adhesive Sealer, MSB-1001, Bio-Rad) on top of thePDMS superstructure to prevent evaporation and wrappedthe entire device with aluminum foil. The microfluidic sys-tem was then incubated at room temperature for 15 h.
After each ITP and conventional hybridization experiment,we emptied both reservoirs and filled the channel with1× saline-sodium citrate (SSC, Invitrogen, Carlsbad, CA) for1 min, then completely dried the channel by flowing air witha vacuum line for 2 min. We then peeled off the PDMS chan-nel superstructure and carried out an additional two-stepwashing inside a 50 ml centrifuge tube. For the latter, themicroarray slide was first immersed in a solution containing0.1× SSC and 0.1% w/w TritonX (Sigma-Aldrich St. Louis, MO)for 1 min and then transferred to 0.1× SSC for an additional1 min incubation. At the end of this series of washing, wedried the microarray slides completely by blowing air from aduster type compressed gas can.
4.5. Detection
For the on-chip visualization of microarray hybridizationshown in Fig. 1b, we used an inverted epifluorescence micro-scope (Eclipse TE300, Nikon, Tokyo, Japan) equipped with a10× objective (Plan, NA 0.45, Nikon, Tokyo, Japan). We used amercury lamp and a filter cube (XF102-2, Omega Optical,Brattleboro, VT) for excitation of a Cy3 fluorophore. Werecorded images with generation III, intensified CCD camera
Lab Chip

Fig. 2 Comparison of sensitivity and hybridization time between ITPand well-mixed (kinetically limited) surface hybridizations. Dashedcontours represent the ratio of characteristic time to reach 99% of theequilibrium with kinetically limited reaction to that with ITP, t99,kin/t99,ITP, for a common range of C0* and p. We defined C0* as a dimension-less parameter, C0/K. Solid contour lines represent the ratio of thefraction of hybridized probes of ITP hybridization to that from thewell-mixed case at equilibrium, hITP/heq, and are plotted for relevantvalues of nondimensional time tITPkoff and p. For the solid lines, we setC0* at 10−4, but we note that these contours have a negligible depen-dence on C0* for C0* < 10−2. The gray area represents the range ofparameters tITPkoff and p which result in an ITP assay with highersensitivity than the kinetically limited reaction. The square symbolrepresents the model prediction for the estimated experimentalconditions used in Fig. 3 and 4 (p = 549, tITP = 235 s, and koff =4.4 × 10⁻⁵ s−1), and hITP/heq is 5.6 under these conditions. The uncer-tainty bars on this point represents 95% confidence intervals based ona propagation of error analysis.
Lab on a ChipPaper
Publ
ishe
d on
20
May
201
4. D
ownl
oade
d by
Sta
nfor
d U
nive
rsity
on
08/0
7/20
14 0
4:12
:04.
View Article Online
(IPentaMAX; Roper Scientific, Trenton, NJ), controlled withWinview32 (Princeton Instruments, Trenton, NJ).
For all other results presented here, we scanned themicroarray slides using a GenePix 4000B array scanner(Axon Instrument, CA) located in Stanford FunctionalGenomic Facilities (SFGF, Stanford, CA). We used hardwaresettings of 100% laser power, 5 μm resolution, and either400 or 800 PMT gain. We used GenePix Pro 6.0 software(Axon Instrument, CA) to extract images and obtain quantita-tive estimates of the fluorescence intensity from each spot.
5. Results and discussion5.1. Demonstration of microarray hybridization acceleration
We first performed on-chip visualization experiments of theITP hybridization process using standard epifluorescencemicroscopy with CCD camera imaging. In Fig. 1b, we presentimages taken from a single ITP microarray hybridizationexperiment conducted three times at a fixed location. Here,we focused twenty Cy3 labeled ssDNA target sequences at100 pM initial concentration and let the ITP zone sweep overthe immobilized probe spots. Initially, the probes were incontact with the aqueous LE1 solution containing no targetspecies, thus we observed no fluorescence signal. After theITP zone passed over the reaction spots, we observed a fluo-rescence intensity increase, as expected. The backgroundsignal in these images is higher in the trailing zone of theITP peak as the TE here contains target species. These imagesserve as a qualitative description of the assay.
5.2. Experimental conditions and parameters required forour model predictions
Our analytical model predicts that preconcentration with ITPcan enhance hybridization in three ways: speeding up thereaction, improving sensitivity, and enabling quantitativedetection. First, the speed-up in the rates of hybridizationreaction by ITP preconcentration scales with p (e.g., whichcan be seen by taking the derivative of eqn (4) with respect totITP) compared to kinetically limited hybridization withoutpreconcentration. As usual with reaction acceleration schemesfor microarrays, we compare the time to obtain the samesignal intensity from both methods. To this end, we calculate99% characteristic time, i.e., the time required to reach 99%of the equilibrium signal, heq, defined in eqn (3) for a giventarget concentration. In Fig. 2, dashed contour lines representthe ratio of kinetically limited hybridization time to ITPhybridization time. For a common range of p and C0* valuespresented here, we see that an order of 1000-fold speedupis predicted.
Second, we predict an increase in sensitivity for ITPenhanced hybridization. In Fig. 2 solid contour lines repre-sent the ratio of the fraction hybridized of hybridization withand without ITP versus the nondimensional time, kofftITP, andthe preconcentration level, p. A ratio higher than unity isachieved for the range of parameters highlighted by the grayarea. For example, for a typical koff value of order 10−4 s−1,
Lab Chip
residence times of 50 s or greater result in hITP/heq valuesgreater than unity for preconcentration factors of about 300or greater. Such preconcentration values and residence timesare easily achievable with ITP for a wide variety of targets andsample types.43 We note that the abscissa and ordinate coor-dinates of Fig. 2 are not completely orthogonal since p andtITP are both functions of the electric field. We chose this rep-resentation because these dimensionless parameters facili-tate comparison with experimental conditions. We refer thereaders to the ESI† for an alternate contour plot showingexplicitly the effect of the electric field on the ratio of thefraction hybridized of ITP and conventional hybridization.
Third, ITP hybridization enables quantitative detection fora wide dynamic range, fulfilling a primary criterion as ananalytical technique. For conventional hybridization atequilibrium, the fraction of the hybridized probe is directlyproportional to the initial target concentration, hkin ≈ CT0/Kfor conditions satisfying C0* ≪ 1. Similarly, in ITP hybridiza-tion, a Taylor series expansion for the limiting case of( pC0* + 1)kofftITP ≪ 1 yields the linear proportionality ofhITP ≈ pkontITPCT0. In both cases, the assays result in a linearrelation between the initial target concentration and the frac-tion hybridized h. However for the conventional hybridizationcase, an absolute amount of the captured target depends oncalibration for a sequence specific equilibrium constant K,whereas it depends on the product of pkontITP for the ITP
This journal is © The Royal Society of Chemistry 2014

Fig. 3 Experimental data demonstrating quantitative and sensitivedetection of a target sequence using ITP microarray hybridization andits comparison to conventional array hybridization. Titration curvesshown here were obtained for 26 nt ssDNA (target 1) concentrationsranging from 100 fM to 10 nM. Along with experimental data(symbols), we show results of analytical models with a single fittingparameter for the conventional (dashed) hybridization and anadditional fitting parameter for the ITP case (solid). The inset comparesraw fluorescence intensity from CT0 = 100 fM hybridization data ofboth methods and the negative control with no target. The increase offluorescence intensity over the negative control was 1.7 forconventional hybridization and 14 for ITP hybridization. ITP creates an8.2 fold increase in sensitivity and a 30 fold decrease in assay time. Therange bar in the inset is used to indicate maximum and minimumvalues of data points across repetitions (N = 3).
Lab on a Chip Paper
Publ
ishe
d on
20
May
201
4. D
ownl
oade
d by
Sta
nfor
d U
nive
rsity
on
08/0
7/20
14 0
4:12
:04.
View Article Online
case. The latter includes both a sequence-specific parameterkon and an ITP condition parameter ptITP. This offers flexibil-ity in assay design as we have found that ITP conditions canbe easily controlled and very reproducible. In summary, con-ventional hybridization relies on achieving near-equilibriumusing long incubation times (and appropriate mixing) forsome initial target concentration. Its sensitivity and time aretherefore typically limited by K and either a slow reaction rateor a slow diffusion time. In contrast, ITP strongly promotesthe forward reaction by preconcentration (and mixing viasecondary flow). Therefore despite the shorter reaction time,ITP's preconcentration can achieve a higher value of thehybridized molecule fraction, h. Our protocol then effectively“freezes” this higher value of h by drying out (with air) thereaction surface.
We next describe the experimental conditions and dimen-sional parameters we required to apply to our analyticalmodel. We measured the ITP velocity, VITP, ITP interfacewidth, δITP, and preconcentration level, p, from independentITP hybridization experiments (N = 5). For these calibrationexperiments, we obtained images of the migrating ITP zonecontaining twenty Cy3 labeled targets (each with 250 pMreservoir concentration) under a 2 μA constant current condi-tion with an ICCD gain of 40, exposure time of 1 s, and0.1 Hz frame rate. Note that here we used the same experi-mental conditions associated with Fig. 3 and 4 below.We first performed image analysis on the raw image (I) tosubtract the background intensity (BG) and correct the non-uniform illumination by flat field image (FF) according to anequation of the form:
I Icorr
BGFF BG FF BG
/ max, (5)
where Icorr denotes the corrected intensity of the image. Weexperimentally observed that the ITP concentration profilewas approximately Gaussian in shape. We fit the experimen-tal data with Gaussian distribution of the form Ae(x−μ)
2/2σ 2
,where A is the amplitude, μ is the mean, and σ is the stan-dard deviation (cf. Fig. S4b for experiment vs. Gaussian fit vs.top hat approximation in the ESI†). Our titration experimentsresulted in a calibration equation of the form Icorr = 1.02 ×10¹⁰CT0 + 41 (see the ESI†) to convert the corrected intensityof the ITP zone into concentration of targets. In our analyti-cal model, we approximated the ITP concentration profile asa top-hat pulse with a characteristic ITP interface width, δITP.To this end, we set δITP to be the ±2σ width of the Gaussianpeak. We determined the magnitude of the top-hat pulse,pCT0, such that the area under the pulse, 4σpCT0, was equal
to the area under the Gaussian peak, 2 A . This provided
the estimate for the ITP zone width and preconcentrationlevel; δITP = 746 ± 32 μm and p = 549 ± 49. Further, the ITPvelocity was measured by dividing the average displacementdistance of the Gaussian fit obtained from thirty pairs ofimages taken with 10 s image-to-image delays. The estimated
This journal is © The Royal Society of Chemistry 2014
value of VITP at 2 μA was 3.2 ± 0.05 μm s−1. Dividing the valueof δITP by VITP, we obtained the characteristic ITP reactiontime as tITP = 235 ± 12 s. For all ITP parameters, we reportedmean values from five experiments along with 95% confi-dence interval based on the Student's t-distribution.
Next, we used the measured ITP parameters and estimatedkinetic parameters K = 5.7 × 10⁻¹⁰ M and koff = 4.4 × 10⁻⁵ s−1
(see section 5.3) to obtain the model prediction of speed-upand sensitivity increase for our experiments. We show thepredictions with a square symbol in Fig. 2. Our simple theorypredicts increase in sensitivity of order 5.6 fold, while weexperimentally observe an 8.2 fold increase in the signal(see section 5.3). As shown with the experiments, ITP's highaccumulation power can easily achieve sensitivity improve-ment over hybridization methods without preconcentration.Further, we compare the assay time of hybridization with andwithout ITP preconcentration. The 99% characteristic timefor well mixed and ITP hybridization are 28.7 h and 41 s,respectively, using C0* = 0.01, which implies 5.7 pM. Thisindicates that the speedup in ITP hybridization constitutes2500 fold for each column of spots in the microchannel(along the spanwise direction). For multiple columns, thetotal ITP hybridization time is increased by the ratio of thetotal length of the array to the ITP zone width δITP.
5.3. Rapid, quantitative and high-sensitivity detection
We demonstrate wide quantitative detection dynamic range,high sensitivity, and hybridization acceleration of our
Lab Chip

Fig. 4 Comparison of specific and nonspecific signals betweenconventional and ITP hybridizations. The background subtractedfluorescence signal for each target on a log scale is plotted. We herehybridized target 1 alone at 100 pM concentration and measured thefluorescence intensity from all of the 20 probe sequences across the60 spots (3 spots per sequence). Data shown are the averageintensities from three experiments with range bars representing theabsolute range of measured values. A negative value of thebackground-subtracted intensity indicates that non-specific bindingwas not observed. The ratio of the specific signal to the highestnonspecific signal was 160 for conventional hybridization and 2130 forITP hybridization.
Lab on a ChipPaper
Publ
ishe
d on
20
May
201
4. D
ownl
oade
d by
Sta
nfor
d U
nive
rsity
on
08/0
7/20
14 0
4:12
:04.
View Article Online
technique by comparing titration curves for ITP and conven-tional hybridization with no mixing. In Fig. 3, we presentexperimental data of the fraction of hybridized probesagainst six concentrations for ITP (triangle) and conventionalhybridization (circle) cases. The hybridization experimentswere performed using a mixture of twenty target sequenceswith initial/reservoir concentrations varying from 100 fM to10 nM. Here we show results from only target 1, but weinclude additional data analyses for other targets in the ESI.†There, we also provide a discussion on the limit of detectionand experiment-to-experiment reproducibility of our method.The fraction of the hybridized probe was estimated fromexperiments by normalizing the background-subtracted fluo-rescence signal with the maximum value for the respectivemethods. In both cases, we observed that the fraction of thehybridized probe proportionally increased with increasingconcentration over a dynamic range of 4 orders of magnitude.The fraction hybridized for ITP hybridization was higher thanthat of conventional hybridization for all concentrations,showing improved sensitivity by the preconcentration effectof ITP. For example at 100 fM, the average fraction hybridizedfor the ITP and conventional hybridizations were 1.2 × 10⁻³
and 3.2 × 10⁻⁵, respectively. Multiplying the values with theprobe surface density and spot dimension given in Table 1,we calculate that the ITP hybridization recovered 6.7 × 10⁻²¹
moles (4.0 × 10³ copies) and conventional hybridization recov-ered 1.8 × 10⁻²² moles (1.1 × 10² copies). ITP has approxi-mately 1 order of magnitude higher capture amount thanconventional hybridization. In the inset, we compare the rawfluorescence intensities for ITP and conventional hybridiza-tion (here, without background subtraction) for the lowestconcentration case (100 fM) and a negative control of no tar-get in solution. The intensity increase relative to the negativecontrol was 1.7 for conventional hybridization and 14 forITP hybridization, which translates to an 8.2 fold increase insensitivity for ITP hybridization. The ITP assay total duration(for all spots) was 30 min, compared to 15 h for the conven-tional hybridization; hence the increased sensitivity wasaccompanied by a 30-fold speed up for the process.
Shown together with the experimental data set are analyti-cal models for the conventional and ITP hybridizations(dashed and solid lines). To obtain these theoretical curves,we first fit the conventional hybridization data with theequilibrium model of eqn (3) using K as a single, globalfitting parameter. The fitting parameter was determined asK = 5.7 × 10⁻¹⁰ M using the ‘nlinfit’ nonlinear fitting functionof Matlab. For the ITP model, we used the same value of Kcombined with independently measured estimate values ofp = 549 and tITP = 235 s from section 5.2. A single additionalfitting parameter for the ITP hybridization predictions wasdetermined as kon = 7.6 × 10⁴ M−1 s−1. These hybridizationparameter values are typical for heterogeneous hybridiza-tion.31,58,59 For ITP, we observed a good qualitative agreementof predicted trends and our experimental data. For conven-tional hybridization, we observed a good qualitative agreementat higher concentrations but a slight discrepancy at
Lab Chip
concentrations below 1 pM. We hypothesize that the overpre-diction by the model of the fraction hybridized is due to thefact that the conventional hybridization did not reach equilib-rium despite its 15 h incubation. We believe that hybridiza-tion is diffusion limited at these low target concentrationsand thus requires longer time to reach equilibrium.50,60
5.4. Comparison of the non-specific signal for ITP andconventional hybridization
In Fig. 4, we present measurements of specific and non-specific signals obtained with conventional and ITP hybrid-izations. For this demonstration, we included only one target(target 1) at an initial concentration of 100 pM andperformed conventional and ITP-aided hybridizations. Afterhybridization, we recorded the raw fluorescence intensityfrom all 20 probe sequences. The bar plots represent thebackground-subtracted fluorescence intensity resulting fromspecific (for target 1, white) and nonspecific (for targetnumbers 2–20, gray) hybridizations. For most of thesequences, the non-specific signal was lower than the localbackground signal, indicating negligible non-specific bindingof DNA or dye to the array surface. To obtain a quantitativemeasure for specificity, we calculated a specificity indexdefined as the ratio of the specific signal to the highestnonspecific signal (target 4). The specificity index was 160 forconventional hybridization and 2130 for ITP hybridization.The more than 10 fold increase in the specificity index wasachieved mainly by the increased specific signal of ITPhybridization. Importantly, the nonspecific signals for bothconventional and ITP hybridizations were of the same orderof magnitude. This confirms that ITP hybridization enables
This journal is © The Royal Society of Chemistry 2014
Lab on a Chip Paper
Publ
ishe
d on
20
May
201
4. D
ownl
oade
d by
Sta
nfor
d U
nive
rsity
on
08/0
7/20
14 0
4:12
:04.
View Article Online
sensitivity increase with no negative effects on the specificityof the assay.
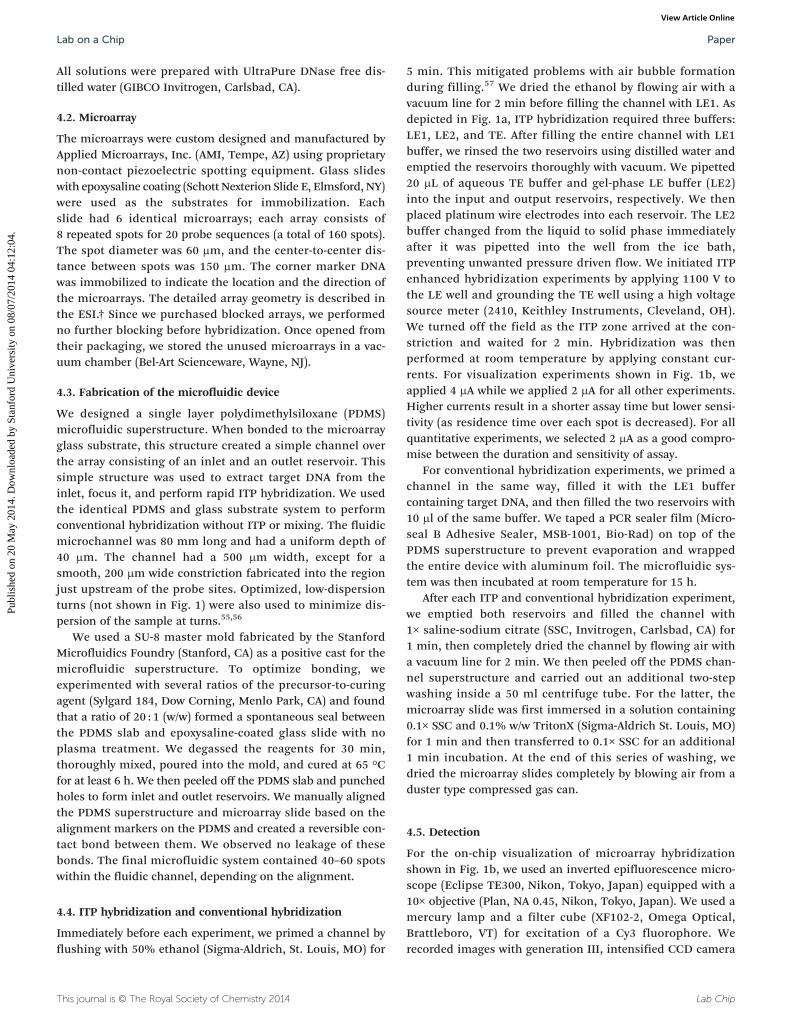
6. Conclusions
We demonstrated the acceleration and sensitivity improve-ment of DNA microarray hybridization using ITP. Our methodleverages high preconcentration power of ITP to overcome theslow reaction kinetics of surface hybridization. We focustarget molecules into a narrow (order 100 μm) ITP zone, trans-port them over immobilized probes, and speed-up the surfacebinding reaction. Our approach enabled 30 fold shorterhybridization assay time compared to the overnight conven-tional hybridization and at the same time improved the sensi-tivity by nearly 1 order of magnitude without increasing thenonspecific signal. The current paper is also the first ITP-based hybridization work demonstrating the quantitativeanalysis for significant multiplexing (here 20 sequencesacross a total of 60 spots). We believe that our technique canbe easily adapted for a high density DNA array by upscalingthe dimensions of the device. Furthermore, the current studycan be merged with ITP's nucleic acid extraction functionalityto create an integrated on-chip nucleic acid analysis systemthat inputs complex sample and outputs multiplexed quanti-tation of sequences (e.g., without amplification). We hypothe-size that the method presented here is generally applicable toaccelerate other target–receptor binding processes such asantigen–antibody, protein–aptamer, and aptamer–cDNA.Rapid and sensitive ITP microarray hybridization shows thepotential to speed-up traditionally long processes of bio-marker discovery, clinical diagnosis, and SNP analyses.
Acknowledgements
We gratefully acknowledge support from Defense AdvancedResearch Projects Agency (DARPA) under contract numberHR0011-12-C-0080. C.M.H. gratefully acknowledges theRobert and Katherine Eustis Stanford Graduate Fellowshipfor support.
References
1 D. Okou, K. Steinberg and C. Middle, Nat. Methods, 2007, 4,
1109–1111.2 D. T. Ross, U. Scherf, M. B. Eisen, C. M. Perou, C. Rees,
P. Spellman, V. Iyer, S. S. Jeffrey, M. Van de Rijn,M. Waltham, A. Pergamenschikov, J. C. Lee, D. Lashkari,D. Shalon, T. G. Myers, J. N. Weinstein, D. Botstein andP. O. Brown, Nat. Genet., 2000, 24, 227–235.3 A. Adomas, G. Heller, A. Olson, J. Osborne, M. Karlsson,
J. Nahalkova, L. Van Zyl, R. Sederoff, J. Stenlid, R. Finlay andF. O. Asiegbu, Tree Physiol., 2008, 28, 885–897.4 M. Schena, D. Shalon, R. W. Davis and P. O. Brown, Science,
1995, 270, 467–470.5 J. Marx, Science, 2000, 289, 1670–1672.
6 R. W. Wallace, Mol. Med. Today, 1997, 3, 384–389. 7 Y. Shen and B.-L. Wu, Clin. Chem., 2009, 55, 659–669.This journal is © The Royal Society of Chemistry 2014
8 J. G. Hacia, J. B. Fan, O. Ryder, L. Jin, K. Edgemon,
G. Ghandour, R. A. Mayer, B. Sun, L. Hsie, C. M. Robbins,L. C. Brody, D. Wang, E. S. Lander, R. Lipshutz, S. P. Fodorand F. S. Collins, Nat. Genet., 1999, 22, 164–167.9 X. Chen and P. F. Sullivan, Pharmacogenomics J., 2003, 3,
77–96.10 L. Gold, D. Ayers, J. Bertino, C. Bock, A. Bock, E. N. Brody,
J. Carter, A. B. Dalby, B. E. Eaton, T. Fitzwater, D. Flather,A. Forbes, T. Foreman, C. Fowler, B. Gawande, M. Goss,M. Gunn, S. Gupta, D. Halladay, J. Heil, J. Heilig, B. Hicke,G. Husar, N. Janjic, T. Jarvis, S. Jennings, E. Katilius,T. R. Keeney, N. Kim, T. H. Koch, S. Kraemer, L. Kroiss,N. Le, D. Levine, W. Lindsey, B. Lollo, W. Mayfield,M. Mehan, R. Mehler, S. K. Nelson, M. Nelson,D. Nieuwlandt, M. Nikrad, U. Ochsner, R. M. Ostroff,M. Otis, T. Parker, S. Pietrasiewicz, D. I. Resnicow,J. Rohloff, G. Sanders, S. Sattin, D. Schneider, B. Singer,M. Stanton, A. Sterkel, A. Stewart, S. Stratford, J. D. Vaught,M. Vrkljan, J. J. Walker, M. Watrobka, S. Waugh, A. Weiss,S. K. Wilcox, A. Wolfson, S. K. Wolk, C. Zhang and D. Zichi,PLoS One, 2010, 5, e15004.11 S. Kraemer, J. D. Vaught, C. Bock, L. Gold, E. Katilius,
T. R. Keeney, N. Kim, N. A. Saccomano, S. K. Wilcox,D. Zichi and G. M. Sanders, PLoS One, 2011, 6, e26332.12 F. Teles and L. Fonseca, Talanta, 2008, 77, 606–623.
13 P. Hegde, R. Qi, K. Abernathy, C. Gay, S. Dharap,R. Gaspard, J. E. Hughes, E. Snesrud, N. Lee andJ. Quackenbush, BioTechniques, 2000, 29, 548–562.
14 V. G. Cheung, M. Morley, F. Aguilar, A. Massimi,
R. Kucherlapati and G. Childs, Nat. Genet., 1999, 21, 15–19.15 C. Situma, M. Hashimoto and S. A. Soper, Biomol. Eng.,
2006, 23, 213–231.16 K. Pappaert, P. Van Hummelen, J. Vanderhoeven, G. V. Baron
and G. Desmet, Chem. Eng. Sci., 2003, 58, 4921–4930.17 L. Wang and P. C. Li, Anal. Chim. Acta, 2011, 687, 12–27.
18 M. K. McQuain, K. Seale, J. Peek, T. S. Fisher, S. Levy,M. A. Stremler and F. R. Haselton, Anal. Biochem., 2004, 325,215–226.
19 J. Liu, B. A. Williams, R. M. Gwirtz, B. J. Wold and S. Quake,
Angew. Chem., Int. Ed., 2006, 45, 3618–3623.20 P. K. Yuen, G. Li, Y. Bao and U. R. Muller, Lab Chip, 2003, 3,
46–50.21 C.-W. Wei, J.-Y. Cheng, C.-T. Huang, M.-H. Yen and
T.-H. Young, Nucleic Acids Res., 2005, 33, e78.22 R. H. Liu, R. Lenigk, R. L. Druyor-Sanchez, J. Yang and
P. Grodzinski, Anal. Chem., 2003, 75, 1911–1917.23 J. Rupp, M. Schmidt, S. Münch, M. Cavalar, U. Steller,
J. Steigert, M. Stumber, C. Dorrer, P. Rothacher, R. Zengerleand M. Daub, Lab Chip, 2012, 12, 1384–1388.24 L. Wang and P. C. H. Li, Anal. Biochem., 2010, 400, 282–288.
25 R. Peytavi, F. R. Raymond, D. Gagné, F. J. Picard, G. Jia,J. Zoval, M. Madou, K. Boissinot, M. Boissinot,L. Bissonnette, M. Ouellette and M. G. Bergeron, Clin.Chem., 2005, 51, 1836–1844.
26 H. Chen, L. Wang and P. C. H. Li, Lab Chip, 2008, 8,
826–829.Lab Chip

Lab on a ChipPaper
Publ
ishe
d on
20
May
201
4. D
ownl
oade
d by
Sta
nfor
d U
nive
rsity
on
08/0
7/20
14 0
4:12
:04.
View Article Online
27 X. Wang, X. Chen, X. Ma, X. Kong, Z. Xu and J. Wang,
Talanta, 2011, 84, 565–571.28 N. B. Adey, M. Lei, M. T. Howard, J. D. Jensen, D. A. Mayo,
D. L. Butel, S. C. Coffin, T. C. Moyer, D. E. Slade,M. K. Spute, A. M. Hancock, G. T. Eisenhoffer, B. K. Dalleyand M. R. McNeely, Anal. Chem., 2002, 74, 6413–6417.29 D. Erickson, X. Liu, U. Krull and D. Li, Anal. Chem.,
2004, 76, 7269–7277.30 Y. Gao, L. K. Wolf and R. M. Georgiadis, Nucleic Acids Res.,
2006, 34, 3370–3377.31 Y. Okahata, M. Kawase, K. Niikura, F. Ohtake, H. Furusawa
and Y. Ebara, Anal. Chem., 1998, 70, 1288–1296.32 C. F. Edman, D. E. Raymond, D. J. Wu, E. Tu,
R. G. Sosnowski, W. F. Butler, M. Nerenberg andM. J. Heller, Nucleic Acids Res., 1997, 25, 4907–4914.33 G. Garcia-Schwarz, M. Bercovici, L. A. Marshall and
J. G. Santiago, J. Fluid Mech., 2011, 679, 455–475.34 A. Persat and J. G. Santiago, Anal. Chem., 2011, 83,
2310–2316.35 M. Bercovici, G. V. Kaigala, K. E. Mach, C. M. Han, J. C. Liao
and J. G. Santiago, Anal. Chem., 2011, 83, 4110–4117.36 M. Bercovici, C. M. Han, J. C. Liao and J. G. Santiago, Proc.
Natl. Acad. Sci. U. S. A., 2012, 109, 11127–11132.37 S. S. Bahga, C. M. Han and J. G. Santiago, Analyst, 2013, 138,
87–90.38 G. Garcia-Schwarz and J. G. Santiago, Anal. Chem., 2012, 84,
6366–6369.39 G. Garcia-Schwarz and J. G. Santiago, Angew. Chem., Int. Ed.,
2013, 52, 11534–11537.40 M. Karsenty, S. Rubin and M. Bercovici, Anal. Chem.,
2014, 86, 3028–3036.41 V. Shkolnikov and J. G. Santiago, Anal. Chem., in press.
42 T. K. Khurana and J. G. Santiago, Anal. Chem., 2008, 80,6300–6307.43 A. Rogacs, L. A. Marshall and J. G. Santiago, J. Chromatogr.
A, 2014, 1335C, 105–120.44 A. Persat and J. G. Santiago, New J. Phys., 2009, 11, 075026.
Lab Chip
45 R. Levicky and A. Horgan, Trends Biotechnol., 2005, 23,
143–149.46 R. A. Vijayendran, F. S. Ligler and D. E. Leckband, Anal.
Chem., 1999, 71, 5405–5412.47 T. M. Phillips, J. A. Thompson and H. H. Bau, J. Chromatogr.
B: Anal. Technol. Biomed. Life Sci., 2010, 878, 228–236.48 M. F. Hagan and A. K. Chakraborty, J. Chem. Phys.,
2004, 120, 4958–4968.49 G. Bhanot, Y. Louzoun, J. Zhu and C. DeLisi, Biophys. J.,
2003, 84, 124–135.50 M. Sartor, J. Schwanekamp, D. Halbleib, I. Mohamed,
S. Karyala, M. Medvedovic and C. R. Tomlinson,BioTechniques, 2004, 36, 790–796.51 K. Pappaert and G. Desmet, J. Biotechnol., 2006, 123,
381–396.52 V. Chan, D. J. Graves and S. E. McKenzie, Biophys. J.,
1995, 69, 2243–2255.53 A. E. Nkodo, J. M. Garnier, B. Tinland, H. Ren,
C. Desruisseaux, L. C. McCormick, G. Drouin andG. W. Slater, Electrophoresis, 2001, 22, 2424–2432.54 M. Vadnere, G. Amidon, S. Lindenbaum and J. L. Haslam,
Int. J. Pharm., 1984, 22, 207–218.55 L. A. Marshall, A. Rogacs, C. Meinhart and J. G. Santiago,
Proceedings of American Institute of Chemical EngineersAnnual Meeting, San Francisco, 2013.56 J. I. Molho, A. E. Herr, B. P. Mosier, J. G. Santiago,
T. W. Kenny, R. A. Brennen, G. B. Gordon andB. Mohammadi, Anal. Chem., 2001, 73, 1350–1360.57 A. Spehar, S. Koster, V. Linder, S. Kulmala, N. F. de Rooij,
E. Verpoorte, H. Sigrist and W. Thormann, Electrophoresis,2003, 24, 3674–3678.58 M. R. Henry, P. Wilkins Stevens, J. Sun and D. M. Kelso,
Anal. Biochem., 1999, 276, 204–214.59 K. Tawa and W. Knoll, Nucleic Acids Res., 2004, 32,
2372–2377.60 C. Gadgil, A. Yeckel, J. J. Derby and W.-S. Hu, J. Biotechnol.,
2004, 114, 31–45.This journal is © The Royal Society of Chemistry 2014