Lab on a Chip - National Nanotechnology Research...
10
Lab on a Chip PAPER Cite this: Lab Chip, 2016, 16, 2494 Received 12th May 2016, Accepted 23rd May 2016 DOI: 10.1039/c6lc00623j www.rsc.org/loc Impedimetric detection and lumped element modelling of a hemagglutination assay in microdroplets† Merve Marcali and Caglar Elbuken * Droplet-based microfluidic systems offer tremendous benefits for high throughput biochemical assays. De- spite the wide use of electrical detection for microfluidic systems, application of impedimetric sensing for droplet systems is very limited. This is mainly due to the insulating oil-based continuous phase used for most aqueous samples of interest. We present modelling and experimental verification of impedimetric de- tection of hemagglutination in microdroplets. We have detected agglutinated red blood cells in micro- droplets and screened whole blood samples for multiple antibody sera using conventional microelectrodes. We were able to form antibody and whole blood microdroplets in PDMS microchannels without any te- dious chemical surface treatment. Following the injection of a blood sample into antibody droplets, we have detected the agglutination-positive and negative droplets in an automated manner. In order to under- stand the characteristics of impedimetric detection inside microdroplets, we have developed the lumped electrical circuit equivalent of an impedimetric droplet content detection system. The empirical lumped el- ement values are in accordance with similar models developed for single phase electrical impedance spectroscopy systems. The presented approach is of interest for label-free, quantitative analysis of droplets. In addition, the standard electronic equipment used for detection allows miniaturized detection circuitries that can be integrated with a fluidic system for a quantitative microdroplet-based hemagglutination assay that is conventionally performed in well plates. Introduction Microdroplet-based microfluidic systems have enabled a range of applications in biochemical analysis. 1–3 The abil- ity to compartmentalize individual cells or specific con- centrations of biochemical entities opens up a plethora of applications for these systems. 4 In parallel with the devel- opments in high throughput droplet generation and sev- eral other droplet operations such as merging, mixing, splitting, and reinjection, these systems can collect signif- icant statistical data in short assay times. Although sev- eral interesting droplet operation units have been demon- strated with microdroplets, there is still lack of standard modelling methods that can be applied to microdroplet- based detection. Impedimetric methods are commonly used for sensing in microfluidic systems. Detection of cells with impedimetric measurement dates back to the seminal works of Curtis and Cole. 5–7 The Coulter method was developed as a standard tool that has been used for cytometry devices for decades. 8 There has been tremendous progress ever since especially for identification of single cells based on their electrical properties. 9–11 With the advancements in microdroplet-based fluidic systems, impedimetric detection of the content of microdroplets has also been discussed. 12–14 Specifically, there have been several applications that encapsulate cells in droplets. 15,16 Detection of these cells has mostly been performed using optical methods since the commonly used oil-based continuous phase liquids have very high imped- ances and pose challenges for electrical detection. The thin oil lubrication layer between an aqueous droplet and the channel wall is the main limitation for the use of impedimetric methods in detection of cells in droplets. Re- cently, it has been demonstrated that viable mouse myeloma cells (5–6 μm diameter) can be detected inside microdroplets using some advanced detection systems and conductivity ad- justed solutions. 17 However, the signal-to-noise ratio was lim- ited and the system can only detect viable cells in low con- ductivity buffers. There is still need for systems that can be used for impedimetric detection using real-world samples. Also, there is a gap in the literature for modelling of impedimetric detection inside microdroplets. 2494 | Lab Chip, 2016, 16, 2494–2503 This journal is © The Royal Society of Chemistry 2016 UNAM, Institute of Materials Science and Nanotechnology, Bilkent University, Ankara, 06800, Turkey. E-mail: [email protected] † Electronic supplementary information (ESI) available. See DOI: 10.1039/c6lc00623j Published on 23 May 2016. Downloaded by Bilkent University on 26/06/2016 09:43:33. View Article Online View Journal | View Issue
Transcript of Lab on a Chip - National Nanotechnology Research...
Lab on a Chip
PAPER
Cite this: Lab Chip, 2016, 16, 2494
Received 12th May 2016,Accepted 23rd May 2016
DOI: 10.1039/c6lc00623j
www.rsc.org/loc
Impedimetric detection and lumped elementmodelling of a hemagglutination assay inmicrodroplets†
Merve Marcali and Caglar Elbuken*
Droplet-based microfluidic systems offer tremendous benefits for high throughput biochemical assays. De-
spite the wide use of electrical detection for microfluidic systems, application of impedimetric sensing for
droplet systems is very limited. This is mainly due to the insulating oil-based continuous phase used for
most aqueous samples of interest. We present modelling and experimental verification of impedimetric de-
tection of hemagglutination in microdroplets. We have detected agglutinated red blood cells in micro-
droplets and screened whole blood samples for multiple antibody sera using conventional microelectrodes.
We were able to form antibody and whole blood microdroplets in PDMS microchannels without any te-
dious chemical surface treatment. Following the injection of a blood sample into antibody droplets, we
have detected the agglutination-positive and negative droplets in an automated manner. In order to under-
stand the characteristics of impedimetric detection inside microdroplets, we have developed the lumped
electrical circuit equivalent of an impedimetric droplet content detection system. The empirical lumped el-
ement values are in accordance with similar models developed for single phase electrical impedance
spectroscopy systems. The presented approach is of interest for label-free, quantitative analysis of droplets.
In addition, the standard electronic equipment used for detection allows miniaturized detection circuitries
that can be integrated with a fluidic system for a quantitative microdroplet-based hemagglutination assay
that is conventionally performed in well plates.
Introduction
Microdroplet-based microfluidic systems have enabled arange of applications in biochemical analysis.1–3 The abil-ity to compartmentalize individual cells or specific con-centrations of biochemical entities opens up a plethora ofapplications for these systems.4 In parallel with the devel-opments in high throughput droplet generation and sev-eral other droplet operations such as merging, mixing,splitting, and reinjection, these systems can collect signif-icant statistical data in short assay times. Although sev-eral interesting droplet operation units have been demon-strated with microdroplets, there is still lack of standardmodelling methods that can be applied to microdroplet-based detection.
Impedimetric methods are commonly used for sensing inmicrofluidic systems. Detection of cells with impedimetricmeasurement dates back to the seminal works of Curtis andCole.5–7 The Coulter method was developed as a standard
tool that has been used for cytometry devices for decades.8
There has been tremendous progress ever since especially foridentification of single cells based on their electricalproperties.9–11 With the advancements in microdroplet-basedfluidic systems, impedimetric detection of the content ofmicrodroplets has also been discussed.12–14 Specifically, therehave been several applications that encapsulate cells indroplets.15,16 Detection of these cells has mostly beenperformed using optical methods since the commonly usedoil-based continuous phase liquids have very high imped-ances and pose challenges for electrical detection. The thinoil lubrication layer between an aqueous droplet and thechannel wall is the main limitation for the use ofimpedimetric methods in detection of cells in droplets. Re-cently, it has been demonstrated that viable mouse myelomacells (5–6 μm diameter) can be detected inside microdropletsusing some advanced detection systems and conductivity ad-justed solutions.17 However, the signal-to-noise ratio was lim-ited and the system can only detect viable cells in low con-ductivity buffers. There is still need for systems that can beused for impedimetric detection using real-world samples.Also, there is a gap in the literature for modelling ofimpedimetric detection inside microdroplets.
2494 | Lab Chip, 2016, 16, 2494–2503 This journal is © The Royal Society of Chemistry 2016
UNAM, Institute of Materials Science and Nanotechnology, Bilkent University,
Ankara, 06800, Turkey. E-mail: [email protected]
† Electronic supplementary information (ESI) available. See DOI: 10.1039/c6lc00623j
Publ
ishe
d on
23
May
201
6. D
ownl
oade
d by
Bilk
ent U
nive
rsity
on
26/0
6/20
16 0
9:43
:33.
View Article OnlineView Journal | View Issue

Lab Chip, 2016, 16, 2494–2503 | 2495This journal is © The Royal Society of Chemistry 2016
In the present article, we have demonstrated the firstimpedimetric detection of hemagglutination inside micro-droplets. We explore the detection of clumps of cells and de-velopment of a lumped model analysis for detection of cellu-lar aggregation inside microdroplets. In contrast to thepreviously reported lumped models of impedimetric detec-tion, we present empirical values for the lumped model ele-ments. In our system, each microdroplet can be used to de-tect a separate agglutination reaction. This approach enablescross screening of multiple samples for various analytesusing a single system.
We developed a PDMS microfluidic device to generate atrain of serum droplets containing agglutinins. Then, a PBS(phosphate-buffered saline) diluted whole blood sample isinjected into these droplets from a side inlet. As a model as-say, we have demonstrated agglutination of red blood cells(RBCs) by antibodies in serum using standard blood typingsera.18 Blood typing sera are readily accessible and provide avery easy assay to test impedimetric detection of agglutinatedand non-agglutinated droplets using microfabricatedelectrodes. We have demonstrated that using this label-free and automated impedimetric detection approach,hemagglutination inside the droplets can be monitored. Byanalyzing the impedimetric signal of droplets with differ-ent contents, we have developed the lumped electrical cir-cuit equivalent of the microfluidic detection system. UsingSPICE circuit simulator software, the lumped model ele-ments were derived from the experimental values. This fi-nal model provides us with an electrical circuit equivalentof microdroplet sensors that can be integrated with controland read-out electronics for stand-alone lab on a chip sys-tems. By correlating the physical parameters to the individ-ual elements of the model, such a model can be appliedfor designing quantitative immuno-diagnostic assays inmicrodroplets19 or can be further expanded to model thedetection of individual cells in microdroplets.17
In this article, we first describe the microfluidic chip de-sign and its fabrication. Formation of serum droplets withwhole blood side injection was demonstrated without anychemical treatment of the PDMS/glass microchips. Sec-ondly, we discuss the experimental measurement system,followed by the impedimetric sensing results. We have dem-onstrated the repeatability and the limit of detection of thesystem. Then, the lumped circuit model for the micro-droplet system is introduced. Finally, the SPICE circuitmodel is used to determine the values of the circuit compo-nents and comparison of the numerical model and the ex-perimental results is given. The results in this study demon-strate the impedimetric detection of hemagglutination inmicrodroplets, which shows the feasibility of a completelyautomated hemagglutination assay performed in a micro-fluidic format using an integrated antibody dilution unit.Conventionally such assays are performed using well platesand require serial dilutions of the test solutions (virus, bac-teria or antibody) as well as manual tracking and reading ofthe agglutinated wells.
Experimental sectionMaterials
We obtained whole blood samples from adult donors withwritten consent. Blood samples (A+, AB+, and O−) were drawninto a 4 ml tube (BD Vacutainer) containing EDTA (ethyl-enediaminetetraacetic acid) and stored at 4 °C. For each ex-periment, 1 ml of a whole blood sample was diluted to atotal volume of 3 ml with PBS solution (Sigma). Antibodysera (IgM Anti-A, Anti-B, Anti-D) were obtained from a localstore (Agape Diagnostics). Silicone oil (μ = 100 mPa s,Ultrakim) was used as a continuous phase to formmicrodroplets.
Device fabrication
Microfluidic device fabrication was accomplished in twosteps. Firstly, we fabricated PDMS (Sylgard 184, Dow Corning)microchannels using standard soft lithography.20 A siliconwafer (University Wafers) was used as a substrate on whichSU-8 negative photoresist (MicroChemicals) was patternedusing photolithography. Then, for the casting process,we prepared a PDMS (polydimethylsiloxane) mixture. Themixture was cured on the silicon mold at 100 °C for 4 h. Themicrochannel height and width were measured to be 80 μmand 300 μm, respectively, using a stylus profilometer (KLATencor, P6 Surface Profiler). Secondly, coplanar electrodeswere fabricated on a glass slide. AZ5214 positive photoresist(MicroChemicals) was patterned on a glass slide usingphotolithography. The glass slide was coated with a 15 nm-thickCr and a 35 nm-thick Au using a thermal evaporator (Vaksis-PVD Vapor-3S). Electrode fabrication was completed by a lift-offprocess in acetone (Sigma). The electrode width and gap weremeasured to be 20 μm. Finally, a microchannel was bondedover the coplanar electrodes using an oxygen plasma treatment(Nanoplas, DSB6000). After plasma bonding, we have notperformed any surface modification. We simply filled the de-vice with silicone oil and placed it on a hotplate at 100 °Covernight. We have observed that overnight baking enhancesthe hydrophobic nature of the channel.
Device design and droplet formation
We designed a microfluidic chip that allows screening of awhole blood sample with multiple antibody serum solutionsin a single run. The chip design and measurement setup areschematically shown in Fig. 1. A T-junction droplet genera-tor is used in a squeezing regime21 to form antibody serumdroplets using silicone oil as a continuous phase. Then,using an additional side injection channel, 6–8 nl of a bloodsample is injected into the serum droplets. The control offlow rates was achieved using a pressure pump (Elveflow,OB1, 2 bar). For the results demonstrated in this study, wetested each sample with three antibody solutions (Anti-A,Anti-B, Anti-D) in a single run. The antibody solutions, sepa-rated by silicone oil segments, were loaded into PTFE (poly-tetrafluoroethylene) tubing (Cole Parmer, ID 0.42 mm, OD
Lab on a Chip Paper
Publ
ishe
d on
23
May
201
6. D
ownl
oade
d by
Bilk
ent U
nive
rsity
on
26/0
6/20
16 0
9:43
:33.
View Article Online
2496 | Lab Chip, 2016, 16, 2494–2503 This journal is © The Royal Society of Chemistry 2016
0.84 mm) using a syringe pump (KD Scientific, KDS200) inwithdraw mode. Segmentation of the antibody solutionsprevented cross contamination of reagents in the tubing.For effective antigen–antibody binding after side injection,microdroplets are mixed using a serpentine channel seg-ment. Finally, the agglutination reaction inside the micro-droplet is detected using coplanar electrodes and an LCRmeter.
It is important to emphasize that we have not used anysurface modification or surfactant when forming micro-droplets of the serum–whole blood mixture. The main chal-lenge in dealing with whole blood in two-phase flow systemsis the wetting of blood droplets in polymer microdevices. Sev-eral groups have tackled this problem.22,23 Ismagilov et al.have modified the surface of a PDMS channel in order to pre-vent cell adhesion. This modification requires a tedious
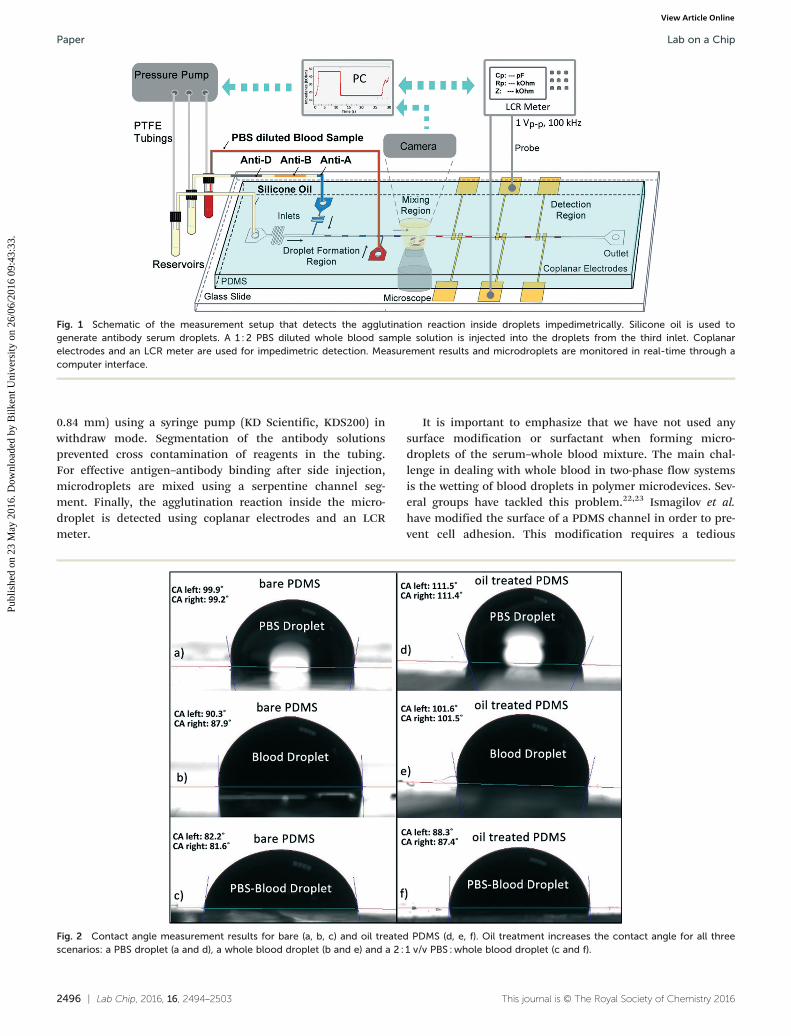
Fig. 1 Schematic of the measurement setup that detects the agglutination reaction inside droplets impedimetrically. Silicone oil is used togenerate antibody serum droplets. A 1 : 2 PBS diluted whole blood sample solution is injected into the droplets from the third inlet. Coplanarelectrodes and an LCR meter are used for impedimetric detection. Measurement results and microdroplets are monitored in real-time through acomputer interface.
Fig. 2 Contact angle measurement results for bare (a, b, c) and oil treated PDMS (d, e, f). Oil treatment increases the contact angle for all threescenarios: a PBS droplet (a and d), a whole blood droplet (b and e) and a 2 : 1 v/v PBS :whole blood droplet (c and f).
Lab on a ChipPaper
Publ
ishe
d on
23
May
201
6. D
ownl
oade
d by
Bilk
ent U
nive
rsity
on
26/0
6/20
16 0
9:43
:33.
View Article Online

Lab Chip, 2016, 16, 2494–2503 | 2497This journal is © The Royal Society of Chemistry 2016
silanization procedure. We overcame the protein adsorptionissue simply by treating the microchip with silicone oil for aduration of at least 10 h. During this incubation step, sili-cone oil is absorbed by the porous PDMS which enhances thehydrophobicity of the channel walls. Fig. 2 demonstrates ourcontact angle measurement (OCA 30, Dataphysics) resultsobtained from bare PDMS and oil treated PDMS. As seenin Fig. 2b–e, the contact angle for whole blood increasesfrom 89° to 101° for the PDMS surfaces that had absorbedoil for at least 10 h. Similarly for the 1 : 2 (v/v) blood–PBSdroplet mixtures, the contact angle increases from 82° to 88°(Fig. 2c–f).
In order to form the droplets, the inlet pressures were setto 45 mbar and 50 mbar for the antibody solution and sili-cone oil inlets, respectively. After successful droplet forma-tion was observed at a rate of 0.1 Hz, the inlet pressure forthe whole blood sample is gradually increased up to 42mbar. The time lapse snapshots of injection of the bloodsample into an Anti-A droplet are shown in Fig. 3a–c. Ashort movie of the injection of the whole blood sample intoserum droplets is also given as ESI† (Video S1). The pres-sure control system allowed us to fine tune the inlet pres-sures for synchronous injection of whole blood into thedroplets. The system can operate without any operator inter-ruption for more than 60 min, thus allowing analysis ofmultiple droplets in a successive manner. The PBS dilutedwhole blood in the vial was mixed using a magnetic stirrerthroughout the course of the experiment in order to preventerythrocyte sedimentation.
In the literature, there are several droplet microfluidic sys-tems that demonstrate synchronous formation of dropletsusing multiple dispersed phase solutions.24–26 In general,these systems are self-triggered to form droplets from multi-ple junctions. In our system, the whole blood sample intro-duced at the downstream T-junction does not form a com-plete droplet. Instead, as it is in the filling stage, a serumantibody droplet merges with it and the combined droplet
goes through the necking stage.27 Synchronization in merg-ing of droplets was achieved precisely and the experimentran more than 60 min without requiring any pressure adjust-ment by the operator.
The combined droplets were directed to a serpentine re-gion for mixing. At the end of the serpentine channel, thered blood cells, which were mixed with the correspondingantibody solutions, started to separate from the plasma andaccumulated at the trailing edge of the droplets. Agglutina-tion of RBCs in the serpentine region is shown in the sec-ond movie supplemented as ESI† (Video S2). In this video,agglutination-positive droplets are separated from wholeblood droplets. During the mixing step, individual RBCsstarted to bind with one another due to the reaction of ag-glutinogens on RBCs with antibodies in the serum solutionand formed RBC clusters in a droplet. The accumulation ofthe RBC clusters at the trailing edge is due to therecirculative flow profiles formed in the droplet. The micro-droplets in rectangular channels possess a complex profileof flow patterns which depend on the droplet velocity, vis-cosity ratio of the fluids and surface tension.28,29 As recentlydemonstrated, depending on the sedimentation rate of theparticles inside the droplets and the length of the droplet,nonagglutinated RBCs may also partially accumulate at thetrailing edge of the droplet.30 In our studies, we ensuredthat the Ca number is high enough so that the non-agglutinated RBCs stay homogenously suspended in thedroplet (Ca = μU/γ = (100 mPa s × 150 × 10−6 m s−1)/4 × 10−3
N m−1 = 3.75 × 10⁻³). The critical capillary number for thehomogenous mixing regime is determined to be 2.3 × 10⁻³
for 500 μm long droplets. Additionally, the length of the ser-pentine section was designed as 9 mm so that each droplethas a reaction time of 2 min before reaching the detectionelectrode.
It is also important to note that at the side injection T-junction, an antibody droplet merges with whole blood fromthe leading edge (ESI† Video S1). Right after the merging as
Fig. 3 Schematic drawing of the system and time-lapse optical micrographs of sample side injection into the droplets. (a) At the first T-junction,an antibody (Anti-A) droplet is generated. (b–d) The droplet is merged with a blood sample (A Rh+). (e and f) The droplet is transferred to themixing region. (g and h) Mixing of the antibody solution with the blood sample to enhance hemagglutination. (i) After agglutination, clumped redblood cells are located at the trailing edge of the droplet.
Lab on a Chip Paper
Publ
ishe
d on
23
May
201
6. D
ownl
oade
d by
Bilk
ent U
nive
rsity
on
26/0
6/20
16 0
9:43
:33.
View Article Online

2498 | Lab Chip, 2016, 16, 2494–2503 This journal is © The Royal Society of Chemistry 2016
the droplet moves in the channel, the RBCs slowly coast to-wards the trailing edge while the antibody solution moves tothe leading edge of the droplet. This provides an effectivemechanism for the agglutinogens on RBCs to meet with ag-glutinins in the serum. As seen in the second supplementarymovie (ESI† Video S2), even at the entrance of the serpentineregion, the hemagglutination reaction has started andclumps of RBCs can be distinguished. Therefore, the side in-jection of the blood sample and the well-known serpentinemixing geometry enable efficient binding and eliminate theneed for active mixers used in the literature.19
Measurement setup
In previous studies, for an impedimetric measurement,custom-made electronics, lock-in amplifiers and LCR meterswere used in microfluidics systems.31,32 In this study, weused an LCR meter (Agilent E4980A) to observe the agglutina-tion reaction inside microdroplets and to characterize the sig-nal obtained from different droplets. The whole bloodsample is mixed with three types of antibody serum (Anti-A,Anti-B, Anti-D) as explained in the previous section. Due toease of fabrication, we used coplanar electrodes for detection.The electrodes were supplied a sinusoidal signal of 1 Vp–p
amplitude by the LCR meter. The excitation frequency wasswept from 50 kHz to 2 MHz and measurements wereperformed in |Z| − θ mode. The 100 kHz frequency yieldedthe best signal (largest difference between the agglutinatedand non-agglutinated sections of the droplet) for the detec-tion of the agglutination-positive droplets, thus a further de-tailed investigation of the system was performed at 100 kHz.Although an LCR meter is a very precise instrument for elec-trical characterization, it is limited in terms of its data rate.The measurement time (from trigger to end of measurement)for an Agilent E4980A is reported to be 5.7 ms in its datasheet. In order to reach this limit, we set the measurementtime mode as short and kept the LCR display off. With thesesettings we were able to acquire data at 135 Hz. We used acustom LabVIEW interface to transfer the experimental read-ings to a computer in real-time. Simultaneously, the systemwas also monitored using an inverted microscope (OmanoOMFL600) equipped with a 5 MP camera.
Results and discussion
In this study our goal is to detect agglutination reactions in-side microdroplets using electrical sensing. We also aimed todevelop an electrical equivalent circuit model forimpedimetric detection inside water-in-oil microdroplets. Wedesigned a droplet based microdevice that merged wholeblood with antibody serum droplets in silicone oil. Forimpedimetric measurement, firstly, droplets that containedwhole blood and different types of antibody serum wereformed. Then, an electrical signal was recorded as dropletstravelled over the coplanar electrodes. Since the conductivityof the droplets is significantly higher than silicone oil, the
droplets were detected as low impedance signals. As shownin Fig. 4, the continuous phase impedance was on the orderof MΩ, whereas impedance of reagents in the droplets wason the order of kΩ for the measurements performed at 100kHz. Fig. 4 shows four different droplet types that have beencharacterized in a single run. Blood droplets and antibodydroplets can be differentiated from their impedance peak. Ablood sample has an impedance of 13.5 kΩ, whereas an anti-gen droplet yields 9.1 kΩ. Since very narrow electrodes wereused, when the sensing region is completely occupied by thedroplet, the signal saturates at its minimum point. Then, ag-glutination-positive and agglutination-negative droplets wereformed and characterized. When the A+ blood sample ismixed with the Anti-A serum, hemagglutination is observed.The agglutinated RBCs were detected impedimetrically as aclump that gave a characteristic signal at 30 kΩ (also shownin the ESI† Video S3). The leading edge of the droplet is com-posed of a conductive antigen solution and plasma. Asexpected, this section yielded a similar impedance result tothe conductive droplets. When the A+ blood sample ismerged with an Anti-B serum droplet, agglutination was notobserved and impedance was detected similar to the homo-genously distributed droplets.
For the detailed investigation of the signal from the agglu-tinated droplet, the droplets were observed at high magnifica-tion while the real-time impedance signal is recorded. Asshown in Fig. 4, when a droplet enters the sensing region,the signal level drops to 10 kΩ and remains constant between22 s and 25 s. As the cell clusters enter the sensor, imped-ance starts to increase due to the insulative nature of the cellmembrane (25–27 s) at 100 kHz. The trailing edge of thedroplet contains large clusters of cells separated with cell-de-pleted, plasma-rich portions. The distinct impedance signalobserved between 27 s and 28 s is when the plasma-rich por-tion enters the sensing domain. This causes a sudden de-crease in the impedance as shown in Fig. 4. Such a behavioris not observed in non-agglutinated droplets, since RBCs aredistributed in the entire droplet. Although there are smallclusters of red blood cells, the sensor averages the signal inthe entire width of the channel and a constant impedancesignal is observed.
Effect of excitation voltage on the impedance signal
In order to test the dependence of the impedance signal onthe excitation voltage, the same measurements wereperformed at different bias signals. A train of agglutination-positive droplets was formed and measured by the samepair of electrodes sequentially. The first droplet wasdetected using a 1 Vp–p signal. For the following droplets,the signal was obtained with increasing signal amplitudes.Fig. 5 plots the signal obtained using 1 Vp–p and 10 Vp–p,which shows a significant difference. Although both signalsdetected the narrow agglutinated section at the trailingedge of the droplet, the signal obtained from the dropletbody is very different. For the 1 Vp–p signal, a constant
Lab on a ChipPaper
Publ
ishe
d on
23
May
201
6. D
ownl
oade
d by
Bilk
ent U
nive
rsity
on
26/0
6/20
16 0
9:43
:33.
View Article Online

Lab Chip, 2016, 16, 2494–2503 | 2499This journal is © The Royal Society of Chemistry 2016
signal level is observed, whereas when 10 Vp–p is applied,the impedance gradually increases as the droplet goes overthe sensor. The observation of these droplets under themicroscope revealed that the freely moving cells in thedroplet are trapped by the electrodes due to dielectrophoreticforce and the trapping causes an increase in the impedancesignal. As the droplet moves, the electrodes sweep the non-agglutinated cells. This squeegee-like behaviour causes anexponential increase in the signal level. Such an effect canbe used to transfer particles between successive droplets.
Limit of detection and repeatability
Hemagglutination assays that are conventionally performedin well plates require dilution of the test solution andmixing with the sample in separate wells. After a certain in-cubation time, the agglutination-positive (pellet) andagglutination-negative (button) wells are read and the quan-tity of the analyte of interest is determined.33 As a step to-wards a hemagglutination assay in microdroplets, we pres-ent the impedimetric detection in this study. We alsodetermined the limit of detection by diluting the RBCamount inside the droplets and characterized the repeat-ability of the system.
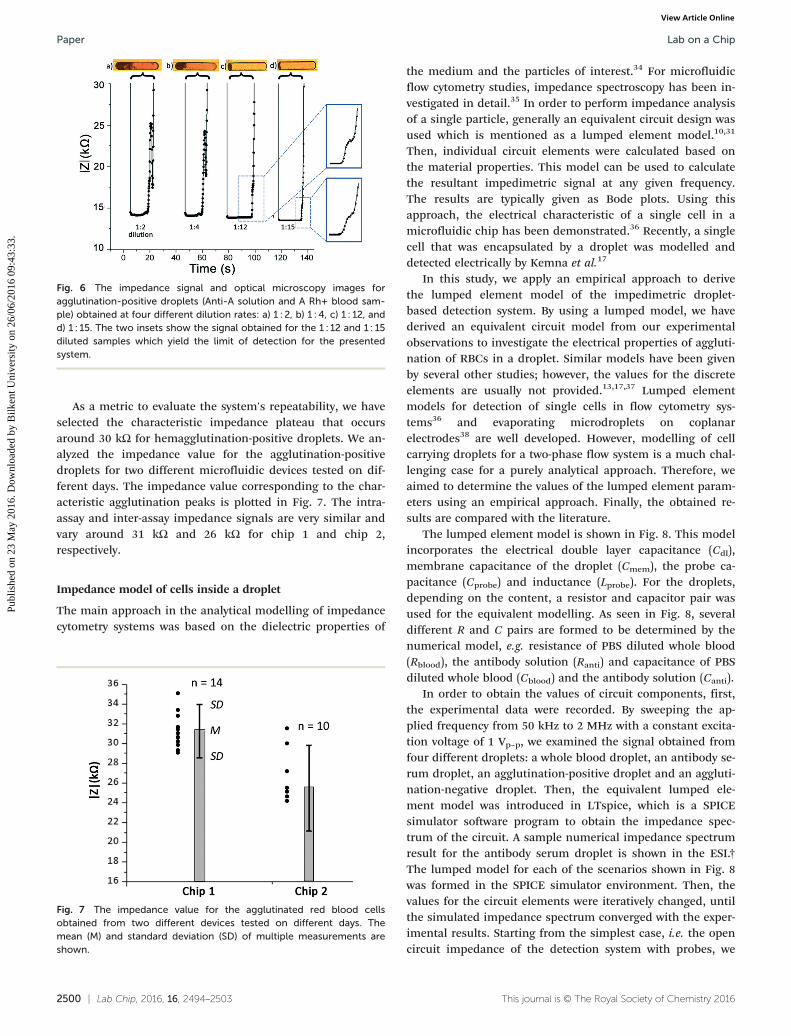
In order to determine the limit of detection (LOD), we tai-lored the inlet pressures and generated microdroplets with adecreasing amount of red blood cells. The amount of dilutionwas approximated from the microscopy images of red bloodcell laden microdroplets. Droplets containing four differentdilutions and the corresponding impedance signals areshown in Fig. 6. We can detect the agglutination signal for2-fold, 4-fold and 12-fold dilutions. For the 15-fold dilutedsample, the agglutination signal was barely noticeable. There-fore, we conclude that for the presented system, the LOD is15-fold dilution of the sample. Narrowing the width of themicrochannel in the detection region will elongate the micro-droplet and the clumped red blood cells so that decreasingamounts of red blood cells can be detected which would im-prove the LOD. As seen in Fig. 6, an increase in the dilutionrate decreases the impedance value for the characteristic sig-nal, which is due to the increasing amount of PBS inside thedroplets.
Fig. 5 The effect of excitation voltage on the impedance signal. Theplot shows two impedance signal results obtained from agglutination-positive droplets using 1 Vp–p and 10 Vp–p excitation voltages. The insetshows a microscopy image of the sweeping of free-flowing cells insidethe droplets resulting in an increase in the impedance signal. The char-acteristic agglutination peak is easily distinguished for both voltagelevels.
Fig. 4 Impedance signal obtained from different droplets. (a) A whole blood droplet (black). (b) An anti-A antigen droplet (blue). c) An anti-A solu-tion and blood sample (A Rh+) droplet (red). The agglutination reaction occurred inside a droplet. d) An anti-B solution and blood sample (A Rh+)droplet (green). Agglutination did not occur due to the mismatch of the antigen and the antibody. On the right, high magnification optical micros-copy image and characteristic impedance signal of the agglutination-positive droplet: I. impedance of the plasma section in the droplet, t: 22–25 s(red); II. impedance increase due to the presence of the cells in a droplet, t: 25–27 s (green); and III. impedance peak due to the replacement of ared blood cell cluster with a plasma solution, t: 27–28 s (blue).
Lab on a Chip Paper
Publ
ishe
d on
23
May
201
6. D
ownl
oade
d by
Bilk
ent U
nive
rsity
on
26/0
6/20
16 0
9:43
:33.
View Article Online
2500 | Lab Chip, 2016, 16, 2494–2503 This journal is © The Royal Society of Chemistry 2016
As a metric to evaluate the system's repeatability, we haveselected the characteristic impedance plateau that occursaround 30 kΩ for hemagglutination-positive droplets. We an-alyzed the impedance value for the agglutination-positivedroplets for two different microfluidic devices tested on dif-ferent days. The impedance value corresponding to the char-acteristic agglutination peaks is plotted in Fig. 7. The intra-assay and inter-assay impedance signals are very similar andvary around 31 kΩ and 26 kΩ for chip 1 and chip 2,respectively.
Impedance model of cells inside a droplet
The main approach in the analytical modelling of impedancecytometry systems was based on the dielectric properties of
the medium and the particles of interest.34 For microfluidicflow cytometry studies, impedance spectroscopy has been in-vestigated in detail.35 In order to perform impedance analysisof a single particle, generally an equivalent circuit design wasused which is mentioned as a lumped element model.10,31
Then, individual circuit elements were calculated based onthe material properties. This model can be used to calculatethe resultant impedimetric signal at any given frequency.The results are typically given as Bode plots. Using thisapproach, the electrical characteristic of a single cell in amicrofluidic chip has been demonstrated.36 Recently, a singlecell that was encapsulated by a droplet was modelled anddetected electrically by Kemna et al.17
In this study, we apply an empirical approach to derivethe lumped element model of the impedimetric droplet-based detection system. By using a lumped model, we havederived an equivalent circuit model from our experimentalobservations to investigate the electrical properties of aggluti-nation of RBCs in a droplet. Similar models have been givenby several other studies; however, the values for the discreteelements are usually not provided.13,17,37 Lumped elementmodels for detection of single cells in flow cytometry sys-tems36 and evaporating microdroplets on coplanarelectrodes38 are well developed. However, modelling of cellcarrying droplets for a two-phase flow system is a much chal-lenging case for a purely analytical approach. Therefore, weaimed to determine the values of the lumped element param-eters using an empirical approach. Finally, the obtained re-sults are compared with the literature.
The lumped element model is shown in Fig. 8. This modelincorporates the electrical double layer capacitance (Cdl),membrane capacitance of the droplet (Cmem), the probe ca-pacitance (Cprobe) and inductance (Lprobe). For the droplets,depending on the content, a resistor and capacitor pair wasused for the equivalent modelling. As seen in Fig. 8, severaldifferent R and C pairs are formed to be determined by thenumerical model, e.g. resistance of PBS diluted whole blood(Rblood), the antibody solution (Ranti) and capacitance of PBSdiluted whole blood (Cblood) and the antibody solution (Canti).
In order to obtain the values of circuit components, first,the experimental data were recorded. By sweeping the ap-plied frequency from 50 kHz to 2 MHz with a constant excita-tion voltage of 1 Vp–p, we examined the signal obtained fromfour different droplets: a whole blood droplet, an antibody se-rum droplet, an agglutination-positive droplet and an aggluti-nation-negative droplet. Then, the equivalent lumped ele-ment model was introduced in LTspice, which is a SPICEsimulator software program to obtain the impedance spec-trum of the circuit. A sample numerical impedance spectrumresult for the antibody serum droplet is shown in the ESI.†The lumped model for each of the scenarios shown in Fig. 8was formed in the SPICE simulator environment. Then, thevalues for the circuit elements were iteratively changed, untilthe simulated impedance spectrum converged with the exper-imental results. Starting from the simplest case, i.e. the opencircuit impedance of the detection system with probes, we
Fig. 6 The impedance signal and optical microscopy images foragglutination-positive droplets (Anti-A solution and A Rh+ blood sam-ple) obtained at four different dilution rates: a) 1 : 2, b) 1 : 4, c) 1 : 12, andd) 1 : 15. The two insets show the signal obtained for the 1 : 12 and 1 : 15diluted samples which yield the limit of detection for the presentedsystem.
Fig. 7 The impedance value for the agglutinated red blood cellsobtained from two different devices tested on different days. Themean (M) and standard deviation (SD) of multiple measurements areshown.
Lab on a ChipPaper
Publ
ishe
d on
23
May
201
6. D
ownl
oade
d by
Bilk
ent U
nive
rsity
on
26/0
6/20
16 0
9:43
:33.
View Article Online

Lab Chip, 2016, 16, 2494–2503 | 2501This journal is © The Royal Society of Chemistry 2016
Fig. 8 Equivalent circuit model of the system for five scenarios: a) the continuous phase fluid over the electrodes (i.e. no droplet), b) a wholeblood droplet diluted with PBS, c) an antibody solution droplet, d) an agglutination-positive droplet, and e) an agglutination-negative droplet. Theexperimental results for each of these five cases can be seen in Fig. 5.
Fig. 9 Bode plots obtained from the experiments performed at six different frequencies (n = 3) and the equivalent circuit simulations: a) a PBSdiluted whole blood droplet, b) an antibody solution droplet, c) an agglutination-positive droplet, and d) an agglutination-negative droplet.
Lab on a Chip Paper
Publ
ishe
d on
23
May
201
6. D
ownl
oade
d by
Bilk
ent U
nive
rsity
on
26/0
6/20
16 0
9:43
:33.
View Article Online

2502 | Lab Chip, 2016, 16, 2494–2503 This journal is © The Royal Society of Chemistry 2016
obtained the experimental results and determined the circuitelement values that fit the experimental results. First, wehave found that the probe can be modelled with serial in-ductor and parallel capacitance values of 780 nH and 150 fF,respectively. Then, incrementally we have improved thelumped model to include the elements describing themicrofluidic system. Starting from the simplest scenario,we sequentially formed the complete model. We determinedthe resistance of the continuous phase Rcon to be 10 MΩ. It isimportant to note that for any given experimental data thevalues for the electrical circuit model that converge with theexperimental data may not be unique. In order to have aunique solution set, the measurements have been performedat six different frequencies. The frequency range was se-lected so that the capacitive and inductive componentschange in order of magnitude throughout the scannedspectrum. This allowed us to observe the real and imaginaryparts of the impedance signal to find the individual R, C and Lvalues.
The experimental values and the output of the numericalSPICE model are summarized in Fig. 9 for signals obtainedfrom different droplets. The experimental results are aver-aged values of three measurements whereas the error barsshow the minimum and the maximum values. As a result,the simulated and experimentally observed values were ingood agreement.
It is worth noting that impedimetric analysis of parti-cles inside microdroplets has not been performed before.The carrier liquid and additional droplet interface poseschallenges in the analytical modelling approaches basedon Maxwell's mixture theory.39 However, the presented em-pirical approach allows us to determine the individual cir-cuit component values relatively easier. When, the resultantvalues are investigated, we conclude that the R and C valuesobtained within the droplet are consistent with the materialproperties of the bulk solutions. It is interesting to note thatthe droplet interface introduces an additional 500 pF capaci-tance to the system similar to the membrane capacitanceused for modelling individual cells in a continuous flow. Themembrane capacitance for single cells is usually reported interms of capacitance per unit area, which is on the order of afew mF m−2.36,40–42 Similarly the droplet membrane capaci-tance is found to be 1.4 mF m−2 in our system. These resultsdemonstrate that dielectric modelling of individual cells in-side droplets can be performed with a double shell singlecore model. As shown in the ESI,† the double layer capaci-tance of the system was determined to be 800 pF. Theelectrodes used in our system was 20 μm in width and 300μm in length with a spacing of 20 μm between twoelectrodes. The double layer capacitance for theseelectrodes is also in accordance with the double layer ca-pacitances reported previously.36 We should note that whenwe used wider electrodes (50 μm and 100 μm), the signalfor agglutination-positive droplets was not as distinct as theones shown in this study. This is due to the fact thatnarrowing down the electrodes decreases the measurement
volume and allows the analysis of droplets in smallerslices.
Another important component in the lumped elementmodel was the effect of the probe capacitances. We havefound that the probes that we have used for our LCR metermeasurement system can be modeled as a parallel LC system.This result and the individual values of these elements (780nH and 150 fF) were also verified by measuring the imped-ance response of through-hole components mounted on abreadboard. The consideration of the inductive term is espe-cially critical since it increases the overall impedance of thesystem at high impedance values and should be consideredtogether with the parasitic effects usually considered for hy-brid PDMS/glass microfluidic systems.
Conclusion
We have reported a microfluidic device to measure agglutina-tion reactions in microdroplets using a label-free approach.Droplets that included antibody solutions were mixed with awhole blood sample to form hemagglutination in droplets.The formation of agglutinated clusters was detectedimpedimetrically using conventional microfabricatedelectrodes. An equivalent lumped-element model of the sys-tem is derived from the experimentally measured parameters.The presented device provides a method that allows screen-ing of samples against multiple analytes for automatedagglutination-based assays. This study also demonstrates awhole blood-based assay in PDMS microfluidic channelswithout any tedious surface treatment. The impedimetric re-sults were obtained using standard solutions and wholeblood. This system does not require any specific buffers orany sample preparation for conductivity adjustment which inturn makes this method a candidate for an automated hem-agglutination system which operates with nanoliter volumeof samples.
Acknowledgements
We gratefully acknowledge support from the European UnionFP7 Marie Curie Career Integration Grant (no. 322019).
References
1 H. N. Joensson and H. Andersson-Svahn, Lab Chip, 2011, 11,4144–4147.
2 L. Rosenfeld, T. Lin, R. Derda and S. K. Tang, Microfluid.Nanofluid., 2014, 16, 921–939.
3 A. B. Theberge, F. Courtois, Y. Schaerli, M. Fischlechner, C.Abell, F. Hollfelder and W. T. Huck, Angew. Chem., Int. Ed.,2010, 49, 5846–5868.
4 Y. Zhu and Q. Fang, Anal. Chim. Acta, 2013, 787, 24–35.5 K. S. Cole and H. J. Curtis, J. Gen. Physiol., 1939, 22,
649–670.6 K. S. Cole and H. J. Curtis, J. Gen. Physiol., 1941, 24, 551–563.7 H. J. Curtis and K. S. Cole, J. Gen. Physiol., 1937, 21,
189–201.
Lab on a ChipPaper
Publ
ishe
d on
23
May
201
6. D
ownl
oade
d by
Bilk
ent U
nive
rsity
on
26/0
6/20
16 0
9:43
:33.
View Article Online

Lab Chip, 2016, 16, 2494–2503 | 2503This journal is © The Royal Society of Chemistry 2016
8 W. H. Coulter, US Pat., 2656508, 1953.9 S. Gawad, K. Cheung, U. Seger, A. Bertsch and P. Renaud,
Lab Chip, 2004, 4, 241–251.10 S. Gawad, L. Schild and P. Renaud, Lab Chip, 2001, 1, 76–82.11 D. Holmes, D. Pettigrew, C. H. Reccius, J. D. Gwyer, C. van
Berkel, J. Holloway, D. E. Davies and H. Morgan, Lab Chip,2009, 9, 2881–2889.
12 P. K. Isgor, M. Marcali, M. Keser and C. Elbuken, Sens.Actuators, B, 2015, 210, 669–675.
13 J. Janouš, J. Čech, P. Beránek, M. Přibyl and D. Šnita,J. Micromech. Microeng., 2013, 24, 015002.
14 A. P. Lee, J. Lopez-Prieto, R. Lin and M. Simon, US Pat.,20150322487, 2015.
15 S. Köster, F. E. Angile, H. Duan, J. J. Agresti, A. Wintner, C.Schmitz, A. C. Rowat, C. A. Merten, D. Pisignano and A. D.Griffiths, Lab Chip, 2008, 8, 1110–1115.
16 Y. J. Sung, J. Y. H. Kim, K. W. Bong and S. J. Sim, Analyst,2016, 141, 989–998.
17 E. W. Kemna, L. I. Segerink, F. Wolbers, I. Vermes and A.van den Berg, Analyst, 2013, 138, 4585–4592.
18 S. Makulska, S. Jakiela and P. Garstecki, Lab Chip, 2013, 13,2796–2801.
19 B. Teste, A. Ali-Cherif, J. L. Viovy and L. Malaquin, Lab Chip,2013, 13, 2344–2349.
20 D. C. Duffy, J. C. McDonald, O. J. Schueller and G. M.Whitesides, Anal. Chem., 1998, 70, 4974–4984.
21 G. F. Christopher and S. L. Anna, J. Phys. D: Appl. Phys.,2007, 40, R319.
22 T. R. Kline, M. K. Runyon, M. Pothiawala and R. F.Ismagilov, Anal. Chem., 2008, 80, 6190–6197.
23 B. Subramanian, N. Kim, W. Lee, D. A. Spivak, D. E. Nikitopoulos,R. L. McCarley and S. A. Soper, Langmuir, 2011, 27, 7949–7957.
24 M. Hashimoto, S. S. Shevkoplyas, B. Zasońska, T.Szymborski, P. Garstecki and G. M. Whitesides, Small,2008, 4, 1795–1805.
25 J. Hong, M. Choi and J. B. Edel, Lab Chip, 2010, 10,2702–2709.
26 D.-T. Phan and N.-T. Nguyen, Appl. Phys. Lett., 2014, 104,084104.
27 V. van Steijn, C. R. Kleijn and M. T. Kreutzer, Phys. Rev.Lett., 2009, 103, 214501.
28 H. Kinoshita, S. Kaneda, T. Fujii and M. Oshima, Lab Chip,2007, 7, 338–346.
29 U. Miessner, R. Lindken and J. Westerweel, Velocitymeasurements in microscopic two-phase flows by means ofmicro PIV, 2008.
30 M. Hein, M. Moskopp and R. Seemann, Lab Chip, 2015, 15,2879–2886.
31 K. Cheung, S. Gawad and P. Renaud, Cytometry, Part A,2005, 65, 124–132.
32 E. Du, S. Ha, M. Diez-Silva, M. Dao, S. Suresh and A. P.Chandrakasan, Lab Chip, 2013, 13, 3903–3909.
33 A. J. Eisfeld, G. Neumann and Y. Kawaoka, Nat. Protoc.,2014, 9, 2663–2681.
34 H. E. Ayliffe, A. B. Frazier and R. Rabbitt,J. Microelectromech. Syst., 1999, 8, 50–57.
35 T. Sun and H. Morgan, Microfluid. Nanofluid., 2010, 8,423–443.
36 H. Morgan, T. Sun, D. Holmes, S. Gawad and N. G. Green,J. Phys. D: Appl. Phys., 2006, 40, 61.
37 H.-L. Gou, X.-B. Zhang, N. Bao, J.-J. Xu, X.-H. Xia and H.-Y.Chen, J. Chromatogr. A, 2011, 1218, 5725–5729.
38 P. Dak, A. Ebrahimi and M. A. Alam, Lab Chip, 2014, 14,2469–2479.
39 T. Sun, S. Gawad, N. G. Green and H. Morgan, J. Phys. D:Appl. Phys., 2006, 40, 1.
40 H. Fricke, Phys. Rev., 1925, 26, 678–681.41 H. Fricke, Phys. Rev., 1925, 26, 682–687.42 L.-S. Jang and M.-H. Wang, Biomed. Microdevices, 2007, 9,
737–743.
Lab on a Chip Paper
Publ
ishe
d on
23
May
201
6. D
ownl
oade
d by
Bilk
ent U
nive
rsity
on
26/0
6/20
16 0
9:43
:33.
View Article Online