Lab Exercise: Paternity Analysis
12
Lab Exercise: Paternity Analysis Oct 18, 2006
Transcript of Lab Exercise: Paternity Analysis

Lab Exercise: Paternity Analysis
Oct 18, 2006

Plan For TodayFour groups each with different data set
Separate instructions for each group
Two paternity analysis programs:
Cervus for likelihood-based methodVelko for 'modified exclusion'
Determine paternity and 'gene flow' with each method
Determine how outcomes change with different parameters

Measuring gene flow by paternity exclusion
b = observed gene flow (no compatible genotype)
d = Pr (distinguishing immigrant genotype)
Local population Background
b = md
Cryptic gene flow = m(1-d)
^m= ^ __
^b
d

Likelihood Approach to Paternity Assignment
Marshall et al. (1998)
where H1 is probability male a is father,H2 is probability male a is not father
T is transition probabilityand go,gm and ga are genotypes of offspring, mother,
and alleged father, respectively

Cervus and Likelihood
Incorporates genotyping error into likelihood calculation
All males have SOME possibility of being true parentBased on observed error rates averaged across loci
Determines "critical value" (∆) based on difference in LOD between two most likely parents
Simulated populations based on observed allele frequenciesIncorporates incomplete sampling and missing data
Marshall et al. (1998)

North Atlantic humpback whales in the West Indies
No. of females 145
No. of offspring 146
No. of males 348
No. of loci 6
Polygamous
Males compete by ‘singing’ and form groups of primary escorts, challengers, and secondary escorts
Acer Laptop
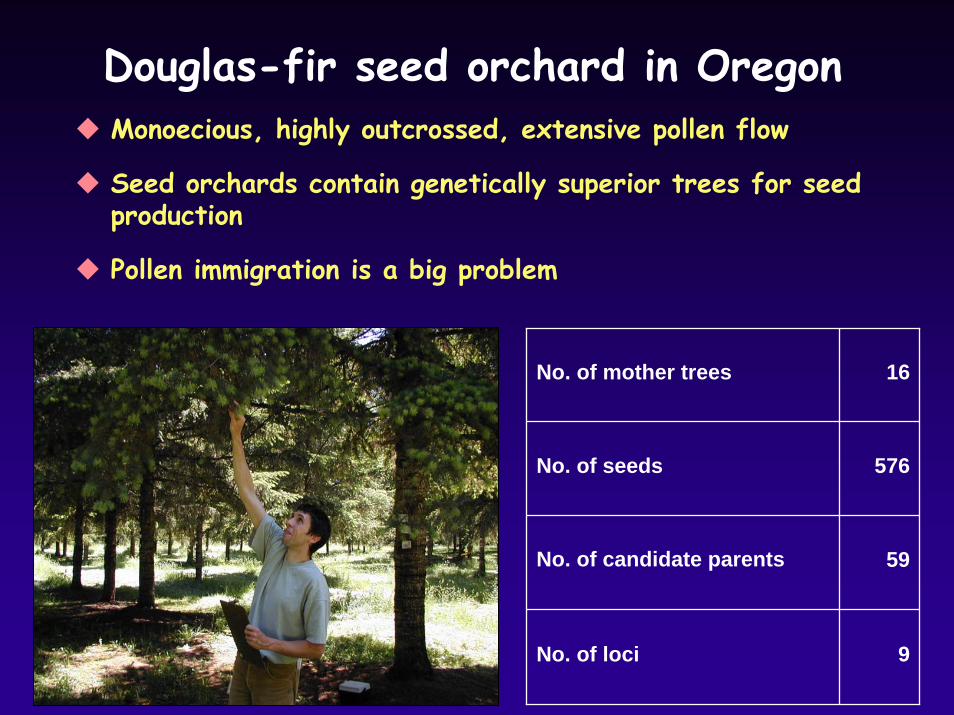
Douglas-fir seed orchard in Oregon
No. of mother trees 16
No. of seeds 576
No. of candidate parents 59
No. of loci 9
Monoecious, highly outcrossed, extensive pollen flow
Seed orchards contain genetically superior trees for seed production
Pollen immigration is a big problem

Wild Deer (Cervus elatus), Isle of Rum
No. of mothers 49
No. of offspring 49
No. of candidate parents 66
No. of loci 9
Isolated island with rare immigration
High inbreeding
Nine microsatellite loci

Populus trichocarpa Eastern Oregon (Vinson)
Completely outcrossing (dioecious)
Huge effective population size, extensive gene flow (presumably)
Ten SSR loci
12 populations, 22 mothers, 664 progeny
Gateway Desktop

10 km
Vinson Populations
Vinson

Lab Results
Allowing mismatches decreases exclusion power and geneflow estimates
Proportion of population sampled has drastic effect on Cervus
Cervus doesn't work well for estimating gene flow
Douglas-fir most robust, whales least powerful
0%
10%
20%
30%
40%
50%
60%
70%
80%
90%
100%
1 2 3 1 2 3 1 2 3 1 2 3
Gene FlowAmbiguous PaternitiesSingle Paternities
Deer Douglas-fir Poplar WhalesNumber of Mismatches for Exclusion
Velko Modified Exclusion Analyses
0%
10%
20%
30%
40%
50%
60%
70%
80%
90%
100%
0.1 0.5 1 0.1 0.5 1 0.1 0.5 1 0.1 0.5 1Deer Douglas-fir Poplar Whales
Proportion of Fathers Sampled
Cervus Likelihood Analyses
Vinson
0.0000
0.1000
0.2000
0.3000
0.4000
0.5000
0 1 2 3 4 5 6 7
Misma t c he s a llowe d

Lab Results: Comparison of Male Fecundities
Excellent correspondence for Douglas-fir: Gancho rocks!
No correspondence for whales: low power, especially for Cervus
Cervus usually overestimates fecundity, sometimes drastically
Deery = 1.3793x
012345678
0 1 2 3 4 5
Exclusion, 2 mismatches
Cer
vus,
0.5
Sam
pled
Douglas-Firy = 0.7378x
0
5
10
15
20
25
30
0 5 10 15 20 25 30 35
Exclusion, 3 Mismatches
Cer
vus,
0.1
Sam
pled
Poplary = 1.3056x
0
10
20
3040
50
60
70
0 5 10 15 20 25 30
Exclusion, 3 Mismatches
Cer
vus,
0.5
Sam
pled
Whales
0
1
2
3
4
0 1 2 3 4
Exclusion, 2 mismatches
Cer
vus,
100
% S
ampl
ed