lab 6
8
SESSION 17 ( LAB 6) ANOVA & Regression Using SPSS
description
IMT
Transcript of lab 6

SESSION 17 ( LAB 6)
ANOVA & Regression Using SPSS

ANOVA
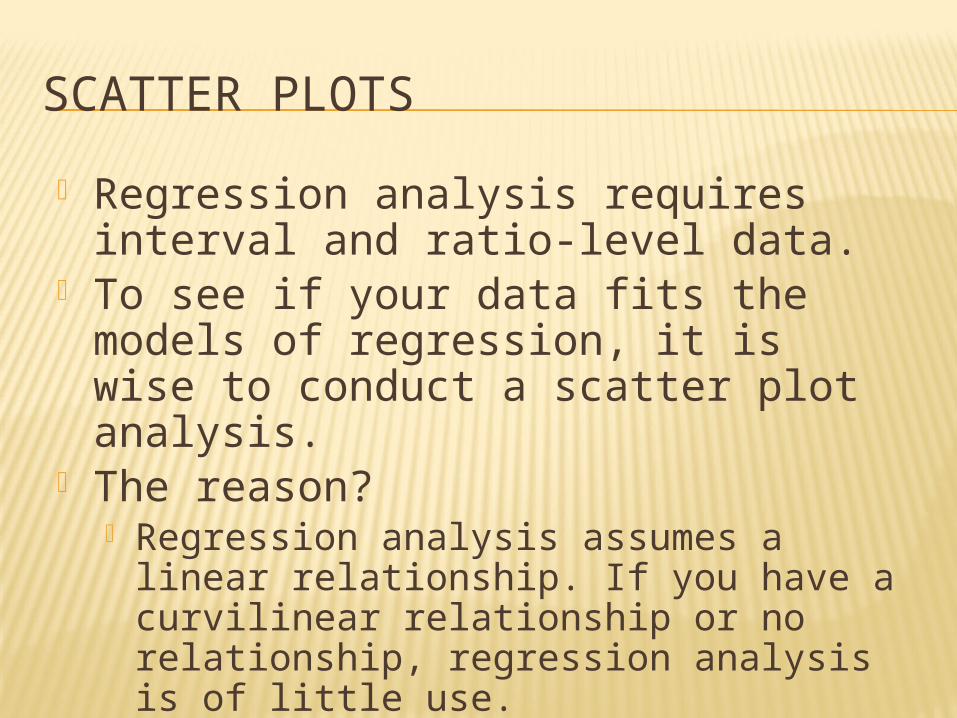
SCATTER PLOTS Regression analysis requires interval
and ratio-level data. To see if your data fits the models of
regression, it is wise to conduct a scatter plot analysis.
The reason? Regression analysis assumes a linear
relationship. If you have a curvilinear relationship or no relationship, regression analysis is of little use.

TYPES OF LINES
TYPES OF REGRESSION
Simple Multiple Logistic

EXAMPLE What factors are associated with BMI? Predict BMI.

EXAMPLE
Individual behaviors are associated with BMI. –Eating behavior: –Exercising behavior: level of exercise is negatively associated with BMI. Individual characteristics are associated with BMI. –Sex –Income –Education level –Occupation Environments associated with BMI. –Physical environment –Social environment

HYPOTHESIS
There are significant positive association between daily calorie intake and BMI
BMI significantly determine by daily Calorie Intake and time spend in daily exercise