LAB 1: INTRODUCTION TO REMOTE SENSINGuregina.ca/piwowarj/geog309/Lab1.pdf · Geography 309 Lab 1...
15
Geography 309 Lab 1 Page 1 J.M. Piwowar 2010.09.10 LAB 1: INTRODUCTION TO REMOTE SENSING Due Date: September 22 Objectives To familiarize yourself with: o remote sensing resources on the Internet o some remote sensing sensors and their uses o the course textbook o the Geomatica image analysis software Part A: Remote Sensing Resources There is a wealth of remote sensing information and data on the Internet. In order to help you become acquainted with some of the available resources on-line, I would like you to find and document some of them. Two effective ways of looking for information on the Internet are: use a search engine (e.g. Google); and look for links to related sites (once you have found one site dealing with your topic area). Procedure A1. Find and visit 5 different sites on the Internet that deal with remote sensing. • None of your 5 sites can come from the same umbrella organization. For example, you would not be able to count the Departments of Geography and Environmental Systems Engineering at UofR as two separate sites. • You cannot include the Canada Centre for Remote Sensing (CCRS) as one of your sites (since it has already been described for you, below). You are certainly encouraged to explore the abundance of information available at CCRS, however. Create a table with the following entries for each site: Real-World Location Identify the real-word name for this site. URL Give the Web location of the site's home page. Brief Description Provide a short description of the data and information available at this site. You may provide this in point form, but you must be reasonably descriptive (e.g., don't just say "imagery", say "Landsat imagery of Western Africa from 1985 to the present"). Question 1: (2 marks) Submit your table of web sites.
Transcript of LAB 1: INTRODUCTION TO REMOTE SENSINGuregina.ca/piwowarj/geog309/Lab1.pdf · Geography 309 Lab 1...

Geography 309 Lab 1 Page 1
J.M. Piwowar 2010.09.10
LAB 1: INTRODUCTION TO REMOTE SENSING
Due Date: September 22
Objectives
To familiarize yourself with:
o remote sensing resources on the Internet
o some remote sensing sensors and their uses
o the course textbook
o the Geomatica image analysis software
Part A: Remote Sensing Resources
There is a wealth of remote sensing information and data on the Internet. In order to help you
become acquainted with some of the available resources on-line, I would like you to find and
document some of them. Two effective ways of looking for information on the Internet are:
use a search engine (e.g. Google); and
look for links to related sites (once you have found one site dealing with your topic area).
Procedure
A1. Find and visit 5 different sites on the Internet that deal with remote sensing.
• None of your 5 sites can come from the same umbrella organization. For example, you
would not be able to count the Departments of Geography and Environmental Systems
Engineering at UofR as two separate sites.
• You cannot include the Canada Centre for Remote Sensing (CCRS) as one of your sites
(since it has already been described for you, below). You are certainly encouraged to
explore the abundance of information available at CCRS, however.
Create a table with the following entries for each site:
Real-World Location Identify the real-word name for this site.
URL Give the Web location of the site's home page.
Brief Description Provide a short description of the data and information available
at this site. You may provide this in point form, but you must be
reasonably descriptive (e.g., don't just say "imagery", say
"Landsat imagery of Western Africa from 1985 to the present").
Question 1: (2 marks) Submit your table of web sites.

Geography 309 Lab 1 Page 2
J.M. Piwowar 2010.09.10
For example:
Real-World Location URL Brief Description
Canada Centre for Remote Sensing
www.ccrs.nrcan.gc.ca/ccrs/homepg.pl?e
An extensive site containing information on all aspects of remote sensing from a Canadian perspective. On-line information includes:
a comprehensive summary of remote sensing satellites & sensors, including RADARSAT;
current research issues;
education al resources, including an on-line tutorial, remote sensing glossary, and FAQ;
a remote sensing image "tour" of Canada
A2. The text chosen for this course also contains a lot of useful information. Scan through the
text and identify 5 different remote sensing instruments (sensors). For each sensor, list one
application for which the authors suggest it can be used.
Create a table with the following entries for each sensor:
Sensor Remote sensors are frequently identified with both their satellite
name and the sensor name, e.g. Landsat 7 (satellite) Enhanced
Thematic Mapper (sensor) - try to separate the sensor name from
its satellite name.
Satellite sometimes called spacecraft or platform
Application The images in the book are a good source of example
applications.
Question 2: (2 marks) Submit your table of Sensors and Satellites.
For example:
Sensor Satellite Application
Enhanced Thematic Mapper (TM)
Landsat 7 monitoring forest re-growth after logging or burns
Geography 309 Lab 1 Page 3
J.M. Piwowar 2010.09.10
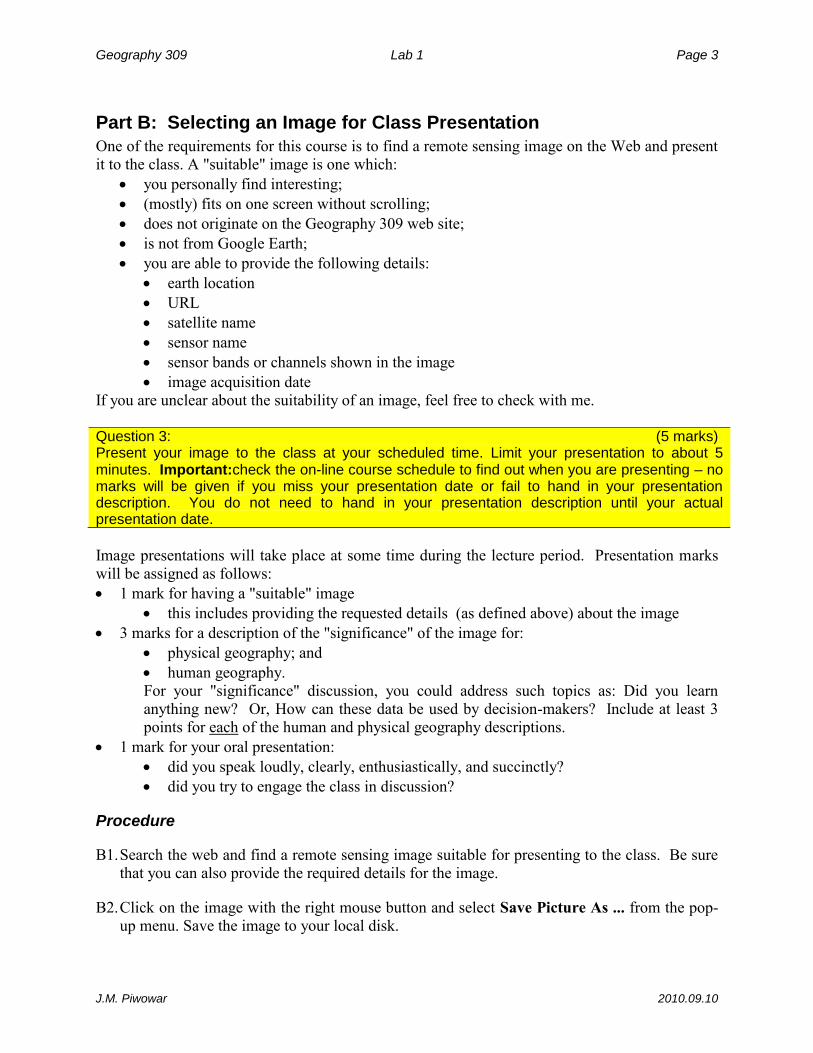
Part B: Selecting an Image for Class Presentation
One of the requirements for this course is to find a remote sensing image on the Web and present
it to the class. A "suitable" image is one which:
you personally find interesting;
(mostly) fits on one screen without scrolling;
does not originate on the Geography 309 web site;
is not from Google Earth;
you are able to provide the following details:
earth location
URL
satellite name
sensor name
sensor bands or channels shown in the image
image acquisition date
If you are unclear about the suitability of an image, feel free to check with me.
Question 3: (5 marks) Present your image to the class at your scheduled time. Limit your presentation to about 5 minutes. Important:check the on-line course schedule to find out when you are presenting – no marks will be given if you miss your presentation date or fail to hand in your presentation description. You do not need to hand in your presentation description until your actual presentation date.
Image presentations will take place at some time during the lecture period. Presentation marks
will be assigned as follows:
1 mark for having a "suitable" image
this includes providing the requested details (as defined above) about the image
3 marks for a description of the "significance" of the image for:
physical geography; and
human geography.
For your "significance" discussion, you could address such topics as: Did you learn
anything new? Or, How can these data be used by decision-makers? Include at least 3
points for each of the human and physical geography descriptions.
1 mark for your oral presentation:
did you speak loudly, clearly, enthusiastically, and succinctly?
did you try to engage the class in discussion?
Procedure
B1. Search the web and find a remote sensing image suitable for presenting to the class. Be sure
that you can also provide the required details for the image.
B2. Click on the image with the right mouse button and select Save Picture As ... from the pop-
up menu. Save the image to your local disk.

Geography 309 Lab 1 Page 4
J.M. Piwowar 2010.09.10
B3. Create a description page for your image.
Be sure your page includes:
the image
earth location
URL
satellite name
sensor name
sensor bands or channels shown in the image
image acquisition date
your name, e-mail address, and ID number
the descriptions of the "significance" of the image for physical geography and human
geography.
You may use point form.
B4. At least ONE DAY before you are scheduled to present your image (sooner, if you wish), e-
mail a copy of the image (just your image, not your description page) to me. I will post it on
the course web site for you to access during your presentation.
B5. At the start of class on your presentation day, please hand in a printed copy of your
description page for marking.

Geography 309 Lab 1 Page 5
J.M. Piwowar 2010.09.10
Example Description
Earth Location Hamilton, Ontario, Canada
URL http://www.city.hamilton.on.ca/Hamilton.jpg
Satellite Landsat 5
Sensor Thematic Mapper
Sensor Channels/Bands Shown in Image
2, 3, 4
Image Acquisition Date September 20, 1985
Geographic Significance (Human)
This is a medium-size city (by Canadian standards).
A large industrial complex is evident by infilling along the south shore of the harbour, as well as piers for large ships.
Shipping might be an important mode of transportation – although no ships are visible, a canal can be seen joining the harbour to the lake.
There does not appear to be much agriculture.
Geographic Significance (Physical)
There are 2 bays/harbours separated from the main lake by natural barriers.
The innermost bay seems to have a lot of suspended sediment (lighter blue colour).
The Niagara Escarpment is visible as a band of trees (shown in red) cutting horizontally across the city.
The land appears to be relatively flat, given the grid layout of the city streets
The strong NIR reflectance suggests that this area receives adequate rainfall to support photosynthetically active plant growth.

Geography 309 Lab 1 Page 6
J.M. Piwowar 2010.09.10
Part C: Visual Interpretation of Colour Composite Imagery
You will now examine a Landsat Thematic Mapper image of Regina using the PCI Geomatica
Image Analysis System.
Notes
A course disk has been set up where I can put data sets for your use. On the University
computer systems, you will find this disk on the T:\ drive in the folder
\Class\Geography\geog309. Note that it is not necessary to copy the file(s) from this
disk unless I give you explicit instructions to do so.
Tables 1, 2, and 3 (referred to in Questions 3, 4, and 5) are listed at the end of the lab.
You may use Geomatica FreeView for this lab … see the link at the bottom of the course
homepage.
Procedure
C1. From one of the systems in CL 109 click on the PCI Geomatica icon.
C2. In a few moments, the Geomatica toolbar should appear on your screen:
C3. There are many functions available from the toolbar, but in this course we will be primarily
using the Focus image viewer. Focus should start automatically after about 10 seconds when
you start Geomatica, but if it doesn't you can start it by licking once on the left toolbar button
and after a few moments, the Focus window will appear.
C4. Click on the Open File button and a File Selection window will be presented.
a) The image you want to use in this lab is called ReginaTM2010.pix. You will find it on
the Geography 309 course disk.1 Double-click on this file and the image should be
displayed in the Focus window.
C5. You will be looking at a Landsat TM image centred on the City of Regina but also showing
some of the surrounding urban and agricultural areas. This image was acquired on
September 7, 2010.
1 The course disk can be found on your T: drive in the folder \Class\Geography\geog309\.

Geography 309 Lab 1 Page 7
J.M. Piwowar 2010.09.10
C6. Use the zoom and pan tools (and scrollbars) to move around the image to get a feel for the
software.
C7. Now position your cursor in the middle of the UofR campus and click 2 or 3 times on the
zoom in tool . You should see the campus zoom up in the middle of your screen.
although it may be difficult to distinguish very much, especially if you get too close.
C8. Image displays commonly have 3 basic colours: red, green and blue. Remotely sensed
images may have many more channels. We are interested in exploring different ways of
showing the remote sensing data channels on an image display. Of particular note is that we
can show data acquired in spectral bands which the human eye cannot see in display colours
that we can see.
Geography 309 Lab 1 Page 8
J.M. Piwowar 2010.09.10
Athough there are many different band combinations possible, the two most common are:
For a true colour composite image,
display the:
For a standard false-colour composite image,
display the:
Sensor's Blue band in display Blue
Sensor's Green band in display Green
Sensor's Red band in display Red.
Sensor's Green band in display Blue
Sensor's Red band in display Green
Sensor's Near IR band in display Red.
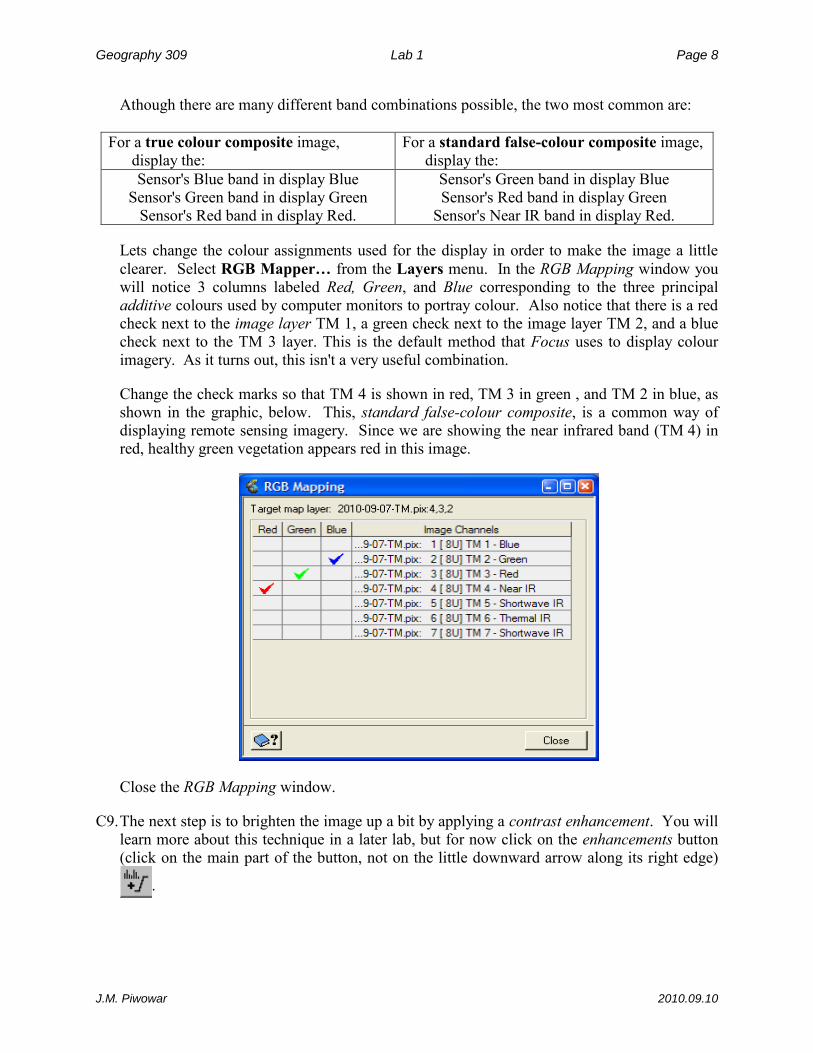
Lets change the colour assignments used for the display in order to make the image a little
clearer. Select RGB Mapper… from the Layers menu. In the RGB Mapping window you
will notice 3 columns labeled Red, Green, and Blue corresponding to the three principal
additive colours used by computer monitors to portray colour. Also notice that there is a red
check next to the image layer TM 1, a green check next to the image layer TM 2, and a blue
check next to the TM 3 layer. This is the default method that Focus uses to display colour
imagery. As it turns out, this isn't a very useful combination.
Change the check marks so that TM 4 is shown in red, TM 3 in green , and TM 2 in blue, as
shown in the graphic, below. This, standard false-colour composite, is a common way of
displaying remote sensing imagery. Since we are showing the near infrared band (TM 4) in
red, healthy green vegetation appears red in this image.
Close the RGB Mapping window.
C9. The next step is to brighten the image up a bit by applying a contrast enhancement. You will
learn more about this technique in a later lab, but for now click on the enhancements button
(click on the main part of the button, not on the little downward arrow along its right edge)
.

Geography 309 Lab 1 Page 9
J.M. Piwowar 2010.09.10
C10. Study the satellite image. You should be able to identify Wascana Lake, the Campus
Green between the Library and the Education buildings, and – with some imagination -
several of the buildings on campus.
C11. Now lets have a look at a true colour composite image of the same data. Create a new
view of the image by clicking on the Launch the Add Layer Wizard button .
C12. When the Add Layer Wizard appears specify that you wish to add an RGB layer and then
click Next >.
C13. Now select the channels you wish to display in Red, Green, and Blue to create a True
Colour Composite image (refer to the table above):
a) Click on the Red button and then select the image channel you wish to show in red;
b) Click on the Green button and then select the image channel you wish to show in green;
c) Click on the Blue button and then select the image channel you wish to show in blue;
d) Click Finish to display the image.
Note that the new layer is drawn on top of your original view thereby obscuring it. You can
toggle back and forth between your colour composites by turning the RGB Layer off and on
(off to show the lower true colour composite; on to overlay the false colour composite). You
change a layers visibility by clicking on its visibility check box:
Further, if you zoom or pan around the image in one colour mode, your actions are
mirrored in the other colour composite.
Question 4: (3 marks) (a) Complete Table 1 for the Landsat TM. (b) Is it possible to create a true colour composite display of SPOT HRV data? Why/Why
not? (c) Is it possible to create a standard false colour composite of SPOT HRV data?
Why/Why not?
Clearly, it is not possible to observe everything about Regina in a Landsat TM image. Table 2 is
a list of the typical types of surface features that we can identify in Landsat imagery (see

Geography 309 Lab 1 Page 10
J.M. Piwowar 2010.09.10
http://landcover.usgs.gov/classes.php for a description of the feature types). You might also find
the 2010 Field Photographs link on the course website useful for viewing some of the crop
types in Google Earth or Google Maps.
Question 5: (1 mark) Locate and identify good examples of the land covers and land uses listed in Table 2 and describe their tone/colour in each composite image. You may not find examples of every land cover / land use class listed in Table 2 in the image. Only complete the parts of the table that you can see in the image. Refer to http://landcover.usgs.gov/classes.php for a description of each land use / land cover type class.
Question 6: (2 marks) You were able to identify the land use / land cover classes in Table 2 largely because you know Regina and you knew where to find them. How do you think you could find these classes in an area that you were not familiar with?
Question 7: (1 mark) For each Task listed in Table 3, which colour composite image do you think provides the most information? Why do you think so?
Note the annotation along the bottom of the Focus window:
In particular, the cursor location coordinates let you know the current location of your cursor
and the pixel values tell you the pixel data for the channels currently in the display. Note how
these values change as you move your cursor across the screen. The pixel values readings can be
quite useful, but you need to remember which image bands you have loaded into the
corresponding red, green, and blue display channels. If the displayed image in the above
example was a true colour composite Landsat TM scene, then I could read that at the pixel
location (UTM 522500E 5581900N) TM 1 has a value of 15, TM 2 has a value of 12, and TM 3's
value is 12.
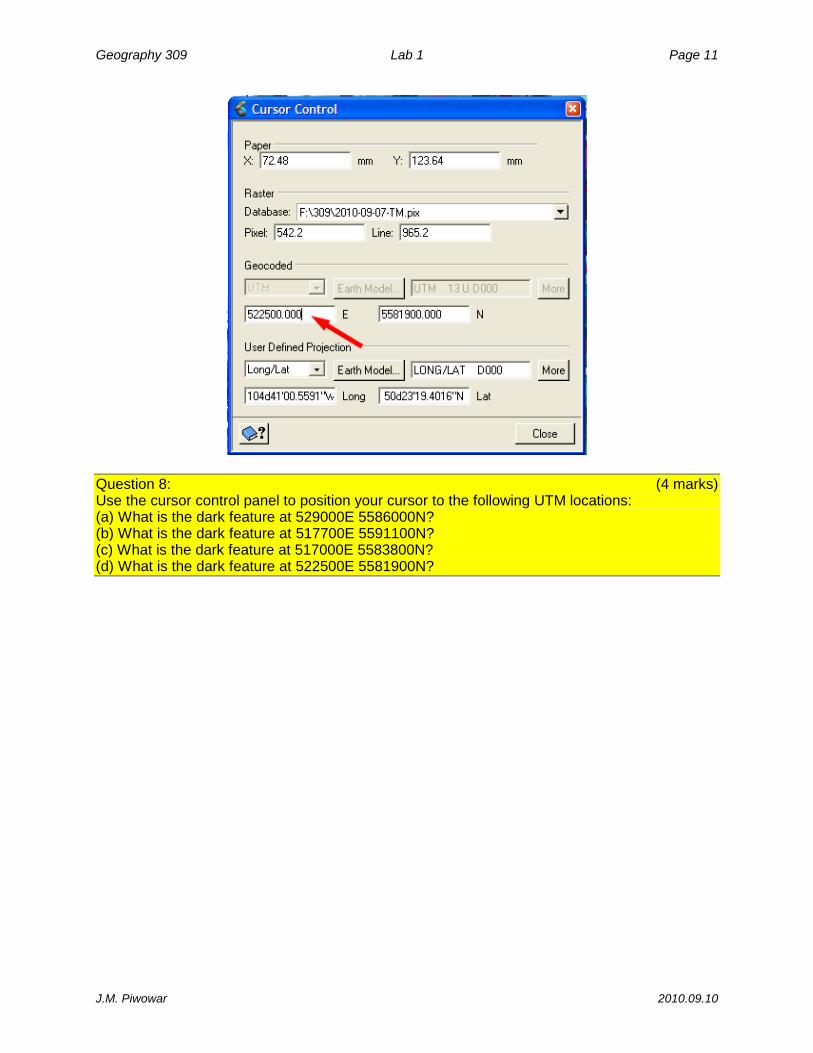
If you wanted to navigate to a particular location on your image, you could use the cursor
control button to open a window where you can enter your cursor coordinates directly.
Since the image you are working with has been georeferenced to the Universal Transverse
Mercator (UTM) projection, you can enter locations in UTM coordinates by typing them into the
Geocoded section of the window:
display
scale
display
magnification
cursor location
coordinates
pixel values at the cursor for the
Red, Green and Blue bands
Geography 309 Lab 1 Page 11
J.M. Piwowar 2010.09.10
Question 8: (4 marks) Use the cursor control panel to position your cursor to the following UTM locations: (a) What is the dark feature at 529000E 5586000N? (b) What is the dark feature at 517700E 5591100N? (c) What is the dark feature at 517000E 5583800N? (d) What is the dark feature at 522500E 5581900N?

Geography 309 Lab 1 Page 12
J.M. Piwowar 2010.09.10
NAME: ID #
LAB 1: INTRODUCTION TO REMOTE SENSING
Answer Sheets
Due Date: September 22
Question 4: (3 marks) (a) Complete Table 1 for the Landsat TM. (b) Is it possible to create a true colour composite display of SPOT HRV data? Why/Why
not? (c) Is it possible to create a standard false colour composite of SPOT HRV data?
Why/Why not?
Table 1: Common Colour Combinations for Composite Displays
Band Spectral Name [blue, green, red, near IR, middle IR, thermal IR]
True Colour Composite Display Colour [red, green, blue]
Standard False Colour Composite Display Colour [red, green, blue]
TM 1
TM 2
TM 3
TM 4
(b) Is it possible to create a true colour composite display of SPOT HRV data? Why/Why
not?
(c) Is it possible to create a standard false colour composite of SPOT HRV data? Why/Why
not?
Geography 309 Lab 1 Page 13
J.M. Piwowar 2010.09.10
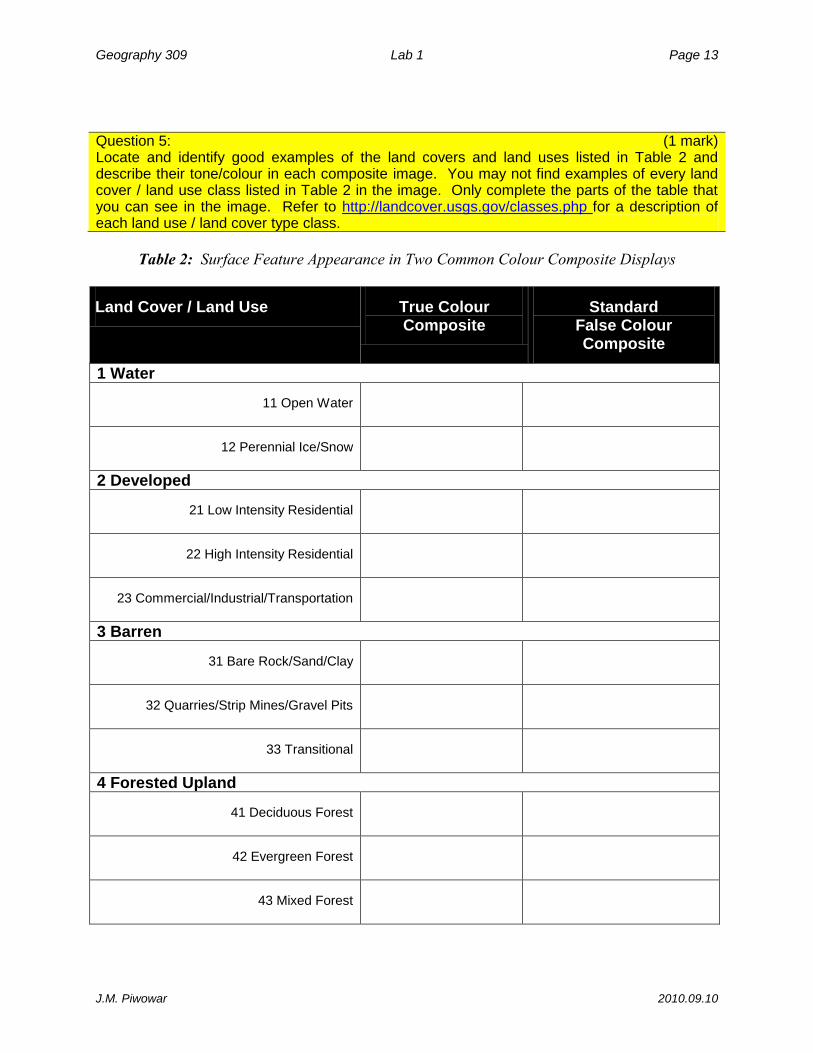
Question 5: (1 mark) Locate and identify good examples of the land covers and land uses listed in Table 2 and describe their tone/colour in each composite image. You may not find examples of every land cover / land use class listed in Table 2 in the image. Only complete the parts of the table that you can see in the image. Refer to http://landcover.usgs.gov/classes.php for a description of each land use / land cover type class.
Table 2: Surface Feature Appearance in Two Common Colour Composite Displays
Land Cover / Land Use True Colour Composite
Standard False Colour Composite
1 Water
11 Open Water
12 Perennial Ice/Snow
2 Developed
21 Low Intensity Residential
22 High Intensity Residential
23 Commercial/Industrial/Transportation
3 Barren
31 Bare Rock/Sand/Clay
32 Quarries/Strip Mines/Gravel Pits
33 Transitional
4 Forested Upland
41 Deciduous Forest
42 Evergreen Forest
43 Mixed Forest

Geography 309 Lab 1 Page 14
J.M. Piwowar 2010.09.10
5 Shrubland
51 Shrubland
6 Non-Natural Woody
61 Orchards/Vineyards/Other
7 Herbaceous Upland Natural/Semi-natural Vegetation
71 Grasslands/Herbaceous
8 Herbaceous Planted/Cultivated
81 Pasture/Hay
82 Row Crops
83 Small Grains
84 Fallow
85 Urban/Recreational Grasses
9 Wetlands
91 Woody Wetlands
92 Emergent Herbaceous Wetlands
Question 6. (2 marks) You were able to identify the land use / land cover classes in Table 2 largely because you know Regina and you knew where to find them. How do you think you could find these classes in an area that you were not familiar with?

Geography 309 Lab 1 Page 15
J.M. Piwowar 2010.09.10
Question 7: (1 mark) For each Task listed in Table 3, which colour composite image do you think provides the most information? Why do you think so?
Table 3: Applications of Colour Composite Displays
Task
Which Composite
Image is Better?
Why do you Think So?
differentiating water from land
delineating the residential street network
differentiating the built environment from the natural environment
Question 8: (4 marks) Use the cursor control panel to position your cursor to the following UTM locations: (a) What is the dark feature at 529000E 5586000N? (b) What is the dark feature at 517700E 5591100N? (c) What is the dark feature at 517000E 5583800N? (d) What is the dark feature at 522500E 5581900N?