LA FRANCAISE DE L’ENERGIE · LA FRANCAISE DE L’ENERGIE A public limited company (société...
40
1 LA FRANCAISE DE L’ENERGIE A public limited company (société anonyme) with share capital of € 5,065,174 Registered office: 1 avenue Saint-Remy, Espace Pierrard, 57600 Forbach Sarreguemines Trade and Companies Register no. 501 152 193 HALF YEAR FINANCIAL REPORT 31 DECEMBER 2016
-
Upload
phungkhanh -
Category
Documents
-
view
215 -
download
0
Transcript of LA FRANCAISE DE L’ENERGIE · LA FRANCAISE DE L’ENERGIE A public limited company (société...

1
LA FRANCAISE DE L’ENERGIE
A public limited company (société anonyme) with share capital of € 5,065,174
Registered office: 1 avenue Saint-Remy, Espace Pierrard, 57600 Forbach
Sarreguemines Trade and Companies Register no. 501 152 193
HALF YEAR FINANCIAL REPORT
31 DECEMBER 2016

2
1. DECLARATION BY THE PERSON RESPONSIBLE
1.1 PERSON RESPONSIBLE FOR THE INFORMATION
Mr. Julien Moulin, Chairman of the Board of Directors and Chief Executive Officer.
1.2 CERTIFICATION BY THE PERSON RESPONSIBLE
To the best of my knowledge, the financial statements for the past financial half year were
prepared in accordance with applicable accounting standards and provide a true image of the
assets, financial position and income of the Company, and all companies included in the
Group’s scope, and the management report included in this half year financial report presents
a true picture of changes in the business, income and financial position of the Company and
all the companies included in the Group’s scope as well as a description of all the main risks
and uncertainties with which they are confronted.
Forbach, France, 30 March 2017
Julien MOULIN
Chairman of the Board and CEO

3
2. HALF YEAR MANAGEMENT REPORT
The board of directors of La Française de l’Energie (the “Company”) met on 30 March 2017
and approved the accounts for the first half year of the fiscal year 2016/2017. These
consolidated half-year financial statements have been subject to a limited review by the
Statutory Auditors.
2.1 BUSINESS ACTIVITY AND DEVELOPMENT OF THE COMPANY AND
GROUP DURING THE PRECEDING FINANCIAL YEAR
In July 2016, the Company began the operational integration and tax consolidation processes
for the legal entities acquired in the 2016 financial year as described below:
On 13 October 2016, Gazonor entered into a letter of intent with the 2G Energy AG Group to
order six engines of 1.5 MW each. These engines were subsequently ordered beginning of
November for the four sites at Lens, Avion, Divion and Desiree for Gazonor to start capturing
coal mine methane and convert this gas into green electricity. The delivery for the engines and
compressors is scheduled for April and May 2017 – with the target to have all 6 engines (9
MW of installed capacity) commissioned and in operations by end of June 2017.
The half year gas sales amounted to € 1,859,671 as at 31 December 2016. The current run-rate
of the Group (SG&A and other overheads) amounted to circa € 400,000 per month, in line
with the Group forecast provided at IPO, despite of the coasts resulting by the strengthening
of the operational team. In addition, the Group is confident to improve further its operating
margin from the gas sales at Gazonor with the implementation of additional efficiency
improvements such as the replacement old engine and compressor installations by electric
drive engines. This new set up will also significantly improve the carbon footprint of the
operations with no requirement of fuel oil usage and substantial reduction in down-times due
to repeated maintenance on the old engines and compressors. These operational
improvements should be effective before the end of the year 2017.
As of the date this report, the Company is completing the drilling of the Lachambre well and
will start its production test in April. The Company is currently preparing for the drilling of
the next well at Pontpierre as part of its ongoing drilling campaign in Lorraine. The drilling
program’sobjective is to develop four production pads in Lorraine and start production of its
first local gas during the second half of the calendar year 2017. The on-going short term
drilling development program will cost a total of less than € 20 million, a significant cost
reduction of ca. 20% versus the initial budget. The Company has also increased its staffing
levels by hiring for its Lorraine operations three people, including a drilling engineer, a
drilling advisor and a chief procurement officer, to achieve these cost reduction and
operational improvements objectives.
The Company spuds the first well on 7 December 2016, stopped for 10 days around
Christmas and restarted the drilling on January 2017. To date, 7 coal seams with true vertical
thicknesses ranging from 1.8 meters to 10.8 meters with an average gas content of over 10m3
per ton have been recognized between 950 and 1200 meters thanks to the stratigraphic section
of the Lachambre well. The number of coal seams and the overall thickness of the coal section

4
are in line with the expectations of the Company based on the 3D Petrel model built by the
Company. The gas content is a positive surprise being on average 40% higher than expected.
On 22 September 2016, the framework financing agreement with RGreen Invest for up to
€60,000,000 which was initially signed in May 2016, was extended until 31 December 2016.
At the date of this report, the Company has decided not to extend the RGreen facility. Given
the operational progress and the granting of the guaranteed feed in tariff, management of the
Company will decide on the best financing infrastructure before the Financial year ending 30
June 2017.
As at date of the report, the Company has sufficient working capital and access to other
financing options to meet its current obligations and working capital needs for the next 12
months.
In order to continue the development programs in Lorraine and Nord Pas de Calais, it has
been decided to recourse to new means of financing before the end of June 2017. This funds
optimization approach related to the projects are intended to reduce the cost of capital
associated with the activities of the Group. The Company has indeed identified several
options such as debt financing and asset back financing options either at the Group or
subsidiary’s level, with very favorable terms which is expected to significantly reduce the
cost of capital of the Company and allow for a full financing of its future investment needs
for 2018 onwards.
From July 2017 onwards, the Group will be able to cover its entire working capital needs
from gas and electricity sales at Gazonor.
The Company as of the date of the Report has not drawn down on any of the available
financing options but will draw upon debt financing before the end of the financial year end
30 June 2017.
In November 2016, the Company started a legal action against Société Générale, the lead
bank of the Company’s IPO on Euronext, to claim the reimbursement of part of the fees
related to this transaction. The Company indeed considers that Société Générale wrongly
retained an amount of fees exceeding the fees to which Société Générale was entitled.

5
3. FINANCIAL RESULTS FOR HALF YEAR 2016/2017
3.1 FINANCIAL RESULTS
The Group generated operating revenues of € 1,859,671 for the six-month period ending 31
December 2016, generated mainly from Gazonor (following its acquisition made through the
acquisition of its holding company Transcor Astra Luxembourg SA, since then renamed
LFDE International SA, hereinafter « LFDE International »). In the previous accounting
periods, the group did not generate any revenues.
The operating result, before interest, depreciation and amortisation (EBITDA) amounted to a
loss of € 1,069,847 for the half year to 31 December 2016 compared to a loss of € 1,512,766
for the half year to December 2015. The decrease in losses in the operating results mainly
relates to the gas sales contribution of Gazonor and to certain base cost reductions over the
last six months. The operating loss is mainly driven by the SG&A of the Group amounting to
€ 2,543,828 and inventory purchases for operations amounting to € 541,540. This SG&A
includes the wages and salaries of the Group. Furthermore, substantial expenses in relation to
legal fees and remaining payments for IPO advisory settled during the first months of the first
half year ended 31 December are included in these costs. During the first semester of the
financial year ending 2017, an amount of 449.412 € related to the share based payment
approved on 30 June 2016, have also been recorded in the SG&A costs. We expect a
significant reduction of our working capital needs in the current financial half year up to 30
June 2017.
The net financial result amounts to a loss of € 1,768,956 for the first half of the financial year
ended 31 December 2016 versus € 1,878,836 for the first half of the financial year ended
31 December 2015.
3.1.1 Revenues
During the first semester of the financial year ending 30 June 2017, the Company generated
revenues from operating activities amounting to € 1,859,671. This relates to the production
and sale of gas at Gazonor SAS in Nord Pas de Calais through an off-take contract with Total
Gas and Power, our long-term client in Northern France.
3.1.2 Other income
Other income of € 155,850 generated in the first half of the financial year ended 31 December
2016 was in relation to the penalty payment from the French government in respect of a
delayed renewal of the permits in Nord Pas des Calais and a repayment of court fees for the
cancelation of the arbitration between Trancor Astra Luxembourg and the Company as part of
the Gazonor acquisition on 27 June 2016.

6
3.1.3 Operating expenses
The detailed operating expenses are outlined in the table below:
Other operating expenses 6 months 6 months 12 months
31
December
2016
31
December
2015
30
June
2016
€ € €
Salaries and wages 1,351,300 722,704 1,573,439
Office and building rentals 51,848 42,707 86,949
Consulting, legal
& other fees
667,503 395,308 2,918,082
Marketing / PR 25,809 122,627 530,097
Taxes 56,721 9,633 13,617
Electricity, consumables and energy 2,861 1,739 6,309
Other general expenses 387,786 218,048 527,835
Total 2,543,828 1,512,766 5,656,328
On an adjusted basis, other operating expenses were 68.2% higher than last year (mainly due
to the acquisition of Gazonor). Salaries and wages amounted to € 1,351,300 and all other
SG&A amounted to € 1,192,528 as shown above. Consulting, legal and other fees amounted
to € 134,163 mainly relate to legal fees in relation to the IPO, audit fees and corporate
consulting for an amount of € 272,726 and other external services in relation to the on-going
projects amounted to € 260,160. Other general expenses include corporate insurance
payments, travelling and subsistence, costs of an ERP implementation and IT upgrades in
relation to the acquisition of Gazonor to continue to strengthen our monitoring of the
operations and continue to improve financial controls in the Company
The Group has, on consolidated basis, higher employee and management costs since the
acquisition of Gazonor. The Group, however, streamlined the management of Gazonor and
also reduced the base costs of the group on a combined level. One offs redundancy costs
amounted to € 177,784 were significant during this first half and we expect an ongoing
reduction of our overall cost base going forward.
3.1.4 Cost of financial debt and other financial expenses
Financial expenses of € 337,825 were lower for the first six months ended 31 December 2016
due to the conversion of the convertible bonds at IPO date of the Group in June 2016. As a
result, the company has no more short term financial liabilities on its balance sheet.
Financial expenses correspond to the impact of the fair value adjustment of the debt to
EGLUK for an amount of € 229,000 (see note 18 to the consolidated financial statements) and
to the decrease in value of the liquidity contract in place with Aurel for an amount of
€ 108,825 for the first six months ended December 31, 2016.

7
3.1.5 Capitalised expenses
Intangible assets
The above analysis of the Company’s income statement does not reflect amounts allocated to
exploration costs on existing permits, as these are capitalised and are therefore not included in
the Company’s income statement.
Total capitalised exploration costs relating to the Company’s exploration permits for the
Lorraine project are presented in the table below:
€
Bleue Lorraine 29,738,630
Bleue Lorraine Sud 299,103
Total costs relating to
Lorraine permits
30,037,733
The substantial amount of capitalised expenses recognised for the Bleue Lorraine permits
reflects the costs of the drilling campaigns conducted in the past and, more recently, the on-
going drilling activities at Lachambre and site preparations for the 4 wells drilling campaign.
Total exploration expenses capitalised by the Company as part of the Nord-Pas-de-Calais
exploration program mainly relate to seismic processing work, permit applications, data
processing, Petrel software modelling and DAOTMs (applications for authorisation to launch
mining works). The breakdown of these capitalised expenses is presented below:
Valenciennois (NPC)
€
229,080
Sud-Midi (NPC) 366,684
Poissonnière (NPC) 394,283
Total expenses linked to NPC permits 990,047
Capitalised exploration costs for activities at Gardanne and Lons-le-Saunier are presented
below:
Lons-le-Saunier
€
220,061
Gardanne 74,259
Total expenses for other projects 294,320
Expenses related to operations in Gardanne and Lons-le-Saunier pertain to geological studies
and other mining work conducted in the past.
Finally, an amount of €1.941.770 has been recorded as intangible assets in respect of the
exploration permit ‘’ La Folie De Paris’’, held since the acquisition of Concord Energy Inc.,
without any evolution since the financial year ended 30 June 2016.

8
Tangible assets
Work in progress in relation to the electricity project at Gazonor amounted to € 1,009,122
during the first half of 2017.
3.2 PRINCIPAL RISKS AND UNCERTAINTIES
The Company does not anticipate any substantial changes in its risks, as described in
Chapter 4 of its annual financial report for fiscal year 2015/2016 published on October 31,
2016, which may have an impact on the second semester of the financial year end 30 June
2017. The Company has not identified new risks compared to the risks already identified and
the liquidity risks are set out in Note 21 to the half year consolidated financial statements.
3.3 FUTURE OUTLOOK
The Company believes that the outlook for growth in the Group’s businesses is promising.
Firstly, France and Europe are increasingly dependent on Russian natural gas and are hoping
to reduce dependence by importing American shale gas, which is arriving in Europe in the
form of LNG.
Furthermore, France and Europe are committed to reducing their carbon footprints through
energy transition. A move away from coal and nuclear power means gas is becoming more
important in the balancing of the energy mix in Europe and with the expected implementation
of a carbon tax at some point in the near future.
Our business, which focuses on the production of local clean gas for the benefit of regional
retail and industrial consumers through the establishment of short supply chains, is a real
solution for reducing the carbon footprint of the regions in question: replacing imported
natural gas with cleaner local gas.
In Nord-Pas-de-Calais, our gas production activity has been affected by a decrease of the gas
prices and a limited availability of machinery over the summer. However the pricing
environment has picked up again and it is anticipated that gas prices will stabilise at around
€ 15/MWh of gas. In addition, the mechanical improvements made to the gas production and
compression equipment at the Avion site are intended to significantly improve machine
availability in order to boost the gas volumes injected into the network.
At the same time, Gazonor is developing a new business line dedicated to the production of
green electricity from the gas captured in the former coal mines before it goes to the
atmosphere. This activity benefits from a subsidised green feed-in tariff under the decree
published on 4 November 2016 by the French State. This decree provides for a 15 years
guaranteed feed-in tariff for any power produced from captured coal mine methane. The
Company is therefore accelerating the development of this new activity and the installation of
the first 9 MW of Jenbacher 420 engines at four different sites in Nord Pas de Calais is
expected to be completed by June 2017.
The Group is also continuing to assess growth and development opportunities in bordering
countries and notably in Belgium and Germany.

9
In Lorraine, the drilling of the Lachambre well is about to be completed with the objective to
dewater and test our initial gas production before the financial year end 30 June 2017.
Studies continue in the other areas of the Lorraine basin in order to set up next drilling sites
and to obtain the certification of new proven reserves before launching production operations
on those sites.
As at date of the report, the Company has sufficient working capital and access to other
financing options to meet its current obligations and working capital needs for the next 12
months.
In order to continue the development programs in Lorraine and Nord Pas de Calais, it has
been decided to recourse to new means of financing before the end of June 2017. This funds
optimization approach related to the projects are intended to reduce the cost of capital
associated with the activities of the Group. The Company has indeed identified several
options such as debt financing and asset back financing options either at the Group or
subsidiary’s level, with very favorable terms which is expected to significantly reduce the
cost of capital of the Company and allow for a full financing of its future investment needs
for 2018 onwards.
From July 2017 onwards, the Group will be able to cover its entire working capital needs
from gas and electricity sales at Gazonor.
The Company as of the date of the Report has not drawn down on any of the available
financing options but will draw upon debt financing before the end of the financial year end
30 June 2017.
3.4 RELATED PARTY TRANSACTIONS
The information regarding transaction with related parties is presented in Note 18 of the half-
year consolidated financial statements set forth in Chapter 4 of this report.
10
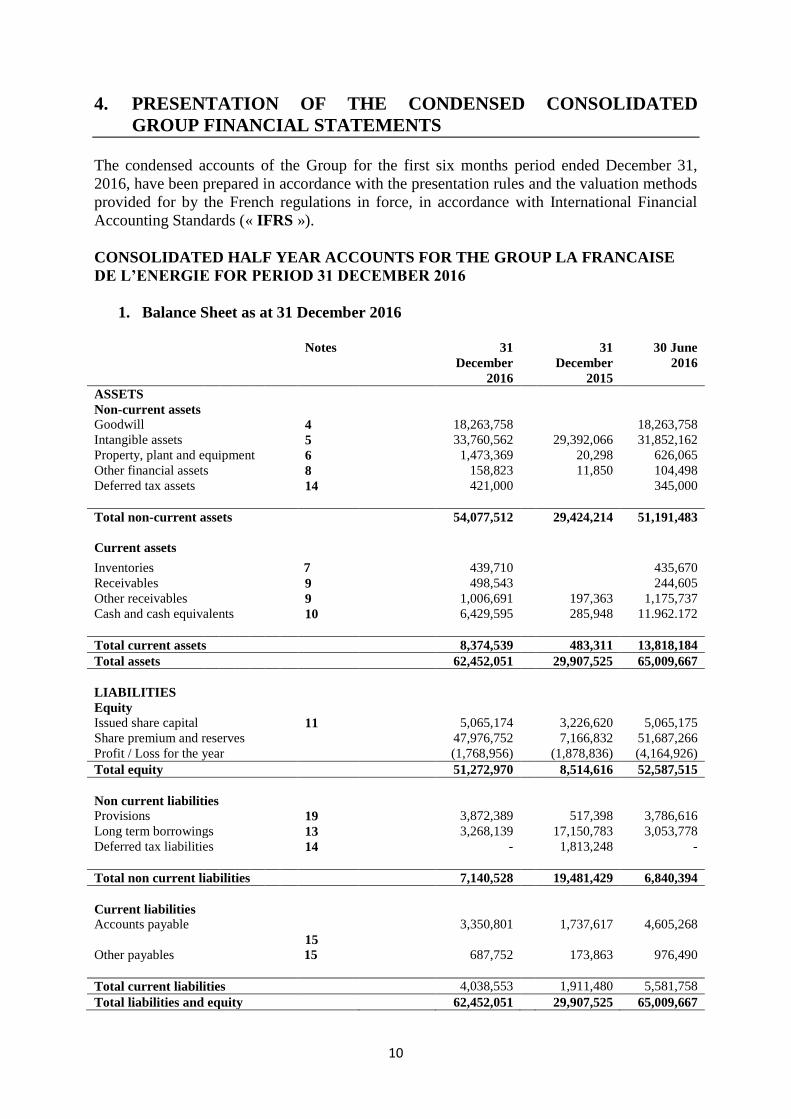
4. PRESENTATION OF THE CONDENSED CONSOLIDATED
GROUP FINANCIAL STATEMENTS
The condensed accounts of the Group for the first six months period ended December 31,
2016, have been prepared in accordance with the presentation rules and the valuation methods
provided for by the French regulations in force, in accordance with International Financial
Accounting Standards (« IFRS »).
CONSOLIDATED HALF YEAR ACCOUNTS FOR THE GROUP LA FRANCAISE
DE L’ENERGIE FOR PERIOD 31 DECEMBER 2016
1. Balance Sheet as at 31 December 2016
Notes 31
December
2016
31
December
2015
30 June
2016
ASSETS
Non-current assets
Goodwill 4 18,263,758 18,263,758
Intangible assets 5 33,760,562 29,392,066 31,852,162
Property, plant and equipment 6 1,473,369 20,298 626,065
Other financial assets 8 158,823 11,850 104,498
Deferred tax assets 14 421,000 345,000
Total non-current assets 54,077,512 29,424,214 51,191,483
Current assets
Inventories 7 439,710 435,670
Receivables 9 498,543 244,605
Other receivables 9 1,006,691 197,363 1,175,737
Cash and cash equivalents 10 6,429,595 285,948 11.962.172
Total current assets 8,374,539 483,311 13,818,184
Total assets 62,452,051 29,907,525 65,009,667
LIABILITIES
Equity
Issued share capital 11 5,065,174 3,226,620 5,065,175
Share premium and reserves 47,976,752 7,166,832 51,687,266
Profit / Loss for the year (1,768,956) (1,878,836) (4,164,926)
Total equity 51,272,970 8,514,616 52,587,515
Non current liabilities
Provisions 19 3,872,389 517,398 3,786,616
Long term borrowings 13 3,268,139 17,150,783 3,053,778
Deferred tax liabilities 14 - 1,813,248 -
Total non current liabilities 7,140,528 19,481,429 6,840,394
Current liabilities
Accounts payable
15
3,350,801 1,737,617 4,605,268
Other payables 15 687,752 173,863 976,490
Total current liabilities 4,038,553 1,911,480 5,581,758
Total liabilities and equity 62,452,051 29,907,525 65,009,667

11
2. Consolidated Income Statement
Notes
6 months
31 December
2016
6 months
31 December
2015
12 months
30 June
2016
Sales 1,859,671 - -
Other income 155,850 - -
Material purchases
General and administrative expenses 22
(541,540)
(2,543,828)
-
(1,512,766)
-
(5,656,328)
Amortisation of tangible assets and
mineral rights (168,397) (5,538) (11,816)
Provisions (96,294)
Operating Profit (1,334,538) (1,518,304) (5,668,144)
Other income - - -
Other expenses - - -
Cost of net debt - (600,000) (1,113,750)
Other financial income - - -
Other financial charges (337,825) (690,000) (1,237,000)
Net foreign exchange difference 1,488 (4,532) (2,209)
Profit before goodwill and tax (1,670,875) (2,812,836) (8,021,102)
Negative goodwill - - 1,189,556
Income taxes
14 (98,080) 934,000 2,666,622
Consolidated net loss (1,768,956) (1,878,836) (4,164,926)
Net loss – equity holder of the
parent
(1,768,956) (1,878,836) (4,164,926)
Total comprehensivce loss (1,768,956) (1,878,836) (4,164,926)
Earnings per share (0,35) (0,58) (1,26)
Fully diluted earnings per share
(0,35)
(0,58)
(1,23)

12
3. Consolidated statement of change in equity
Shares
Number
Issued
Amount
Issued share
capital
Consolidated
Retained
earnings
Total
Equity
€ € €
As at 1 July 2015 3,226,620 3,226,620 5,682,601 8,909,221
Net income/(loss) for the year 2016 (4.164.926) (4.164.926)
New issue of shares – Initial Public offering 1,388,889 1,388,889 36,111,114 37,500,003
,
Transaction costs (1.204.561) (1.204.561)
Conversion of convertible loan note 449,666 449,666 9,263,118 9,712,784
Fair value adjustment
- - (5.247.000) (5.247.000)
Forgiveness of debt - - 8,000,000 8,000,000
Income tax on loan forgiveness (2.667.253) (2.667.253)
Deferred tax on fair value adjustment - - 1,749,248 1,749,248
As at 30 June 2016 5,065,175 5,065,175 47,522,340 52,587,515
As at 1 July 2016 5,065,174 5,065,174 47,522,340 52,287,515
Net income / (loss) for the Half Year 31
December 2016
- - (1,768,956) (1,768,956)
Fair value adjustment (note 14) - - 5,000
Share based payments (note 13) - - 449,412 449,412
Forgiveness of debt (note 14) - - - -
Deferred tax on fair value adjustment
(note 15)
- -
As at 31 December 2016 5,065,174 5,065,174 46,207,796 51,272,970

13
4. Consolidated Cash Flow Statements 6 months
31 December
2016
6 months
31 December
2015
12 months
30 June
2016
Consolidated net income / (loss) (1,768,956) (1,878,836) (4,164,926)
Non-monetary
adjustments:
Elimination of Depreciation,
amortization and provisions 254,172 8,415 11,816
Income and expenses related to the
share-based payment
449,412 - -
Elimination of deferred tax assets (76,000) (934,000) (2,666,622)
Debt issuance costs - - -
Cost of financial debt - 600,000 1,100,000
Other financial costs 229,000 690,000 1,206,607
Negative goodwill - - (1.189.556)
(Increase) decrease in working capital (1,632,137) 388,195 2,292,321
Income tax paid - - -
Net cash flow from operating
activities
(2,544,509) (1,126,226) (3,410,360)
Net acquisition costs of participation - - (16,073,666)
Purchase of intangible assets
(24,000) - -
Exploration costs capitalized (1,887,721) (502,193) (1,163,626)
Purchase of Property, plant & equipment
additions
(1,012,380) - (1,508)
Other financial assets investments
(54,328) (92,648)
Net cash flow from investing
activities
(2,978,429) (502,193) (17,331,448)
Issue of new shares - - 37,500,003
Transaction costs - - (1,805,939)
Payments to EGL UK (9.639) (530,482) (5,034,933)
Payments received from EGL UK - 400,000 -
Interest paid -
Net cash flow from financing
activities
(9,639) (130.482) 30.659.131
NET INCREASE
(DECREASE) IN CASH
(5,532,577) (1,758,901) 9,917.323
Cash at the beginning of the period 11,962,172 2,044,849 2,044,849
Cash at the end of the period 6,429,595 285,948 11,962,172

14
In the consolidated cash flow statement above, net cash includes cash and cash equivalents net
of current bank borrowings. Marketable securities, in accordance with IAS 39, are shown in
the balance sheet at their market value at the balance sheet date as at 31 December 2016.
The cash flow statement does not show the following items as they were as they were non-
monetary transactions:
- The forgiveness of debt amounting to € 8,000,000 (2015: € 2,200,000) which has been
accounted for directly in equity on 30 June 2016; and
- The fair value adjustment of the loan resulting from the agreement dated December 12, 2014
whereby the existing loan was formulated into a 5 years non-bearing interest loan maturing on
12 December 2019.
5. Notes to the consolidated financial statements for the first half 2017
1. Accounting policies and general principles
The consolidated financial statements for the first half of the financial year ended 30 June
2017 have been prepared in accordance with IAS 34 "Interim financial information" on the
preparation of the interim financial statements and with the international accounting standards
and interpretations (IAS / IFRS) adopted by The European Union and put in force on
31 December 2016.
These standards and interpretations are applied consistently over the periods presented. The
half-year financial statements are prepared according to the same rules and methods as those
used for the preparation of the 2016 annual financial report filed with the AMF on 31 October
2016. They were approved by the Board of Directors on 30 March 2017.
The purpose of the interim financial statements is to provide shareholders and investors with
relevant information on significant events and transactions during the period. This
information is given, in particular, through a selection of notes explaining the significant
changes in the balance sheet between 30 June 2016 and 31 December 2016 and the main
transactions that contributed to the formation of the first half 2017 half year results. The
interim financial statements do not contain all the information required for full annual
financial statements and must be read in conjunction with the Group's financial statements for
the year ended 30 June 2016 filed with the “Autorité des Marchés Financiers” on 31 October
2016 (available on the Company's website both in English and French).
The preparation of the financial statements in accordance with IFRS requires the Group’s
executive management to make estimates and assumptions that can affect the carrying
amounts of assets, liabilities and contingent liabilities at the date of preparation of the
financial statements and reported income and expenses for the period. The executive
management reviews these estimates and assumptions on an on-going basis, by reference to
past experience and various other factors considered as reasonable for assessing in particular
the assets and liabilities carrying book value. These judgements and estimates are made on the
basis of information or circumstances existing at the date of preparation of the financial
statements, which may later differ from the actual results. The implementation of these
estimates and assumptions relates principally to the application of the successful efforts
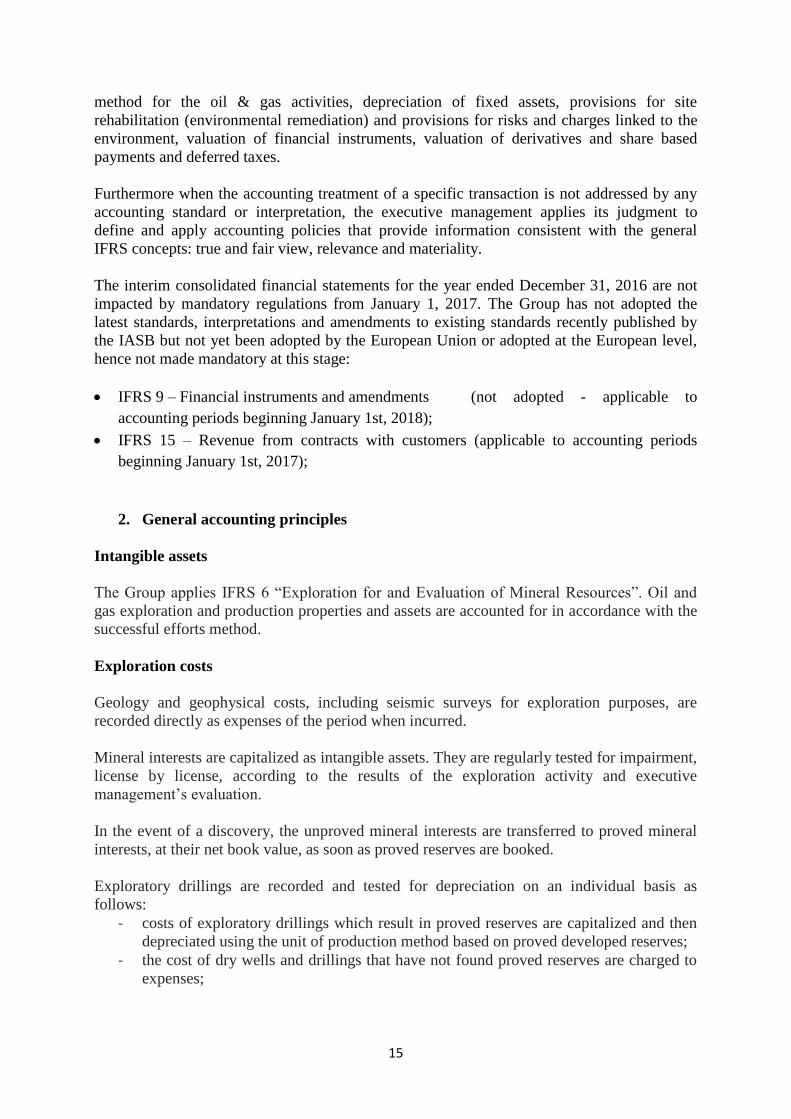
15
method for the oil & gas activities, depreciation of fixed assets, provisions for site
rehabilitation (environmental remediation) and provisions for risks and charges linked to the
environment, valuation of financial instruments, valuation of derivatives and share based
payments and deferred taxes.
Furthermore when the accounting treatment of a specific transaction is not addressed by any
accounting standard or interpretation, the executive management applies its judgment to
define and apply accounting policies that provide information consistent with the general
IFRS concepts: true and fair view, relevance and materiality.
The interim consolidated financial statements for the year ended December 31, 2016 are not
impacted by mandatory regulations from January 1, 2017. The Group has not adopted the
latest standards, interpretations and amendments to existing standards recently published by
the IASB but not yet been adopted by the European Union or adopted at the European level,
hence not made mandatory at this stage:
IFRS 9 – Financial instruments and amendments (not adopted - applicable to
accounting periods beginning January 1st, 2018);
IFRS 15 – Revenue from contracts with customers (applicable to accounting periods
beginning January 1st, 2017);
2. General accounting principles
Intangible assets
The Group applies IFRS 6 “Exploration for and Evaluation of Mineral Resources”. Oil and
gas exploration and production properties and assets are accounted for in accordance with the
successful efforts method.
Exploration costs
Geology and geophysical costs, including seismic surveys for exploration purposes, are
recorded directly as expenses of the period when incurred.
Mineral interests are capitalized as intangible assets. They are regularly tested for impairment,
license by license, according to the results of the exploration activity and executive
management’s evaluation.
In the event of a discovery, the unproved mineral interests are transferred to proved mineral
interests, at their net book value, as soon as proved reserves are booked.
Exploratory drillings are recorded and tested for depreciation on an individual basis as
follows:
- costs of exploratory drillings which result in proved reserves are capitalized and then
depreciated using the unit of production method based on proved developed reserves;
- the cost of dry wells and drillings that have not found proved reserves are charged to
expenses;

16
- the costs of exploratory drillings are temporarily capitalized until a determination is
made as to whether the drilling has found proved reserves if both of the following
conditions are met:
- the well has found a sufficient quantity of reserves to justify, if appropriate, its
completion as a producing well, assuming that the required capital expenditures are
made,
- the Group is making sufficient progress assessing the reserves and the economic and
operating viability of the project. This progress is evaluated on the basis of indicators
such as whether additional exploratory works are under way or firmly planned (wells,
seismic or significant studies), whether costs are being incurred for development
studies and whether the Group is waiting for governmental or other third-party
authorization of a proposed project, or availability of capacity on an existing transport
or processing facility.
The costs of exploratory drillings not meeting these conditions are charged to expenses.
According to IFRS 6, cost of exploration and evaluation are initially capitalised as intangible
assets until the technical feasibility and commercial viability of extracting a mineral resource
are demonstrable. Therefore, when proved reserves of natural gas are determined and
development is approved by management, the relevant capitalised expenditures are first
assessed for impairment when facts and circumstances suggest that the net book value of the
assets of exploration and evaluation may exceed its recoverable amount and (if necessary)
considers any impairment that may result and the remaining balance is transferred to property,
plant and equipment.
Other intangible assets include patents, software, trademarks, and rights to lease.
Intangible assets are recognized in the balance sheet at acquisition or production cost, less any
depreciation and impairment losses recognized.
Other intangible assets are amortized on a straight-line basis over their useful lives between 3
and 10 years.
Property, plant and equipment
Property, plant and equipment acquired separately are initially measured at their acquisition
cost in accordance with IAS 16. The cost includes expenditures that are directly related to the
acquisition of the asset and the estimated cost of restoration of a portion of the assets if
necessary. Tangible assets acquired in a business combination are recognized and value at
their fair value separately from goodwill.
No property, plant and equipment have been pledged as security for debts and none are
subject to finance lease contracts. Property, plant and equipment are recorded at their
acquisition cost and amortized over a period corresponding to their foreseeable period of use.
Except in exceptional cases, the amortization plans are the same as those used for the parent
company financial statements (excluding an exception for tax purposes).
17
Receivables:
Receivables are valued at their nominal value. They shall be assessed individually and, where
appropriate, shall be subject to a provision for depreciation in order to take into account the
recovery difficulties to which they might be liable.
Inventories:
The inventories consist mainly of maintenance parts for the servicing of the station at Avion
and are valued at the lower of purchase cost or net realizable value. Impairment is recognized
when the net realizable value is lower than cost. No impairment has been recognised for the
financial half year ending 31 December 2016. The accounting method used for the inventories
is based on the first-in first-out basis.
Liquidity contract:
Following the IPO of the Company on the regulated market of Euronext Paris, the Company
signed a liquidity contract with Aurel BGC with a view to reduce the intra-day trading
volatility of the Company shares. This liquidity contract, in compliance with the AFEI Code
of conduct (Association Francaise des Entreprises d’Investissement), was signed on 15 June
2016. The Company has made available to Aurel BCG cash for an amount of € 350,000 to
buy or sell the shares of the Company to ensure liquidity on the stock market. This liquidity
contract resulted in a financial expense of € 108,825 for the six-month period ended 31
December 2016. The impairment loss arose from the sale of securities during the first half of
2017 and the difference between the value of the shares held as at 31 December 2016 and
their historic purchase value at date of purchase during this financial period.
At December 31, 2016, cash and cash equivalents of this liquidity contract amounted to €
95,712 and € 145,463 in other financial assets.
Provisions for pensions and other employment benefits:
In accordance with IAS 19, the Group recognizes its obligations to pay retirement
indemnities. Commitments are valued using the actuarial method of projected credit units,
taking into account actuarial assumptions such as salary increases, age of departure, mortality,
staff turnover and discount rate.
Valuation and recognition of financial liabilities:
Long-term debt consists of the corporate loan from EGLUK which has been put in place as
part of the restructuring of the Group in 2015 (share buy-back transaction in May 2015) and
the subsequent transfer of permits from EGLUK to LFDE.
The EGLUK loan as at 31 December 2016 was valued by discounting future payments at a
market rate of 15% until the maturity date of 12 December 2019. This is consistent with the
risk premium for a company such as La Française de l’Energie and in line with historic rates
used to value the fair value of the loan. Consistent with the principles implemented as part of
the reorganization of the Group as described in the consolidated financial statements at 30
June 2016, this fair value adjustment has been recognized in equity.

18
Share based payments for employees - free shares:
IFRS 2 outlines the recognition of a personnel expense corresponding to benefits granted to
employees in the form of share-based payments. The purchase price of shares and similar
securities is measured through to the fair value at the date on which the equity instruments are
allocated.
The free shares are valued on the basis of the share price of a share at the date of allocation to
the employees.
Goodwill
Goodwill relating to different consolidated subsidiaries are recorded on the consolidated
balance sheet in the ‘’goodwill’’ section.
The acquirer accounts for goodwill at the date of acquisition, evaluated as being the excess of:
The consideration transferred, the amount of any non-controlling interests and, in a
business combination achieved in stages, the fair value of any previously held equity
interest remeasured at its acquisition date, less;
The fair value, at the acquisition date, of the identifiable acquired assets and assumed
liabilities.
If the consideration transferred is lower than the aggregate fair value of the identifiable assets
acquired and liabilities recorded, the group re-assesses whether it has correctly identified all
the assets acquired and all the liabilities assumed. If the reassessment still results in an excess
of the fair value of net assets acquired over the aggregate consideration transferred, then the
negative goodwill is recognized directly in the income statement.
When transactions with non-controlling interests have no impact on control, the difference
between the consideration transferred and the book value of the acquired non–controlling
interests is accounted for directly in equity.
Goodwill is not amortized but is subject to an impairment test at least once a year. When an
impairment loss is recognized, the difference between the carrying value of the asset and its
recoverable amount is expensed through the statement of comprehensive income during the
financial year in the section operating results.
Revenue recognition:
In accordance with IAS 18, sales are measured at the fair value of the expected consideration,
net of discounts, rebates and rebates, excluding VAT and other taxes. In the case of the group,
the revenue is recorded as of the date when the Group transferred to the buyer the ownership
and risks of the products sold.
Recognition of turnover for gas sales is made in accordance with the contractual terms of the
sales contract with Total and a gas liquidity contract with GRT covering the over /
underselling of gas quantity as per the contractual T&C’s.

19
Income tax:
Income tax expense is equal to the sum of current and deferred taxes. With regard to deferred
tax, it is based on the validity period for tax losses determined by French law and using the
possibilities of losses carried forward.
The tax charge for the first half-year is determined by applying to pre-tax income the effective
tax rate of the Company estimated for the financial year 2017 (including deferred taxes). This
rate is, where appropriate, adjusted for tax implications related to unusual items for the period.
Use of estimates:
The preparation of financial statements in accordance with IFRS requires the use of estimates
and assumptions that affect the amounts reported in these financial statements, including the
following:
(ii) valuations used for value tests;
(iii) valuation of share-based payments;
(iv) recognition of deferred tax assets;
(v) the valuation of financial instruments;
These estimates are based on assumptions which are based on the information available at the
time of their establishment. Estimates may be revised if the circumstances on which they are
based change or as a result of new information. Actual results may differ from these
estimates.
Going concern:
The management of the Group regularly reviews its financing options in order to ensure
continuity of operations, in particular with regard to its various assets and liabilities an income
from its gas sales.
The Group's current working capital requirement (including direct costs of gas sales) amount
to circa € 400,000 per month and its current cash resources enable the group to finance its
current activities under AFE and support its working capital requirements until June 2017
without drawing down further funding. As a result, the Group is committed to maintaining a
very broad access to liquidity in order to meet its financial commitments and requirements. As
at December 31, 2016, the Group had cash or cash equivalents in the amount of € 6,429,595.
As at date of the report, the Company has sufficient working capital and access to other
financing options to meet its current obligations and working capital needs for the next 12
months.
In order to continue the development programs in Lorraine and Nord Pas de Calais, it has
been decided to recourse to new means of financing before the end of June 2017. This funds
optimization approach related to the projects are intended to reduce the cost of capital
associated with the activities of the Group. The Company has indeed identified several
options such as debt financing and asset back financing options either at the Group or
subsidiary’s level, with very favorable terms which is expected to significantly reduce the
cost of capital of the Company and allow for a full financing of its future investment needs

20
for 2018 onwards.
From July 2017 onwards, the Group will be able to cover its entire working capital needs
from gas and electricity sales at Gazonor.
The Company as of the date of the Report has not drawn down on any of the available
financing options but will draw upon debt financing before the end of the financial year end
30 June 2017.
Notes to the Balance Sheet
3. Scope of the first half consolidated accounts 31 December 2016:
The consolidated financial statements include the financial statements of the Company and its
direct and indirect subsidiaries, all of which are fully consolidated.
The consolidated financial statements of the Company and its subsidiaries are presented in
euros, which is also the functional currency of the company and its subsidiaries, except
Concorde Energy Inc. (US dollar).
The list of subsidiaries and shareholdings, with an indication of the share of the capital held
for the financial year ended December 31, 2016, is stated below:
Subsidiaries and shareholdings % equity held
Direct subsidiaries
EG NPC SAS 100%
EG Lorraine SAS 100%
EG Jura SAS 100%
EG Gardanne SAS 100%
LFDE International SA 100%
Concorde Energy Inc. 100%
Indirect subsidiaries
Gazonor Holding SAS 100%
Gazonor SAS 100%
European Gas Benelux 100%
Concorde Energie Paris SAS 100%
As of the date of this report, the direct and indirect subsidiaries have no operational activities,
with the exception of Gazonor SAS, a French company devoted to research, extraction,
purification, and sale of coal mine gas (CMM) and coal bed gas (CBM) recovered in the
basins of the former Nord-Pas-de-Calais mining area. Consequently, Gazonor SAS's main
activity is the exploitation and sale of coal mine gas. Following the issuance by the French
government of a decree declaring the production of electricity from coal mine methane as
green energy, Gazonor SAS will, in addition, start producing electricity from four of its sites
by June 2017 through the installation of 9 MW of gas engines.
4. Goodwill
21
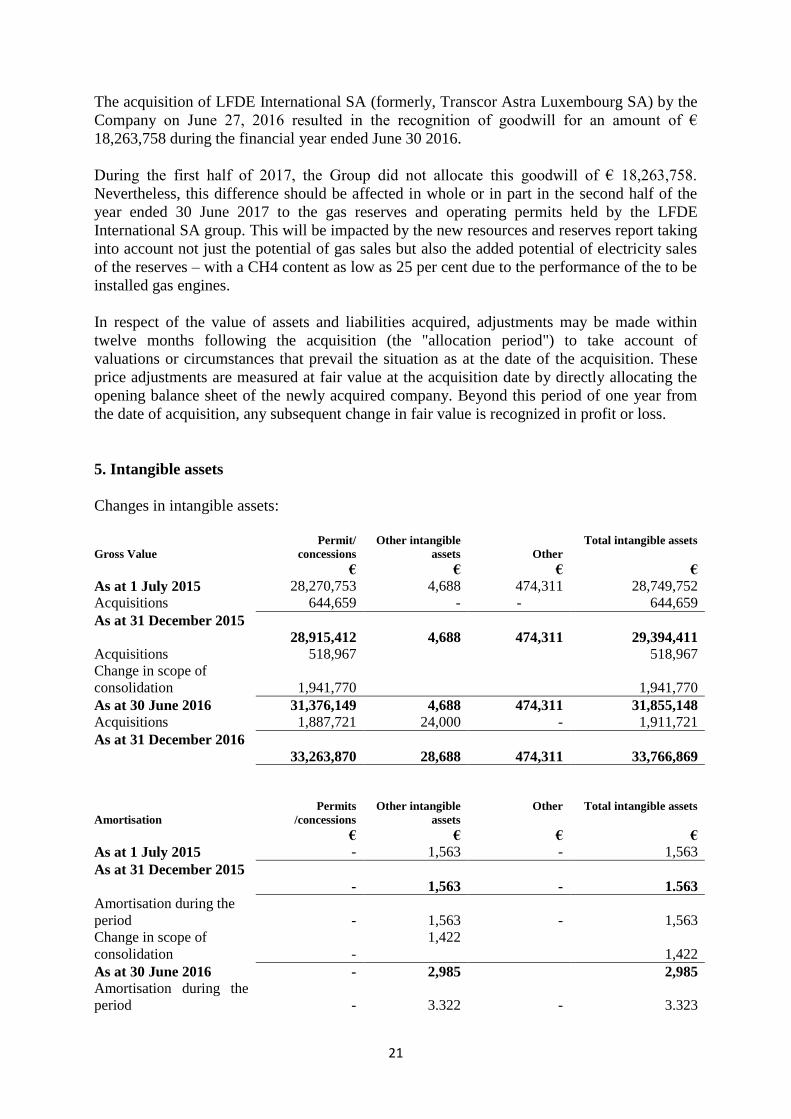
The acquisition of LFDE International SA (formerly, Transcor Astra Luxembourg SA) by the
Company on June 27, 2016 resulted in the recognition of goodwill for an amount of €
18,263,758 during the financial year ended June 30 2016.
During the first half of 2017, the Group did not allocate this goodwill of € 18,263,758.
Nevertheless, this difference should be affected in whole or in part in the second half of the
year ended 30 June 2017 to the gas reserves and operating permits held by the LFDE
International SA group. This will be impacted by the new resources and reserves report taking
into account not just the potential of gas sales but also the added potential of electricity sales
of the reserves – with a CH4 content as low as 25 per cent due to the performance of the to be
installed gas engines.
In respect of the value of assets and liabilities acquired, adjustments may be made within
twelve months following the acquisition (the "allocation period") to take account of
valuations or circumstances that prevail the situation as at the date of the acquisition. These
price adjustments are measured at fair value at the acquisition date by directly allocating the
opening balance sheet of the newly acquired company. Beyond this period of one year from
the date of acquisition, any subsequent change in fair value is recognized in profit or loss.
5. Intangible assets
Changes in intangible assets:
Gross Value
Permit/
concessions
Other intangible
assets
Other
Total intangible assets
€ € € €
As at 1 July 2015 28,270,753 4,688 474,311 28,749,752
Acquisitions 644,659 - - 644,659
As at 31 December 2015
28,915,412
4,688
474,311
29,394,411
Acquisitions 518,967 518,967
Change in scope of
consolidation
1,941,770
1,941,770
As at 30 June 2016 31,376,149 4,688 474,311 31,855,148
Acquisitions 1,887,721 24,000 - 1,911,721
As at 31 December 2016
33,263,870
28,688
474,311
33,766,869
Amortisation
Permits
/concessions
Other intangible
assets
Other Total intangible assets
€ € € €
As at 1 July 2015 - 1,563 - 1,563
As at 31 December 2015
-
1,563
-
1.563
Amortisation during the
period
-
1,563
-
1,563
Change in scope of
consolidation
-
1,422
1,422
As at 30 June 2016 - 2,985 2,985
Amortisation during the
period
-
3.322
-
3.323

22
As at 31 December 2016
-
6,307
6,307
NET VALUE
As at 31 December 2015
28,915,412
3,125
474,311
29,392,848
As at 30 June 2016 31,376,149 1,703 474,311 31,852,163
As at 31 December 2016
33,263,870
22,381
474,311
33,760,562
Permits / concessions primarily include exploration expenditures and exploration drilling
costs that are recognized as intangible assets and are not amortized. On the other hand, they
may be subjected, if necessary, to an impairment test on an individual basis as per the Groups
accounting policies on capitalised expenses and intangible assets.
Acquisitions in the first half of 2017 for an amount of € 1,887,721 mainly include the cost of
the drilling at the Lachambre site.
Other intangible assets mainly include software. In the first half of 2017, the acquisition of the
licenses for the new Sage X3 software for an amount of € 24,000 was recognized as other
intangible assets, which was implemented as of July 1, 2016.
"Other" includes a provision to cover the costs of abandoning wells and restoring the
Tritteling site to its original form in the event that the exploration and drilling activity is
discontinued.
As at December 31, 2016, the exploration assets break-down is outlined below by each
exclusive research license / permit or concession, excluding provisions for rehabilitation:
Exploration licences
31
December
2016
31
December
2015
30 June
2016
€
€ €
Bleue Lorraine Renewed until 30 Nov. 2018 29,738,630 27,335,442 27,854,409
Bleue Lorraine Sud Renewed until 7 Nov. 2016 299,103 295,603 295,603
Bleue Lorraine Nord Licence award in progress - - -
La Grande Garde Licence award in progress - - -
Lons-le-Saunier (Jura) Request 2nd
period applied for
(reject (1)
)
220,061
220,061
220,061
Gardanne Request 3rd
period applied for
(reject (1)
)
74,259
74,259
74,259
École supérieure Under review (implicit rejection (1)
)
-
-
-
Chéroy Under review (implicit rejection (1)
)
-
-
-
Courgivaux Under review (implicit rejection (1)
)
-
-
-
Deux-Nanteuil Under review (implicit rejection (1)
)
-
-
-
Dormans Under review (implicit rejection (1)
)
-
-
-

23
Exploration licences
31
December
2016
31
December
2015
30 June
2016
€
€ €
La Folie de Paris Renewed on 7 August 2016 (2)
1,941,770 - 1,941,770
La Sole Under review (implicit rejection (1)
)
-
-
-
Les Chollets Rejected (1)
- - -
L’Ourcq Rejected (1)
- - -
Marigny Under review (implicit rejection (1)
)
Ozoir Under review (implicit rejection (1)
)
Valenciennois (NPC) Renewed on 20 March 2017 229,080 229,080 229,080
Sud-Midi (NPC) Renewal request in progress 366,684 366,684 366,684
Poissonière (NPC) Renewed on 29 May 2015 394,283 394,283 394,283
Desiree (NPC) Renewed on 29 May 2015
Total exploration assets 33,263,870 28,915,412 31,376,149
(1) In accordance with Article 23 of Decree No. 2006-648, an implicit rejection decision occurs on the expiry of a
period of two years from the original application. This implicit rejection decision can be appealed with the Minister
and / or have recourse before the administrative courts. Given the recurrent delays of the government departments
in the processing of applications for extension or granting of mining permits in France, and with experience on
previous permit applications, the Group's management considers that it is not necessary to write down these assets
at this stage of the administrative process, as no explicit refusal decision of the application has been obtained from
the French government to date. Therefore, management believes that there is still a chance, the permit could be
granted as in practice, even after expiry of the applicable time limits and rejection situation, the administration may
take a decision to grant the permit applied for.
(2) The renewal application has been timely submitted and the company is waiting for the decision of the French
authorities.
6 Property, plant & equipment
The break-down of the property, plant and equipment for the periods up to 31 December 2016
is outlined below:
Gross value
Land /
Property
Constructions
Industrial
installations,
equipment
and tools
Other tangible
fixed assets
Assets under
construction
Total
€ € € € € €
As at 1 July
2015
-
-
-
40,043
-
40,043
As at 31
December 2015
-
-
-
40,043
-
40,043
Acquisitions - - - 1,508 - 1,508
Change in scope
of consolidation
24,113
300,044
175,966
37,265
72,762
610,150
As at 30 June
2016
24,113 300,044 175,966 78,816 72,762 651,701
Acquisitions /
additions
- - - 3,258 1,009,122 1,012,380
As at 31
December 2016
24,113
300,044
175,966
82,074
1,081,884
1,664,081
24
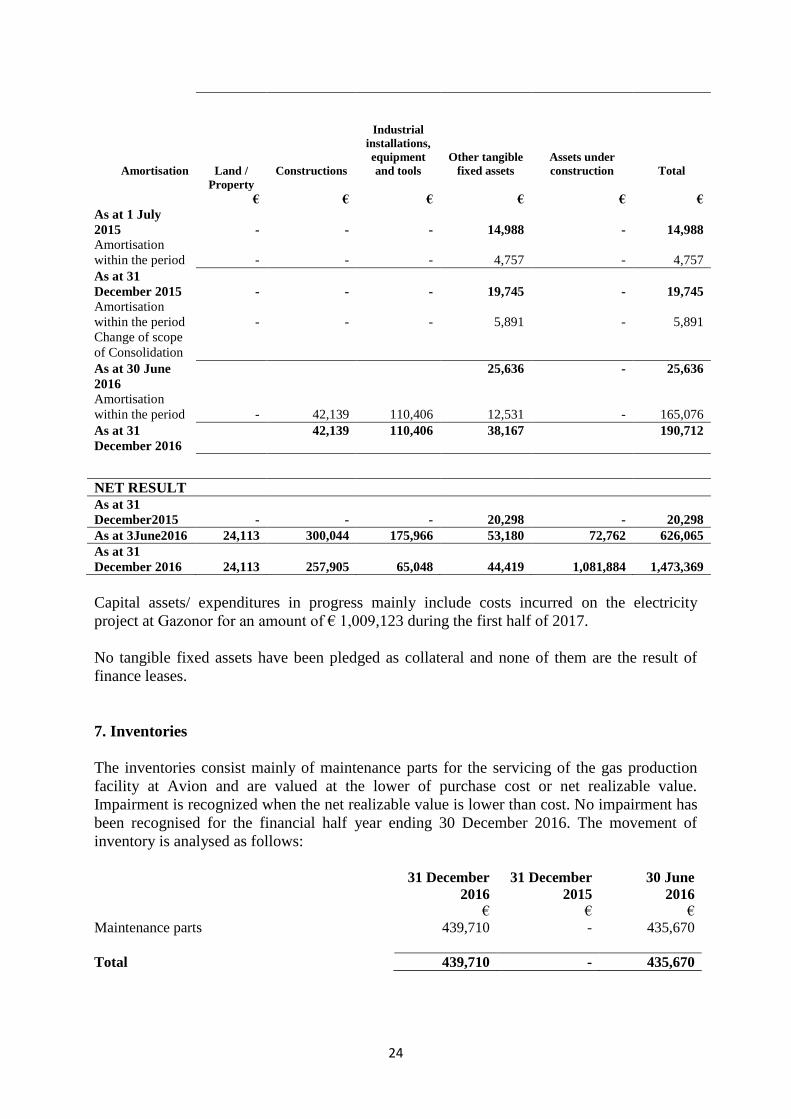
Amortisation
Land /
Property
Constructions
Industrial
installations,
equipment
and tools
Other tangible
fixed assets
Assets under
construction
Total
€ € € € € €
As at 1 July
2015
-
-
-
14,988
-
14,988
Amortisation
within the period
-
-
-
4,757
-
4,757
As at 31
December 2015
-
-
-
19,745
-
19,745
Amortisation
within the period
-
-
-
5,891
-
5,891
Change of scope
of Consolidation
As at 30 June
2016
25,636 - 25,636
Amortisation
within the period
-
42,139
110,406
12,531
-
165,076
As at 31
December 2016
42,139 110,406 38,167 190,712
NET RESULT As at 31
December2015
-
-
-
20,298
-
20,298
As at 3June2016 24,113 300,044 175,966 53,180 72,762 626,065
As at 31
December 2016
24,113
257,905
65,048
44,419
1,081,884
1,473,369
Capital assets/ expenditures in progress mainly include costs incurred on the electricity
project at Gazonor for an amount of € 1,009,123 during the first half of 2017.
No tangible fixed assets have been pledged as collateral and none of them are the result of
finance leases.
7. Inventories
The inventories consist mainly of maintenance parts for the servicing of the gas production
facility at Avion and are valued at the lower of purchase cost or net realizable value.
Impairment is recognized when the net realizable value is lower than cost. No impairment has
been recognised for the financial half year ending 30 December 2016. The movement of
inventory is analysed as follows:
31 December
2016
31 December
2015
30 June
2016
€ € €
Maintenance parts 439,710 - 435,670
Total 439,710 - 435,670
25
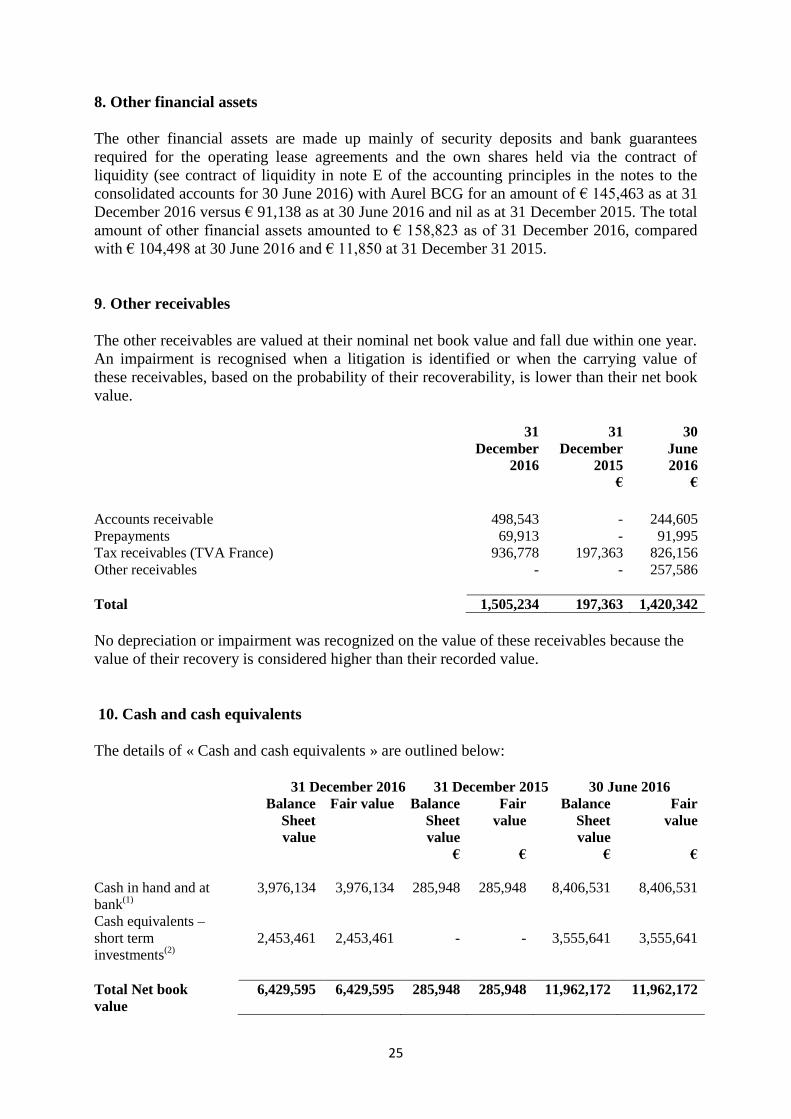
8. Other financial assets
The other financial assets are made up mainly of security deposits and bank guarantees
required for the operating lease agreements and the own shares held via the contract of
liquidity (see contract of liquidity in note E of the accounting principles in the notes to the
consolidated accounts for 30 June 2016) with Aurel BCG for an amount of € 145,463 as at 31
December 2016 versus € 91,138 as at 30 June 2016 and nil as at 31 December 2015. The total
amount of other financial assets amounted to € 158,823 as of 31 December 2016, compared
with € 104,498 at 30 June 2016 and € 11,850 at 31 December 31 2015.
9. Other receivables
The other receivables are valued at their nominal net book value and fall due within one year.
An impairment is recognised when a litigation is identified or when the carrying value of
these receivables, based on the probability of their recoverability, is lower than their net book
value.
31
December
2016
31
December
2015
30
June
2016
€ €
Accounts receivable 498,543 - 244,605
Prepayments 69,913 - 91,995
Tax receivables (TVA France) 936,778 197,363 826,156
Other receivables - - 257,586
Total 1,505,234 197,363 1,420,342
No depreciation or impairment was recognized on the value of these receivables because the
value of their recovery is considered higher than their recorded value.
10. Cash and cash equivalents
The details of « Cash and cash equivalents » are outlined below:
31 December 2016 31 December 2015 30 June 2016
Balance
Sheet
value
Fair value Balance
Sheet
value
Fair
value
Balance
Sheet
value
Fair
value
€ € € €
Cash in hand and at
bank(1)
3,976,134 3,976,134 285,948 285,948 8,406,531 8,406,531
Cash equivalents –
short term
investments(2)
2,453,461
2,453,461
-
-
3,555,641
3,555,641
Total Net book
value
6,429,595 6,429,595 285,948 285,948 11,962,172 11,962,172

26
(1) At the Balance Sheet date of 31 December 2016, Cash in hand and at bank includes a bank balance
amounting to € 3,880,422 and the closing balance of € 95,712 in relation to the liquidity contract with
Aurel BCG.
(2) At balance sheet date of 31 December 2016, the balance of cash in hand at bank of Gazonor SAS
amounted to € 2,453,461.
Cash and cash equivalents are available immediately (non-pledged), non-risky and of
negligible volatility.
11. Share capital
As at 31 December 2016, the share capital of the Company amounted to € 5,065,174 and was
divided into 5,065,174 ordinary shares of par value € 1 each and fully paid.
During the last financial periods, changes in the share capital of the Company were as
follows:
Number
Nominal
Value Amount
€ €
As at 1 July 2015 3,226,620 1 3,226,620
As at 31 December 2015 3,226,620 1 3,226,620
Shares issued through IPO in June 2016 1,388,889 1 1,388,889
Shares issued following conversion of debentures into
ordinary shares
449,665 1 449,665
As at 30 June 2016 5,065,174 1 5,065,174
As at 31 December 2016 5,065,174 1 5,065,174
12. Free shares plans for the employees
The Company’s general meeting of 23 March 2016 authorised the Board of Directors to
proceed with the award of free shares to employees and corporate officers up to 5% of the
Company’s share capital. This operation will be realised by an increase in share capital.
On 30 June 2016, the Board of Directors authorised and approved the free share attribution
plan to the executives and employees as well as agreeing the terms, allocation and the
conditions of the plan in favour of the employees and officers of the Company. The total
number of shares which may be issued under such plan is of 85,601 free shares, representing
1.64% of the share capital of the Company.
These free shares will actually be issued to the eligible beneficiaries 2 years after the date of
their grant, provide the beneficiaries are still holding their position with the Company at that
time, and subject to the other conditions set forth in this free shares plan.
Pursuant to IFRS 2, the benefits granted under this plan are recognized as personnel expenses
in return for an increase in shareholders' equity, with the rights being immediately vested at
the grant date, the plan being settled shareholders' equity.

27
For this free share plan for all employees and managers, the unit value is based on the share
price on the grant date and takes into account the evolution of the beneficiary workforce. The
expense recognized is allocated over the vesting period of the current rights from the date of
the board that approved the plan and the likelihood of being present. The grant date
corresponds to the date of the board of directors which decided on the allocation of this plan.
The following table illustrates the number, fair value and changes of these free shares during
the first half of the financial year ended 31 December 2016:
Distribution
date
Excercise
Period
Minimum
holding
period
Shares
issued
Fair value at
date of
distribution
Shares issued as
at 31 December
2015
30 June 2016 2 years 2 years 85,602 21 € n/a
13. Long-term borrowings
The Non-current financial liabilities are presented below:
31 December
2016
31 December
2015
30 June
2016
€ €
Non-current financial debt 3,268,139 7,938,000 3,053,778
Convertible loan notes 9,212,783 -
Total non-current financial liabilities 3,268,139 17,150,783 3,053,778
Non-current financial debt corresponds to the loan granted by European Gas
Limited (“EGLUK”) with a maturity date of 12 December 2019 with an interest rate of zero
percent pursuant to the loan agreement with EGLUK as at 12 December 2014. This interest-
free loan with a nominal value of € 4,970,139 as at December 31, 2016 (€ 13,885,230 at 31
December 2015) was valued by discounting future payments at a market rate of 15% until
maturity.
As part of the restructuring of the Group in 2015, EGLUK and the Company, pursuant to a
Reorganization and Cooperation Agreement dated 25 June 2015, that such loan granted by
EGLUK would be phased out over a period of five years in consideration for the Company's
undertaking to re-open a buy-back transaction for the shareholders of EGLUK and the
Company’s undertaking to fund the repayment of bonds issued by EGLUK and valued at
€ 4,668,750 as of May 31, 2016. This sum was settled on June 15, 2016.
Given the complexity to implement a new share buyback or exchange operation allowing
EGLUK shareholders to become shareholders of the Company, EGLUK and the Company
agreed to extend the duration of the EGLUK loan for the year 2017.

28
The impact of the various transactions on the loan for the six-month period ended
31 December 2016 is detailed below:
Liabilities Equity Income
Statement
Cash
flow
€ € € €
EGL UK loan
(fair value) - 30
June 2016
3,053,778 - -
Cash movements
between June
2016 and
December 2016(1)
(9,639) - - (9,639)
Repayment of the
shareholder loan
of EGLUK as at
31 December
2016(2)
(5,000) (5,000) - -
Forgiveness of
debt for the period
up to 31
December 2016(3)
229,000 - 229,000 -
Fair value
adjustment at
31December
2016(4)
3,268,139 (5,000) 229,000 (9,639)
(1) Cash flows between June 2016 and December 2016 amounting to € 9,639 correspond to the
consideration for payments made by FDE in respect of EGL UK commitments.
(2) The amount of € (5,000) corresponds to the impact on the fair value adjustment of the movements
between June 2016 and December 2016 mentioned above.
(3) The amount of € 229,000 corresponds to the effect of the unwinding of the debt with respect to EGL
UK for the year ended December 31, 2016.
14. Income taxes
31 December
2016
31 December
2015
30 June
2016
€ € €
Income tax 174,080
Deferred tax (76,000) 934,000 2,666,622
Total tax 98,080 934,000 2,666,622
Total theoretical tax 33.33% 33.33% 33.33%
Deferred taxes
The deferred taxes break-down is as follows:

29
31
December
2016
31
December
2015
30
June
2016
€ € €
Deferred tax assets on losses carried forward 345,000 154,312 984,000
Deferred tax losses on temporary adjustments - 14,362 3,092
Deferred tax losses on fair value adjustments
of the loan with EGLUK (Note 19) 76,000 (1,981,922)
-
(642,092)
-
Net Balance Sheet impact 421,000 (1,813,248) 345,000
15. Accounts payable and other current liabilities
Accounts payable and other current liabilities are comprised of the following:
31 December
2016
31 December
2015
30 June
2016
€ € €
Accounts payable 3,350,802 1,737,617 4,605,268
Social liabilities 518,486 172,863 826,490
Tax liabilities 169,265 -
Other liabilities - 1,000 150,000
Total accounts payable and other current
liabilities
4,038,553
1,911,480
5,581,758
Accounts payable and other current liabilities are due within one year as at 31 December
2016.
16. Related parties transactions
The Company has been engaged in a number of transactions with related parties for the
financial half year ended 31 December 2016 as follows:
- Interest free loan agreement with EGLUK, for a nominal value of € 4,970,139 at 31
December 2016, with an initial maturity of five years to 12 December 2019. A second
amendment in respect to the « Accord de Réorganisation et de Coopération » has been
concluded and signed by both parties on 18 December 2016, whereby EGLUK and the
Company has agreed to extend the loan till 30 June 2017.
- In the meeting of 23 March 2016, the Board of Directors of the Company had decided
to award to the Chairman and CEO an exceptional pre-tax remuneration of € 250,000
in case of a successful IPO of the company and an additional pre-tax amount of €
250,000 in the event of funds raised in excess of € 20,000,000. An accrual amounting
to € 600,000 including the charges related to the remuneration were recorded at the
end of June 2016 in the consolidated financial statements of the Company for the
benefit of the companies Nebula Resources Limited and Next Gen NRJ Limited. An
amount of € 300,000 has been paid and an equal amount has been recorded as payable
in the first half year 31 December 2016.

30
- A contract for services between the company LFDE International (formerly Transcor
Astra Luxembourg) and the company NextGen NRJ Limited, a company domiciled in
the United Kingdom and a personal holding of the Chief Executive Officer of the
Company, based on the promoting the activities, notably to the European Union
institutions and seeking potential acquisitions and sources of financing. In
consideration for these services, LFDE International pays NextGen NRJ Limited a
monthly fee of € 10,000 excluding taxes since July 1, 2016, representing an expense of
€ 60,000 over the first half of the financial year 31 December 2016.
A contract for provision of services between the company LFDE International and the
company Karlin Limited, a company domiciled in the United Kingdom and controlled
by the Financial Director of the Company for the provision of consultancy services
primarily in seeking potential acquisition opportunities on behalf of the Company. In
return for its services, LFDE International pays Karlin an annual fee of € 50,000
excluding taxes, hence expenses of € 25,000 were recorded for the first half of the
financial year 31 December 2016.
The members of the boards of directors of the Company and EGLUK are also related parties.
Transactions with these related parties primarily relate to the remuneration and benefits
granted to the CEO and other executives of EGLUK, no further agreement has been
concluded during the first half of the financial year ending 30 June 2017.
17. Contractual obligations
Purchase commitments
The purchase obligations are obligations to purchase goods or services, including the
acquisition of fixed assets, on the basis of contractual terms negotiated with the suppliers of
the Group. During the first half of the financial year ended 31 December 2016, the Group
implemented several purchase commitments and other contractual obligations related to the
Lachambre drilling project and the electricity project at Gazonor with suppliers. The first well
at Lachambre is expected to cost a maximum of € 4.6 million. At Gazonor the purchase of
equipment and site preparation for the electricity project is expected to cost the Company a
maximum of € 6.8 million.
Financial commitment on the exploration licences
The table below describes the financial commitments made by the Group in respect of two
key licenses currently operated by the company at 31 December 2016:
Exclusive licence
research (PER)
Initial financial
commitment
Realised
investments
Residual
commitment
€ € €
Bleue Lorraine 7,700,000 29,738,630 Nil
Bleue Lorraine Sud 7,250,000 299,103 6,950,897
Each exploration license awarded to the Group includes financial commitments in terms of
exploration expenditures to be incurred during the term of the license. However, in practice,
the Group may decide to spend far more in excess of its original financial commitments. On

31
the other hand, the Group may decide to delay these expenses depending on the circumstances
and exploration programs. Furthermore, it is important to clarify that the expenses recorded
on the PER of Bleue Lorraine also cover studies on well architectures, the quality and
resistance of equipment and drilling tools and the characteristics of the Lorraine coals that can
be useful for the PER of Bleue Lorraine Sud.
18. Financial instruments and risk management
The main financial assets and liabilities of the group include cash, other receivables, payables
and convertible debenture loan notes.
Fair value of financial assets and liabilities
The financial assets and liabilities can be ranked according to the following three levels of fair
value:
Level 1, prices (non-adjusted) quoted in active markets for identical assets and liabilities, for
which the company can obtain the market value at a specific date;
Level 2, other data than those regarding the quoted prices mentioned in Level 1, observable
directly or indirectly in the market;
Level 3, data related to assets or liabilities that are not observable in the market.
The fair value of financial assets and liabilities is determined as follows:
The fair value of accounts receivable, payables as well as the other current miscellaneous
receivables and payables, is deemed to be the same as their carrying value in the balance
sheet, considering their very short-payment terms;
The fair value of the non-current financial debts that concerns a loan from the Company,
EGLUK (Level 2 in the hierarchy of the fair value as per IFRS 13) is estimated by
discounting the future payments to be made at the balance sheet date, using the market
rate of 15%.
The fair value of the bonus shares is determined in accordance with IFRS 2, taking into
account the market price at the date of issue to the beneficiaries.
Derivative financial instruments are initially recognized at their fair value at the date of the
conclusion of the derivative contract and then, they are reassessed to their fair value at each
year-end closing.
There were no significant changes in financial instruments and risk management in the first
half of the financial year 31 December 2017.
The table below shows the maturity of the Group's financial assets and liabilities as at
December 31, 2016, June 30, 2016 and December 31, 2015:

32
As at 31 December 2015 Up to 1
Year
From 1 to 5
Years
More than 5
years Total
Trade payables (1,723,168) (14,449) - (1,737,617)
Other current liabilities (173,863) - (173,863)
Financial debt EGLUK - (13,885,230) - (13,885,230)
Convertible bonds - (9,212,783) - (9,212,783)
Other receivables 197,363 - 197,363
Net amount (1,699,668) (23,112,462) - (24,812,130)
As at 30 June 2016
Up to 1
Year
From 1 to 5
Years
More than 5
years
Total
Trade payables (4,605,268) - - (4,605,268)
Other current liabilities (976,490) - - (976,490)
Financial debt EGLUK - (4,979,778) - (4,979,778)
Convertible bonds 1,420,342 - -
1,420,342
Other receivables (4,161,416) (4,979,778) (9,141,194)
As at 31 December 2016 Up to 1
Year
From 1 to 5
Years
More than 5
years Total
Trade payables (3,350,802) - - (3,350,802)
Other current liabilities (687,751) - - (687,751)
Financial debt EGLUK - (4,970,139) - (4,970,139)
Convertible bonds 1,505,234 - - 1,505,234
Other receivables (2,533,319) (4,970,139) - (7,503,458)
19. Provisions for liabilities and charges
Development of the provisions 31 December
2016
31 December
2015
30
June 2016
€ € €
Provision for site refurbishments /restoration 3,855,303 474,311 474,311
Provision for pensions 17,086 43,087 9,275
Total 3,872,389 517,398 483,586
Provisions for site refurbishments/ restorations can be summarised as follows:
- an amount of € 474,311 recognized by the Company, which represents the costs of
abandoning the wells and the costs of rehabilitating the Tritteling site in the event that
the exploration activity ceases. The amount of this reclamation provision has not been
subject to a discount calculation as of December 31, 2016, as the impact of such a
discount has been considered insignificant.

33
- an amount of € 2,526,034 recorded by the subsidiary Gazonor SAS in previous years
for the shutdown and closing of the site, dismantling and final treatment of the
pipelines, for the license and concession zones of Gazonor. The consideration for this
provision has been recognized as intangible assets and is fully amortized. No provision
is made for this provision.
- a provision of € 854,957 related to Gazonor's operating activities is also recorded to
cover multi-year maintenance costs.
Provisions for restoration are capitalized and included in the value of the underlying fixed
assets, namely exploration assets recognized as fixed assets.
The actuarial assumptions used to estimate the actuarial liability for provisions for pensions
and retirement benefits as of December 31, 2016 are as follows:
i) Pension age: 65 years
ii) Salary growth YoY: 2%
iii) Discount rate: 1.5%
iv) Average staff turnover: Company specific rate: 5%
v) Surivival rate in accordance to INSEE table
20. Segmented financial information
Segmented financial information is presented in accordance with the same principles as
internal reporting, based on exploration, production and EBITDA indicators by operating
segment. These operating segments are:
- Lorraine (exploration of gas reserves), the costs of which are broken down according
to the permits and geographical areas presented in note 5 of this appendix to the
consolidated half-yearly financial statements.
- Nord Pas de Calais (gas production), which represents the exploitation and marketing
of mine gas by Gazonor SAS, whose revenues and costs are allocated according to
permits and geographical areas.
The following tables present, by geographical area, information on turnover and information
on the main exploration assets and production concessions held by the Group as at 31
December 2016. Lorraine Nord Pas de Calais
As at 31 December 2016
Bleue
Lorraine
Bleue
Lorraine
Sud
Poissonnière
Désirée
Total
€ € € € €
Revenues
Gas sales - - 1,859,671 - 1,859,671
Balance
Sheet
Intangible and tangible fixed assets 29,738,630 299,103 828,374 253,511 31,119,618
Movements
Intangible and tangible
investments
1,884,221 3,500 772,197 236,925 2,896,243
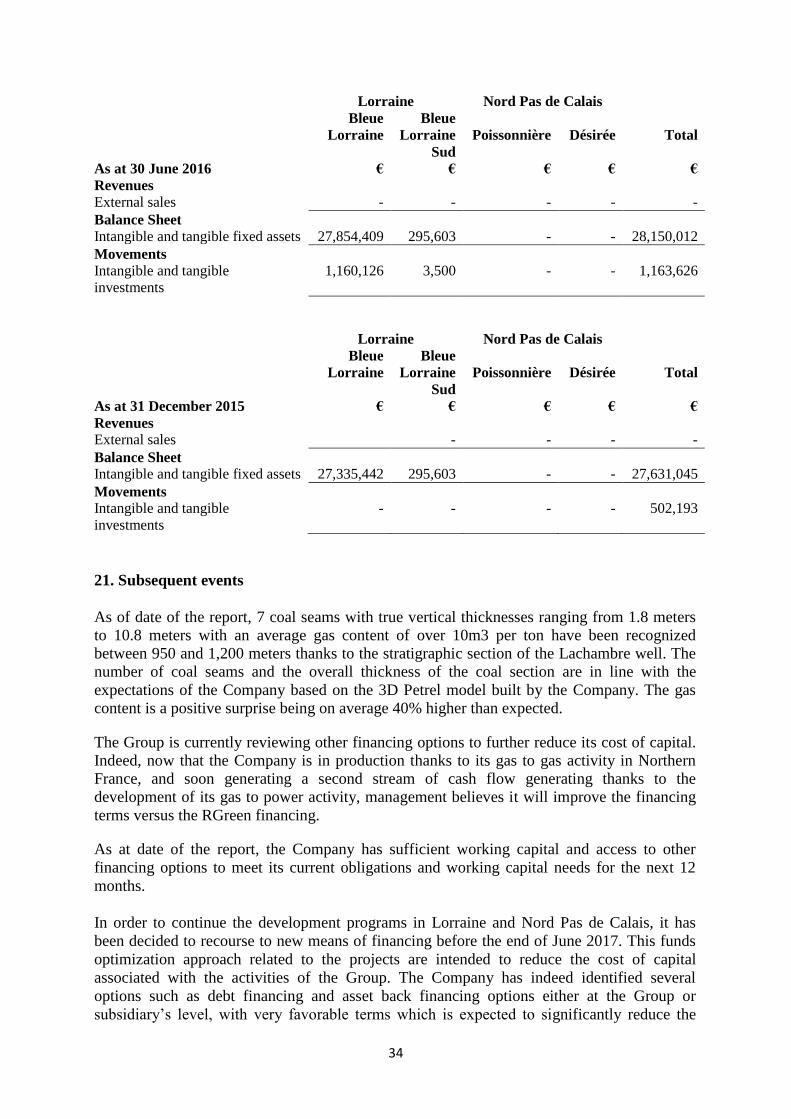
34
Lorraine Nord Pas de Calais
Bleue
Lorraine
Bleue
Lorraine
Sud
Poissonnière
Désirée
Total
As at 30 June 2016 € € € € €
Revenues
External sales - - - - -
Balance Sheet
Intangible and tangible fixed assets 27,854,409 295,603 - - 28,150,012
Movements
Intangible and tangible
investments
1,160,126 3,500 - - 1,163,626
Lorraine Nord Pas de Calais
Bleue
Lorraine
Bleue
Lorraine
Sud
Poissonnière
Désirée
Total
As at 31 December 2015 € € € € €
Revenues
External sales - - - -
Balance Sheet
Intangible and tangible fixed assets 27,335,442 295,603 - - 27,631,045
Movements
Intangible and tangible
investments
- - - - 502,193
21. Subsequent events
As of date of the report, 7 coal seams with true vertical thicknesses ranging from 1.8 meters
to 10.8 meters with an average gas content of over 10m3 per ton have been recognized
between 950 and 1,200 meters thanks to the stratigraphic section of the Lachambre well. The
number of coal seams and the overall thickness of the coal section are in line with the
expectations of the Company based on the 3D Petrel model built by the Company. The gas
content is a positive surprise being on average 40% higher than expected.
The Group is currently reviewing other financing options to further reduce its cost of capital.
Indeed, now that the Company is in production thanks to its gas to gas activity in Northern
France, and soon generating a second stream of cash flow generating thanks to the
development of its gas to power activity, management believes it will improve the financing
terms versus the RGreen financing.
As at date of the report, the Company has sufficient working capital and access to other
financing options to meet its current obligations and working capital needs for the next 12
months.
In order to continue the development programs in Lorraine and Nord Pas de Calais, it has
been decided to recourse to new means of financing before the end of June 2017. This funds
optimization approach related to the projects are intended to reduce the cost of capital
associated with the activities of the Group. The Company has indeed identified several
options such as debt financing and asset back financing options either at the Group or
subsidiary’s level, with very favorable terms which is expected to significantly reduce the
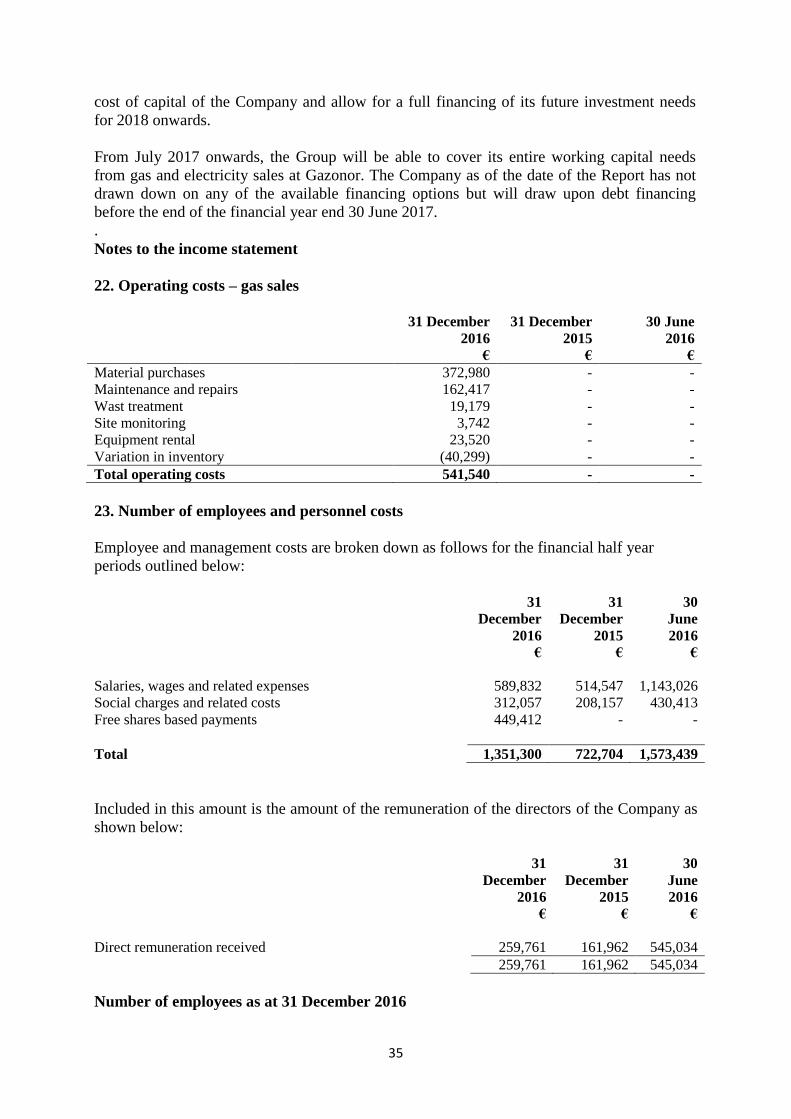
35
cost of capital of the Company and allow for a full financing of its future investment needs
for 2018 onwards.
From July 2017 onwards, the Group will be able to cover its entire working capital needs
from gas and electricity sales at Gazonor. The Company as of the date of the Report has not
drawn down on any of the available financing options but will draw upon debt financing
before the end of the financial year end 30 June 2017.
.
Notes to the income statement
22. Operating costs – gas sales 31 December
2016
31 December
2015
30 June
2016
€ € €
Material purchases 372,980 - -
Maintenance and repairs 162,417 - -
Wast treatment 19,179 - -
Site monitoring 3,742 - -
Equipment rental 23,520 - -
Variation in inventory (40,299) - -
Total operating costs 541,540 - -
23. Number of employees and personnel costs
Employee and management costs are broken down as follows for the financial half year
periods outlined below:
31
December
2016
31
December
2015
30
June
2016
€ € €
Salaries, wages and related expenses 589,832 514,547 1,143,026
Social charges and related costs 312,057 208,157 430,413
Free shares based payments 449,412 - -
Total 1,351,300 722,704 1,573,439
Included in this amount is the amount of the remuneration of the directors of the Company as
shown below:
31
December
2016
31
December
2015
30
June
2016
€ € €
Direct remuneration received 259,761 161,962 545,034
259,761 161,962 545,034
Number of employees as at 31 December 2016

36
The total workforce of the Company as at 31 December 2016 is 19 employees. Its breakdown
by professional category is as follows below:
31
December
2016
31
December
2015
30
June
2016
Management and Employees 15 6 10
Other Staff 4 9 6
Total 19 15 16

37
5. AUDITORS INDEPENDENT REPORT FOR THE FIRST HALF
YEAR ENDED 31 DECEMBER 2016

38

39

40