L9 for Stress
34
Final Report Stress Dampening Effects of Egg Powder from Fertilized Eggs in the Trier Social Stress Test Study No. M1-2008 Prepared by Johannes Schult Approved by Juliane Hellhammer updated 25.03.2009 DAaCRO GmbH & Co. KG, Science Park Trier, Max-Planck-Str. 22, 54296 Trier/Germany, www.daacro.com
Transcript of L9 for Stress
Final Report
Stress Dampening Effects of Egg Powder from
Fertilized Eggs in the Trier Social Stress Test
Study No. M1-2008
Prepared by Johannes Schult
Approved by Juliane Hellhammer
updated 25.03.2009
DAaCRO GmbH & Co. KG, Science Park Trier, Max-Planck-Str. 22,
54296 Trier/Germany, www.daacro.com

Final Report
Study No. M1-2008
Confidential Page 2 (34) 25.03.2009
Sponsor:
MedEQ as
Farmannsveien 18-22
N-3111 Tønsberg
Phone: +47 (0)33 35 90 60
Fax: +47 (0)33 35 90 69
Email: [email protected]
CRO:
DAaCRO GmbH & Co. KG
CEO Juliane Hellhammer
Max-Planck-Str. 22
D-54296 Trier
Phone: +49 (0)651-9120 494
Fax: + 49 (0)651-9120 564
Email: [email protected]
Project Manager and Biometrician:
Johannes Schult, M.Sc./Dipl.-Psych.
Biostatistician
Max-Planck-Str. 22
D-54296 Trier
Phone: +49 (0)651-9120 494
Fax: + 49 (0)651-9120 564
Email: [email protected]
Study Physician
Monika Rendenbach
University of Trier
Johanniterufer 15
D-54290 Trier / Germany
Phone: +49 (0)651-201 3645
Email: [email protected]

Final Report
Study No. M1-2008
Confidential Page 3 (34) 25.03.2009
Table of Contents Table of Contents .................................................................................................................. 3
List of Figures ........................................................................................................................ 5
List of Tables ......................................................................................................................... 6
List of Abbreviations and Definitions of Terms....................................................................... 7
1 Background and Rational for the Study ........................................................................... 8
2 Study Objectives ............................................................................................................. 9
2.1 Primary objectives .................................................................................................... 9
2.2 Secondary objectives ................................................................................................ 9
3 Methods ......................................................................................................................... 9
3.1 Study Dates ............................................................................................................. 9
3.2 Overall Study Design ............................................................................................. 10
3.2.1 Recruiting and Screening Phase ....................................................................... 10
3.2.2 Visit 1: Medical Examination and Baseline Measures ...................................... 11
3.2.3 Treatment Period ............................................................................................ 11
3.2.4 Visit 2: Investigation of Treatment Effects: the TSST ....................................... 11
3.3 Selection of the Study Population ........................................................................... 13
3.3.1 Inclusion Criteria ............................................................................................ 13
3.3.2 Exclusion Criteria ........................................................................................... 13
3.4 Treatment .............................................................................................................. 13
3.4.1 Identity of Investigative Products, Comparators, Doses, and Treatment
Regimens ........................................................................................................ 13
3.5 Questionnaires ....................................................................................................... 14
3.5.1 Chronic Stress (TICS) ...................................................................................... 14
3.5.2 Trait and State Anxiety (STAI) ........................................................................ 14
3.5.3 Perceived Stress (PSS) ...................................................................................... 15
3.5.4 Mood (MDBF) ................................................................................................ 15
3.5.5 Physiological and Psychological Health (SF-12) ............................................... 15

Final Report
Study No. M1-2008
Confidential Page 4 (34) 25.03.2009
3.5.6 Perception of the TSST (VAS) ......................................................................... 15
3.6 Measurement Devices ............................................................................................ 15
3.6.1 Intake Compliance Check ............................................................................... 15
3.6.2 Assessment of Heart Rate................................................................................ 16
3.7 Laboratory Analyses .............................................................................................. 16
3.7.1 Determination of Free Cortisol in Saliva .......................................................... 16
3.7.2 Determination of DHEA in Saliva ................................................................... 16
3.8 Statistical Methods................................................................................................. 17
3.8.1 Determination of Sample Size .......................................................................... 17
3.8.2 Data Analysis.................................................................................................. 17
4 Results .......................................................................................................................... 17
4.1 Study Population ................................................................................................... 17
4.2 Biological Parameters ............................................................................................. 19
4.2.1 Free Cortisol in Saliva ..................................................................................... 19
4.2.2 DHEA in Saliva .............................................................................................. 22
4.2.3 Heart Rate ...................................................................................................... 22
4.3 Questionnaires pre-/post-TSST ............................................................................... 25
4.3.1 STAI: State Anxiety......................................................................................... 25
4.3.2 MDBF: Mood, Wakefulness, Calmness ........................................................... 26
4.3.3 Visual Analogue Scales .................................................................................... 26
4.4 Development During the Intake Period ................................................................... 29
4.4.1 Free Cortisol in Saliva ..................................................................................... 29
4.4.2 Questionnaires ................................................................................................ 30
5 Discussion..................................................................................................................... 32
6 Literature ...................................................................................................................... 34

Final Report
Study No. M1-2008
Confidential Page 5 (34) 25.03.2009
List of Figures Figure 1: Time line of the TSST protocol .............................................................................. 12
Figure 2: A container locked with a MEMS TrackCap .......................................................... 15
Figure 3: MEMS log data for one participant ....................................................................... 18
Figure 4: Time course of saliva cortisol secretion in response to the TSST. ............................ 19
Figure 5: Time course of saliva cortisol secretion in response to the TSST separately for the
high stress half and the low stress half of the sample ............................................................. 21
Figure 6: Time course of DHEA in the TSST ........................................................................ 22
Figure 7: Time course of heart rate in response to the TSST .................................................. 23
Figure 8: Time course of heart rates separately by high stress half and low stress groups ....... 24
Figure 9: Time course of state anxiety in response to the TSST ............................................. 25
Figure 10: Time course of the three MDBF subscales in response to the TSST ....................... 26
Figure 11: Time course of subjective stress experience in response to the TSST ..................... 27
Figure 12: Time course of experienced anxiety and insecurity in response to the TSST .......... 28
Figure 13: Mean AUCt values across weeks .......................................................................... 29
Figure 14: Mean AUCt values across weeks for the high and the low stress subsample .......... 30
Figure 15: Comparison of PSS scores at baseline and at the TSST day ................................... 31
Figure 16: Comparison of SF-12 scores at baseline and at the TSST day ............................... 32

Final Report
Study No. M1-2008
Confidential Page 6 (34) 25.03.2009
List of Tables Table 1: Summary of study design ........................................................................................ 10
Table 2: Descriptive age statistics ......................................................................................... 18
Table 3: Descriptive body measures statistics ........................................................................ 18
Table 4: Cross tabulation of believed and true group membership ........................................ 19
Table 5: Saliva cortisol secretion in response to the TSST ..................................................... 20
Table 6: Saliva cortisol secretion in response to the TSST by high and the low stress groups.. 21
Table 7: Average DHEA levels at baseline. ........................................................................... 22
Table 8: Heart rate during the TSST ..................................................................................... 23
Table 9: Heart rates during the TSST by high and the low stress groups ............................... 25
Table 10: Mean maximal increase of VAS ratings during the TSST ....................................... 28
Table 11: Mean average increase of VAS ratings during the TSST ......................................... 28

Final Report
Study No. M1-2008
Confidential Page 7 (34) 25.03.2009
List of Abbreviations and Definitions of Terms
Abbreviation or special term Explanation
ACTH Adrenocorticotropin hormone
ANOVA Analysis of variance
BMI Body mass index
CAR Cortisol awakening response
CRF Case report form
DHEA Dehydroepiandrosteron
GCP Good Clinical Practice
HPA Hypothalamic-pituitary-adrenal
ICH International Conference on Harmonisation
MDBF Mehrdimensionaler Befindlichkeitsfragebogen
MEMS Medication Event Monitoring System
min. Minutes
PSS Perceived Stress Scale
TICS Trier Inventory for Chronic Stress
TSST Trier Social Stress Test
SF-12 Short Form 12 Health Survey Questionnaire
STAI State Trait Anxiety Inventory
VAS Visual Analogue Scale
YTETM Young Tissue Extract
Final Report
Study No. M1-2008
Confidential Page 8 (34) 25.03.2009
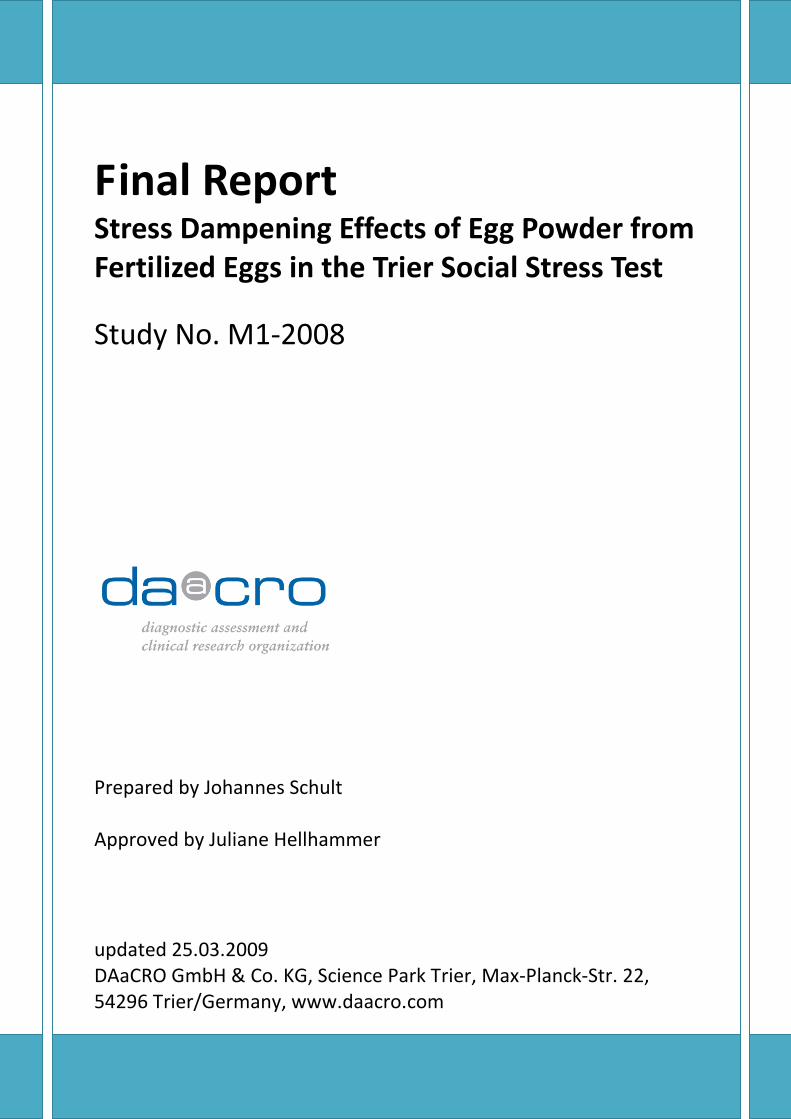
1 Background and Rational for the Study The aim of this research project is to conduct a study investigating the effects of a nutritive
supplement derived from fertilized, partly incubated chicken eggs on stress reactivity (perceived
stress and salivary cortisol) and protective factors (DHEA and health outcome).
The avian egg contains a multitude of the proteins, lipids, vitamins, minerals, and growth
factors. There are also additional defense factors contained to protect against bacterial and
viral infection and biologically active components, making it more than just a source of
nutrients. Proteins and peptides can be derived from the whole egg. Intake of egg components
has been associated with biological activities like novel antimicrobial activities, antiadhesive
properties, immunomodulatory, anticancer, and antihypertensive activities, antioxidant
properties, protease inhibitors, and nutrient bioavailability (Kovacs-Nolan, Phillips, & Mine,
2005; Mihaescu, Olinescu, & Oancea, 2005).
The egg powder used in the present study, YTE™ (Young Tissue Extract), is extracted from
fertilized, partially incubated hen eggs. It is obtained through separation of oligopeptides from
the total mass and contains proteins and peptides from freeze-dried egg white powder. These
can pass freely through the digestive barrier. The embryonic peptides work via elevation of 17-
ketosteroid levels in the adrenal glands which improves anabolism through increased synthesis
of androgens and a decrease in cortisol. Double-blind, placebo-controlled studies showed that
the substance has a positive effect on libido in healthy humans as well as in patients on anti-
depressant medication (Eskeland, 1997; Eskeland, Thom, & Svendsen, 1997). The substance
also has shown to improve cellular testosterone uptake in addition to its effect on cortisol levels
(Eskeland, 1997).
The findings that YTE™ can reduce cortisol levels (Eskeland, 1997) raise the question whether
the substance can help dampen the physiological stress reaction and the perceived
psychological stress in the Trier Social Stress Test (TSST).
Although stress has been described as a non-specific response of the body, it is possible to
discern specific endocrine stress responses caused by specific emotional reactions to novel,
ambivalent or uncontrollable situations and stimuli.
Social stress induces elevated cortisol levels, particularly if the stressor is perceived as
uncontrollable, unpredictable, and constitutes a social-evaluative threat due to the judgment of
others. The hypothalamic-pituitary-adrenal (HPA) axis plays a major role in the response to
this kind of stressors with a robust increase of ACTH and cortisol.
An analysis of Dickerson and Kemeny (2004) compared 208 laboratory studies of acute
psychological stressors. The analysis showed that the TSST (Kirschbaum, Pirke, &
Hellhammer, 1993) is the best standardized and most efficient psychological stress protocol in
humans.
With respect to psychological parameters, the TSST leads to a moderate rise in fear. The
biological response comprehends an increase of adrenocorticotropin hormone (ACTH),
cortisol, prolactin, growth hormone, norepinephrine, epinephrine, heart rate and blood

Final Report
Study No. M1-2008
Confidential Page 9 (34) 25.03.2009
pressure (e.g., Kirschbaum, et al., 1993). Cortisol is involved in development, metabolism,
cognitive and emotional processes, and the immune system. It also exerts influence on the HPA
axis itself (Kudielka, Hellhammer, & Kirschbaum, 2007).
2 Study Objectives
2.1 Primary objectives
The primary objective of the study was to determine the efficacy of egg powder YTE™ in
dampening stress reactivity in an acute stressful situation by assessment of cortisol, heartrate
and perceived stress in the Trier Social Stress Test.
2.2 Secondary objectives
The secondary objectives of the study were:
1. to determine beneficial effects of YTE™ by assessment of the cortisol awakening
reaction (CAR) as an indicator of chronic stress;
2. to determine whether YTE™ has beneficial effects on health by assessment of a health
questionnaire at baseline and after 4 weeks of substance intake;
3. to determine protective effects of YTE™ by assessment of DHEA baseline and pre- and
post-TSST.
3 Methods
3.1 Study Dates
Ethic Commission application 10/17/2008
Ethic Commission approval 11/05/2008
First subject enrolled 11/12/2008
First TSST 12/16/2008
Last TSST (last subject completed) 01/20/2009
Laboratory 02/05/2009
Database Lock 02/10/2009
Final study report 02/27/2009

Final Report
Study No. M1-2008
Confidential Page 10 (34) 25.03.2009
3.2 Overall Study Design
After recruiting and initial screening, the first of two visits to the study site took place. Medical
Pre-Examination took place during this visit and baseline questionnaires were administered.
After four weeks of placebo or YTE™ intake and accompanying saliva sample collection, the
second visit to the study site took place. The TSST protocol was implemented during this visit.
Afterwards, participants were debriefed and paid. The schedule of events is summarized in
Table 1.
Time Step Visit
Study
Site
Duration
of Visit
Screening
Visit
o Screening, medical check and interview
o Informed consent
o Baseline questionnaires
o Hand out capsules and saliva sampling sets
yes 45 min.
Treatment
Period
(4 weeks)
Starting on a
weekday (not
Fridays) after the
pre-screening
participants start
to take their daily
dose of the given
substance for 28
days.
2 days 2 saliva samples per day:
at awakening and +30 min.
no
5 days -
2 days 2 saliva samples per day:
at awakening and +30 min.
5 days -
2 days 2 saliva samples per day:
at awakening and +30 min.
5 days -
2 days 2 saliva samples per day:
at awakening and +30 min.
5 days -
TSST
Visit
o Capsule bottles are handed back and saliva samples
taken over the past four weeks are delivered
o Administration of the Trier Social Stress Test and
questionnaires
o Debriefing
yes 120 min.
Table 1: Summary of study design
3.2.1 Recruiting and Screening Phase
Participants were recruited on the campus of the local university and via email. Several
otherwise interested people did not want to participate because they objected the size of the
capsules or to oral substance intake in general. This led to a prolonged recruiting phase.

Final Report
Study No. M1-2008
Confidential Page 11 (34) 25.03.2009
A first pre-screening and introduction to the study was done by phone or in person. If a person
was male, between 20 and 50 years old, non-smoking, and healthy, an appointment for the
medical pre-examination was made.
3.2.2 Visit 1: Medical Examination and Baseline Measures
Upon their arrival at the study site, participants were informed about the study procedure,
questions were being answered, and their informed consent was obtained. They were also
informed about the protection of their personal data, especially health data. An additional
privacy statement was signed by those who wanted to participate in the study.
Then participants’ health status was examined in a 30 minute medical interview plus a short
medical examination. Participants who fulfilled all inclusion criteria and met no exclusion
criteria were admitted to further study participation. Participants were randomly assigned to
one of the two treatment groups.
The following questionnaires assessing perceived chronic stress, well-being, and trait anxiety
were administered during the baseline visit: The Trier Inventory of Chronic Stress (TICS), a
German translation of the Perceived Stress Scale (PSS), Mood Questionnaire
(Mehrdimensionaler Befindlichkeitsfragebogen , MDBF, long form), the State Trait Anxiety
Inventory (trait version: STAI- X2), and the Short Form 12 Health Survey Questionnaire (SF-
12).
Study participants then received detailed instructions and a container filled with capsules
containing either the test substance or a placebo product. The containers were locked with
MEMS TrackCaps, which kept track of the time and date of each opening.
Participants were also given saliva sample collection material for weekly sampling at home and
a diary to document their wake-up times on sampling days.
3.2.3 Treatment Period
During the four weeks leading up to the second visit, participants had to take a daily dose of
four capsules: the recommended intake was two capsules with breakfast and two capsules with
lunch. Four capsules correspond to a dose of 1680 mg/day YTE™/placebo.
For saliva sample collection cotton swaps in suspenders (Salivette®, Sarstedt AG & Co.,
Nümbrecht, Germany) were used. Participants had to collect saliva on two consecutive days
once a week during the month of substance intake. On each of these days, a first sample had to
be taken right after awakening and another sample 30 minutes later, prior to breakfast. These
pairs of samples were used to determine the cortisol awakening reaction (CAR) for each week,
a reliable marker for chronic stress (Kudielka, Bellingrath, & Hellhammer, 2006). Obtained
saliva samples were supposed to be stored frozen or at least cooled.
3.2.4 Visit 2: Investigation of Treatment Effects: the TSST
After 28 days (four weeks) of substance intake, participants visited the study site again and
performed the TSST protocol. They returned the collected saliva samples and handed over the
pill bottles with the MEMS TrackCaps, which were used to assess compliance.

Final Report
Study No. M1-2008
Confidential Page 12 (34) 25.03.2009
The TSST consisted of a resting and anticipation period (45 min.), a test period (15 min.), and
a subsequent resting period (60 min.). During the first half of the test period participants had
to deliver a free speech. In the second half they had to perform mental arithmetic in front of an
audience.
Participants also had to fill out a number of questionnaires during their stay, before, during,
and after the stress test:
� the PSS and SF-12 before the stress test;
� the Mood Questionnaire (MDBF) in a short version A (pre-TSST) and a short version B
(post-TSST), respectively;
� the State Trait Anxiety Inventory (STAI-X1) assessing state anxiety pre- and post-TSST;
� on a Visual Analogue Scale (VAS) they were asked to rate their degree of perceived
stress, anxiety, and insecurity (0–100). This VAS was assessed three times: pre-TSST, in
the middle of the TSST, and post-TSST.
Heart rate was recorded from –20 min. to +20 min. in relation to TSST timing by Polar
Vantage NV heart rate measurement devices. 10 minutes after the beginning of heart rate
measuring subjects were asked to stand up. This serves to avoid confounding orthostatic effects
during the TSST measurement. Once the participant returned from the TSST, he remained
standing until 10 minutes after the end of the TSST.
The protocol included measures of saliva cortisol (1 pre- and 5 post-measurements at –2 min.,
+1 min., +10 min., +20 min.,+30 min., and +60 min., respectively) and saliva DHEA (–2 min.,
+20 min., +60 min.). The overall time sequence is illustrated in Figure 1.
Figure 1: Time line of the TSST protocol
-2 1 -20 20 30 60
TSST
(15 min)
minutes
-45
Arrival at study
site
Post-TSST
MDBF
STAI-S
VAS
Pre-TSST
MDBF
STAI-S
VAS
Saliva samples
VAS
10
Heartrate measurement

Final Report
Study No. M1-2008
Confidential Page 13 (34) 25.03.2009
After the post-TSST questionnaires participants stayed for another hour during which
additional saliva samples are collected. Then they were debriefed and received their
reimbursement.
3.3 Selection of the Study Population
3.3.1 Inclusion Criteria
Healthy, non-smoking men with an age between 20 and 50 years old.
3.3.2 Exclusion Criteria
Persons were excluded if
� they had experienced allergic reactions after consumption of hen’s eggs or had a lactose
intolerance;
� smoked or were addicted to drugs or alcohol;
� they had any acute or chronic illness (including psychiatric disorders);
� they were on interfering medication or the study physician doubts the truthfulness of
their corresponding health information;
� they suffered from an acute illness within the last 14 days;
� they were apparently unsuited as participant (lack of cognitive or verbal skills);
� they had previously participated in the TSST;
� it was expected that they would not complete the study;
� the study physician assessed a lack of good health based on the medical examination.
No persons were included who were doubted to be able to speak for themselves or unable to
speak for themselves.
3.4 Treatment
3.4.1 Identity of Investigative Products, Comparators, Doses, and Treatment
Regimens
The test substance YTE™ is an egg powder extracted from fertilized, partially incubated hen
eggs. It is obtained through separation of oligopeptides from the total mass and contains
proteins and peptides from freeze-dried egg white powder. The YTE™ used in the present
study was provided by MedEQ as, Tønsberg, Norway and encapsulated by Laboratoire GEFA,
ZA Bas-Rocomps Route de Noyal-sur-Vilaine, Chateaugiron, France. It has a shelf life of at
least 36 months.
The placebo product contained the following ingredients: rice starch,
hydroxypropylmethylcellulose (HPMC), magnesium stearat, colouring agent (yellow iron
oxide, black iron oxide, red iron oxide on a lactose carrier) and was produced by Laboratoire
GEFA, ZA Bas-Rocomps Route de Noyal-sur-Vilaine, Chateaugiron, France.
Final Report
Study No. M1-2008
Confidential Page 14 (34) 25.03.2009
Half of the participants were randomly assigned to the first group, the other half to the second
group. The investigator was blind to the groups’ identity. An independent study nurse filled the
capsules into the bottles, accordingly, wearing plastic gloves. Group identity was kept in an
envelope which was locked up.
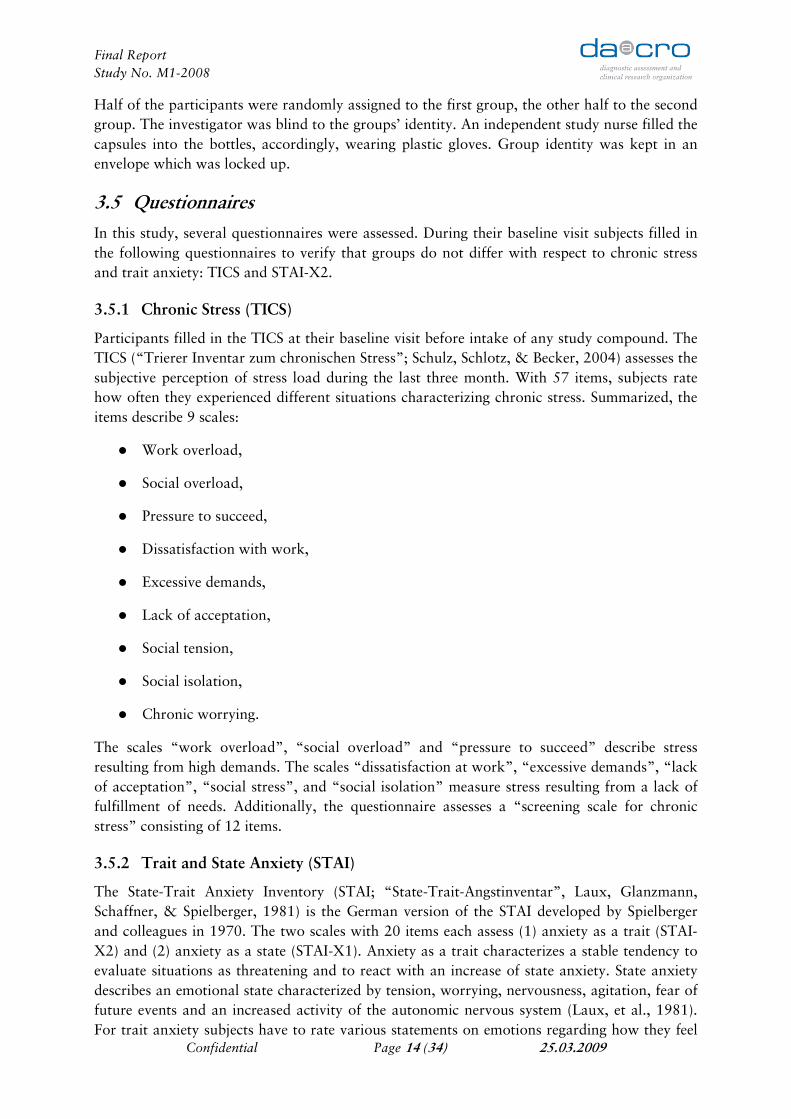
3.5 Questionnaires
In this study, several questionnaires were assessed. During their baseline visit subjects filled in
the following questionnaires to verify that groups do not differ with respect to chronic stress
and trait anxiety: TICS and STAI-X2.
3.5.1 Chronic Stress (TICS)
Participants filled in the TICS at their baseline visit before intake of any study compound. The
TICS (“Trierer Inventar zum chronischen Stress”; Schulz, Schlotz, & Becker, 2004) assesses the
subjective perception of stress load during the last three month. With 57 items, subjects rate
how often they experienced different situations characterizing chronic stress. Summarized, the
items describe 9 scales:
� Work overload,
� Social overload,
� Pressure to succeed,
� Dissatisfaction with work,
� Excessive demands,
� Lack of acceptation,
� Social tension,
� Social isolation,
� Chronic worrying.
The scales “work overload”, “social overload” and “pressure to succeed” describe stress
resulting from high demands. The scales “dissatisfaction at work”, “excessive demands”, “lack
of acceptation”, “social stress”, and “social isolation” measure stress resulting from a lack of
fulfillment of needs. Additionally, the questionnaire assesses a “screening scale for chronic
stress” consisting of 12 items.
3.5.2 Trait and State Anxiety (STAI)
The State-Trait Anxiety Inventory (STAI; “State-Trait-Angstinventar”, Laux, Glanzmann,
Schaffner, & Spielberger, 1981) is the German version of the STAI developed by Spielberger
and colleagues in 1970. The two scales with 20 items each assess (1) anxiety as a trait (STAI-
X2) and (2) anxiety as a state (STAI-X1). Anxiety as a trait characterizes a stable tendency to
evaluate situations as threatening and to react with an increase of state anxiety. State anxiety
describes an emotional state characterized by tension, worrying, nervousness, agitation, fear of
future events and an increased activity of the autonomic nervous system (Laux, et al., 1981).
For trait anxiety subjects have to rate various statements on emotions regarding how they feel

Final Report
Study No. M1-2008
Confidential Page 15 (34) 25.03.2009
in general (“nearly never”, “sometimes”, “often”, “very often”), for state anxiety they have to
rate statements how they feel currently (“not at all”, “a bit”, “quite a lot”, “very much so”).
Participants completed the trait version STAI-X2 after the medical pre-examination and before
intake of any study compound. They filled in the state version STAI-X1 twice, once
immediately before and once after the TSST.
3.5.3 Perceived Stress (PSS)
The Perceived Stress Scale (PSS; Cohen, Kamarck, & Mermelstein, 1983) is a widely used
psychological instrument for measuring the perception of stress in the recent month. It consists
of 14 items.
3.5.4 Mood (MDBF)
The Mehrdimensionaler Befindlichkeitsfragebogen (MDBF; Steyer, Schwenkmezger, Notz, &
Eid, 1997) assesses three bipolar dimensions of actual psychological wellbeing: good-bad
mood, wakefulness-tiredness, and calmness-agitation. There are two short forms of the MDBF
(A and B), which together form the long form.
3.5.5 Physiological and Psychological Health (SF-12)
The Short Form 12 Health Survey Questionnaire (SF-12; Bullinger & Kirchberger, 1998) was
administered. Its health-related items measure quality of life on two main subscales, a
physiological sum score and a psychological sum score.
3.5.6 Perception of the TSST (VAS)
Participants were asked to rate their subjective perception of the stress test three times: right
before, during, and immediately after the TSST. Each time they received a sheet with three
visual analogue scales (VAS) and were asked to mark on bipolar dimension (“low” to “high”)
how high the perceived stress load was, how much anxiety they perceived and how high
perceived insecurity during the TSST was.
3.6 Measurement Devices
3.6.1 Intake Compliance Check
The containers were locked with MEMS TrackCaps (AARDEX Ltd., Zug, Switzerland), which
record the time and date of each opening. This system was implemented to enforce and to
check participants’ intake compliance. The caps are depicted in Figure 2.
Figure 2: A container locked with a MEMS TrackCap

Final Report
Study No. M1-2008
Confidential Page 16 (34) 25.03.2009
3.6.2 Assessment of Heart Rate
For each participant, heart rate was measured continuously over a period of 55 minutes during
the TSST visit. Heart rate assessment started 20 minutes prior to the TSST, continued
throughout the TSST, and ended 20 minutes after termination of the stress test. Assessment
took place with a Polar watch device (S610i and S710i, Polar Electro GmbH, Büttelborn,
Germany). The Polar watch recorded data every 5 seconds. Data were transferred with a Polar-
electro interface to the Polar Precision Performance SW Program (Polar Version 4.00.020,
Polar Electro Oy 2003) on a personal computer. Data were aggregated to mean values for 7
time phases:
� 10 minutes sitting before the TSST,
� 10 minutes standing before the TSST,
� 5 minutes of introduction to the TSST and preparation,
� 5 minutes interview,
� 5 minutes mental arithmetic,
� 10 minutes standing after the TSST, and
� 10 minutes sitting after the TSST.
3.7 Laboratory Analyses
Saliva samples were stored cooled at 4 °C and eventually frozen at -20 °C on the day before
they were transferred to the laboratory. There the samples were kept frozen at -20 °C and only
temporarily thawed for the analyses.
After thawing, saliva samples were centrifuged at 3000 rpm for 5 minutes, which resulted in a
clear supernatant of low viscosity.
3.7.1 Determination of Free Cortisol in Saliva
Free saliva cortisol levels were determined employing an optical density immunoassay (Coated
Well EIA, Salimetrics, State College, PA, USA) based on the competition principle.
Intra-assay variation of this assay ranges between 3.88 to 7.12%, inter-assay variation between
6.69 to 6.88%.
3.7.2 Determination of DHEA in Saliva
DHEA in saliva was determined using an enzyme immunoassay (EIA, Salimetrics, State
College, PA, USA) based on the competition principle.
Intra-assay variation of this assay ranges between 5.3 to 5.8%, inter-assay variation between
7.9 to 8.5%.

Final Report
Study No. M1-2008
Confidential Page 17 (34) 25.03.2009
3.8 Statistical Methods
3.8.1 Determination of Sample Size
For a priori determination of sample size several parameters had to be specified: α-error
probability was defined as α = 0.05, β-error probability as β = 0.20, respectively. Sample size is
supposed to be large enough to reveal a small to medium effect (effect size f = 0.175).
Considering all these parameters, optimum sample size was n = 20 per group, referring to a
total sample size of N = 40 for identifying an effect of 17.5% on a significance level of 5%
with a probability of 80%.
3.8.2 Data Analysis
Analyses of data took place after the final TSST of the study and laboratory analyses of
biological parameters (data collection of all 40 participants). Interim analyses were not
conducted.
Data were entered twice and subsequently compared and cleaned using EpiData 3.1 (Lauritsen
& Bruus, 2004) for verification of correct input. The project manager screened and corrected
ambiguous entries.
Before statistical analyses took place data were processed as following: if values of biological
parameters were implausible, respective analyses were repeated. Missing data were defined and
accounted in the analyses. Cases with missing data were case wise excluded of analyses. Data
analysis was carried out using SPSS 15.0.1 (SPSS Inc., Chicago, USA) and, for the multilevel
linear models, MLwiN 2.02 (University of Bristol, England).
In consideration of the high number of analyses and, going along with this, an increasing α-
error probability, analyses of endocrine, cardiovascular and psychological parameters for both
groups were performed with analyses of variance (ANOVAs) for repeated measures. With this
method, possible differences between treatment groups regarding the response to the TSST
were investigated.
4 Results
4.1 Study Population
A total of 44 male subjects commenced the screening visit. Two of them were excluded because
they were already familiar with the TSST. One was excluded because of lactose intolerance.
One person aborted the study shortly after the first visit and before baseline saliva sampling,
due to parents' concerns.
The remaining 40 participants finished the study. Descriptive statistics of their age and their
body measures are shown in Table 2 and Table 3, respectively.

Final Report
Study No. M1-2008
Confidential Page 18 (34) 25.03.2009
Group mean age in years (SD) n
Placebo 22.65 (2.11) 20
Egg powder 23.16 (2.69) 19a
Table 2: Descriptive age statistics a One missing date of birth in the case report form.
Group mean height in m (SD) mean weight in kg (SD) mean BMI (SD) n
Placebo 1.81 (0.07) 80.30 (15.24) 24.41 (3.96) 20
Egg powder 1.80 (0.06) 77.25 (9.83) 23.86 (2.69) 20
Table 3: Descriptive body measures statistics
The MEMS compliance check revealed no substantive intake refusals. One participant had a
whole week missing. He claimed to have been on vacation and to have had a week's dose with
him. Two other participants showed more than one consecutive day of missing openings,
repeatedly. Figure 3 shows the distribution of bottle openings for one of the participants as an
example.
Figure 3: MEMS log data for one participant (VP11). Grey bars denote weekends.
About 1% of the saliva samples (12 out of 1040) contained no or insufficient saliva for cortisol
and DHEA determination. One participant’s awakening+30 min. cortisol data had to be
discarded, because he had misunderstood the instructions and had collected the second samples
30 minutes before bed-time. Heart rate data of a few participants were partially distorted by
insufficient humidity or malfunction of the Polar watches. They were subsequently excluded
from the analysis.
Participants were asked to report their guessed group membership after the four weeks of
capsule intake. Table 4 contains the cross tabulation of guessed and true group membership.

Final Report
Study No. M1-2008
Confidential Page 19 (34) 25.03.2009
Guessed group membership
Egg powder Placebo don’t know total
Experimental group Placebo 3 11 6 20
Egg powder 7 9 4 20
total 10 20 10 40
Table 4: Cross tabulation of believed and true group membership
4.2 Biological Parameters
4.2.1 Free Cortisol in Saliva
Free cortisol levels were measured in saliva 2 minutes prior to the TSST as well as 1, 10, 20,
30, and 60 minutes after the TSST. The stress test induced a significant increase in cortisol
levels in saliva (effect of time: F(5,34) = 14.13, p = 0.00). The two groups did not differ in the
overall saliva cortisol levels (effect of group: F(1,38) = 0.11, p = 0.74), nor in the course of saliva
cortisol secretion (effect of time x group: F(5,34) = 0.83, p = 0.54). Figure 4 and Table 5 show the
data.
TSST
1 2 3 4 5 6
Co
rtis
ol (in
nm
ol/l)
2
4
6
8
10
12
14
placebo
egg powder
Figure 4: Time course of saliva cortisol secretion in response to the TSST. The graphs show group means with standard error bars.
–2 min. +1 min. +10 min. +20 min. +30 min. +60 min.
TSST

Final Report
Study No. M1-2008
Confidential Page 20 (34) 25.03.2009
time relative to TSST
Group –2 min. +1 min. +10 min. +20 min. +30 min. +60 min. n
Placebo 4.43
(3.66)
7.69
(5.48)
11.19
(7.17)
9.67
(6.04)
6.99
(4.39)
4.23
(2.32)
20
Egg
powder
3.95
(2.68)
7.12
(3.51)
11.82
(7.00)
11.45
(7.93)
8.30
(5.65)
4.23
(2.25)
20
Table 5: Saliva cortisol secretion in response to the TSST. Means and standard deviations.
In order to explore the differential effect of treatment on cortisol levels, similar repeated
measurement ANOVAs were run for the half of the sample with TICS screening scale scores
above and below the median, respectively. In our study the sample median of the screening
scale for chronic stress was 16; this corresponds to the 52nd percentile of the norm sample
distribution (Schulz, et al., 2004, p. 55).
As expected, the change across time remains significant (effect of time for high stress: F(5,14) =
13.80, p = 0.00; effect of time for low stress: F(5,14) = 6.33, p = 0.00). For the high stress group,
there is a trend for the overall saliva cortisol levels to be higher in the egg powder group (effect
of group: F(1,18) = 3.27, p = 0.09). For the low stress group, there is no significant treatment
effect (effect of group: F(1,18) = 0.82, p = 0.38). Interestingly, the average cortisol level of the
placebo group is higher at all times in the low stress subsample, whereas the previously
reported trend in the high stress goes into the opposite direction. The interaction term is not
significant in both subgroup analyses (effect of time x group for high stress: F(5,14) = 1.09, p =
0.41; effect of time x group for low stress: F(5,14) = 0.87, p = 0.53). Figure 5 and Table 6 show
the data and illustrates the opposite relationship between the egg powder and placebo groups.

Final Report
Study No. M1-2008
Confidential Page 21 (34) 25.03.2009
TSST
0 1 2 3 4 5 6
Co
rtis
ol (i
n n
mo
l/l)
0
2
4
6
8
10
12
14
16
18
placebo (high stress)
egg powder (high stress)
placebo (low stress)
egg powder (low stress)
Figure 5: Time course of saliva cortisol secretion in response to the TSST separately for the high stress half and the low stress half of the sample. The graphs show group means with standard error bars.
time relative to TSST
Group –2 min. +1 min. +10 min. +20 min. +30 min. +60 min. n
Placebo high
stress
3.57
(2.14)
5.62
(2.99)
8.41
(4.15)
7.17
(3.72)
5.24
(2.69)
3.46
(1.80)
10
Egg powder
high stress
3.94
(2.02)
7.90
(3.87)
12.70
(6.81)
12.51
(7.64)
8.84
(5.73)
4.59
(2.35)
10
Placebo low
stress
5.28
(4.70)
9.76
(6.71)
13.97
(8.62)
12.16
(7.03)
8.75
(5.17)
4.99
(2.62)
10
Egg powder low
stress
4.05
(3.32)
6.34
(3.10)
10.94
(7.44)
10.40
(8.47)
7.77
(5.82)
3.87
(2.21)
10
Table 6: Saliva cortisol secretion in response to the TSST by high and the low stress groups. Means and standard deviations.
–2 min. +1 min. +10 min. +20 min. +30 min. +60 min.
TSST

Final Report
Study No. M1-2008
Confidential Page 22 (34) 25.03.2009
4.2.2 DHEA in Saliva
Due to the presence of a few very influential outliers in the DHEA data, values beyond two
standard deviations were discarded after careful inspection, yielding much smaller standard
errors.
DHEA levels were measured in saliva 2 minutes before the TSST, as well as 20 and 60 minutes
after the TSST. DHEA levels remained rather stable throughout the stress test (effect of time:
F(2,34) = 1.16, p = 0.33). There are no tangible interaction effects (effect of time x group: F(2,34) =
0.46, p = 0.64). There is a significant difference between the two groups differ in the overall
DHEA levels (effect of group: F(1,35) = 4.25, p < 0.05), which is depicted in figure 6.
TSST
1 2 3
DH
EA
(in
pg/m
l)
60
80
100
120
140
160
180
200
220
240
260
placebo
egg powder
Figure 6: Time course of DHEA in the TSST. The graphs show group means with standard error bars.
A similar difference appears already in the baseline samples. The comparison of both groups'
average baseline DHEA levels is not significant (t(36) = 1.27, p = 0.21), though. Table 7 lists the
descriptive statistics of the average baseline DHEA levels.
Group mean DHEA in pg/ml (SD) n
Placebo 605.73 (81.73) 18
Egg powder 465.10 (74.62) 20
Table 7: Average DHEA levels at baseline.
4.2.3 Heart Rate
Heart rate was measured continuously starting 20 minutes prior to the beginning of the TSST,
throughout the TSST and 20 minutes after the TSST. Data were aggregated describing different
–2 min. +20 min +60 min.
TSST

Final Report
Study No. M1-2008
Confidential Page 23 (34) 25.03.2009
study phases: first, 10 minutes while subjects were sitting, then 10 minutes before the TSST
while subjects were standing, 5 minutes of introduction to and preparation for the TSST, 5
minutes of interview during the TSST, 5 minutes of mental arithmetic during the TSST, 10
minutes after the TSST while subjects were standing, and finally 10 more minutes of sitting.
Analyses show that the TSST induced a significant increase of heart rate (effect of time: F(6,27) =
33.27, p = 0.00). However, the two experimental groups neither showed overall differences in
heart rate (effect of group: F(2,60) = 0.06, p = 0.94) nor in the time course of heart rate changes
(effect time x group: F(4,27) = 0.07, p = 0.80). Data are shown in Figure 7 and Table 8.
TSST
0 1 2 3 4 5 6 7 8
Heart
rate
(in
bpm
)
60
70
80
90
100
110
placebo
egg powder
Figure 7: Time course of heart rate in response to the TSST. The graphs show group means with standard error bars.
TSST segment
Group –20 min.
seat
–10 min.
stand
intro-
duction
speech arithmetic +10 min.
stand
+20 min.
stand
n
Placebo 77.72
(13.84)
85.13
(14.47)
94.20
(19.85)
98.60
(24.68)
96.81
(24.39)
85.79
(18.71)
74.54
(13.61)
17a
Egg
powder
78.25
(7.22)
87.88
(8.69)
97.28
(14.24)
98.30
(15.93)
97.09
(12.77)
86.27
(7.78)
76.26
(6.92)
17a
Table 8: Heart rate during the TSST. Means and standard deviations.
a A few cases were left out of the analysis due to partial gaps in the heart rate recording.
As with the cortisol data, additional heart rate analyses were run for the half of the sample
with TICS screening scale scores above and below the median, respectively.
–20 –10 introduction speech arithmetic +10 +20
TSST

Final Report
Study No. M1-2008
Confidential Page 24 (34) 25.03.2009
The change across time remains significant (effect of time for high stress: F(6,12) = 14.94, p =
0.00; effect of time for low stress: F(6,8) = 22.10, p = 0.00). There is no significant group effect
in either subsample (effect of group for high stress: F(1,17) = 1.10, p = 0.31; effect of group for
low stress: F(1,13) = 0.43, p = 0.53). The interaction term approaches significance in the low
stress group (effect of time x group: F(6,8) = 2.89, p = 0.08), but not in the high stress group
(effect of time x group for high stress: F(6,12) = 1.20, p = 0.37). Figure 8 and Table 9 show the
data and reveal a differential pattern that matches the cortisol data described above.
TSST
0 1 2 3 4 5 6 7 8
Hea
rt r
ate
(in
bp
m)
60
70
80
90
100
110
120
130
placebo (high stress)
egg powder (high stress)
placebo (low stress)
egg powder (low stress)
Figure 8: Time course of heart rates separately for the high stress half and the low stress half of the sample. The graphs show group means with standard error bars.
–20 –10 introduction speech arithmetic +10 +20
TSST

Final Report
Study No. M1-2008
Confidential Page 25 (34) 25.03.2009
TSST segment
Group –20 min.
seat
–10 min.
stand
intro-
duction
speech arithmetic +10 min.
stand
+20 min.
stand
n
Placebo high
stress
72.77
(10.89)
79.52
(10.94)
84.92
(11.69)
89.19
(20.73)
90.99
(22.51)
80.13
(16.76)
70.59
(12.53)
10
Egg powder
high stress
77.84
(5.04)
87.10
(7.81)
94.46
(9.88)
92.40
(9.92)
91.69
(7.24)
85.00
(6.01)
75.70
(5.41)
9
Placebo low
stress
84.80
(15.28)
93.15
(15.86)
107.46
(22.28)
112.04
(24.93)
105.13
(26.24)
93.87
(19.55)
80.18
(13.98)
7
Egg powder
low stress
78.59
(9.49)
88.75
(10.06)
100.46
(18.16)
104.93
(19.29)
103.17
(15.27)
87.69
(9.63)
76.89
(8.66)
8
Table 9: Heart rates during the TSST by high and the low stress groups. Means and standard deviations.
4.3 Questionnaires pre-/post-TSST
4.3.1 STAI: State Anxiety
The STAI-X1 questionnaire was administered twice on the TSST day: once shortly before the
TSST, once shortly after the TSST. The intervention yielded an significant higher post-test
score (effect of time: F(1,37) = 15.95, p = 0.00). There was no significant main effect of
experimental group and no interaction effect (effect of group: F(1,37) = 0.13, p = 0.72; effect time
x group: F(1,37) = 1.41, p = 0.24). Data are shown in Figure 9.
TSST
1 2
ST
AI
X1 s
tate
anxie
ty
36
38
40
42
44
46
48
50
52
placebo
egg powder
Figure 9: Time course of state anxiety in response to the TSST. The STAI-X1 scores before and after the TSST are displayed. The graphs show group means with standard error bars.
pre-TSST post-TSST

Final Report
Study No. M1-2008
Confidential Page 26 (34) 25.03.2009
The increase of state anxiety also tested for group differences. There was no significant group
effect for the whole sample (F(1,37) = 1.41, p = 0.24). The high stress subsample shows an
increase of 2.4 (eggpowder) and 12.5 (placebo) scale points, respectively (F(1,18) = 3.98, p =
0.06); a one-side t-test achieved significance (t(18) = 2.00, p = 0.03). For the low stress
subsample, there was no significant effect of group (F(1,17) = 0.18, p = 0.68).
4.3.2 MDBF: Mood, Wakefulness, Calmness
The effect of the TSST was similar for all three MDBF subscales. Their data are shown in
Figure 10.
Mood ratings decreased significantly (effect of time: F(1,37) = 25.56, p = 0.00), but there were no
significant group or interaction effects (effect of group: F(1,37) = 0.00, p = 0.96; effect time x
group: F(1,37) = 0.53, p = 0.47).
Wakefulness/tiredness ratings decreased significantly (effect of time: F(1,37) = 6.57, p = 0.02), but
again there were no significant group or interaction effects (effect of group: F(1,37) = 0.05, p =
0.83; effect time x group: F(1,37) = 0.02, p = 0.89).
Calmness/agitation ratings decreased significantly (effect of time: F(1,37) = 12.18, p = 0.00), too,
but there were also no significant group or interaction effects (effect of group: F(1,37) = 0.21, p =
0.65; effect time x group: F(1,37) = 0.30, p = 0.59).
TSST
1 2
MD
BF
ca
lmn
ess/a
gita
tion
10
11
12
13
14
15
16
17
placebo
egg powder
TSST
1 2
MD
BF
wakefu
lne
ss/t
ired
ne
ss
10
11
12
13
14
15
16
17
TSST
1 2
MD
BF
go
od/b
ad
mo
od
10
11
12
13
14
15
16
17
Figure 10: Time course of the three MDBF subscales in response to the TSST. Mood ratings (left), wakefulness (middle), and calmness (right) are displayed. The grapsh show group means with standard error bars.
4.3.3 Visual Analogue Scales
Participants rated their perception of the stress test on visual analogue scales three times:
before, during, and after the TSST. They rated how high their “stress perception” (VAS 1),
“anxiousness” (VAS 2) and their “insecurity” (VAS 3) during the TSST was. There were no
initial differences in the rating of the TSST between the two experimental groups before the
pre-TSST post-TSST pre-TSST post-TSST pre-TSST post-TSST

Final Report
Study No. M1-2008
Confidential Page 27 (34) 25.03.2009
test; effect of group for stress: F(1,38) = 1.77, p = 0.19, effect of group for anxiety: F(1,38) = 1.18, p
= 0.29, effect of group for insecurity: F(1,38) = 0.24, p = 0.63.
The TSST induced a significant increase on all scales in both groups (effect of time: F(2,37) =
29.61, p = 0.00). The time course of VAS stress rating approached significance (effect time x
group: F(2,37) = 2.75, p = 0.08). There was no significant difference between the two
experimental groups in stress experience (effect of group: F(1,38) = 0.02, p = 0.90). Data are
shown in Figure 11.
TSST
1 2 3
VA
S s
tre
ss (
in m
m)
0
10
20
30
40
50
60
70
placebo
egg powder
Figure 11: Time course of subjective stress experience in response to the TSST. The graph indicates the mean VAS ratings before, during, and immediately after the TSST. The graphs show group means with standard error bars.
Ratings on the other two visual analogue scales, anxiety and uncertainty, increased
significantly in both groups (effect of time for anxiety: F(2,37) = 15.70, p = 0.00; effect of time
for insecurity: F(2,37) = 28.43, p = 0.00). However, there were neither time x group, nor group
effects approaching or achieving significance (effect time x group for anxiety: F(2,37) = 0.17, p =
0.85; effect time x group for insecurity: F(2,37) = 0.54, p = 0.59; effect of group for anxiety: F(1,38)
= 0.00, p = 0.95; effect of group for insecurity: F(1,38) = 0.28, p = 0.60). Data for both scales are
shown in Figure 12.
pre-TSST during TSST post-TSST
Final Report
Study No. M1-2008
Confidential Page 28 (34) 25.03.2009
TSST
1 2 3
VA
S a
nxie
ty (
in m
m)
0
10
20
30
40
50
60
70
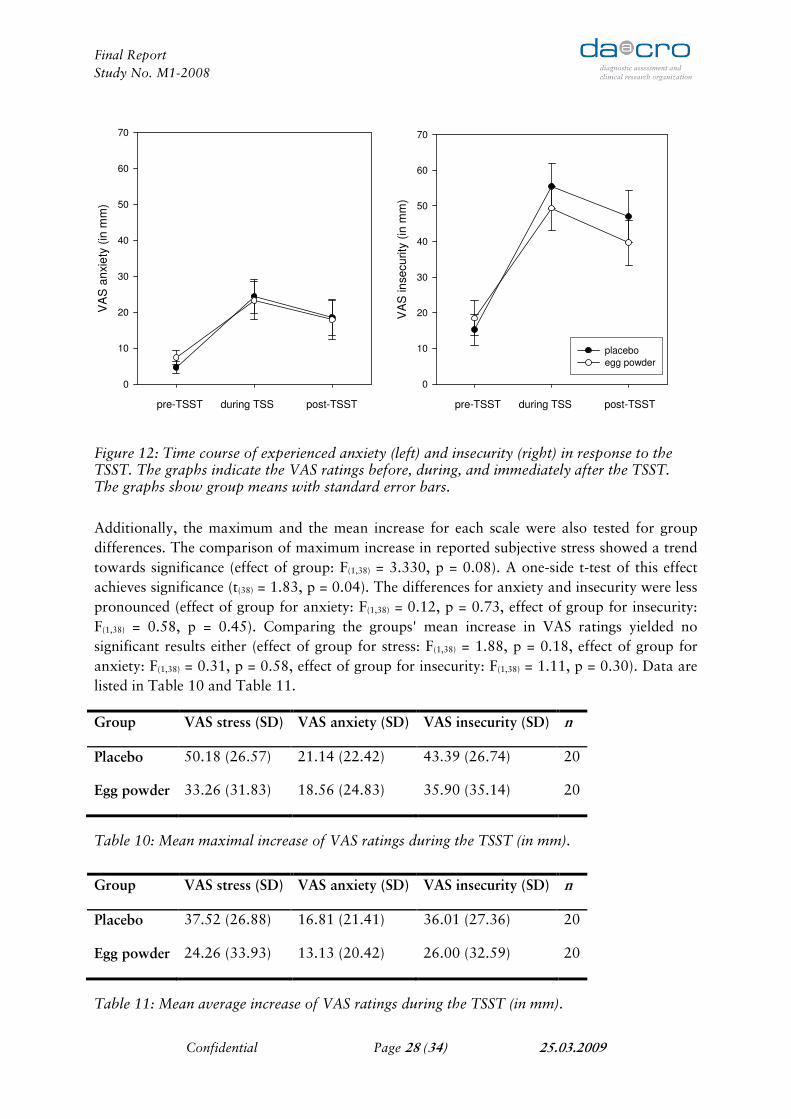
Figure 12: Time course of experienced anxiety (left) and insecurity (right) in response to the TSST. The graphs indicate the VAS ratings before, during, and immediately after the TSST. The graphs show group means with standard error bars.
Additionally, the maximum and the mean increase for each scale were also tested for group
differences. The comparison of maximum increase in reported subjective stress showed a trend
towards significance (effect of group: F(1,38) = 3.330, p = 0.08). A one-side t-test of this effect
achieves significance (t(38) = 1.83, p = 0.04). The differences for anxiety and insecurity were less
pronounced (effect of group for anxiety: F(1,38) = 0.12, p = 0.73, effect of group for insecurity:
F(1,38) = 0.58, p = 0.45). Comparing the groups' mean increase in VAS ratings yielded no
significant results either (effect of group for stress: F(1,38) = 1.88, p = 0.18, effect of group for
anxiety: F(1,38) = 0.31, p = 0.58, effect of group for insecurity: F(1,38) = 1.11, p = 0.30). Data are
listed in Table 10 and Table 11.
Group VAS stress (SD) VAS anxiety (SD) VAS insecurity (SD) n
Placebo 50.18 (26.57) 21.14 (22.42) 43.39 (26.74) 20
Egg powder 33.26 (31.83) 18.56 (24.83) 35.90 (35.14) 20
Table 10: Mean maximal increase of VAS ratings during the TSST (in mm).
Group VAS stress (SD) VAS anxiety (SD) VAS insecurity (SD) n
Placebo 37.52 (26.88) 16.81 (21.41) 36.01 (27.36) 20
Egg powder 24.26 (33.93) 13.13 (20.42) 26.00 (32.59) 20
Table 11: Mean average increase of VAS ratings during the TSST (in mm).
TSST
1 2 3V
AS
in
se
cu
rity
(in
mm
)
0
10
20
30
40
50
60
70
placebo
egg powder
pre-TSST during TSS post-TSST pre-TSST during TSS post-TSST
Final Report
Study No. M1-2008
Confidential Page 29 (34) 25.03.2009
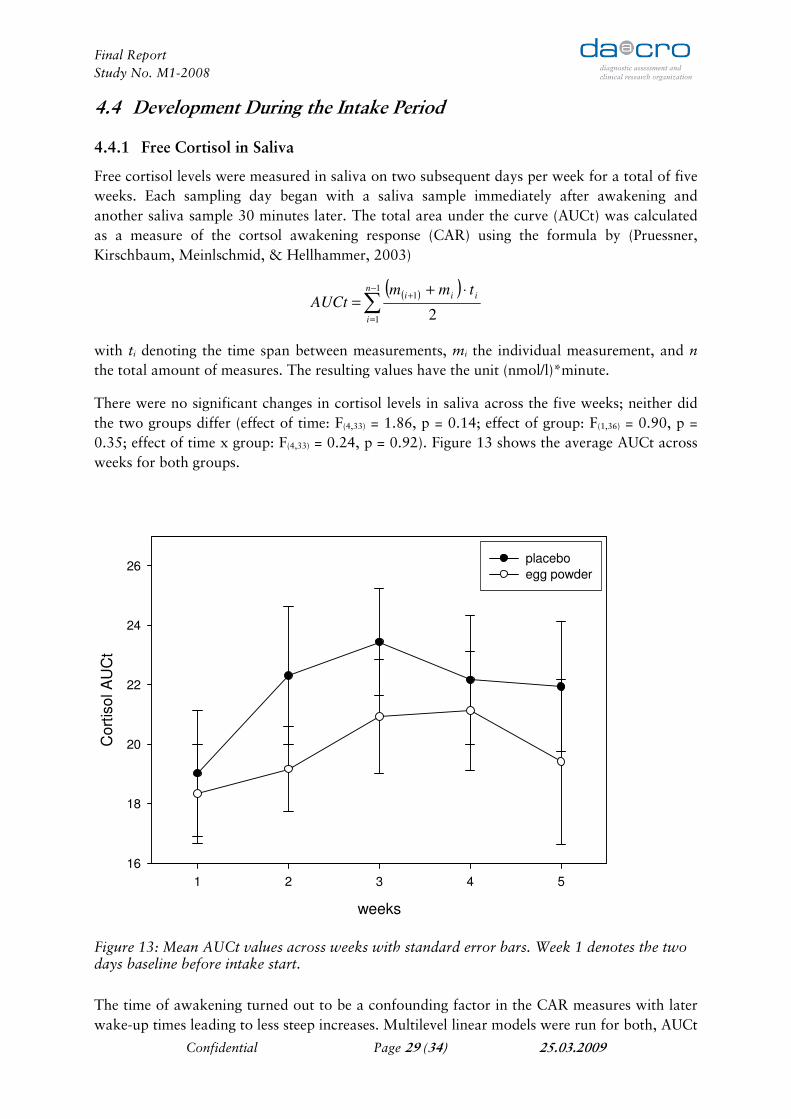
4.4 Development During the Intake Period
4.4.1 Free Cortisol in Saliva
Free cortisol levels were measured in saliva on two subsequent days per week for a total of five
weeks. Each sampling day began with a saliva sample immediately after awakening and
another saliva sample 30 minutes later. The total area under the curve (AUCt) was calculated
as a measure of the cortsol awakening response (CAR) using the formula by (Pruessner,
Kirschbaum, Meinlschmid, & Hellhammer, 2003)
( )( )∑
−
=
+⋅+
=1
1
1
2
n
i
iiitmm
AUCt
with ti denoting the time span between measurements, mi the individual measurement, and n
the total amount of measures. The resulting values have the unit (nmol/l)*minute.
There were no significant changes in cortisol levels in saliva across the five weeks; neither did
the two groups differ (effect of time: F(4,33) = 1.86, p = 0.14; effect of group: F(1,36) = 0.90, p =
0.35; effect of time x group: F(4,33) = 0.24, p = 0.92). Figure 13 shows the average AUCt across
weeks for both groups.
weeks
1 2 3 4 5
Co
rtis
ol A
UC
t
16
18
20
22
24
26placebo
egg powder
Figure 13: Mean AUCt values across weeks with standard error bars. Week 1 denotes the two days baseline before intake start.
The time of awakening turned out to be a confounding factor in the CAR measures with later
wake-up times leading to less steep increases. Multilevel linear models were run for both, AUCt

Final Report
Study No. M1-2008
Confidential Page 30 (34) 25.03.2009
and cortisol increase, to account for the tendency of the participants in the egg powder group
to get up later than the placebo group (effect of group: F(1,36) = 4.06, p = 0,051). In both cases,
the group differences, as well as the interaction terms fail to approach or achieve significance.
Figure 14 shows the AUCt data of the five weeks for high stress and low stress subsamples. In
the low stress half, the egg powder group remains rather on the same level and is significantly
lower than the placebo group (effect of group: F(1,18) = 5.16, p = 0.04).
weeks
1 2 3 4 5
Cort
iso
l A
UC
t
12
14
16
18
20
22
24
26
28
30
placebo (high stress)
egg powder (high stress)
placebo (low stress)
egg powder (low stress)
Figure 14: Mean AUCt values across weeks with standard error bars for the high and the low stress subsample.
4.4.2 Questionnaires
Comparing the groups' PSS scores at baseline with those at the TSST day yielded no significant
results (effect of time: F(1,38) = 0.53, p = 0.18, effect of group: F(1,38) = 0.71, p = 0.41, effect time
x group: F(1,38) = 0.61, p = 0.30). Data are shown in Figure 15.

Final Report
Study No. M1-2008
Confidential Page 31 (34) 25.03.2009
Visit
1 2
Pe
rce
ived
Str
ess S
ca
le
21
22
23
24
25
26
27
28
29
placebo
egg powder
Figure 15: Comparison of PSS scores at baseline and at the TSST day. The graphs show group means with standard error bars.
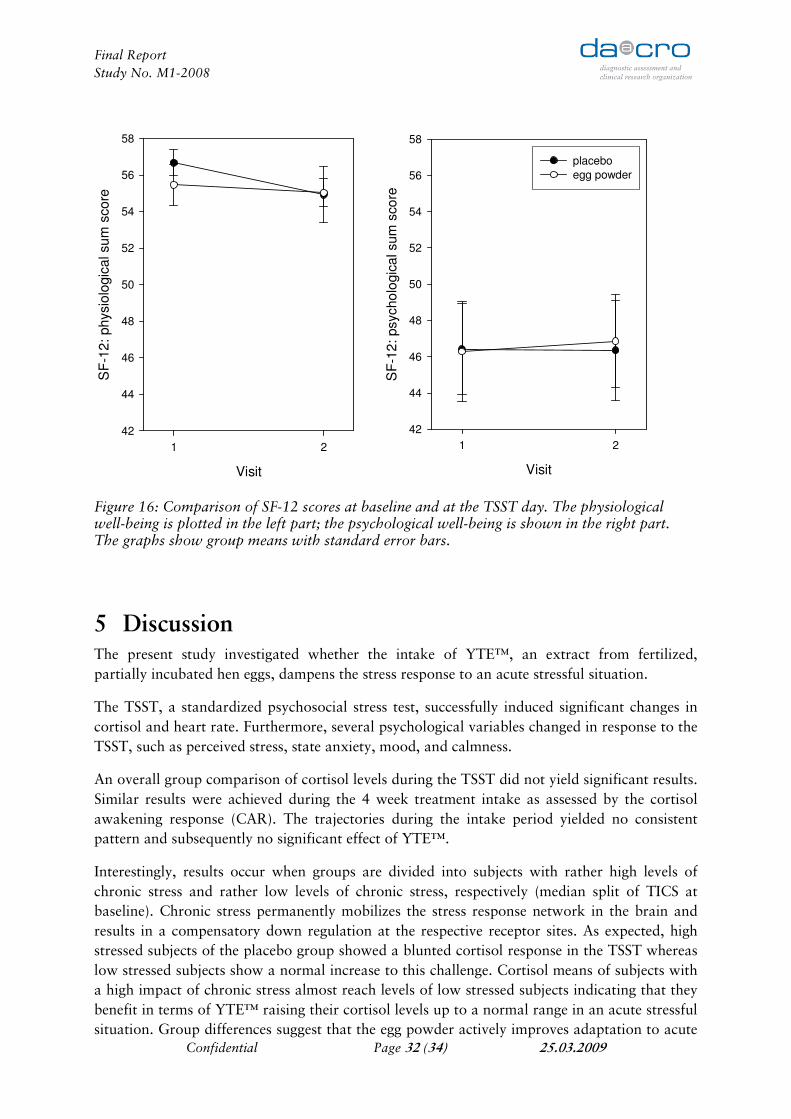
The scores of the two SF-12 scales didn’t differ significantly between groups, between baseline
and TSST day, and between groups across time. PSS scores at baseline with those at the TSST
day yielded no significant results (physiological well-being: effect of time: F(1,35) = 1.17, p =
0.29, effect of group: F(1,35) = 0.22, p = 0.64, effect time x group: F(1,35) = 0.41, p = 0.53;
psychological well-being: effect of time: F(1,35) = 0.02, p = 0.89, effect of group: F(1,35) = 0.00, p =
0.95, effect time x group: F(1,35) = 0.03, p = 0.86). Data are shown in Figure 16.
Final Report
Study No. M1-2008
Confidential Page 32 (34) 25.03.2009
Visit
1 2
SF
-12
: p
hysio
log
ica
l su
m s
co
re
42
44
46
48
50
52
54
56
58
Figure 16: Comparison of SF-12 scores at baseline and at the TSST day. The physiological well-being is plotted in the left part; the psychological well-being is shown in the right part. The graphs show group means with standard error bars.
5 Discussion The present study investigated whether the intake of YTE™, an extract from fertilized,
partially incubated hen eggs, dampens the stress response to an acute stressful situation.
The TSST, a standardized psychosocial stress test, successfully induced significant changes in
cortisol and heart rate. Furthermore, several psychological variables changed in response to the
TSST, such as perceived stress, state anxiety, mood, and calmness.
An overall group comparison of cortisol levels during the TSST did not yield significant results.
Similar results were achieved during the 4 week treatment intake as assessed by the cortisol
awakening response (CAR). The trajectories during the intake period yielded no consistent
pattern and subsequently no significant effect of YTE™.
Interestingly, results occur when groups are divided into subjects with rather high levels of
chronic stress and rather low levels of chronic stress, respectively (median split of TICS at
baseline). Chronic stress permanently mobilizes the stress response network in the brain and
results in a compensatory down regulation at the respective receptor sites. As expected, high
stressed subjects of the placebo group showed a blunted cortisol response in the TSST whereas
low stressed subjects show a normal increase to this challenge. Cortisol means of subjects with
a high impact of chronic stress almost reach levels of low stressed subjects indicating that they
benefit in terms of YTE™ raising their cortisol levels up to a normal range in an acute stressful
situation. Group differences suggest that the egg powder actively improves adaptation to acute
Visit
1 2
SF
-12
: psycho
logic
al sum
sco
re
42
44
46
48
50
52
54
56
58
placebo
egg powder

Final Report
Study No. M1-2008
Confidential Page 33 (34) 25.03.2009
stress by enhancing the endocrine and reducing the subjective stress response. Subjects with less
chronic stress do not show any beneficial effects.
Heart rate as indicator of the autonomic nervous system shows less pronounced results but
points to a similar direction as the endocrine data: whereas an overall treatment group
comparison showed no significant group differences, results emerge when looking at the high
stressed subgroup. Again, YTE™ raises participants’ heart rate in the TSST when compared to
the high stress placebo treated group.
The trajectories of the CARs revealed a lot of intra- and inter-individual variation, but no clear
group effects. The CARs of the egg powder group's low stress half remained rather stable
compared to their placebo counterpart. This may indicate that for these persons the
hypothesized attenuation of cortisol is actually happening to the degree, that the egg powder
helps people without chronic stress attaining a more balanced physiology.
In sum, these findings suggest that YTE™ restores the ability of chronically stressed subjects to
adapt to acute stress. Since the brain has no own energy stores, it organizes its own glucose
supply via the endocrine and the autonomic stress response. Particularly under enhanced
demands (e.g., stress conditions), these mechanisms serve the brain by enhancing the synthesis
and release of glucose and to support the allocation of glucose from the muscles to the brain
(Fehm, Kern, & Peters, 2006).
Notably, these effects could only be observed under stimulated conditions, whereas the
circadian levels (CAR) remain unaffected. In addition, the findings from Eskeland (1997)
suggest that such effects cannot be observed under physical stress (e.g., muscle activity).
Rather, cortisol levels seem to drop under these conditions after intake of YTE™. This
supports the view that YTE™ has no unspecific effects on the pituitary-adrenal axis but rather
differentially improves adaptation to mental and physical stress, depending on the nature of the
stressor.
This hypothesis lends further support from the observation that YTE™ clearly dampened
participants’ perceived stress assessed by VAS scales. The maximum increase during the stress
test protocol was smaller for the egg powder group compared to the placebo. Analyzing the
data set separately for the high and low stressed subjects, this result remains similar for both
subgroups. This indicates that all subjects benefit of YTE™ with respect to their perceived
stress in an acute stressful situation.
Egg powder intake is also associated with less increase of TSST-induced state anxiety at least in
the high stress subsample. The treatment appears to facilitate stressed participants’ coping with
the test situation.
The absence of changes in perceived stress and health-related quality of life across the four
weeks of intake suggests that there is no effect of egg powder intake on these more general
concepts.
The data of our exploratory analyses in chronically stressed subjects are encouraging, because
they suggest that people may only profit both psychologically and physiologically from YTE™
once they are chronically stressed. This, however, needs to be confirmed in selected samples of
chronically stressed subjects. In addition, such studies may control for effects of age and
gender.

Final Report
Study No. M1-2008
Confidential Page 34 (34) 25.03.2009
6 Literature Bullinger, M., & Kirchberger, I. (1998). SF-36. Fragebogen zum Gesundheitszustand.
Handanweisung. Göttingen, Germany: Hogrefe. Cohen, S., Kamarck, T., & Mermelstein, R. (1983). A global measure of perceived stress. J
Health Soc Behav, 24(4), 385-396. Dickerson, S. S., & Kemeny, M. E. (2004). Acute stressors and cortisol responses: a theoretical
integration and synthesis of laboratory research. Psychol Bull, 130(3), 355-391. Eskeland, B. (1997). Effects of Protein Supplements on the natural Production of Hormones
subsequent to hard Training. Oslo, Norway: Norwegian Academy of Sports. Eskeland, B., Thom, E., & Svendsen, K. O. (1997). Sexual desire in men: effects of oral
ingestion of a product derived from fertilized eggs. J Int Med Res, 25(2), 62-70. Fehm, H. L., Kern, W., & Peters, A. (2006). The selfish brain: competition for energy
resources. Prog Brain Res, 153, 129-140. Kirschbaum, C., Pirke, K. M., & Hellhammer, D. H. (1993). The 'Trier Social Stress Test'--a
tool for investigating psychobiological stress responses in a laboratory setting. Neuropsychobiology, 28(1-2), 76-81.
Kovacs-Nolan, J., Phillips, M., & Mine, Y. (2005). Advances in the value of eggs and egg components for human health. J Agric Food Chem, 53(22), 8421-8431.
Kudielka, B. M., Bellingrath, S., & Hellhammer, D. H. (2006). Cortisol in burnout and vital exhaustion: an overview. G Ital Med Lav Ergon, 28(1 Suppl 1), 34-42.
Kudielka, B. M., Hellhammer, D. H., & Kirschbaum, C. (2007). Ten years of research with the trier social stress test-revisited. In E. Harmon-Jones & P. Winkielman (Eds.), Social neuroscience: integrating biological and psychological explanations of social behavior (pp. 56-83). New York: Guilford Press.
Lauritsen, J. M., & Bruus, M. (2004). EpiData (version 3.1). A comprehensive tool for validated entry and documentation of data. Odense, Denmark: The EpiData Association.
Laux, L., Glanzmann, P., Schaffner, P., & Spielberger, C. D. (1981). State Trait Angstinventar (STAI). Weinheim, Germany: Beltz.
Mihaescu, G., Olinescu, R., & Oancea, F. (2005). Significant modification of lipid metabolism in aged persons following the treatment with a nutritive supplement containing embryonary peptides--preliminary results. Rom J Intern Med, 43(1-2), 133-139.
Pruessner, J. C., Kirschbaum, C., Meinlschmid, G., & Hellhammer, D. H. (2003). Two formulas for computation of the area under the curve represent measures of total hormone concentration versus time-dependent change. Psychoneuroendocrinology, 28(7), 916-931.
Schulz, P., Schlotz, W., & Becker, P. (2004). Trierer Inventar zum chronischen Stress (TICS). Göttingen, Germany: Hogrefe.
Steyer, R., Schwenkmezger, P., Notz, P., & Eid, M. (1997). Mehrdimensionaler Befindlichkeitsfragebogen (MDBF). Göttingen, Germany: Hogrefe.