L6+7 2012 Phylogenetics - Trinity College Dublin
39
10/17/12 1 Phylogenetics Molecular Phylogenetics • Study evolutionary relationships using DNA, protein • Uses: 1. Order sequence/species divergences 2. Estimate time of divergence 3. Describe sequence of events in lineage
Transcript of L6+7 2012 Phylogenetics - Trinity College Dublin

10/17/12
1
Phylogenetics
Molecular Phylogenetics • Study evolutionary
relationships using DNA, protein
• Uses: 1. Order sequence/species
divergences 2. Estimate time of
divergence 3. Describe sequence of
events in lineage

10/17/12
2
The time will come, I believe, though I shall not live to see it, when we shall have fairly true genealogical trees of each great kingdom of Nature.
Charles Darwin
Phylogenetic Trees
time

10/17/12
3
Terminology
time
Root
Branches
Nodes Tips
Generally extant species – sometimes called Operational Taxonomic Units (OTUs)
Terminology - clades

10/17/12
4
Information
• Branching order (topology) – Relative closeness of different taxa
• Branch length – Amount of divergence
Rooted and unrooted trees A
B
C
D
E
A
B
E
C
D
ROOTED UNROOTED

10/17/12
5
Rooted and unrooted trees A
B
C
D
E
A
B
E
C
D
ROOTED UNROOTED
Rooted and unrooted trees A
B
C
D
E
A
B
E
C
D
ROOTED UNROOTED

10/17/12
6
Rooted and unrooted trees A
B
C
D
E
A
B
E
C
D
ROOTED UNROOTED
Rooted and unrooted trees A
B
C
D
E
A
B
E
C
D
ROOTED UNROOTED
10/17/12
7
A
B
C
A
B
C
A
B
C
A
B
C
A
B
C
D A B
C D A
B
C
D
A
B C
D
A
B C
D
A
B C
D
A
B
C D
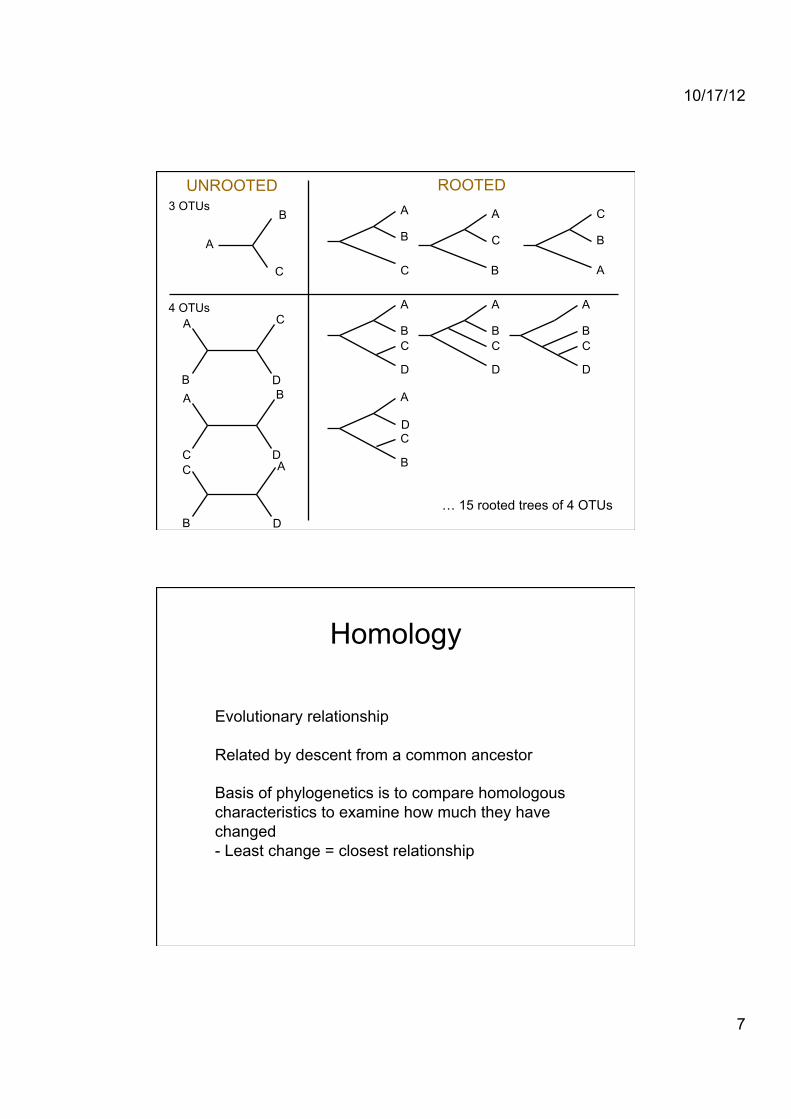
… 15 rooted trees of 4 OTUs
3 OTUs
4 OTUs
UNROOTED ROOTED
Homology
Evolutionary relationship
Related by descent from a common ancestor
Basis of phylogenetics is to compare homologous characteristics to examine how much they have changed - Least change = closest relationship

10/17/12
8
Homology vs. Analogy
Homologous forelimbs
Analogous wings
Homology = evolutionary relationship (often detected through similarity)
Analogy = similarity due to convergent evolution
Convergent evolution of analogous burrowing characteristics
North American mole (placental mammal)
Australian mole (marsupial)

10/17/12
9
Leopard Domestic cat
Common ancestor
Domestic cats did not evolve from leopards
Divergence of species from a common ancestor
(b) Paraphyletic. Grouping 2 does not meet the cladistic criterion: It is paraphyletic, which means that it consists of an ancestor (A in this case) and some, but not all, of that ancestor’s descendants. (Grouping 2 includes the descendants I, J, and K, but excludes B–H, which also descended from A.)
(c) Polyphyletic. Grouping 3 also fails the cladistic test. It is polyphyletic, which means that it lacks the common ancestor of (A) the species in the group. Further- more, a valid taxon that includes the extant species G, H, J, and K would necessarily also contain D and E, which are also descended from A.
D E
C
G H
F
J K
I
D E
C
G H
F
J K
I
D E
C
G H
F
J K
I
B
A
B
A
B
A
Grouping 2 Grouping 3 Grouping 1
(a) Monophyletic. In this tree, grouping 1, consisting of the seven species B– H, is a monophyletic group, or clade. A mono- phyletic group is made up of an ancestral species (species B in this case) and all of its descendant species. Only monophyletic groups qualify as legitimate taxa derived from cladistics.

10/17/12
10
Monophyletic & Paraphyletic
Mammals
Turtles and tortoises
Snakes and lizards
Crocodiles
Birds
REPTILES
Monophyletic & Paraphyletic
• Monophyletic – Natural clade;
contains all of the descendents of a common ancestor
• Paraphyletic – Taxonomic group
whose most recent common ancestor is shared by another taxon
Orangutan
Gorilla
Human
Chimpanzee
Birds
Monotremes
Marsupials
Placental mammals mammals
“Great apes”

10/17/12
11
Phylogeny of living mammals and other amniotes
Duplications and speciations
zebrafish
chicken
mouse
human 1
human 2
human 1
human 2
mouse 1
mouse 2
chicken
zebrafish
speciation
duplication
10/17/12
12
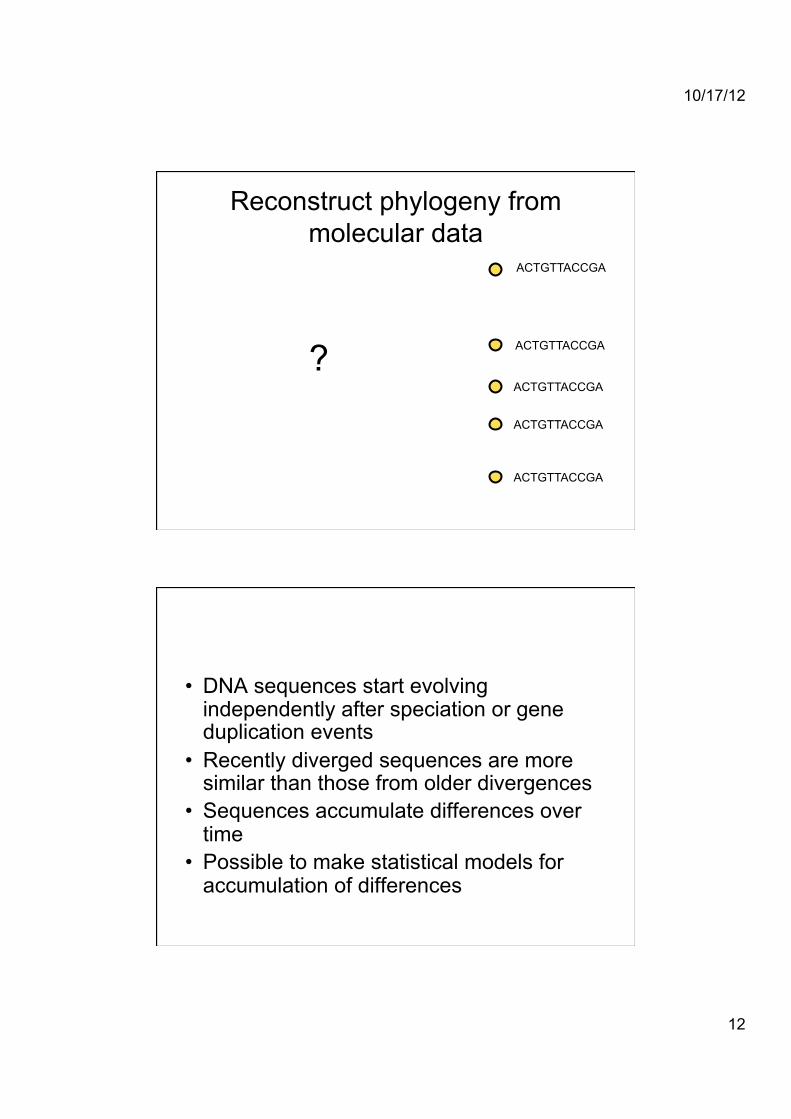
Reconstruct phylogeny from molecular data
ACTGTTACCGA
ACTGTTACCGA
ACTGTTACCGA
ACTGTTACCGA
ACTGTTACCGA
?
• DNA sequences start evolving independently after speciation or gene duplication events
• Recently diverged sequences are more similar than those from older divergences
• Sequences accumulate differences over time
• Possible to make statistical models for accumulation of differences

10/17/12
13
DNA is a good tool for taxonomy
DNA sequences have many advantages over classical types of taxonomic characters: – Character states can be scored unambiguously – Large numbers of characters can be scored for
each individual – Information on both the extent and the nature of
divergence between sequences is available (nucleotide substitutions, insertion/deletions, or genome rearrangements)
Comparing molecular sequences • DNA – 4 bases: A, C, T, G • Any base can be substituted by another base with a
single event • Protein – 20 amino acids • Some amino acid substitutions require more events at
the DNA level • Ile Thr : at least one DNA change
• AUU ACU • AUC ACC • AUA ACA
• Ile Cys: at least two DNA changes • AUU (Ile) AGU (Ser) UGU (Cys) • AUU (Ile) UUU (Phe) UGU (Cys)

10/17/12
14
Comparing molecular sequences
• Multiple sequence alignment • Align corresponding positions of DNA or
protein sequence Sequences of fly homeodomains
Methods of Tree reconstruction
• Distance • Maximum Parsimony • Maximum Likelihood • Bayesian

10/17/12
15
Genetic distance
• Distance from one sequence to another • Hamming Distance
– Count number of differences
• Construct tree by grouping taxa with smallest distance first

10/17/12
16
Maximum Parsimony
• Find topology requiring smallest number of evolutionary changes
• DNA or protein alignment • Sites may be informative or uninformative • Uninformative
– conserved in all taxa – Only different in one taxon
• Informative – Favours one topology over others
Parsimony
Tree I Tree II Tree III
A
G
Pattern: Species 1: G Species 2: G Species 3: A Species 4: A
G
G
A
A
A G
A
G
A
G
A A G
A
G
A
G
A
+1 +2 +2 Score:
10/17/12
17
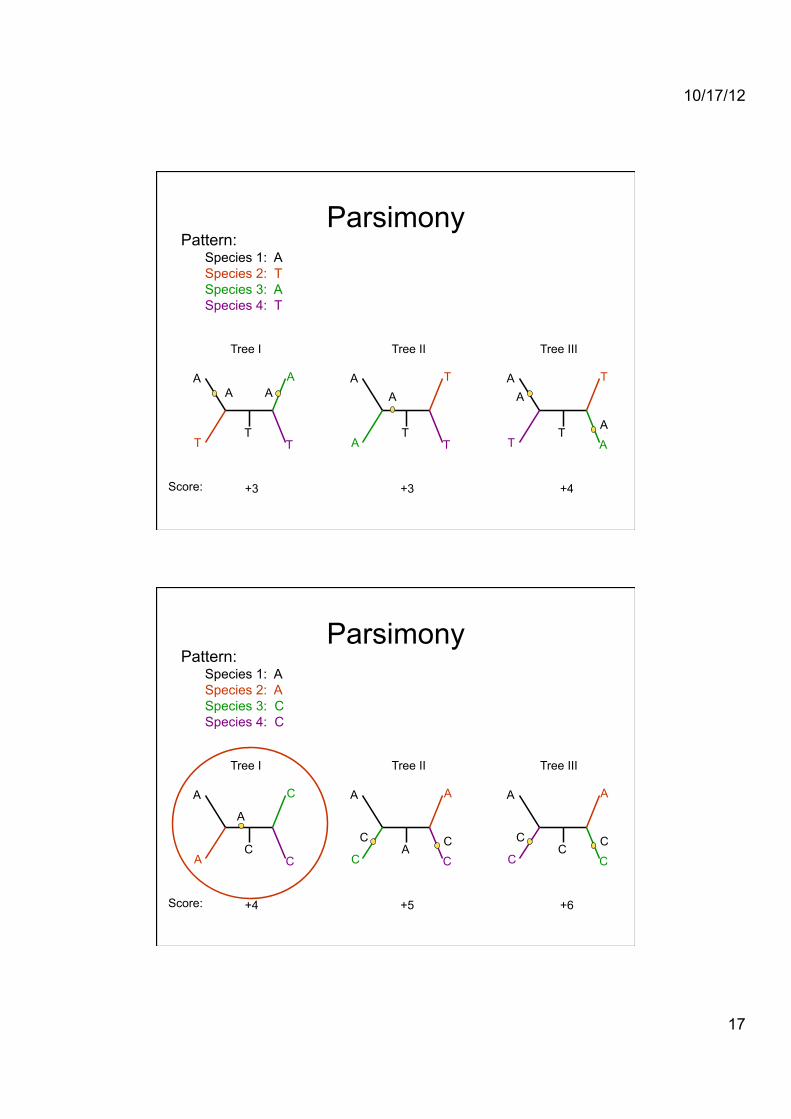
Parsimony
Tree I Tree II Tree III
A
T
Pattern: Species 1: A Species 2: T Species 3: A Species 4: T
T
A
T
A
T A
A
T
T
A
A T
T
A
A
T
A
+3 +3 +4 Score:
A
Parsimony
Tree I Tree II Tree III
A
C
Pattern: Species 1: A Species 2: A Species 3: C Species 4: C
A
A
C
C
C A
C
A
C
A
C C C
C
A
C
A
C
+4 +5 +6 Score:

10/17/12
18
Maximum Likelihood
• Likelihood L of a tree is the probability of observing the data given the tree L = P(data|tree)
• Find the tree with the highest Likelihood value
• Results depends on model of nucleotide substitution
• Computationally time-consuming
Outgroup rooting of unrooted trees
• Outgroup – related sequence that definitely diverged earlier (paleontological evidence)
• Not too distantly related (tree method becomes unreliable)
human mouse
rat
human
mouse
rat
chicken

10/17/12
19
True tree and inferred tree
• There is only one true tree • Represents branching order of species or
sequence divergences • Tree inference methods give an answer • May not be correct • e.g. parsimony method – may get several
equally parsimonious results
Molecular clock

10/17/12
20
The clock for different genes ticks at a different rate
Which gene to use? • Chose a gene which is appropriate for your
question • For studies of evolutionary relationships, genes
under unchanging selection • Use more rapidly evolving genes for looking at
closely related taxa • Use slow-evolving genes to resolve deep
divergences

10/17/12
21
• We know the age of node X from - fossil evidence - biogeographical calibration - sample date (bacteria)
• Estimate genetic distance between A and C
• Use age of node X to calibrate the clock - how many substitutions per million years?
• Then estimate genetic distance between B and C
• Convert distance to time to obtain date of node Y
A
B
C
100 mya ? mya
X
Y
Estimating times of divergence
+ Importance of confidence intervals… • James Ussher (1581 - 1656) primate of Ireland: established the first
day of creation as Sunday upon the 23rd day of the Julian October 4004 BC…
• It is important to give confidence intervals! molecular clocks estimates are based on fossil dates that are most often imprecise:
time
minimum age of the species
1. Stratigraphic error 2. Fossils provide only minimum age estimates
maximum age ? ie: was the species present?
• reliable calibration dates are required

10/17/12
22
Modified from Bromham and Penny 2003
Dates of formation of islands give reliable calibration of the clock
Molecular phylogenetics
1. Solved outstanding questions 2. Drastic revision of traditional view 3. Pointed to new areas of research
10/17/12
23
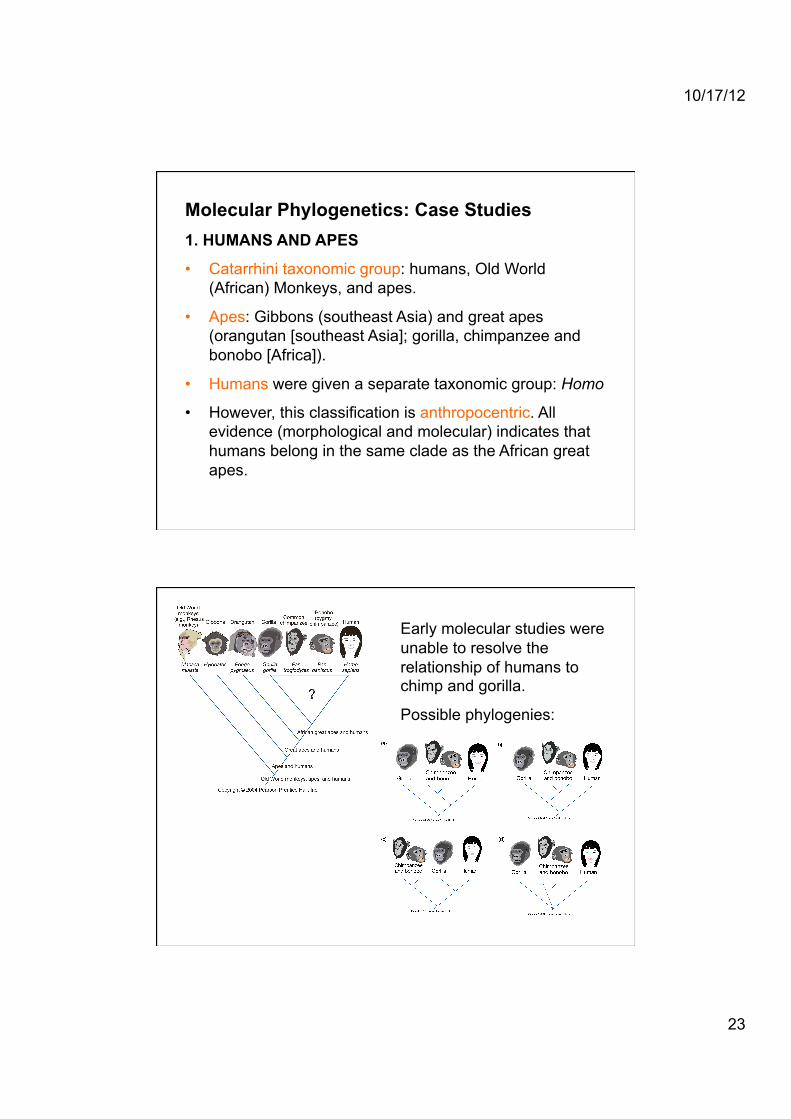
Molecular Phylogenetics: Case Studies 1. HUMANS AND APES
• Catarrhini taxonomic group: humans, Old World (African) Monkeys, and apes.
• Apes: Gibbons (southeast Asia) and great apes (orangutan [southeast Asia]; gorilla, chimpanzee and bonobo [Africa]).
• Humans were given a separate taxonomic group: Homo
• However, this classification is anthropocentric. All evidence (morphological and molecular) indicates that humans belong in the same clade as the African great apes.
Early molecular studies were unable to resolve the relationship of humans to chimp and gorilla.
Possible phylogenies:

10/17/12
24
The evidence Phylogenetic tree based on the DNA sequence of a mitochondrial gene.
Many other analyses based on other genes produced the same tree topology indicating that humans and chimps are more closely related than either is to gorilla.
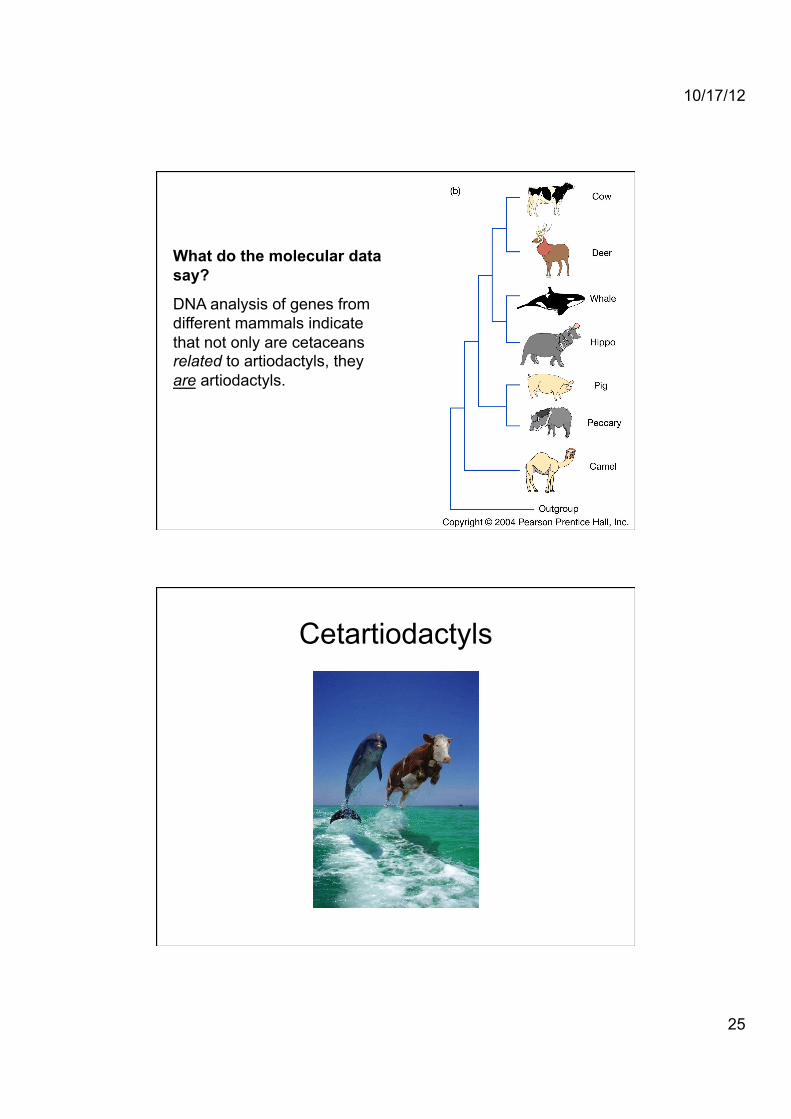
2. The relationship of whales to other mammals
Morphologically, whales, dolphins and porpoises (Cetaceans) are quite distinct from other mammals – made classical phylogenetic analysis difficult.
Traditionally, were classified as close relatives of ungulates (hoofed mammals), specifically as relatives of the artiodactyls
10/17/12
25
What do the molecular data say?
DNA analysis of genes from different mammals indicate that not only are cetaceans related to artiodactyls, they are artiodactyls.
Cetartiodactyls
10/17/12
26
Viral Evolution: Kinds of questions
• Where do viruses come from? – Where did the infection start? – Who infected whom?
• How does virus evolution affect treatments?
• How does evolution work?
Advantages • Medical importance • Rapid rate of evolution: with sequential samples,
can watch evolution in action • Simple genomes
Disadvantages • Limited number of sites • Evolution can be too fast - cannot align
sequences
Studying virus evolution

10/17/12
27
3. Where did HIV come from?
The genome of the HIV virus is a record of its evolutionary past.
Closely related viruses are found in monkeys (called Simian Immunodeficiency viruses [SIV], though don’t make them sick)
HIV • Human Immunodeficiency
Virus • Primate lentivirus • Two copies of RNA genome
packaged within the virion • Integrates into host (DNA)
genome • Reverse transcriptase
enzyme – Makes DNA from an RNA
template (reverse of normal transcription)

10/17/12
28
HIV
• Two major classes of HIV – HIV-1; responsible for global epidemic of AIDS – HIV-2; independent virus, also causes AIDS
• HIV-1 and HIV-2 are appear to be derived from the Simian Immunodeficiency viruses (SIVs)
SIV
• SIVs present in more than 30 African primate species
• Called immunodeficiency viruses in monkeys, but don’t actually cause disease
• e.g. all adult sooty mangabey and grivet monkeys appear to be infected with SIV, but no pathogenic effects are seen

10/17/12
29
• Have the viruses been around ever since the common ancestor of humans and monkeys, and only recently became a problem because of some change in behaviour? Or is there another explanation for their origin?
If the virus was present in humans since the common ancestor with monkeys, then we would expect that the topology of the tree of the viruses is the same as that of the host.
Host species tree
The tree of HIV and relatives shows:
1. There is more than one kind of HIV (HIV-1 and HIV-2)
2. Within each kind of HIV, all the viruses do not group together
3. The tree topology does not mirror the known topology of primates.
4. The human viruses are very closely related to monkey and ape viruses
The molecular data indicate that HIV came from a zoonotic transmission from other primates.
HIV1 came from chimp
HIV2 came from Sooty mangabeys.
This is plausible because people living in the area that is the epicentre for each of these infections regularly hunt and eat these primates

10/17/12
30
HIV - 2
• Closely related to sooty mangabey virus (SIVsm) – Genomically indistinguishable – Closely related phylogenetically – Substantial numbers in wild-living populations – Natural habitat of sooty mangabey coincides with the
epicentre of HIV-2 epidemic – sooty mangabey hunted for food and kept as pets
• Cross-species transmission from this monkey seems most likely
Multiple origins of HIV-2
• HIV-2 subtypes do not group together – i.e. not all HIV-2 are similar to the same
SIVsm – Infer several separate cross-species
transmissions – Each HIV-2 subtype is from a different event

10/17/12
31
Where did HIV-1 come from?
• Hypothesis: Zoonotic infection from a monkey species
• Which one? • This question was harder to answer for
HIV-1 than for HIV-2 – Evolved rapidly in human populations – High variation of HIV-1 – Many strains may have changed significantly
from the virus transmitted from simians
HIV-1
• Virus responsible for global epidemic • Three classes: M; N; O
– M: “main” – majority of subtypes spread across the world • Subtypes labelled A-K
– O: “other” – Cameroon, Gabon, Equatorial Guinea
– N: “Not M or O” – Cameroon, rare
10/17/12
32
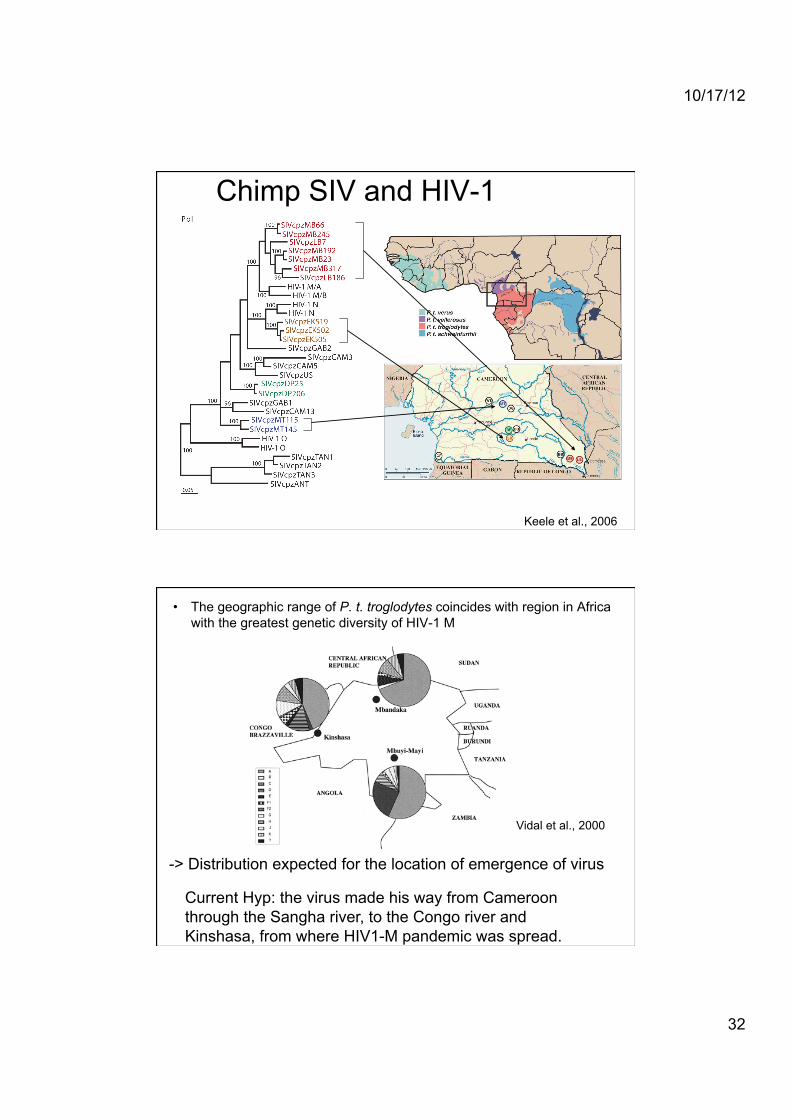
Chimp SIV and HIV-1
Keele et al., 2006
• The geographic range of P. t. troglodytes coincides with region in Africa with the greatest genetic diversity of HIV-1 M
Current Hyp: the virus made his way from Cameroon through the Sangha river, to the Congo river and Kinshasa, from where HIV1-M pandemic was spread.
-> Distribution expected for the location of emergence of virus
Vidal et al., 2000

10/17/12
33
Origin of HIV-1 M and HIV1- N • SIVcpz from P. t. troglodytes is closest to HIV-1 M and N
groups
- HIV-1 M and N are clustered with different strains of SIVcpz
- Chimpanzee is commonly hunted for food, especially in west equatorial Africa
Origin of HIV-1 M:
Expected: greater diversity in the location of the start of the epidemics
Geographic patterns of diversity
Origin of the virus
Diversification into subtypes
Migration of some individuals that seed the epidemics in new territories
bottleneck : -> low diversity in these new territories
-> high diversity in the epicenter of the epidemics

10/17/12
34
Geographic patterns of diversity
• Most isolates from Europe and North America were subtype B
• Also found in Brazil, Thailand, Egypt, and Uganda
• Subtype C principally found in south and east coast of Africa and west coast of India
• By contrast observe high diversity in Africa – From 36 samples observed 4 subtypes
10/17/12
35
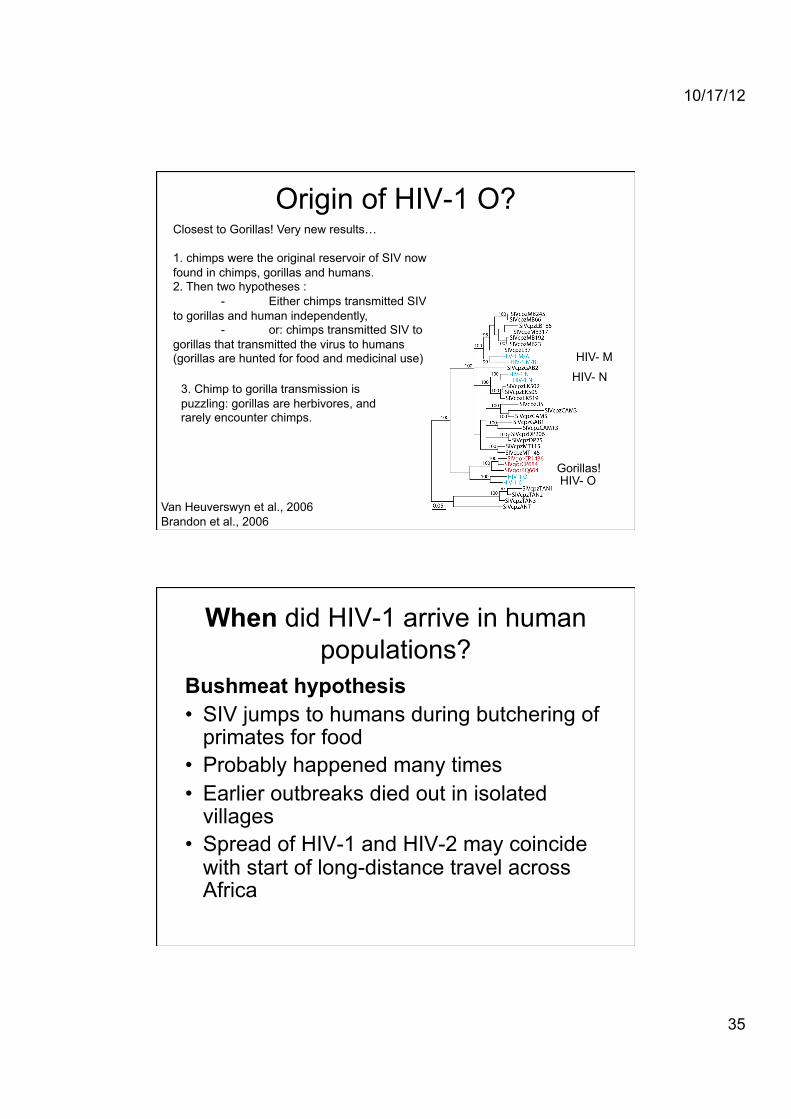
Origin of HIV-1 O?
Van Heuverswyn et al., 2006 Brandon et al., 2006
HIV- O
Closest to Gorillas! Very new results…
1. chimps were the original reservoir of SIV now found in chimps, gorillas and humans. 2. Then two hypotheses :
- Either chimps transmitted SIV to gorillas and human independently, - or: chimps transmitted SIV to gorillas that transmitted the virus to humans (gorillas are hunted for food and medicinal use)
Gorillas!
HIV- M
HIV- N 3. Chimp to gorilla transmission is puzzling: gorillas are herbivores, and rarely encounter chimps.
When did HIV-1 arrive in human populations?
Bushmeat hypothesis • SIV jumps to humans during butchering of
primates for food • Probably happened many times • Earlier outbreaks died out in isolated
villages • Spread of HIV-1 and HIV-2 may coincide
with start of long-distance travel across Africa

10/17/12
36
First human AIDS case?
• Oldest case of AIDS-like symptoms – Manchester sailor – Died of AIDS-like illness in 1959 – Unconfirmed if it was HIV
• Use molecular evolutionary analyses to date the origin of HIV-1
Molecular clock
• Estimated a rate of HIV-1 evolution of 0.005-0.01 nucleotide substitutions per site per year (based on sequential samples)
• Indicates that the M group viruses that dominate the global epidemic shared a common ancestor in the 1930s
- > counter claims that the virus was spread through the distribution of contaminated polio vaccine in 1957-60

10/17/12
37
• Korber et al., Science (2000) 288:1789
• Linear regression of genetic divergence of HIV sequence against time of isolation of the virus sample
• Used maximum likelihood phylogenetic algorithms
• Estimated common ancestor of M group existed in 1931
95% confidence intervals: 1915-1941
Some criticism that they didn’t allow for recombination between viruses
SIVcpz is a recombinant
• Simple explanation: chimp hunt rcm and gsn, acquired SIVrcm and SIVgsn, and then recombination occurred.
• Cross-species transmission of SIV under natural conditions
cpz: chimp, rcm = red-capped mangabey, gsn = greater spot-nosed monkeys
Bailes et al., 2003
Dis
tanc
e S
IVcp
z - S
IVx
10/17/12
38
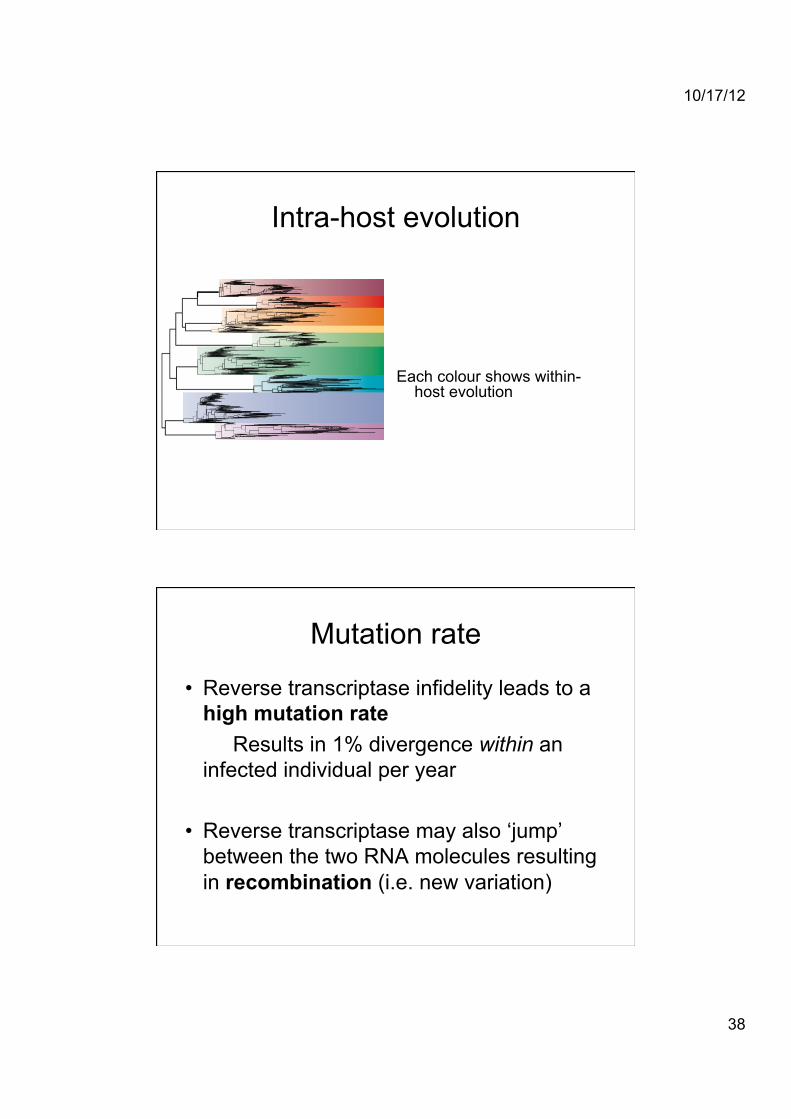
Intra-host evolution
Each colour shows within-host evolution
Mutation rate
• Reverse transcriptase infidelity leads to a high mutation rate Results in 1% divergence within an infected individual per year
• Reverse transcriptase may also ‘jump’ between the two RNA molecules resulting in recombination (i.e. new variation)

10/17/12
39
Track the sequence in a patient
• Several studies have collected sequence samples of the virus from a single patient through several years
• There is variation in the samples both temporally and “spatially”
• Evolution
Immune system evasion • High mutation rate enables the evasion of the
host (infected human) immune system - Antibodies are quickly “out of date”
• Positive selection (selection in favour of new mutations) exerted by host immune system - Very high ratio of non-synonymous (amino-acid changing) substitutions to synonymous substitutions
Average of one adaptive fixation event per 2.5 months in HIV-1 env gene
Complicated patterns.


![[MP] 02 - Phylogenetics - biologia.campusnet.unito.it · Molecular Phylogenetics Basis of Molecular Phylogenies Overview ¾Phylogenetics Definitions ¾Genetic Variation and Evolution](https://static.fdocuments.in/doc/165x107/5c6216d809d3f238158b4601/mp-02-phylogenetics-molecular-phylogenetics-basis-of-molecular-phylogenies.jpg)