L1-2 Introduction to Distance Sampling
14
Introduction to Distance Sampling Overview of wildlife population assessment methods Plot sampling Distance sampling Basic idea Types of distance sampling
Transcript of L1-2 Introduction to Distance Sampling

Introduction to Distance Sampling
Overview of wildlife population assessment methods
Plot sampling
Distance sampling
Basic idea
Types of distance sampling

Wildlife Population Assessment
How many are there?
What are their trends?
Why?
Vital rates (survival, fecundity, etc)
What might happen if…?
Scenario planning
Risk assessment
Decision support

Rapid assessment methods and indicesPerhaps emphasis is just on trends
Questionnaire surveys
e.g. UK adder survey
Presence/absence
e.g. UK otter surveys
Index methods
e.g., Point counts for birds (US Breeding Bird Survey)
Warning!
For estimating trends, must assume no trend in proportion detected

Methods of estimating abundance•Complete census
•Plot sampling
•Distance sampling
•Mark-recapture
•Removal method

Complete census
LetN = population size (abundance)A = size of study region = 5000D = animal density = N/A
Method: count everything!N = 412D = 412/5000 = 0.0824
Rarely possible in practice!
0 20 40 60 80 100
0
10
20
30
40
50

Plot sampling (or strip transect)
• Let
k = number of strips = 5
L = total line length = 50x5 = 250
w = the strip half-width = 1
a = area of region covered
= 2wL = 2x1x250 = 500
n = number of animals counted = 36
• From this, how do we estimate abundance? A=5000
0 20 40 60 80 100
0
10
20
30
40
50
0 20 40 60 80 100
0
10
20
30
40
50
0 20 40 60 80 100
0
10
20
30
40
50
0 20 40 60 80 100
0
10
20
30
40
50
w
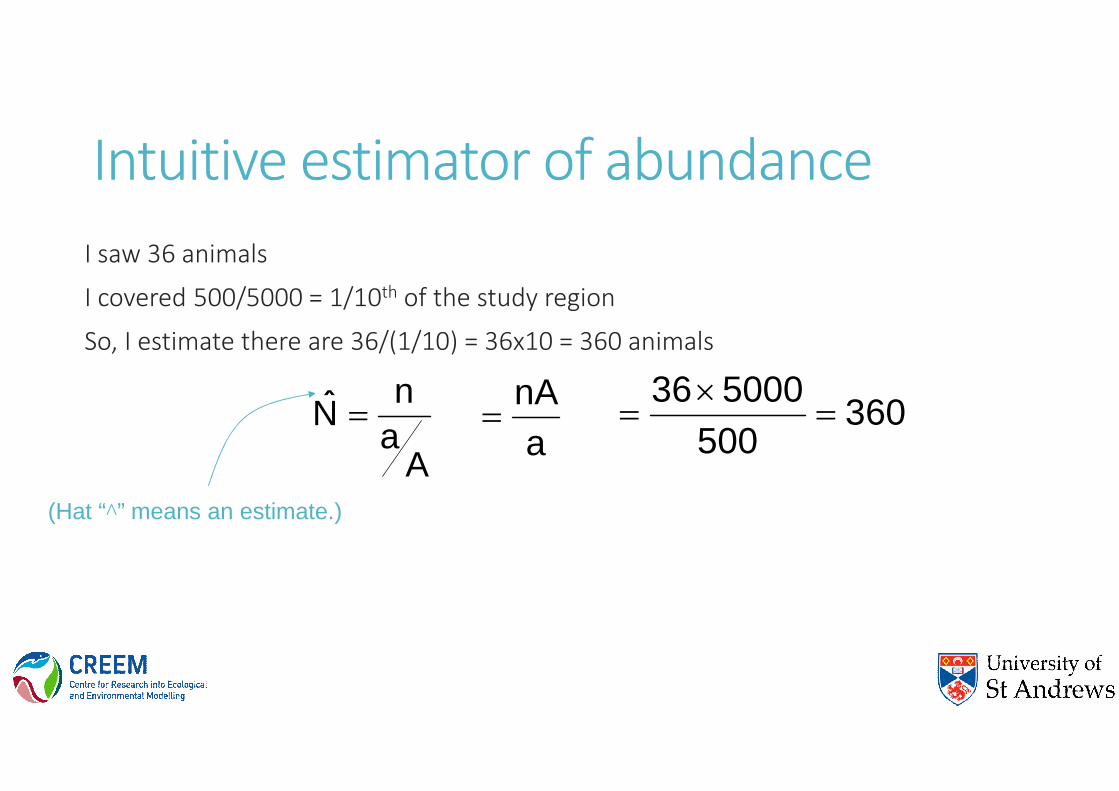
Intuitive estimator of abundance
I saw 36 animals
I covered 500/5000 = 1/10th of the study region
So, I estimate there are 36/(1/10) = 36x10 = 360 animals
Aa
nN ˆ
a
nA
(Hat “^” means an estimate.)
360500
500036

Concept – Plot samplingStep 1: How many in covered region, Na?
Step 2: Given Na ,how many in study region, N
Overall:
nNa
Aa
NN aˆ
Plot sampling:
If transects placed at random:
for strip transects
Aa
nN ˆ
a
nA
wL
nA
2

Distance (line transect) sampling
7.0ˆ aP
• An extension of plot samplingwhere not all animals in thecovered region are detected
• Herew = 2 (strip can be wider, as don’t have
to see everything)
a = 1000
n = 68 (more animals seen)
• LetPa = proportion of animals detected
within covered region
• Imagine we know (or canestimate)
0 20 40 60 80 100
0
10
20
30
40
50
0 20 40 60 80 100
0
10
20
30
40
50
0 20 40 60 80 100
0
10
20
30
40
50
0 20 40 60 80 100
0
10
20
30
40
50
A=5000

Intuitive estimator of abundance
I saw 68 animals
The estimated proportion seen was 0.7
So, I estimate the true number of animals in the strips was 68/0.7 = 97.1
I covered 1000/5000 = 1/5th of the study region
So, I estimate there are 97.1/(1/5) = 485.7 animals
Aa
Pn
N aˆ
ˆ aPa
nAˆ
7.4857.01000
500068

Concept – Distance samplingStep 1: How many in covered region, Na?
Step 2: Given Na ,how many in study region, N
Overall:
a
a PnN ˆ
ˆ
Aa
NN a
ˆˆ
Distance sampling:
If transects placed at random:
for line transects
• So how do we estimate Pa?
Aa
Pn
N aˆ
ˆ aPa
nAˆ
aPwL
nAˆ2

Estimating PaRecord perpendicular distance, x, from transect line to each observed object

Estimating Pa
these animals areestimated to have beenmissed
assume seeeverything atzero distance
frequency
if you saw everything at all distances, onaverage the histogram bars should be here
perpendicular distance from line, x 2
12

Estimating Pa
Area of rectangle = 12x2 = 24
Area under curve = 0.25x(12+11.5+11+10.5+9+7+4+3) = 17
So
aP̂
7.024
17ˆ aP
area under curve
area under rectangle
frequency
perpendicular distance from line, x 2
12