l-/inkley, California · DESERT VIEW DAIRY 37501 MOUNTAINVIEW ... 4.3.1.3 TOTAL DISSOLVED SOLIDS...
27
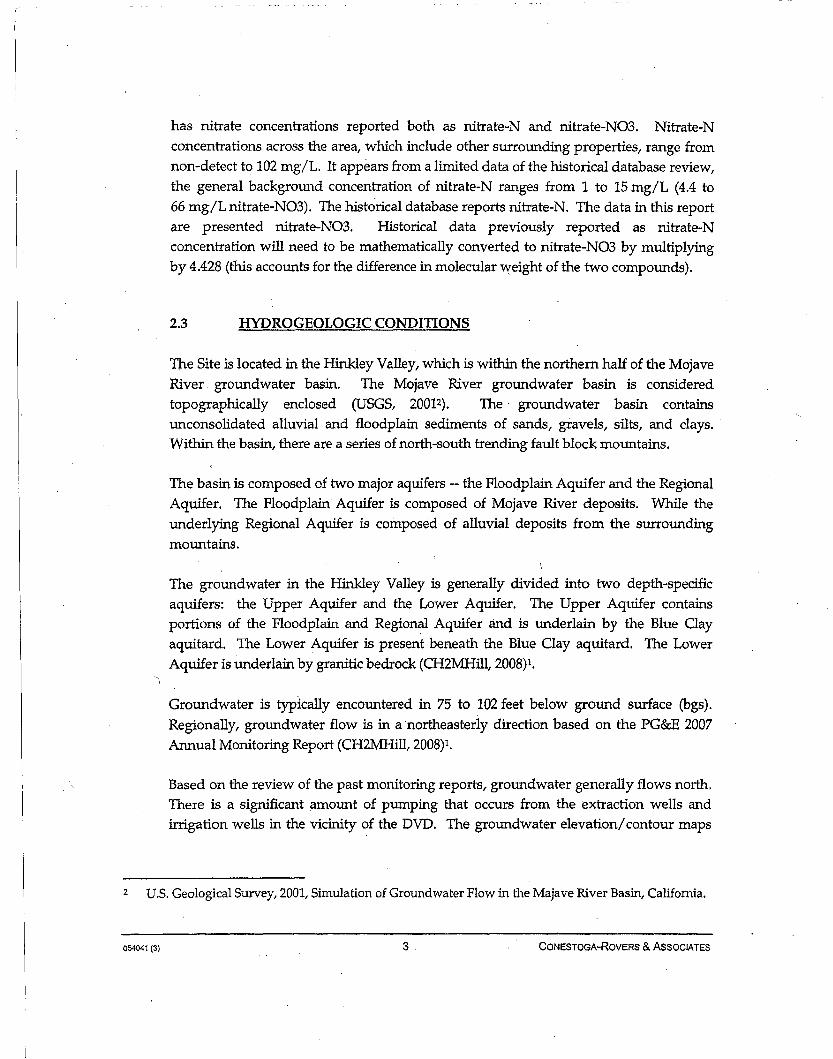
NOTE: DARK AREAS ARE IRRIGATED LAND. 054041-04(GIBS001 }GN-SP003 Dec 0512008 I 1984 AERIAL PHOTO DESERT VIEW DAIRY 37501 MOUNTAINVIEW ROAD . l-/inkley, California
Transcript of l-/inkley, California · DESERT VIEW DAIRY 37501 MOUNTAINVIEW ... 4.3.1.3 TOTAL DISSOLVED SOLIDS...

NOTE: DARK AREAS ARE IRRIGATED LAND.
~054041-04(GIBS001 }GN-SP003 Dec 0512008 I
~
1984 AERIAL PHOTODESERT VIEW DAIRY
37501 MOUNTAINVIEW ROAD. l-/inkley, California

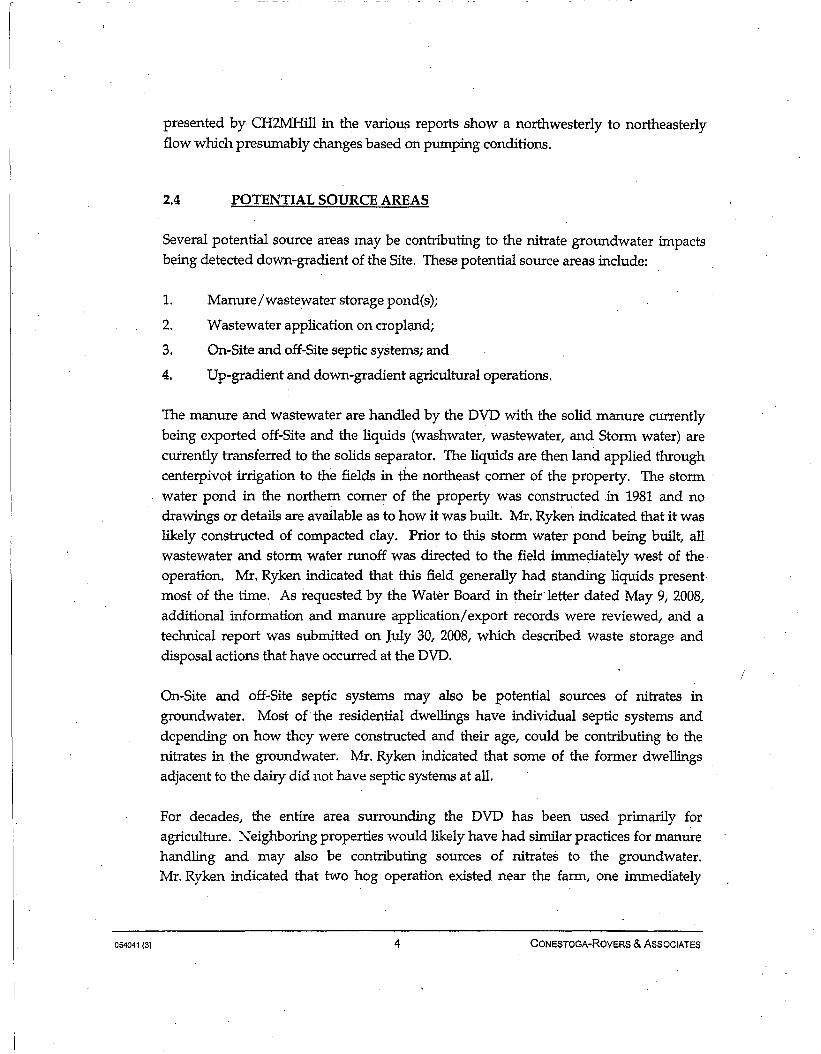
NOTE: DARK AREAS ARE IRRIGATED LAND.
~o 600 120011
~
~054041-04(GIBS001 )GN-SP002 Dec 05/2008 .
1994 AERIAL PHOTODESERT VIEW DAIRY
37501 MOUNTAINVIEW ROADHinkley, California

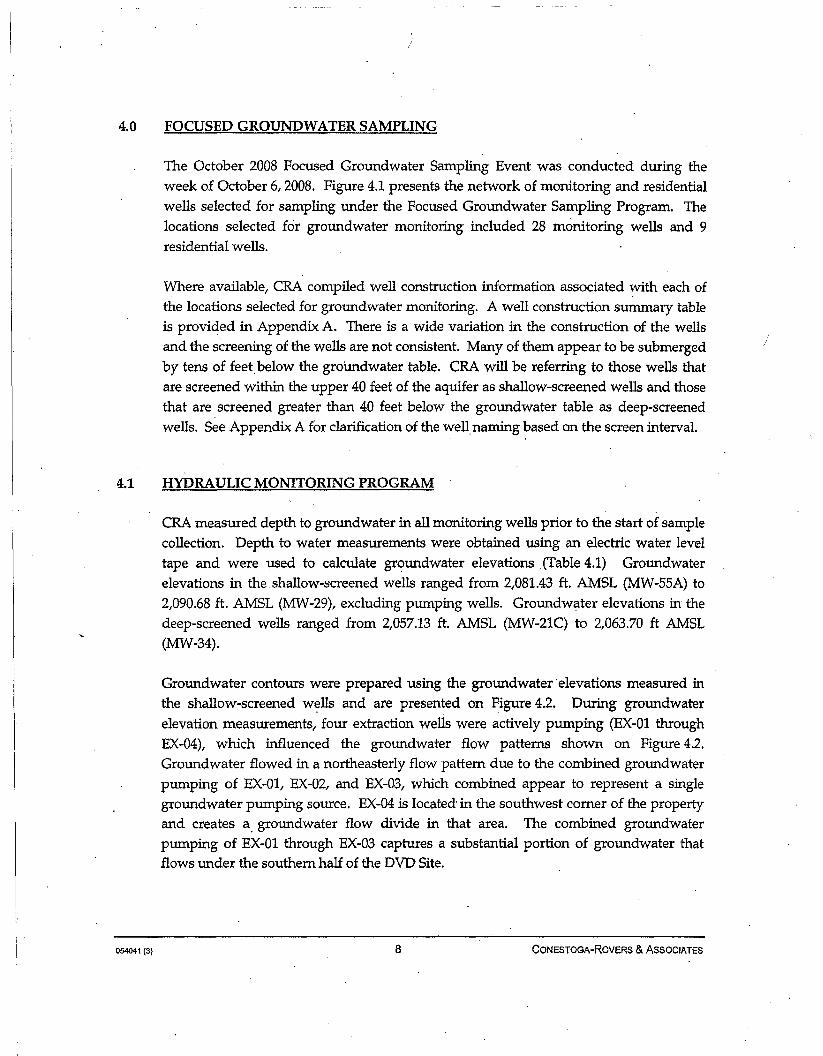
~o 600 1200ft
p....t;;;;,b""""""U.!
~054041-04(GIBS001 )GN-SPOOl Dec OS/2008.
2005 AERIAL PHOTODESERT VIEW DAIRY
37501 MOUNTAINVIEW ROADHinkley, California
EXHIBIT C

.~
GROUNDWATER INVESTIGATIONDATA REPORT (OCTOBER 2008)
DESERT VIEW DAIRYHINKLEY, CALIFORNIA
DISCLAIMER:
SOME FORMAITING CHANGES MAY HAVE OCCURRED WHEN
THE ORIGINAL DOCUMENT WAS PRINTED TO PDF; HOWEVER,
THE ORIGINAL CONTENT REMAINS UNCHANGED.
OCTOBER 2008REF~ NO. 054041 (3)
Prepared by:Conestoga-Rovers& Associates7086 N. Maple AvenueSuite 101Fresno. California 93720
Office: (559) 326-5900Fax: (559) 326-5905
web: http:\\WW'N.CRAworld.com
Worldwide Engineering, Environmental. Construction, and IT Services

GROUNDWATER INVESTIGATIONDATA REPORT (O~TOBER 2008)
DESERT VIEW DAIRYHINKLEY, CALIFORNIA
. OcrOBER 2008REF. NO. 054041 (3)This report is printed on recycled paper.
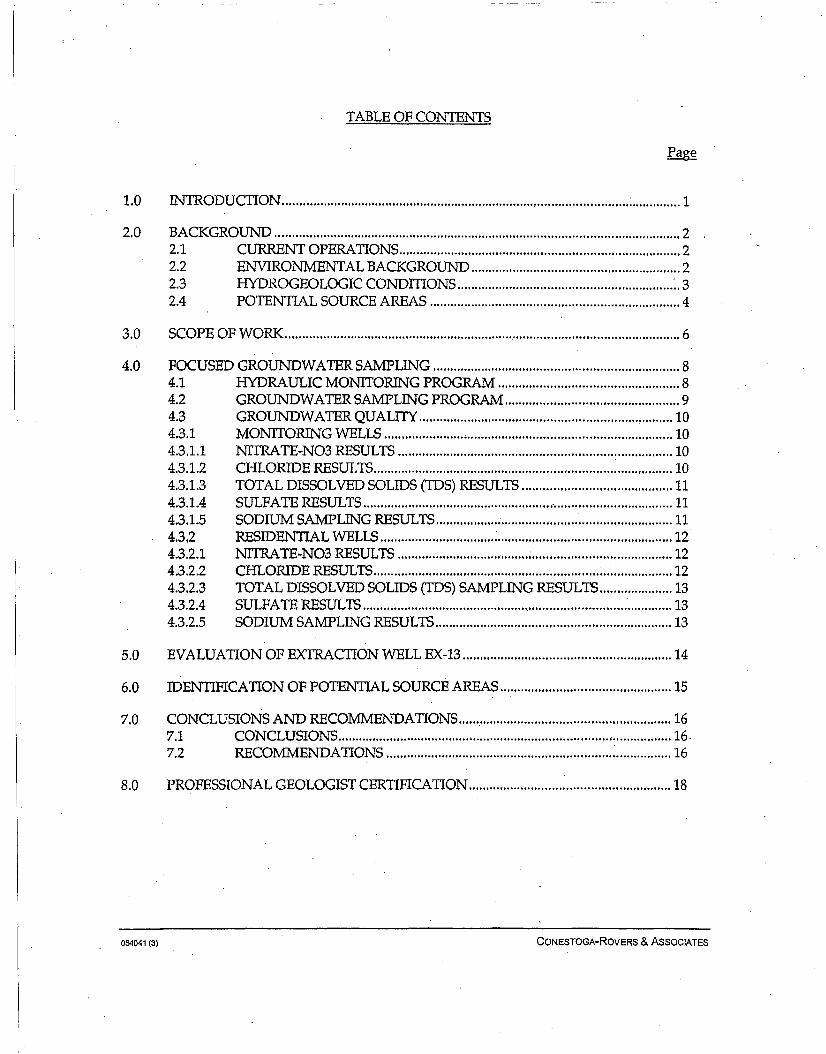
TABLE OF CONTENfS
1.0 IN1RODUCnON : 1
2.0 BACKGROUN1) 22.1 CURRENT OPERATIONS , 22.2 ENVIRONMENTAL BACKGROUN1) 22.3 HYDROGEOLOGIC CONDmONS ~. 32.4 POTEN11AL SOURCE AREAS 4
3.0 SCOPE OF WORK 6
4.0 FOCUSED GROUNDWATER SAMPLING 84.1 HYDRAULIC MONITORING PROGRAM 84.2 GROUNDWATER SAMPLING PROGRAM 94.3 GROUNDWATER QUALITY 104.3.1 MONITORWG WELLS 104.3.1.1 NTIRATE-N03 RESULTS 104.3.1.2 CHLORIDE RESULTS , 104.3.1.3 TOTAL DISSOLVED SOLIDS (IDS) RESULTS 114.3.1.4 SULFATE RESULTS · 114.3.1.5 SODIUM SAMPLING RESULTS ~ 114.3,2 RESIDENTIAL WELLS ~ 124.3.2.1 NTIRATE-N03 RESULTS 124.3.2.2 CHLORIDE RESULTS 124.3.2.3 TOTAL DISSOLVED SOLIDS (IDS) SAMPLING RESULTS 134.3.2.4 SULFATE RESULTS 134.3.2.5 SODIUM SAMPLING RESULTS 13
5.0 EVALUAnON OF EXIRACTION WELL EX-13 14
6.0 IDENTIFICAnON OF POTENTIAL SOURCE AREAS 15
7.0 CONCLUSIONS AND RECOMMENDAnONS 167.1 CONCLUSIONS 16.7.2 RECOMMENDAnONS : 16
8.0 PROFESSIONAL GEOLOGIST CERTIFICAnON 18
054041 (3) CONESTOGA-ROVERS & ASSOCIATES

FIGURE 2.1
FIGURE 2.2
FIGURE 2.3
FIGURE 2.4
FIGURE 4.1
FIGURE 4.2
FIGURE 4.3
FIGURE 4.4
FIGURE 4.5
FIGURE 4.6
FIGURE 7.1
TABLE 4.1
TABLE 4.2
TABLE 4.3
TABLE 4.4
TABLE 4.5
054041 (3)
LIST OF FIGURES(Following Text)
SITE LOCATION
SITE PLAN
EXISTING WELL LOCATIONS
POTENTIAL SOURCE AREAS·
GROUNDWATER MONITORING LOCATIONS (OCTOBER 2008)
GROUNDWATER ELEVATION CONTOURS (OCTOBER 6, 2008)
GROUNDWATER SAMPLING RESULTS (OCTOBER 2008)
NITRATE-N03 CONCENTRATIONS (OCTOBER 2008)
CHLORIDE CONCENTRATIONS (OCTOBER 2008)
. TOTAL DISSOLVED SOLIDS (IDS) CONCENTRAnONS (OCTOBER 2008)
PRELIMINARY SURVEY OF POTENTIAL DOWNGRADIENTRESIDENTIAL WELLS
LIST OF TABLES(Following Report)
GROUNDWATER ELEVATION SUM11ARY (OCTOBER 6, 2008)
MONITORING WELL SAMPLING SUMMARY (OCTOBER 2008)
RESIDENTIAL WELL SAMPLING SUMMARY (OCTOBER 2008).
SUMMARY OF DETECTED COMPOUNDS INMONITORING WELLS (OCTOBER 2008)
SUMMARY OF DETECTED COMPOUNDS INRESIDENTIAL WELLS (OCTOBER 2008)
CONESTOGA-ROVERS & ASSOCIATES

APPENDIX A
APPENDIXB
APPENDIXC
APPENDIXD
054041 (3)
LIST OF APPENDICES
WELL CONSTRUCTION SUMMARY TABLE
LABORATORY ANALYTICAL REPORTS
DATA QUALITY ASSESSMENT MEMO
EXTRACTION WELL EX-13 EVALUATION
CONESTOGA-ROVERS & ASSOCIATES

1.0 INTRODUCTION
This report presents the results of the October 2008 Groundwater Investigationconducted at the Desert View Dairy (DVD) Facility in Hinkl~y, California. This reporthas been prepared by Conestoga-Rovers and Associates (CRA), on behalf of the DVD.The October 2008 Groundwater Investigation was conducted to address the State of·California Regional Water Quality Control Board- Lahontan Region (Water Board)concerns on groundwater· impacts outlined in their letter dated May 9, 2008. TheOctober 2008 Groundwater Investigation was conducted in accordance with CRA's"Groundwater Investigation Work Plan" dated July 2008, which was approved by theWater Board on August 13,2008.
The purpose of this report is to summarize the results of the October groundwatermonitoring event, to summarize the current groundwater conditions, and to evaluatethe need for future work at this fc:lcility. The interpretations made in this report arebased on the field data and limited historical information. Additional help may beneeded from the Water Board to obtain missing records in order to further clarify thesite conceptual model.
054041 (3) CONESTOGA-ROVERS & ASSOCIATES
2.0 BACKGROUND
2.1 CURRENT OPERATIONS
The DVD Facility (Site) is located at 37501 Mountain View Road in Hinkley, California(San Bernardino County). Figure 2.1 presents the Site location: The DVD and associatedacreage is located in the northern half of the northwest 1/4 of section 26 andencompasses approximately 180 acres, which is shown on Figure 2.2.
The property is currently o~ed by Pacific Gas and Electric (PG&E) and the DVD isrented and operated by Mr. Paul Ryken. Mr. Ryken has been operating the DVD from1991 to present. The Site was idle from 1986 to 1991 and was used for dairy operationsby the Flameling Brothers prior to 1986.
Within the Site are two homes, the dairy operation (open lots and parlor buildings), asolids seperator system, and a storm water storage pond. The DVD currently houses1,250 dairy cows, 200 dry cows, and 40 springers. All manure and wastewater generatedby the facility is managed by the DVD. The solid manure is exported off-Site and theliquids are applied through irrigation to cropland rented by DVD.
2.2 ENVIRONMENTAL BACKGROUND
Previous investigations and sampling at the Site have been associated with thechromium groundwater impacts related to the PG&E Hinkley Compressor Station Site.There is an extensive network of wells around the Hinkley Compressor Station studyarea with approximately 40 wells near the DVD, 22 of which; are on the DVD Site.Figure 2.3 presents the existing well locations across the Hinkley Compressor Stationstudy area. ·There are also four active groundwater extraction wells (EX-l through EX-4)in the southern section of the DVD Site, which are used by PG&E to removechromium-impacted groundwater. There were an additional 3 extraction wells (EX-15,EX-16 and EX-20) that were installed and put into operation this year. These sevenextractionwells collectively pumped an average of 482,400 gallons per day based on thePG&E 2007 Annual Monitoring Report (CH2MHill, 20081).
According to PG&E's historical database, the on-going monitoring of the area wells haveidentified elevated concentrations of nitrate-N03 that have been greater than theCalifornia Drinking Water Standard of 45 mg/L (nitrate-N03). The historical database
CH2MHill, 2008. 2007 Aimual Monitoring Report, Hinkley Compressor Station, Hinkley, California.
054041 (3) 2 CO('lESTOGA-ROVERS & ASSOCIATES
has nitrate concentrations reported both as nitrate-N and nitrate-N03. Nitrate-N
concentrations across the area, which include other surrounding properties, range from
non-detect to 102 mg/L. It appears from a limited data of the historical database review,
the general background concentration of nitrate-N ranges from 1 to 15 mg/L (4.4 to
66 mg/L nitrate-N03). The historical database reports nitrate-No The data in this reportare presented nitrate-N03. Historical data previously reported as nitrate-N
concentration will need to be mathematically converted to nitrate-N03 by multiplying
by 4.428 (this accounts for the difference in molecular weight of the two compounds).
2.3 HYDROGEOLOGIC CONDITIONS
The Site is located in the Hinkley Valley, which is within the northern half of the Mojave
River. groundwater basin. The Mojave River groundwater basin is considered
topographically enclosed (USGS, 20012). The· groundwater basin containsunconsolidated alluvial and floodplain sediments of sands, gravels, silts, and clays..Within the basin, there are a series of north-south trending fault block mountains.
The basin is composed of two major aquifers - the Floodplain Aquifer and the Regional
Aquifer. The Floodplain Aquifer is composed of Mojave River deposits. While the
underlying Regional Aquifer is coinposed of alluvial deposits from the surrounding
mountains.
The groundwater in the Hinkley Valley is generally divided into two depth-specificaquifers: the Upper Aquifer and the Lower Aquifer. The Upper Aquifer contains
portions of the Floodplain and Regional Aquifer and is underlain by the Blue Clay
aquitard. The Lower Aquifer is present beneath the Blue Clay aquitard. The Lower
Aquifer is underlain by granitic bedrock (CH2MHill, 2008)1.
Groundwater is typlcally encountered in 75 to 102 feet below ground surface (bgs).
Regionally, groundwater flow is in a northeasterly direction based .on the PG&E 2007Annual Monitoring Report (CH2MHill, 2008)1.
Based on the review of the past monitoring reports, groundwater generally flows north.There is a significant .amount of pumping that occurs from the extraction wells and
irrigation wells in the vicinity of the DVD. The groundwater elevation/contour maps
2 U.s. Geological Survey, 2001, Simulation of Groundwater Flow in the Majave River Basin, California.
054041 (3) 3 CONESTOGA-ROVERS & ASSOCIATES
presented bY' CH2l\1Hill in the various reports show a northwesterly to northeasterlyflow which presumably changes based on pumping conditions.
2.4 POTENTIAL SOURCE AREAS
Several potential source areas may be contributing to the nitrate groundwater impactsbeing detected down-gradient of the Site. These potential source areas include:
1. Manure/wastewater storage pond(s);
2. Wastewater application on cropl<md;
3. On-Site and off-Site septic systems; and
4. Up-gradient and down-gradient agricultural operations.
The manure and wastewater are handled by the DVD with the solid manure currentlybeing exported off-Site and the liquids (washwater, wastewater, and Storm water) arecurrently transferred to the solids separator. The liquids are then land applied throughcenterpivot irrigation to the fields in the northeast comer of the property. The storm .
water pond in the northern comer of the property was constructed .in 1981 and nodrawings or details are available as to how it was built. Mr. Ryken indicated that it waslikely constructed of compacted clay. Prior to this storm water pond being built, allwastewater and storm water runoff was directed to the field immediately west of the .operation. Mr. Ryken indicated that this field generally had standing liquids presentmost of the time. As requested by the Water Board in their'letter dated May 9,2008,
additional information and manure application/export records were reviewed, and atechnical report was submitted on July 30, 2008, which described waste storage anddisposal actions that have occurred at the DVD.
On-Site and off-Site septic systems may also be potential sources of nitrates ingroundwater. Most of the residential dwellings have individual septic systems anddepending on how they were constructed and their age, could be contributing to thenitrates in the groundwater. Mr. Ryken indicated that some of the former dwellingsadjacent to the dairy did not have septic systems at all.
For decades, the entire area surrounding the DVD has been used primarily foragriculture. Neighboring properties would likely have had similar practices for manurehandling and may also be contributing sources of nitrates to the groundwater.Mr. Ryken indicated that two hog operation existed near the farm, one immediately. .
/
054041 (3) 4 CONESTOGA-RoVERS & ASSOCIATES

west of the DVD and one to the north along Thompson Road. These facilities had liquidrpanure storage ponds and likely land application and stockpiling of solid manurethroughout their operational history. Mr. Ryken also indicated that the Nelson Dairywas located immediately south of the DVD and that this dairy operated for severaldecades. Based on the limited groundwater analytical data on the constituents ofconcern, there have been nitrate concentrations detected up-gradient and cross-gradientto the Site. This suggests that the neighboring off-Site agricultural operations may beresponsible for the impacted groundwater monitored by these wells. These otherpotential source areas are shown on Figure 2.4.
Additional-sources may exist with the present and former ~ells located in the generalvicinity of the Site. Old wells with improper surface seals may have allowed landapplied nutrients to migrate into the groundwater. Present day agronomic standardshave setback distances to potential "conduits" such as wells, sinkholes, and shallowbedrock. However, if these standards were not followed, nutrients could prematurelymigrate into groundwater via an open well head or improper surface seal.
l.
054041 (3) 5 CONESTOGA-RoVERS & ASSOCIATES

3.0 SCOPE OF WORK
The objectives of the October 2008 Groundwater Investigation were to:
• assess the nature and extent of groundwater contamination at and around the DVD;and
• evaluate the potential impacts to groundwater quality and nearby receptors.
The scope of the October 2008 Groundwater Investigation included:
• focused groundwater sampling to clarify the groundwater conditions, specificallyfor the general water quality analytes of concern;
• evaluation of the existing extraction well EX-13 as a source control well; and
• identification of possible source areas.
The October 2008 Groundwater Investigation was conducted in accordance with CRA's"Groundwater Investigation Work Plan" dated July 2008, which was approved by theWater Board on August 13, 2008.
Modifications to the original Work Plan were required as a result of issues identified in
the field. These changes were relayed to the Water Board for approval prior toimplementation. The following changes/modifications were implemented:
• Monitoring wells MW-21, MW-30, MW-32, MW-42, and MW-62 were not sampledbecause upon field inspection and communication with the PG&E Consultant,CH2MHill, these wells were determined not to exist. The following monitoringwells were subsequently added to the sampling program as replacement locations:MW-21A, MW-2IB, MW-21BI, MW-30BI, and MW-30B2.
• . Monitoring well MW-43 was not sampled because CH2NlHill had a transducer andhydrosleeve placed in the well and preferred the well not be disturbed.
• Residential well locations 22-29 and 23-07 were not sampled because no one washome to provide access/permission to sample. Residential well locations 23-01, 2304,23-17,23-18, and 27-22 were not sampled because the wells were not operational.The following residential wells were subsequently added to the sampling programas replacement locations: 38038 Mountain View Road, 38075 SunUnerset Road, 22619Thomson Road (1),22726 Thompson Road,22839 Thompson Road, 22875 ThompsonRoad, 23171 Thompson Road.
054041 (3) 6 CONESTOGA-ROVERS & ASSOCIATES

• Upon field inspection, dedicated bladder pumps were found in-place at monitoringwell locations DW-Ol, DW-02, MW-03, MW-21B, MW-21C, MW-30B2, andMW-32Bl. Therefore, these monitoring well locations were purged using low-flowpurging methods, rather than purging three well volumes. MW-31 was also purgedusing low-flow purging methods because the well casing at this location was bent (it.had recently been hit by a vehicle) and the only way to sample the well was to utilizea "low-flow" size pump.
054041 (3) 7 CONESTOGA-ROVERS & ASSOCIATES
,;
4.0 FOCUSED GROUNDWATER SAMPLING
The October 2008 Focused Groundwater Sampling Event was conducted during theweek of October 6,2008. Figure 4.1 presents the network of monitoring and residentialwells selected for sampling under the Focused Groundwater Sampling Program. Thelocations selected for groundwater monitoring included 28 monitoring wells and 9residential wells.
Where available, CRA compiled well construction information associated with each ofthe locations selected for groundwater monitoring. A well construction summary tableis provided in Appendix A. There is a wide variation in the construction of the wellsand the screening of the wells are not consistent. Many of them appear to be submergedby tens of feet below the groUndwater table. CRA will be referring to those wells thatare screened within the upper 40 feet of the aquifer as shallow-screened wells and thosethat are. screened greater than 40 feet below the groundwater table as deep-screenedwells. See Appendix A for clarification of the wellnaming based on the screen interval.
4.1 HYDRAULIC MONITORING PROGRAM
CRA measured depth to groundwater in all monitoring wells prior to the start of samplecollection. Depth to water measurements were obtained using an electric water leveltape and were used to calculate groundwater elevations (Table 4.1) Groundwaterelevations in the shallow-screened wells ranged from 2,081.43 ft. AMSL(MW-55A) to2,090.68 ft. AMSL (MW-29), excluding pumping wells. Groundwater elevations in thedeep-screened wells ranged from 2,057.13 ft. AMSL (MW-21C) to 2,063.70 ft AMSL(MW-34).
Groundwater contours were prepared using the groundwater elevations measured inthe shallow-screened wells and are presented on Figure 4.2. During groundwaterelevation measurements, four extraction wells were actively pumping (EX-01 throughEX-04), which influenced the groundwater flow patterns shown on Figure 4.2.Groundwater flowed in a northeasterly flow pattern due to the combined groundwaterpumping of EX-OI, EX-02, and EX-03, which combined appear to represent a singlegroundwater pumping source. EX-04 is located· in the southwest comer of the propertyand creates a. groundwater flow divide in that area. The combined groundwaterpumping of EX-01 through EX-03 captures a substantial portion of groundwater thatflows under the southern half of the DVD Site.
/
054041 (3) 8 CONESTOGA-ROVERS & ASSOCIATES
.'
)
Under non-pumping conditions, groundwater flow is reportedly to be towards thenorth-northwest (CH2MHill, 2004)3. However, the shift in groundwater flow towardsthe northeast due to groundwater pumping is consistent with previous reports(CH2MHill, 2005)4.
4.2 GROUNDWATER SAMPLING PROGRAM
Groundwater sampling was conduct~d in accordance with CRA's "GroundwaterInvestigation Work Plan", approved by the Water Board on August 13, 2008. Table 4.2presents the sampling summary associated with the Odober 2008 monitoring wellsampling. Table 4.3 presents the sampling summary associated with the October 2008residential well sampling.
Samples were collected from monitoring wells and residential wells for laboratoryanalysis of nitrate-N03, chloride, sodium, sulfate, and total dissolved solids (IDS).Field parameters (pH, temperature, conductivity) were also measured and recorded ateach sampling location.
Sampling was conducted after purging each 'well. Samples were placed in iced coolersand shipped within 48 hours via commercial courier to Test America L~boratories inIrvine, California, under standard chain of custody procedures.
Appendix B contains electronic copies of the laboratory reports associated with theOctober 2008 Focused Groundwater Sampling Event. A data quality assessment memois provided inAppendix C.
Table 4.4 provides a summary of detected compounds in monitoring wells sampledduring the October 2008 Focused Groundwater Sampling Event. Table 4.5 provides asummary of detected compounds in residential wells sampled during the October 2008Focused Groundwater Sampling Event. A summary of the October 2008 groundwaterquality data is shown on Figure 4.3.
3 CH2MHill,2004. 2003 Annual Monitoring Report, Hinkley Compressor Station, Hinkley, California.4 CH2MHill, 2005. 2004 Annual Monitoring Report, Hinkley Compressor Station, Hinkley, California.
054041 (3) 9 CONESTOGA-ROVERS & ASSOCIATES
4.3
4.3.1
4.3.1.1
GROUNDWATER QUALITY
MONITORING WELLS
NITRATE-N03 RESULTS
October 2008 nitrate-N03 concentratiol1S associated with each monitoring well locationare shown on Figure 4.4. Nitrate-NO;3 iso-concentration contours are also shown onFigure 4.4. The contours were cOl1Structed using the concentrations in the shallowscreened wells and the residential wells to obtain the most accurate extent of the affectedgroundwater and to eliminate variations due to the deep-screened intervals.Groundwater samples from monitoring wells DW-Ol and EX-04 which are locatedup-gradient of the DVD contain elevated concentrations of nitrate-N03 above theprimary drinking water standard (45 mg/L). This data is cOl1Sistent with the historicalnitrate-N/N03 concentrations.
.At the DVD Site, October 2008 nitrate-N03 concentrations in the groundwater samplesfrom the shallow-screened monitoring wells ranged from 41 mg/L (MW-30A) to 420(DW-02), with the highest concentratiol1S typically observed in the wells screened in theupper portion of the aquifer. October 2008 nitrate-N03 concentrations in the deepestscreened wells were non-detect (MW-21C and MW-34).
October 2008 nitrate-N03 concentratiol1S were higher in groundwater samples collectedfrom the northern property line, which is consistent with historical nitrate-N03concentrations. The area in the northwest comer of DVD (represented by thegroundwater sample collected from monitoring well DW-02) appears to have thehighest measured nitrate-N03 concentration at 420 mg/L. This is a low lying area thatreceived stormwater and lot runoff from past operatiol1S. This area is currently beingused for approved discharge of extracted groundwater from the existing PG&Eextraction wells.
4.3.1.2 CHLORIDE RESULTS
\October 2008 chloride concentrations detected in groundwater samples collected fromeach monitoring well location are shown on Figure 4.5 and chloride iso-concentrationcontours were constructed using the shallow-screened and residential wells. Similar tothe reported nitrate concentratiol1S, elevated chloride concentrations (> 250 mg/L) areobserved across· the region. At the DVD Site, October 2008 chloride concentratiol1S in
054041 (3) 10 CONESTOGA-RoVERS & ASSOCIATES

groundwater samples collected from the shallow-screened monitoring wells rangedfrom 240 mg/L (MW-30A) to 1,100 mg/L (MW-63), with the highest concentrationstypically observed in the wells screened within the upper portion of the aquifer.October 2008 chloride concentrations in samples collected from the deepest screenedwells were 23 mg/L (MW-34) and 330 mg/L (MW-21C).
4.3.1.3 TOTAL DISSOLVED SOLIDS (IDS) RESULTS
October 2008 'IDS concentrations from each monitoring well location are shown onFigure 4.6 and 'IDS iso-concentration contours were constructed using the shallowscreened and residential wells. 'IDS is a measurement of the dissolved ion concentrationin water. Similar to the reported nitrate and chloride concentrations, elevatedTDSconcentrations (> 500 mg/L) were observed in groundwater samples collected from bothupgradient and downgradient of the DVD. At the DVD Site, October 2008 IDSconcentrations in the shallow-screened monitoring wells ranged from 1,200 mg/L(MW-30A) to 4,700 mg/L (MW-63 and MW-21A), with the higher concentrationsobserved in groundwater samples collected from the wells screened in the upper portionof the aquifer. October 2008 'IDS concentrations in the deepest screened wells were770 mg/L (MW-34) and 1,200 mgJ.L (MW-21C),
4.3.1.4 SULFATE RESULTS
Similar to reported concentrations of other compounds, elevated sulfate concentrations(> 250 mg/L) were observed in groundwater samples collected across the s<l;IDpling areaboth up-gradient and down-gradient of the DVD. At the DVD Site, October 2008 sulfateconcentrations in the shallow-screened monitoring wells ranged from 330 mg/L(MW-30A) to 1,800 mg/L (MW-21A), with the higher concentrations observed ingroundwater samples collected from the upper portion of the aquifer. October 2008sulfate concentrations in groundwater samples collected the deepest screened wellswere 180 mg/L (MW-34) and 290mg/L (MW-21C).
4.3.1.5 SODIUM SAMPLING RESULTS
Similar to reported concentrations of other compounds, elevated. sodium concentrations(> 20 mg/L) were groundwater samples collected observed across the sampling areaboth up-gradient and down-gradient of the DVD. At the DVD Site, October 2008
054041 (3) 11 CONESTOGA-RoVERS & ASSOCIATES
sodium concentrations groundwater samples collected from the shallow-screenedmonitoring wells ranged from 160 mg/L (MW-30A) to 670 mg/L (MW-21A), with thehigher concentrations observed in the upper portion. of the aquifer. October 2008sodium concentrations in the groundwater samples collected from the lower aquiferranged from 200 mg/L (MW-21C) to 260 mg/L (MW-34).
4.3.2
4.3.2.1
RESIDENTIAL WELLS
NITRATE-N03 RESULTS
October 2008 nitrate-N03 concentrations associated with each residential well locationare shown onFigure 4.4. Two residential wells located northeast of the DVD (near theintersection of Thompson Road and Summerset Road) had nitrate-N03 detected in thegroundwater sample below the primary drinking water standard (45 mg/L) withconcentrations at 25 mg/L (23171 Thompson Road) and 9.7 mg/L (38075 SummersetRoad). One well north of the DVD (near the intersection of Thompson Road andMountain View Road) also had nitrate-N03 detected samples below the drinking waterstandard with a concentration at 21 mg/L (38080 Mountain View Road).
Six residential wells located north of the DVD (south of Thompson Rd, betweenMountain View Road and Summerset Road) had nitrate-N03 detected sample above theprimary drinking water standard (45 mg/L) withconcentrations ranging from 85 mg/L(22726 Thompson Road) to 240 mg/L (22839 Thompson Road). Two of these six wells(22726 & 22839 Thompson Road) had been sampled previously and past nitrate:'N03concentrations were relatively consistent with the nitrate-N03 concentrations measuredin October 2008.
4.3.2.2 CHLORIDE RESULTS
October 2008 chloride concentrations associated with each residential well location areshown on Figure 4.5. As with the reported nitrate concentrations, concentrations ofchloride above its secondary drinking water standard (250 mg/L) are observed in
several residential wells to the north of the DVD. The secondary (i.e., non-health based)drinking water standard for chloride is based on general aesthetics, such as taste, odor,and appearance. October 2008 chloride concentrations in the groundwater samples in
residential wells ranged from 52 mg/L (38075 Summerset Road) to 1200 mg/L (22619,I
22839 & 22875 Thompson Road).
054041 (3) 12 CONESTOGA-R.oVERS & ASSOCIATES
4.3.2.3 TOTAL DISSOLVED SOLIDS (IDS) SAMPLING RESULTS
October 2008 IDS concentrations associated with each residential well location areshown on Figure 4.6. Similar to the reported nitrate and chloride concentrations,concentrations of IDS in the groundwater samples were above its secondary drinkingwater standard (500 mg/L) are observed in several residential wells to the north of theDVD. The secondary (Le., non-health based) drinking water standard for IDS is basedon general aesthetics, such as taste, odor, and appearance. October 2008 IDSconcentrations in residential wells ranged from 410 mg/L (38075 Summerset Road) to5,100 mg/L (22875 Thompson Road) in the groundwater samples collected.
4.3.2.4 SULFATE RESULTS
Similar to reported concentrations of other compounds, concentrations of sulfate aboveits secondary drinking water standard (250 mg/L) are observed in several residentialwells to the north of the DVD. The secondary (Le., non-health based) drinking waterstandard for sulfate is based on general aesthetics, such as taste, odor, and appearance.October 2008 sulfate concentrations in residential wells ranged from 72 mg/L (38075Summerset Road) to 1,600 mg/L (22839 Thompson Road) in the groundwater samplescollected.
4.3.2.5 SODIUM SAMPLING RESULTS
Similar to reported concentrations of other co~pounds, concentrations of sodium aboveits secondary drinking water standard (20 mg/L) are observed in several residentialwells to the north of the DVD. The secondary drinking water standard for sodium is forindividuals on a restricted sodium diet. October 2008 sodium concentrations inresidential wells ranged from 71 mg/L (38075 Summerset Road) to 550 mg/L (22619Thompson Road) in the groundwater samples collected.
054041 (3) 13 CONESTOGA-RoVERS & ASSOCIATES

5.0 EVALUATION OF EXTRACTION WELL EX-13
CRA reviewed historical pumping test data from a pumping test completed onextraction well EX-13 (inactive) was reviewed to determine the hydraulic characteristicsof the groundwater aquifer in the immediate vicinity of the Site and evaluate the use ofEX-13 as a potential re~edial option in the event that groundwater containment is
necessary.
Based on review of available pumping test data provided by CH2MHill, it is estimatedthat EX-13 could have a capture width of up to 260 feet at a pumping rate of 49 gpm. Atthat pumping rate, EX-13 would likely capture groundwater from the DW-02 area.However, additional hydraulic testing would be necessary to confirm the aquiferhydraulic parameters and the relative nature and extent of hydraulic containment.
A more detailed summary of the EX-13 evaluation and the data reviewed as part of theevaluation are provided in Appendix D.
054041 (3) 14 CONESTOGA-RoVERS & ASSOCIATES

· 6.0 IDENTIFICATION OF POTENTIAL SOURCE AREAS
As stipulated in CRA's "Groundwater Investigation Work Plan" dated July 2008, arecords search of all known present and fonner on-Site and local off-Site source areaswas recommended. CRA made three visits to the local Natural Resource ConservationService (NRCS) office to review past historical records; however, the records could notbe located by NRCS staff.. Therefore, at the present time, no record search infonnation is
available.
054041 (3) 15 CONESTOGA-ROVERS & ASSOCIATES

(
7.0 CONCLUSIONS AND RECOMMENDATIONS
7.1 CONCLUSIONS
Based on data collected during this groundwater investigation and comparison ofcurrent data with historical monitoring results, CRA concludes the following:
• Past agricultural operations around the area may have contributed to elevatedconcentration of nitrates in the groundwater;
• Concentrations of nitrate are greater than applicable drinking water standards bothup-gradient, cross-gradient and down-gradient of the DVD;
• Groundwater flow is generally to the north (with a northeast component that iseffected by pumping). The groundwater flow direction may also be effected by thebedrock outcrop in the northwest comer of the Site; and
• Available analytical data are not sufficient to define the northern edge of the nitrateplume.
7.2 RECOMMENDATIONS
Based on the data currently available, CRA recommends the following:
• Complete a detailed well log/file review of all residential wells north of the Site;
• Complete a detailed review of monitoring well logs to develop a geologic crosssection of the area that will include both soil stratigraphy and chemicalconcentrations;
• Complete interviews as necessary, to supplement the welllog/fi)e review;
• Complete a comprehensive round of residential well sampling within the areabordered by. Alcudia Road to the south, Mountain General Road to the north,Mountain View Road to the west and Summerset Road to the east (this wouldinclude sampling the nine' residential well locations sampled in October 2008).Water samples should be collected from these wells and analyzed for the analytes ofconcern: nitrate-N03, chloride, TOS, sodium and sulfate. A preliminary survey of .potential downgradient residential wells is shown on Figure 7.1. The residentiallocations identified on Figure 7.1 are based on review of aerial photography and arepreliminary. Actual residential well locations within the area defined on Figure 7.1would be confirmed in the field.
054041 (3) 16 CONESTOGA-ROVERS & ASSOCIATES
• Follow-up with the local Natural Reserve Conservation Service (NRCS) office todetermine if historical farmstead maps have been located. This information isnecessary to identify potential sources of nitrate being measured in the groundwaterin the area.
054041 (3) 17 CONESTOGA-RoVERS & ASSOCIATES

8.0 PROFESSIONAL GEOLOGIST CERTIFICATION
I certify under penalty of law that this document and all attachments were preparedunder my direction or supervision in accordance with a system designed to assure thatqualified personnel properly gather and evaluate the information submitted. Based onmy inquiry of the person or persons who manage the system, or those persons directlyresponsible for gathering the information, the information submitted is, to the best of myknowledge and belief, true, accurate, and complete. I am aware that there are significantpenalties for submitting false information, inclUding the possibility of fine andimprisonment for knowing violations.
054041 (3)
~~.Lynleigh LOwry -.. VConestoga-Rovers & Associates, Inc.
California Registration No. :,-,7~8",,'J!~O _
License Expiration Date: 9ft,·Signature: ~~-~¥-'-"~--'7r"-------'-
Date: 1¥cf . ~
18
P.G.Seal
CONESTOGA-RoVERS & AsSOCIATES