l A S c h l i c - South Perth Primary School
21
A n I n d e p e n d e n t P u b l i c S c h o o l 2 0 1 6 S c h o o l R e p o r t In s p iring y o u n g m inds to cre a t e a n d p u rs u e p os sib ilitie s
Transcript of l A S c h l i c - South Perth Primary School
An Independent Public School
2016 School Report
Inspiring young minds to create and pursue possibilities
2
South Perth Primary School
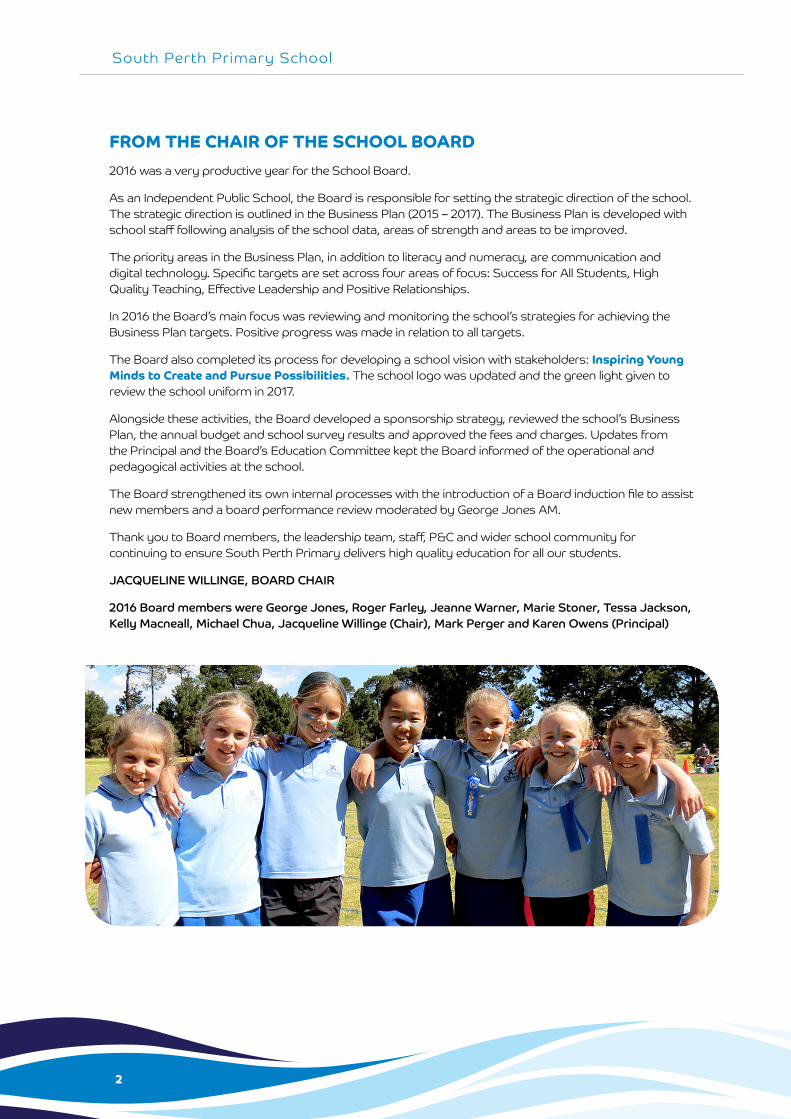
FROM THE CHAIR OF THE SCHOOL BOARD2016 was a very productive year for the School Board.
As an Independent Public School, the Board is responsible for setting the strategic direction of the school. The strategic direction is outlined in the Business Plan (2015 – 2017). The Business Plan is developed with school staff following analysis of the school data, areas of strength and areas to be improved.
The priority areas in the Business Plan, in addition to literacy and numeracy, are communication and digital technology. Specific targets are set across four areas of focus: Success for All Students, High Quality Teaching, Effective Leadership and Positive Relationships.
In 2016 the Board’s main focus was reviewing and monitoring the school’s strategies for achieving the Business Plan targets. Positive progress was made in relation to all targets.
The Board also completed its process for developing a school vision with stakeholders: Inspiring Young Minds to Create and Pursue Possibilities. The school logo was updated and the green light given to review the school uniform in 2017.
Alongside these activities, the Board developed a sponsorship strategy, reviewed the school’s Business Plan, the annual budget and school survey results and approved the fees and charges. Updates from the Principal and the Board’s Education Committee kept the Board informed of the operational and pedagogical activities at the school.
The Board strengthened its own internal processes with the introduction of a Board induction file to assist new members and a board performance review moderated by George Jones AM.
Thank you to Board members, the leadership team, staff, P&C and wider school community for continuing to ensure South Perth Primary delivers high quality education for all our students.
JACQUELINE WILLINGE, BOARD CHAIR
2016 Board members were George Jones, Roger Farley, Jeanne Warner, Marie Stoner, Tessa Jackson, Kelly Macneall, Michael Chua, Jacqueline Willinge (Chair), Mark Perger and Karen Owens (Principal)
3
2016 School Report
MESSAGE FROM THE PRINCIPAL2016 was a year of progress and success, highlighted by the achievement of Business Plan targets and many notable individual and whole school successes.
Active engagement of the School Board, P&C and all staff members saw substantial progress achieved in the implementation of our first Business Plan as an Independent Public School. Significant areas of progress included:
• Implementation of strategies such as the ‘Kindy Survey’ and the ‘Phonemic Awareness and Phonological Knowledge Screening Tool’, to address areas of development in K – 2 related to the National Quality Standards.
• Use of the iPads as a tool to enhance student learning in classroom programs and specialist areas.
• Implementation of the Year 1-6 Mathematics program, ‘Envision’.
• Increased use of Connect as a forum for communication between classroom teachers, students and parents.
• The successful introduction of a Parent Class Representative for each classroom, supported by the P&C Class Rep Coordinator.
• Engagement of the culturally and linguistically diverse school community and new families to South Perth Primary School.
After a lengthy process, the development of our School Vision was finalised and endorsed by the School Board.
Inspiring young minds to create and pursue possibilities.
The vision statement aims to be aspirational and articulates the need to make our students independent, engaged and motivated learners who have the skills to pursue the possibilities of the future.
With funding assistance from the P&C, the play equipment was moved from the far side of the oval into a new playground closer to the school. This has resulted in a more accessible and safer play area for the students.
The outstanding successes achieved by our students and school included:
• A highly successful PEAC program for South Perth identified students held at our school.
• Five Year 6 students gaining entry into the GATE programs in public schools for Year 7, 2017.
• A Year 6 student winning the ‘Speak with Confidence Award’ at the City of South Perth.
• Two finalists in the ‘City of South Perth Young Writer’s Competition’.
• A Year 6 student winning the Male Miner Award at the Curtin Mining Challenge.
• Participation of our Senior Choir in the Curtin Education Community Combined Choir.
• The School of Instrumental Music program extended to include Year 5 students in Brass, Clarinet and Flute.
• Two Year 6 girls selected to represent WA as members of the SSWA Cross Country Team.
• Interschool sporting success including winning the SMPSSA Swimming and Athletic Carnivals.
• Two interviews broadcast on radio 720 ABC. Firstly, ‘Found on Forrest’ and then the tree outside the Principal’s Cottage announced as ‘Perth’s Best Jacaranda Tree’.
The success and progress achieved in 2016 would not have been possible without the dedication and skills of our motivated staff members and the wonderful support from our School Board, P&C Committee and parent community.
KAREN OWENS, PRINCIPAL
4
South Perth Primary School
SCHOOL PROFILESouth Perth Primary School is an Independent Public School. The school focuses on the development of the whole child with quality education programs that provide students with opportunities to optimise their academic, social, emotional, creative and physical skills.
The school is located on the side of a hill on the corner of Angelo and Forrest Streets and caters for approximately 380 students from Kindergarten to Year 6. Students are drawn from the area of South Perth bordered by the Swan River, Douglas Street and South Terrace.
South Perth Primary School first opened its doors on 20 July 1898 as Forrest Street School. The school boasts a proud history of achievement over the past century with many prominent Western Australians beginning their schooling at South Perth.
Today the school provides outstanding facilities that include a mixture of heritage listed and new buildings. Four purpose-built early childhood classrooms, 13 general purpose classrooms, specialist music, art/science and computer rooms, an undercover area and a school hall support the provision of a wide range of learning programs that address the interests and needs of students.
South Perth is a culturally and linguistically diverse (CALD) school. Twenty five per cent of our school population come from a CALD background other than Australian, representing more than 25 different ethnicities. Many of the families that come from overseas have been relocated in Western Australia due to work commitments. An English as an Additional Dialect/Language specialist teacher assists students with the acquisition of Standard Australian English.
The shared community values that underpin the school values program are respect, excellence, honesty, responsibility and cooperation. The student leadership and the chaplaincy programs provide opportunities for students to apply these values to their daily life at school.
High academic achievement is a characteristic of students from South Perth Primary School. The school mean in NAPLAN testing is consistently above the national mean. A high proportion of South Perth students gain places in the primary extension and challenge program (PEAC) and the secondary gifted and talented education program (GATE).
Specialist teachers provide programs in Music, Drama, Physical Education and Japanese for all Year 1-6 students. Extra curricula activities, such as choir, school band, school production and a wide range of sporting opportunities, are also provided for interested students.
Our highly supportive parent community provides extra funding to assist the school with the implementation of programs and the upgrading of the school grounds and resources. Parents willingly volunteer to support activities in the classroom, on excursions, at sports carnivals and with music or drama productions.
The school focuses on providing an engaging and inclusive learning program that promotes success for all students. High quality teaching, effective leadership and positive relationships are priorities at South Perth Primary School.
5
2016 School Report
BUSINESS PLANAs an Independent Public School, the School Board is responsible for setting the strategic direction of the school. At the end of 2014, the school staff and School Council members analysed the school data, identifying areas of strength and those that needed to be improved. Teachers and School Council members participated in workshops to identify our priorities for the school’s first Business Plan for 2015 – 2017. The school priority areas are:
• Literacy
• Numeracy
• Communication
• Digital Technology
Strategies for improvement in Literacy, Numeracy, Communication and Digital Technology were developed across four areas focus - Success for All Students, High Quality Teaching, Effective Leadership and Positive Relationships.
Success for all students is the core business of our school. Success is achieved by providing students with engaging learning programs and curriculum content that offers both breadth and depth. High quality teaching and learning programs and carefully chosen pedagogical practices assist teachers to meet the needs of all students.
The school leadership team ensures that the assessment of the school’s data and quality educational research are used to guide decision-making. Opportunities for evidence-based innovation and change are promoted. Strong relationships within the school community continue to be enhanced through communication, engagement and partnerships.
SCHOOL PURPOSE
Vision – Inspiring young minds to create and pursue possibilities.
Motto – Faith in Learning
Purpose StatementOur desire and inspiration is to empower each other to:
• Create a safe, caring and respectful learning environment, which is stimulating and challenging.
• Develop each child’s unique potential, as a passionate, resilient and resourceful learner.
Shared Community Values1. Respect – I respect myself, others, property and our environment.2. Excellence – I do my best.3. Honesty – I am honest and trustworthy.4. Responsibility – I am fair and responsible.5. Cooperation – I am cooperative and helpful. I work and play well with others.
6
South Perth Primary School
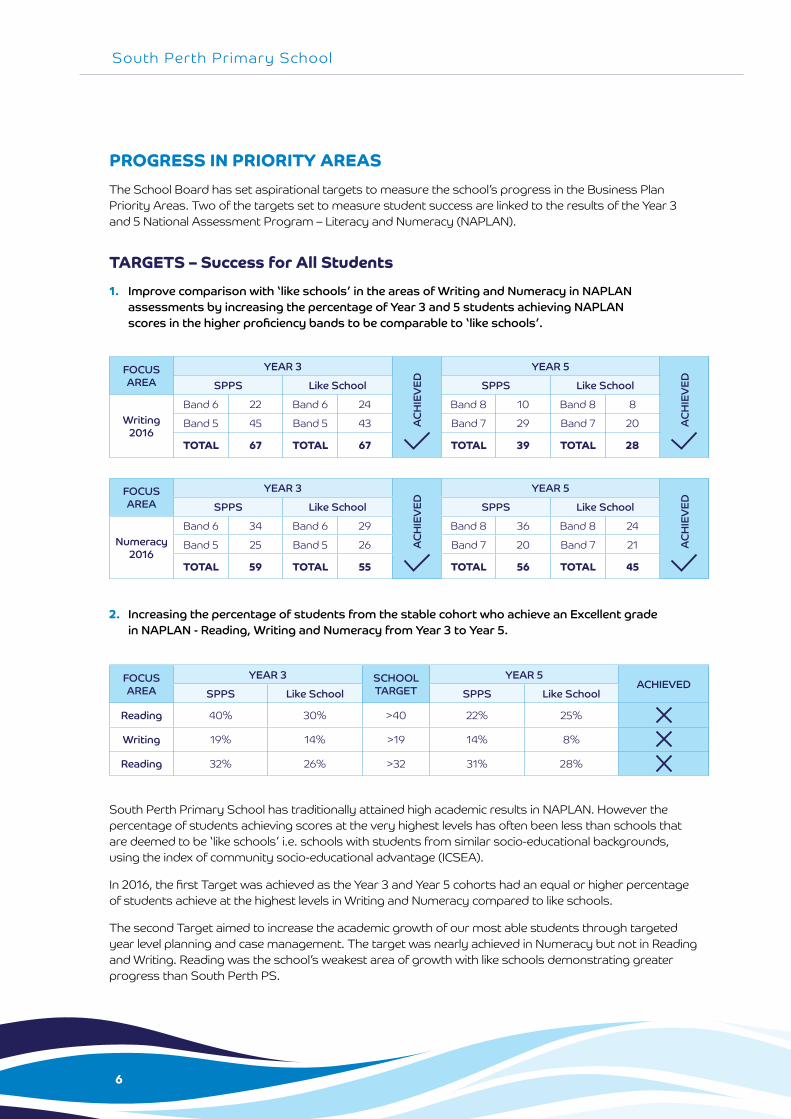
PROGRESS IN PRIORITY AREASThe School Board has set aspirational targets to measure the school’s progress in the Business Plan Priority Areas. Two of the targets set to measure student success are linked to the results of the Year 3 and 5 National Assessment Program – Literacy and Numeracy (NAPLAN).
TARGETS – Success for All Students1. Improve comparison with ‘like schools’ in the areas of Writing and Numeracy in NAPLAN
assessments by increasing the percentage of Year 3 and 5 students achieving NAPLAN scores in the higher proficiency bands to be comparable to ‘like schools’.
2. Increasing the percentage of students from the stable cohort who achieve an Excellent grade in NAPLAN - Reading, Writing and Numeracy from Year 3 to Year 5.
South Perth Primary School has traditionally attained high academic results in NAPLAN. However the percentage of students achieving scores at the very highest levels has often been less than schools that are deemed to be ‘like schools’ i.e. schools with students from similar socio-educational backgrounds, using the index of community socio-educational advantage (ICSEA).
In 2016, the first Target was achieved as the Year 3 and Year 5 cohorts had an equal or higher percentage of students achieve at the highest levels in Writing and Numeracy compared to like schools.
The second Target aimed to increase the academic growth of our most able students through targeted year level planning and case management. The target was nearly achieved in Numeracy but not in Reading and Writing. Reading was the school’s weakest area of growth with like schools demonstrating greater progress than South Perth PS.
FOCUS AREA
YEAR 3
ACH
IEV
ED
YEAR 5
ACH
IEV
EDSPPS Like School SPPS Like School
Writing2016
Band 6 22 Band 6 24 Band 8 10 Band 8 8
Band 5 45 Band 5 43 Band 7 29 Band 7 20
TOTAL 67 TOTAL 67 TOTAL 39 TOTAL 28
FOCUS AREA
YEAR 3
ACH
IEV
ED
YEAR 5
ACH
IEV
EDSPPS Like School SPPS Like School
Numeracy2016
Band 6 34 Band 6 29 Band 8 36 Band 8 24
Band 5 25 Band 5 26 Band 7 20 Band 7 21
TOTAL 59 TOTAL 55 TOTAL 56 TOTAL 45
FOCUS AREA
YEAR 3 SCHOOL TARGET
YEAR 5ACHIEVED
SPPS Like School SPPS Like School
Reading 40% 30% >40 22% 25%
Writing 19% 14% >19 14% 8%
Reading 32% 26% >32 31% 28%
7
2016 School Report
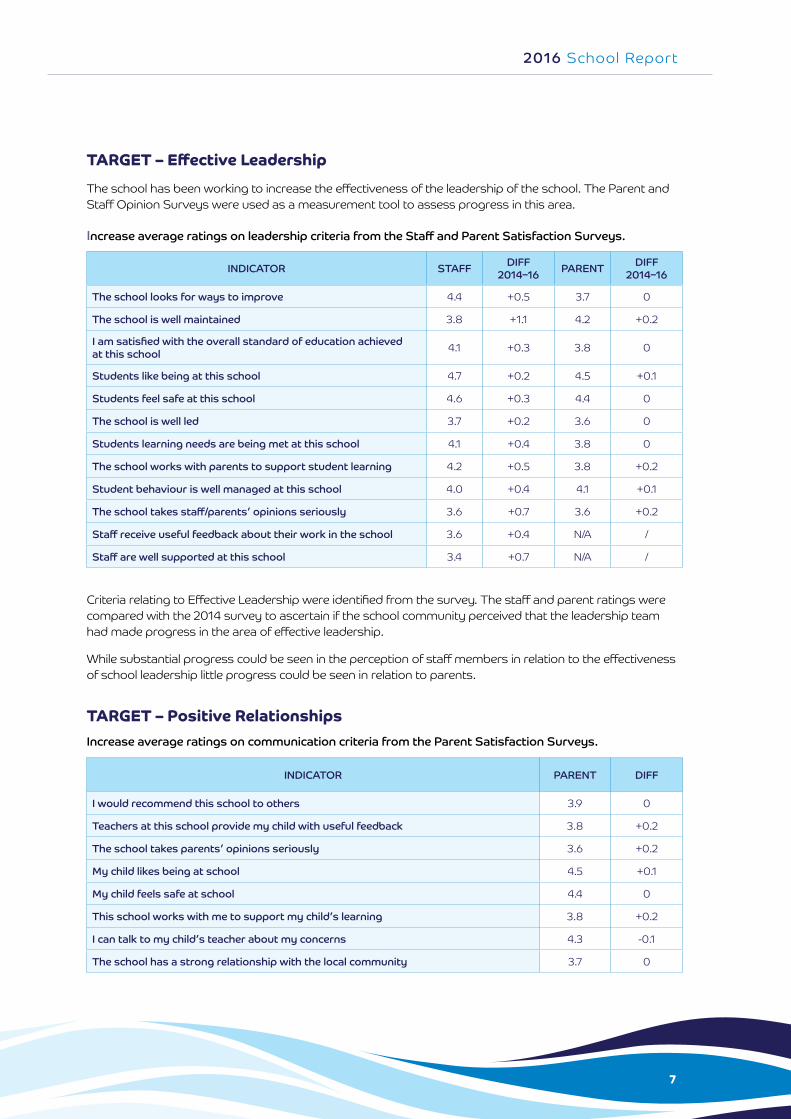
TARGET – Effective LeadershipThe school has been working to increase the effectiveness of the leadership of the school. The Parent and Staff Opinion Surveys were used as a measurement tool to assess progress in this area.
Criteria relating to Effective Leadership were identified from the survey. The staff and parent ratings were compared with the 2014 survey to ascertain if the school community perceived that the leadership team had made progress in the area of effective leadership.
While substantial progress could be seen in the perception of staff members in relation to the effectiveness of school leadership little progress could be seen in relation to parents.
TARGET – Positive Relationships
Increase average ratings on leadership criteria from the Staff and Parent Satisfaction Surveys.
Increase average ratings on communication criteria from the Parent Satisfaction Surveys.
INDICATOR STAFF DIFF 2014–16 PARENT DIFF
2014–16
The school looks for ways to improve 4.4 +0.5 3.7 0
The school is well maintained 3.8 +1.1 4.2 +0.2
I am satisfied with the overall standard of education achieved at this school 4.1 +0.3 3.8 0
Students like being at this school 4.7 +0.2 4.5 +0.1
Students feel safe at this school 4.6 +0.3 4.4 0
The school is well led 3.7 +0.2 3.6 0
Students learning needs are being met at this school 4.1 +0.4 3.8 0
The school works with parents to support student learning 4.2 +0.5 3.8 +0.2
Student behaviour is well managed at this school 4.0 +0.4 4.1 +0.1
The school takes staff/parents’ opinions seriously 3.6 +0.7 3.6 +0.2
Staff receive useful feedback about their work in the school 3.6 +0.4 N/A /
Staff are well supported at this school 3.4 +0.7 N/A /
INDICATOR PARENT DIFF
I would recommend this school to others 3.9 0
Teachers at this school provide my child with useful feedback 3.8 +0.2
The school takes parents’ opinions seriously 3.6 +0.2
My child likes being at school 4.5 +0.1
My child feels safe at school 4.4 0
This school works with me to support my child’s learning 3.8 +0.2
I can talk to my child’s teacher about my concerns 4.3 -0.1
The school has a strong relationship with the local community 3.7 0
8
South Perth Primary School
Student Progress and Achievement Compared with Like Schools
Higher Progress – Lower Achievement Higher Progress – Higher Achievement
NAPLAN Year 3 2014 to Year 5 2016
ACHIEVEMENT – Difference in School and Like Schools Achievement – NAPLANs à
PRO
GRE
SS –
Diff
eren
ce in
Sch
ool a
nd L
ike
Scho
ols
Ach
ieve
men
t – N
APL
AN
s à
Lower Progress – Lower Achievement Lower Progress – Higher Achievement
Writing
Spelling
R
N
G & P
-35 -30 -25 -20 -15 -10 -5 0 5 10 15 20 25 30 35
25.022.520.017.515.012.510.0
7.55.02.50.0-2.5-5.0-7.5
-10.0-12.5-15.0-17.5
-20.0-22.5-25.0
Criteria relating to Positive Relationships were also identified in the survey. The parent ratings were once again compared with the 2014 survey to ascertain if the school community perceived that progress had been achieved.
As demonstrated in the table on the previous page, the ratings for criteria related to Positive Relationships also made little progress from 2014 to 2016 despite a large number of strategies being implemented by the school.
In 2017, the school will explore parents’ perceptions of effective leadership and positive relationships using an independent consultant to conduct interviews with a sample of parents. The results of the survey will be used for future planning in the areas of Effective Leadership and Positive Relationships.
ACADEMIC AND NON-ACADEMIC DATAThe school collects and analyses a large data sample during the school year. The data is used for self-assessment and planning purposes.
Teachers use the data to complete whole school, year level, class and individual student planning. School data related to the Business Plan is also presented to the School Board.
The School Business Plan and Operational Plan document the strategies that have been planned and implemented to address areas of weakness identified from the school data.
This section of the report provides a sample of whole school data used during self-assessment and planning processes.
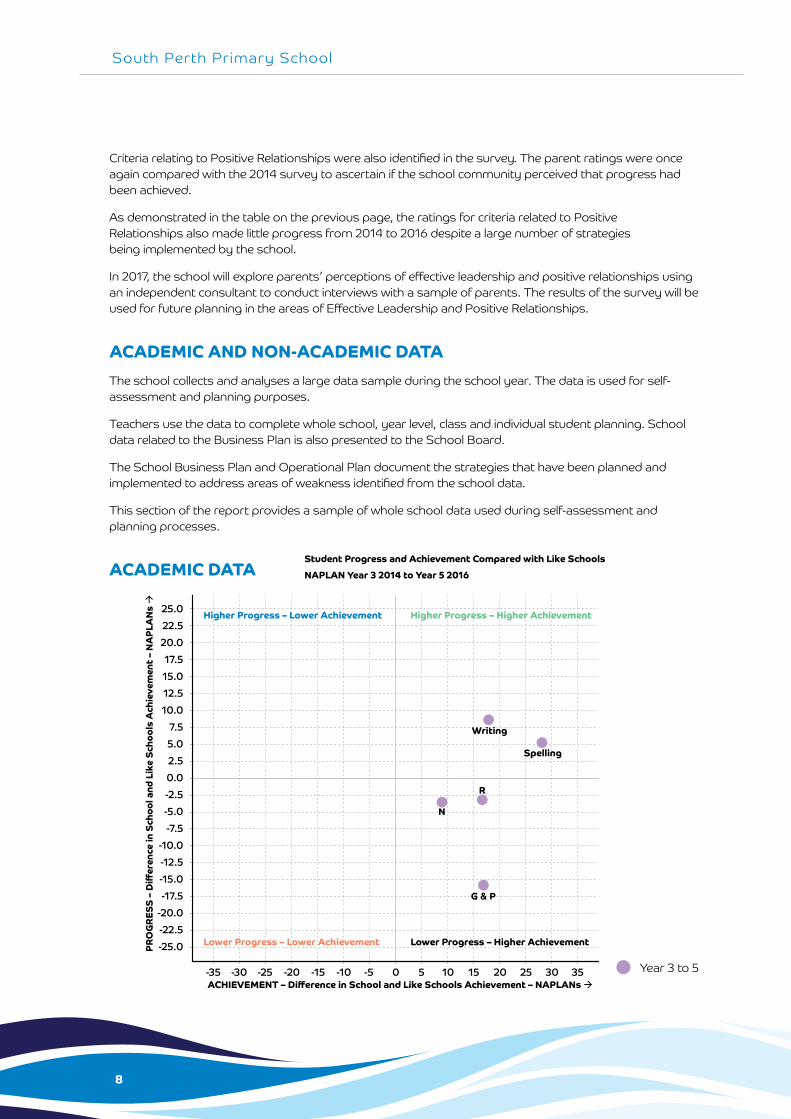
ACADEMIC DATA
Year 3 to 5
9
2016 School Report
The graph on previous page illustrates the achievement levels of the Year 5 cohort in NAPLAN 2016 and the progress the same cohort made between 2014 and 2016 when compared with like schools.
The Year 5, 2016 student cohort results were in the high progress and high achievement quadrant in Writing and Spelling. Grammar and Punctuation was the weakest area, showing high achievement but low progress. Numeracy and Reading also attained higher achievement than progress.
Proficiency Band Summary
BAND
READING
YEAR 3 YEAR 5
2015 2016 2015 2016
School LikeSch School LikeSch School LikeSch School LikeSch
10
9
8 6% 26% 20% 23%
7 35% 31% 41% 29%
6 40% 46% 42% 41% 32% 25% 24% 26%
5 14% 22% 28% 26% 24% 12% 10% 13%
4 24% 17% 11% 17% 3% 5% 4% 7%
3 14% 12% 15% 11% 0% 1% 2% 2%
2 5% 2% 3% 3%
1 2% 1% 2% 1%
Above National Minimum Standard
At National Minimum Standard
Below National Minimum Standard
Average Reading Score
2012 2013 2014 2015 2016
TEST
SCO
RE
YEAR
550
500
450
400
Year 3 School
Year 3 Like Schools
Year 5 School
Year 5 Like Schools
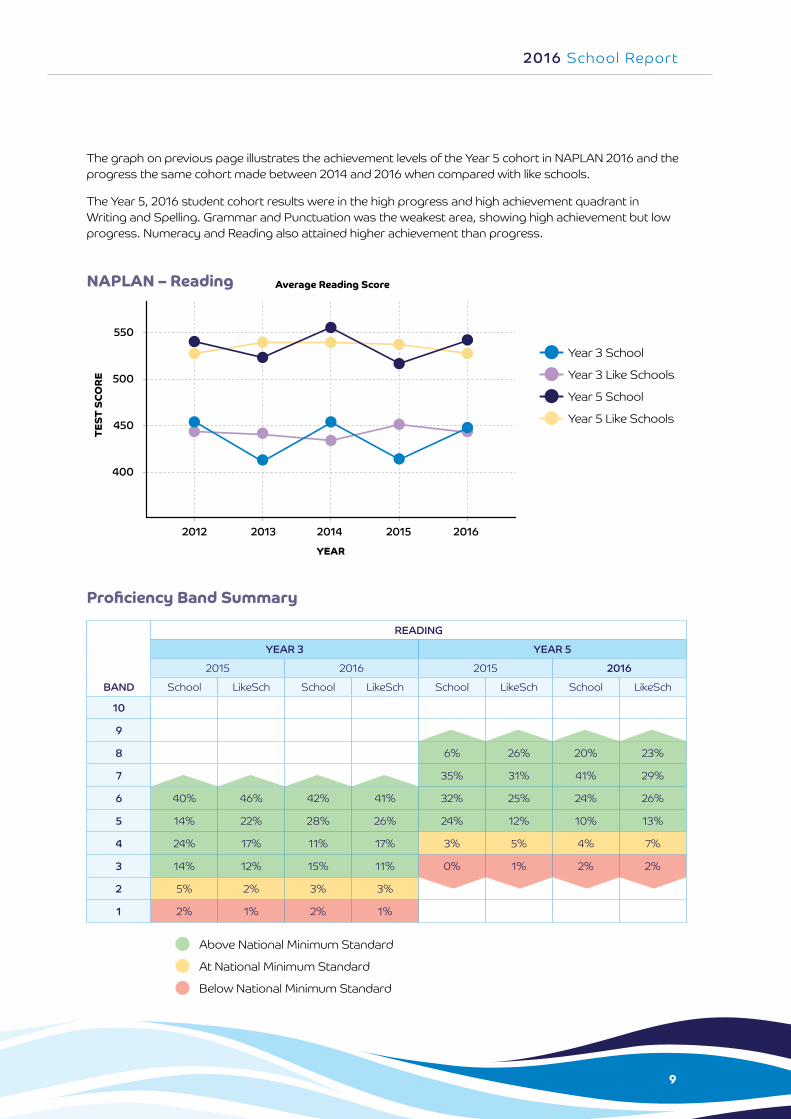
NAPLAN – Reading
10
South Perth Primary School
In 2016 Reading, Year 3 and Year 5 cohorts achieved a mean score above the mean of like schools. The Year 5 mean was approximately the same test score points above the mean of like schools as in Year 3, 2014.
The percentage of students scoring in the two top bands at Year 3 and Year 5 was also greater than like schools. Five percent and 6% of Year 3 and 5 students respectively were at or below the national minimum standard which was comparable to like schools.
Proficiency Band Summary
BAND
WRITING
YEAR 3 YEAR 5
2015 2016 2015 2016
School LikeSch School LikeSch School LikeSch School LikeSch
10
9
8 3% 10% 10% 8%
7 9% 23% 29% 20%
6 5% 26% 22% 24% 39% 38% 35% 35%
5 46% 46% 45% 43% 45% 24% 22% 28%
4 39% 20% 32% 24% 3% 3% 2% 7%
3 7% 6% 2% 7% 0% 2% 2% 1%
2 0% 1% 0% 2%
1 2% 0% 0% 1%
Above National Minimum Standard
At National Minimum Standard
Below National Minimum Standard
Average Writing Score
520
500
480
460
440
420
400
380
2012 2013 2014 2015 2016
TEST
SCO
RE
YEAR
Year 3 School
Year 3 Like Schools
Year 5 School
Year 5 Like Schools
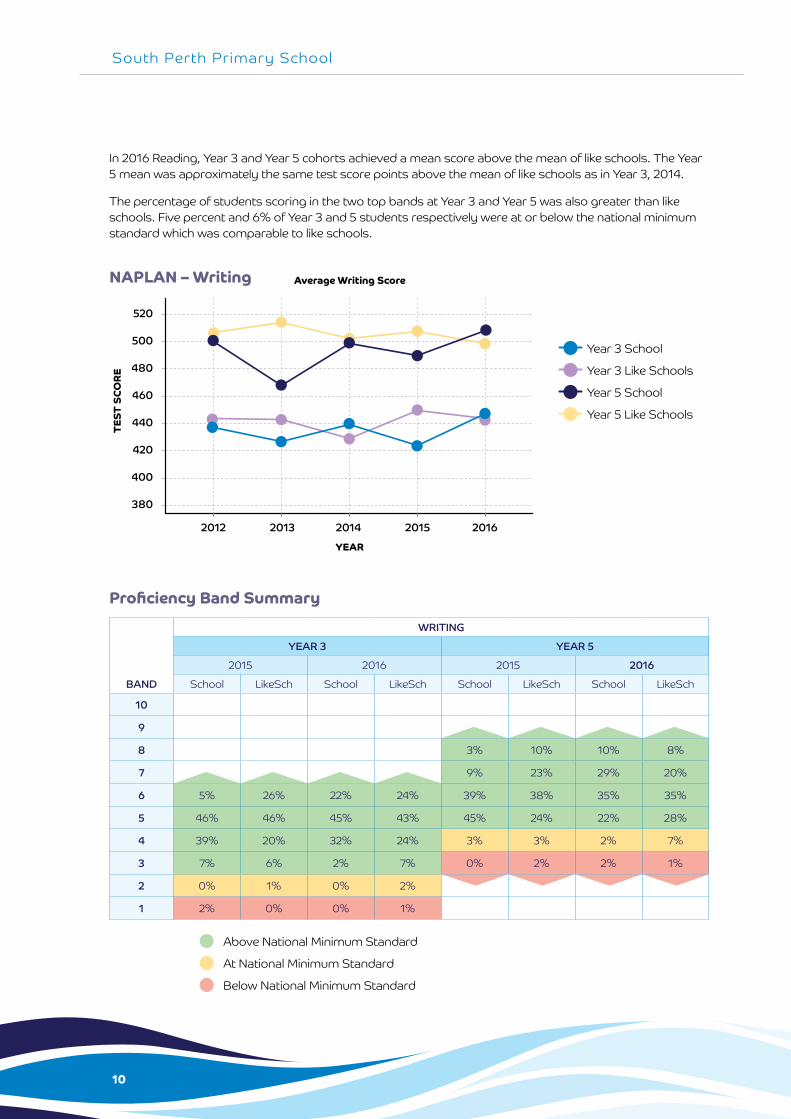
NAPLAN – Writing
11
2016 School Report
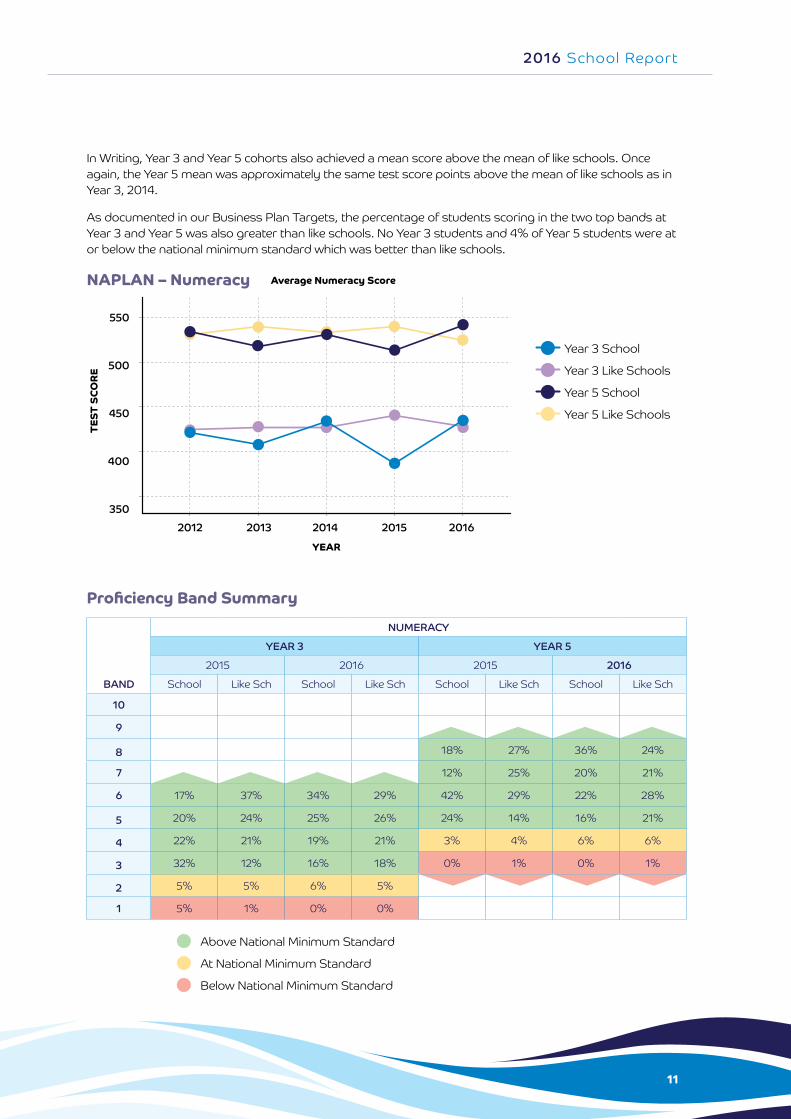
In Writing, Year 3 and Year 5 cohorts also achieved a mean score above the mean of like schools. Once again, the Year 5 mean was approximately the same test score points above the mean of like schools as in Year 3, 2014.
As documented in our Business Plan Targets, the percentage of students scoring in the two top bands at Year 3 and Year 5 was also greater than like schools. No Year 3 students and 4% of Year 5 students were at or below the national minimum standard which was better than like schools.
Proficiency Band Summary
BAND
NUMERACY
YEAR 3 YEAR 5
2015 2016 2015 2016
School Like Sch School Like Sch School Like Sch School Like Sch
10
9
8 18% 27% 36% 24%
7 12% 25% 20% 21%
6 17% 37% 34% 29% 42% 29% 22% 28%
5 20% 24% 25% 26% 24% 14% 16% 21%
4 22% 21% 19% 21% 3% 4% 6% 6%
3 32% 12% 16% 18% 0% 1% 0% 1%
2 5% 5% 6% 5%
1 5% 1% 0% 0%
Above National Minimum Standard
At National Minimum Standard
Below National Minimum Standard
Average Numeracy Score
2012 2013 2014 2015 2016
TEST
SCO
RE
YEAR
550
500
450
400
350
Year 3 School
Year 3 Like Schools
Year 5 School
Year 5 Like Schools
NAPLAN – Numeracy
12
South Perth Primary School
In Numeracy, the Year 3 and Year 5 cohorts again achieved a mean score above the mean of like schools. The difference between the Year 3 and Year 5 mean test score had increased from Year 3, 2014 when compared to like schools.
As documented in our Business Plan Targets, the percentage of students scoring in the two top bands at Year 3 and Year 5 was also greater than like schools. Six percent of Year 3 and 5 students were at or below the national minimum standard which was comparable to like schools.
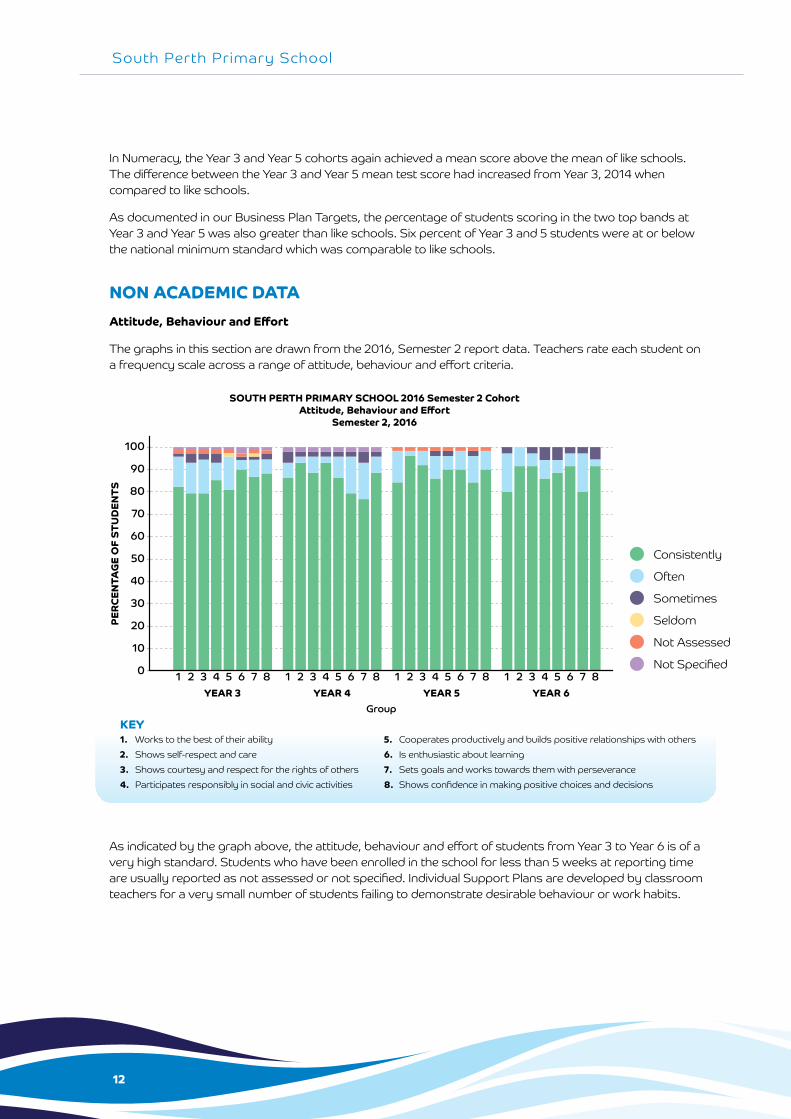
NON ACADEMIC DATAAttitude, Behaviour and Effort
The graphs in this section are drawn from the 2016, Semester 2 report data. Teachers rate each student on a frequency scale across a range of attitude, behaviour and effort criteria.
As indicated by the graph above, the attitude, behaviour and effort of students from Year 3 to Year 6 is of a very high standard. Students who have been enrolled in the school for less than 5 weeks at reporting time are usually reported as not assessed or not specified. Individual Support Plans are developed by classroom teachers for a very small number of students failing to demonstrate desirable behaviour or work habits.
KEY1. Works to the best of their ability 5. Cooperates productively and builds positive relationships with others2. Shows self-respect and care 6. Is enthusiastic about learning3. Shows courtesy and respect for the rights of others 7. Sets goals and works towards them with perseverance4. Participates responsibly in social and civic activities 8. Shows confidence in making positive choices and decisions
Consistently
Often
Sometimes
Seldom
Not Assessed
Not Specified
SOUTH PERTH PRIMARY SCHOOL 2016 Semester 2 CohortAttitude, Behaviour and Effort
Semester 2, 2016
PERC
ENTA
GE
OF
STU
DEN
TS
GroupYEAR 3
1 2 3 4 5 6 7 8YEAR 4
1 2 3 4 5 6 7 8YEAR 5
1 2 3 4 5 6 7 8YEAR 6
1 2 3 4 5 6 7 8
100
90
80
70
60
50
40
30
20
10
0
13
2016 School Report
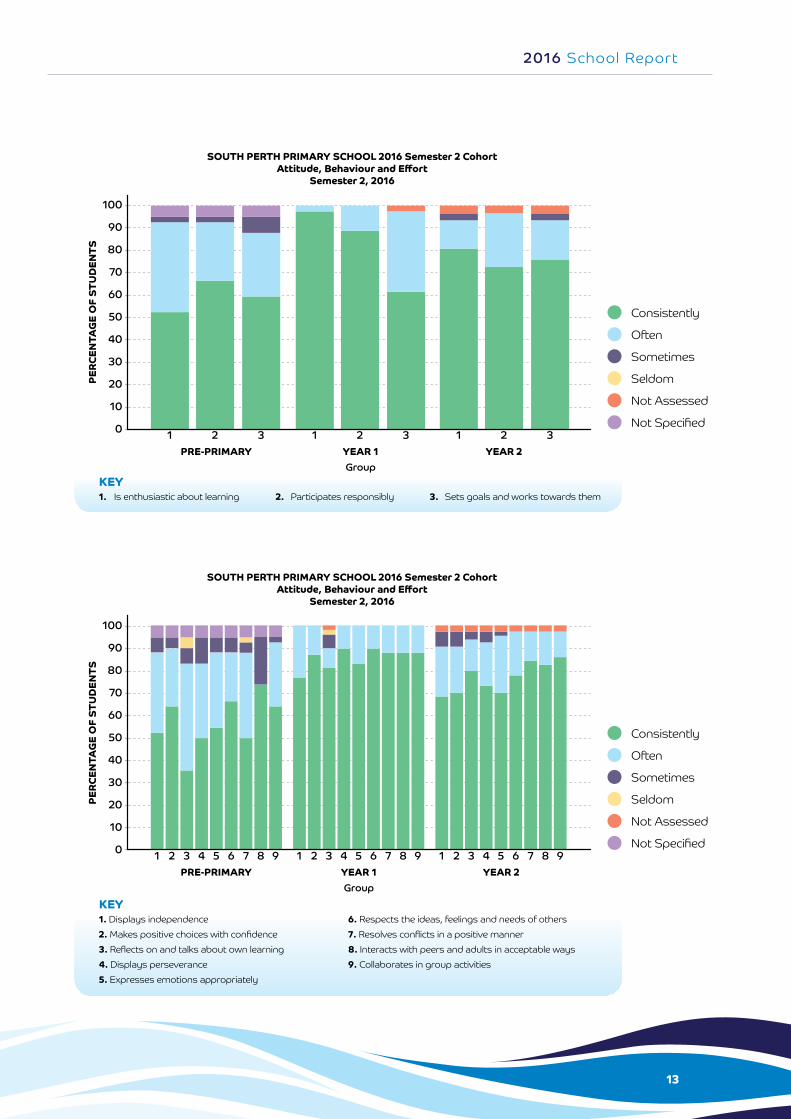
KEY1. Displays independence 6. Respects the ideas, feelings and needs of others2. Makes positive choices with confidence 7. Resolves conflicts in a positive manner3. Reflects on and talks about own learning 8. Interacts with peers and adults in acceptable ways4. Displays perseverance 9. Collaborates in group activities5. Expresses emotions appropriately
KEY1. Is enthusiastic about learning 2. Participates responsibly 3. Sets goals and works towards them
Consistently
Often
Sometimes
Seldom
Not Assessed
Not Specified
Consistently
Often
Sometimes
Seldom
Not Assessed
Not Specified
SOUTH PERTH PRIMARY SCHOOL 2016 Semester 2 CohortAttitude, Behaviour and Effort
Semester 2, 2016
PERC
ENTA
GE
OF
STU
DEN
TS
PRE-PRIMARY YEAR 2YEAR 1Group
1 2 3 4 5 6 7 8 9 1 2 3 4 5 6 7 8 9 1 2 3 4 5 6 7 8 9
100
90
80
70
60
50
40
30
20
10
0
SOUTH PERTH PRIMARY SCHOOL 2016 Semester 2 CohortAttitude, Behaviour and Effort
Semester 2, 2016
PERC
ENTA
GE
OF
STU
DEN
TS
PRE-PRIMARY YEAR 2YEAR 1Group
1 2 3 1 2 3 1 2 3
100
90
80
70
60
50
40
30
20
10
0
14
South Perth Primary School
The two graphs on the previous page indicate that as the students move through from Pre-primary to Year 2, their personal and social learning skills continue to develop and become more regularly demonstrated across the various learning contexts. This is developmentally appropriate and indicative of the high priority placed on the development of social and emotional skills in the early years.
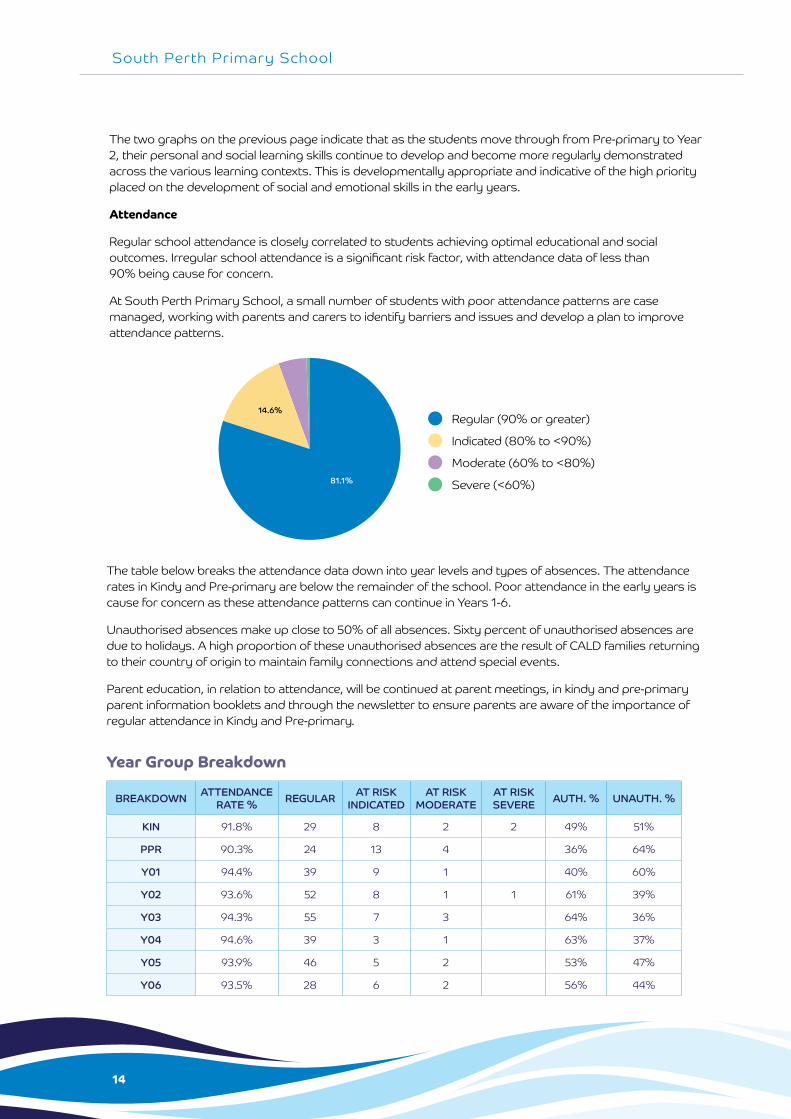
Attendance
Regular school attendance is closely correlated to students achieving optimal educational and social outcomes. Irregular school attendance is a significant risk factor, with attendance data of less than 90% being cause for concern.
At South Perth Primary School, a small number of students with poor attendance patterns are case managed, working with parents and carers to identify barriers and issues and develop a plan to improve attendance patterns.
The table below breaks the attendance data down into year levels and types of absences. The attendance rates in Kindy and Pre-primary are below the remainder of the school. Poor attendance in the early years is cause for concern as these attendance patterns can continue in Years 1-6.
Unauthorised absences make up close to 50% of all absences. Sixty percent of unauthorised absences are due to holidays. A high proportion of these unauthorised absences are the result of CALD families returning to their country of origin to maintain family connections and attend special events.
Parent education, in relation to attendance, will be continued at parent meetings, in kindy and pre-primary parent information booklets and through the newsletter to ensure parents are aware of the importance of regular attendance in Kindy and Pre-primary.
Year Group Breakdown
BREAKDOWN ATTENDANCE RATE % REGULAR AT RISK
INDICATEDAT RISK
MODERATEAT RISK SEVERE AUTH. % UNAUTH. %
KIN 91.8% 29 8 2 2 49% 51%
PPR 90.3% 24 13 4 36% 64%
Y01 94.4% 39 9 1 40% 60%
Y02 93.6% 52 8 1 1 61% 39%
Y03 94.3% 55 7 3 64% 36%
Y04 94.6% 39 3 1 63% 37%
Y05 93.9% 46 5 2 53% 47%
Y06 93.5% 28 6 2 56% 44%
81.1%
14.6%Regular (90% or greater)
Indicated (80% to <90%)
Moderate (60% to <80%)
Severe (<60%)
15
2016 School Report
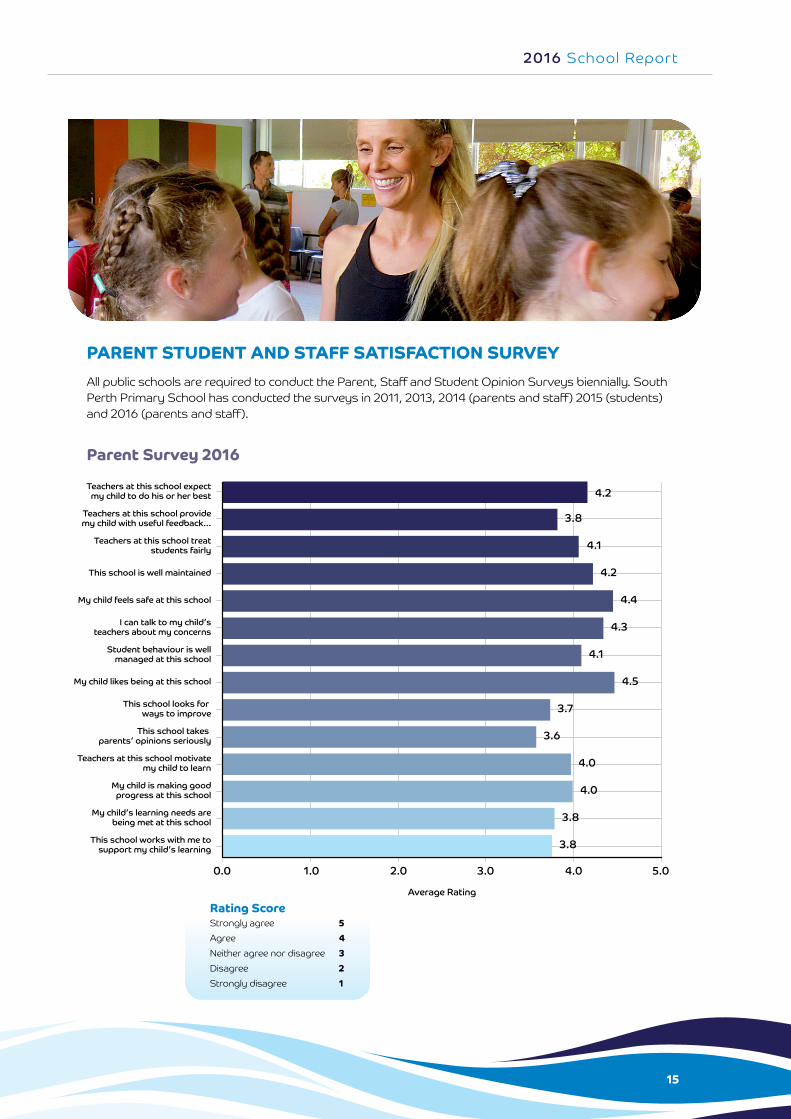
PARENT STUDENT AND STAFF SATISFACTION SURVEYAll public schools are required to conduct the Parent, Staff and Student Opinion Surveys biennially. South Perth Primary School has conducted the surveys in 2011, 2013, 2014 (parents and staff) 2015 (students) and 2016 (parents and staff).
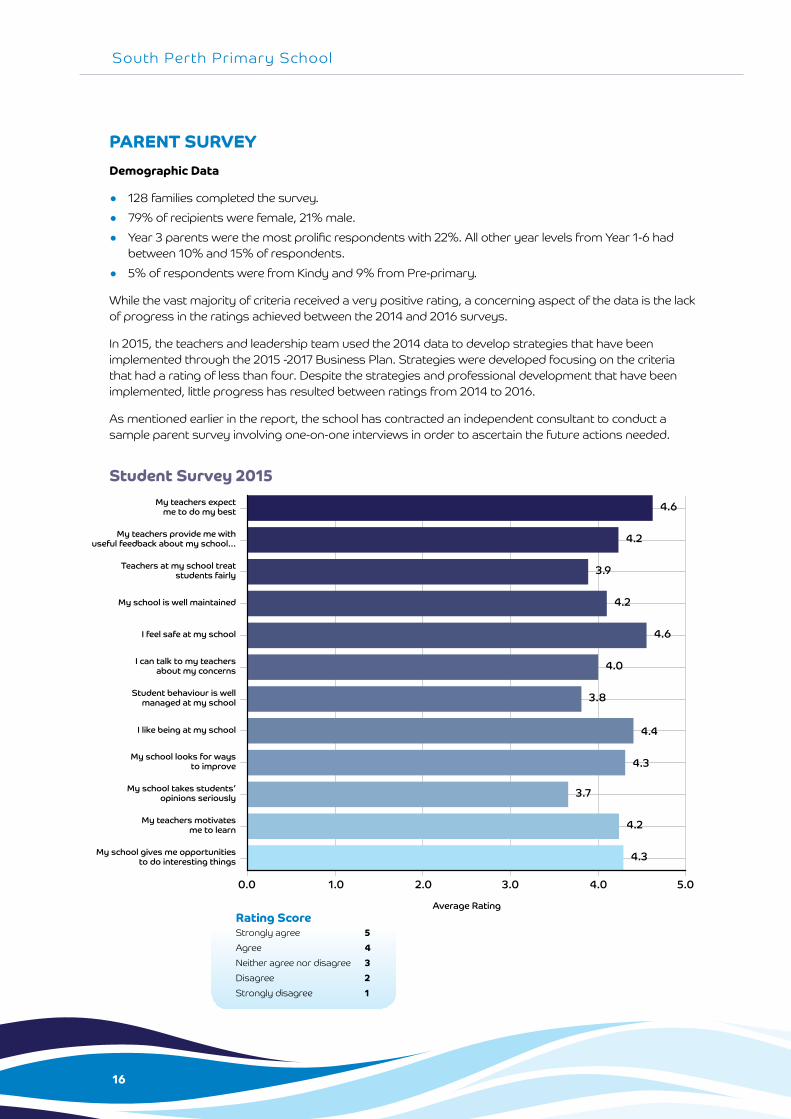
Parent Survey 2016
Rating ScoreStrongly agree 5Agree 4Neither agree nor disagree 3Disagree 2Strongly disagree 1
Average Rating
Teachers at this school expectmy child to do his or her best
Teachers at this school providemy child with useful feedback...
Teachers at this school treatstudents fairly
This school is well maintained
My child feels safe at this school
I can talk to my child’s teachers about my concerns
Student behaviour is wellmanaged at this school
My child likes being at this school
This school looks for ways to improve
This school takes parents’ opinions seriously
Teachers at this school motivatemy child to learn
My child is making goodprogress at this school
My child’s learning needs arebeing met at this school
This school works with me tosupport my child’s learning
Parent National School Opinion Survey 2016
0.0 1.0 2.0 3.0 4.0 5.0
4.2
3.8
4.1
4.2
4.4
4.3
4.1
4.5
3.7
4.0
3.6
4.0
3.8
3.8
16
South Perth Primary School
PARENT SURVEYDemographic Data
• 128 families completed the survey.
• 79% of recipients were female, 21% male.
• Year 3 parents were the most prolific respondents with 22%. All other year levels from Year 1-6 had between 10% and 15% of respondents.
• 5% of respondents were from Kindy and 9% from Pre-primary.
While the vast majority of criteria received a very positive rating, a concerning aspect of the data is the lack of progress in the ratings achieved between the 2014 and 2016 surveys.
In 2015, the teachers and leadership team used the 2014 data to develop strategies that have been implemented through the 2015 -2017 Business Plan. Strategies were developed focusing on the criteria that had a rating of less than four. Despite the strategies and professional development that have been implemented, little progress has resulted between ratings from 2014 to 2016.
As mentioned earlier in the report, the school has contracted an independent consultant to conduct a sample parent survey involving one-on-one interviews in order to ascertain the future actions needed.
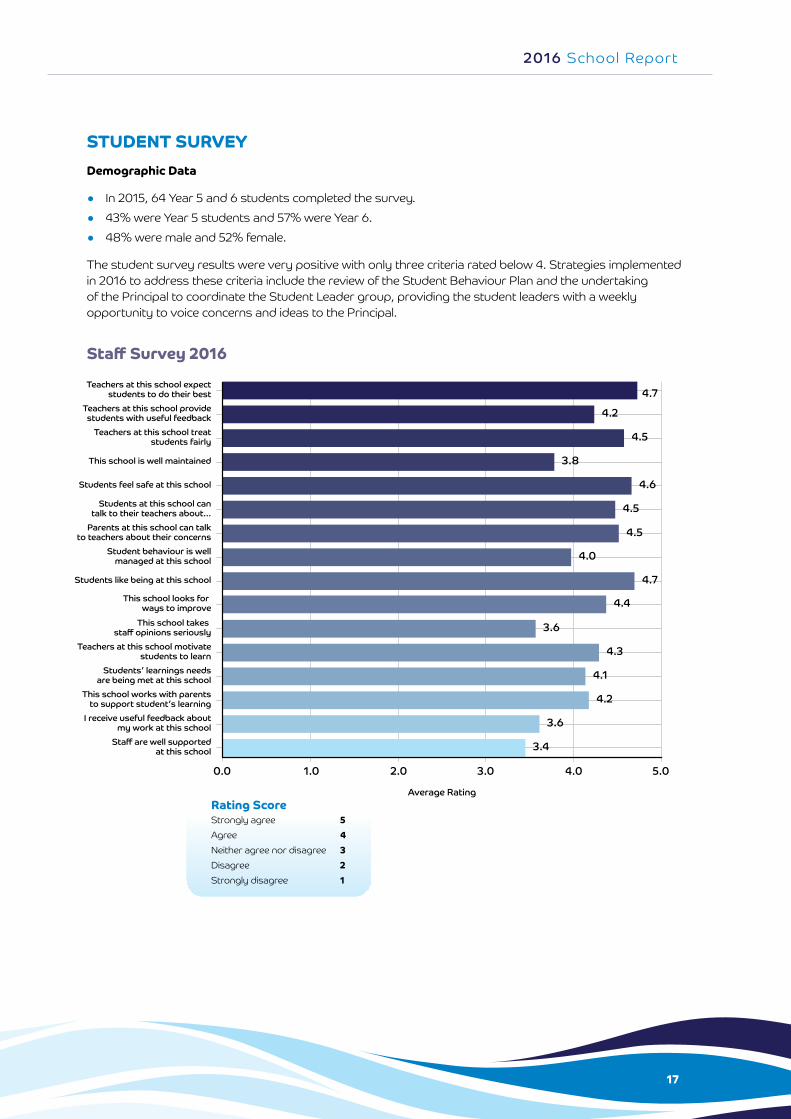
Student Survey 2015
Rating ScoreStrongly agree 5Agree 4Neither agree nor disagree 3Disagree 2Strongly disagree 1
Average Rating
My teachers expectme to do my best
My teachers provide me withuseful feedback about my school...
Teachers at my school treatstudents fairly
My school is well maintained
I feel safe at my school
I can talk to my teachersabout my concerns
Student behaviour is wellmanaged at my school
I like being at my school
My school looks for waysto improve
My school takes students’opinions seriously
My teachers motivatesme to learn
My school gives me opportunitiesto do interesting things
Student Survey 2015
0.0 1.0 2.0 3.0 4.0 5.0
4.6
4.2
3.9
4.2
4.6
4.0
3.8
4.4
4.3
3.7
4.2
4.3
17
2016 School Report
STUDENT SURVEYDemographic Data
• In 2015, 64 Year 5 and 6 students completed the survey.
• 43% were Year 5 students and 57% were Year 6.
• 48% were male and 52% female.
The student survey results were very positive with only three criteria rated below 4. Strategies implemented in 2016 to address these criteria include the review of the Student Behaviour Plan and the undertaking of the Principal to coordinate the Student Leader group, providing the student leaders with a weekly opportunity to voice concerns and ideas to the Principal.
Staff Survey 2016
Rating ScoreStrongly agree 5Agree 4Neither agree nor disagree 3Disagree 2Strongly disagree 1
Average Rating
Teachers at this school expectstudents to do their best
Teachers at this school providestudents with useful feedback
Teachers at this school treatstudents fairly
This school is well maintained
Students feel safe at this school
Students at this school cantalk to their teachers about...
Parents at this school can talk to teachers about their concerns
Student behaviour is wellmanaged at this school
Students like being at this school
This school looks for ways to improve
This school takes staff opinions seriously
Teachers at this school motivatestudents to learn
Students’ learnings needsare being met at this school
This school works with parentsto support student’s learning
I receive useful feedback aboutmy work at this school
Staff are well supportedat this school
Staff National School Opinion Survey
0.0 1.0 2.0 3.0 4.0 5.0
4.7
4.2
4.5
3.8
4.6
4.5
4.5
4.0
4.7
4.4
4.3
3.6
4.1
4.2
3.6
3.4
18
South Perth Primary School
STAFF SURVEYDemographic Data
• 24 staff members completed the survey.
• An equal number of full-time and part-time respondents.
• 72% were permanent staff members and 28% were on fixed-term contracts.
• 36% of respondents had been working at the school for 6-10 years and 32% for 11-20 years.
• 92% were female and 8% were male.
• 68% were teachers and 32% were support staff.
The vast majority of criteria received a rating of above 4 with only four questions rating below 4. In all cases, the criteria rated below 4 have had a significant improvement in the rating from 2014 to 2016. Therefore, the strategies that are currently in place will be continued. These include regular meetings of the Workload Advisory Committee, increased leadership and professional learning opportunities for staff members who are not in a leadership position and increased opportunities for collaboration and sharing.
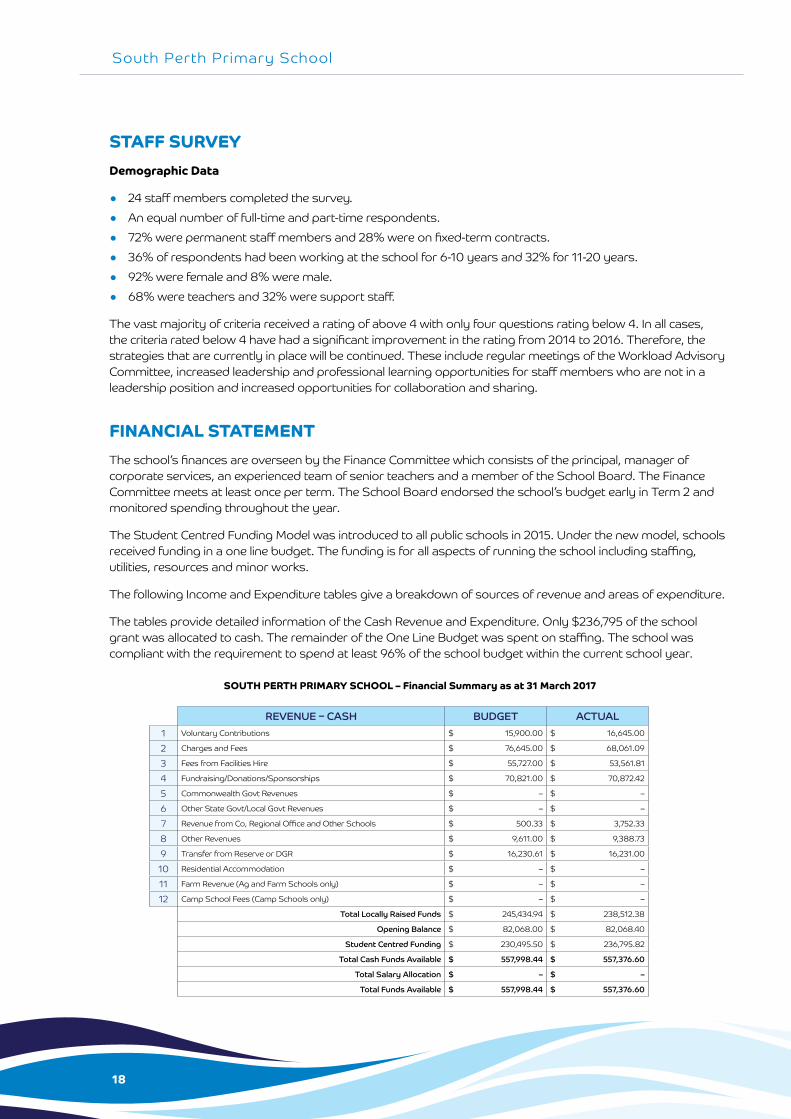
FINANCIAL STATEMENTThe school’s finances are overseen by the Finance Committee which consists of the principal, manager of corporate services, an experienced team of senior teachers and a member of the School Board. The Finance Committee meets at least once per term. The School Board endorsed the school’s budget early in Term 2 and monitored spending throughout the year.
The Student Centred Funding Model was introduced to all public schools in 2015. Under the new model, schools received funding in a one line budget. The funding is for all aspects of running the school including staffing, utilities, resources and minor works.
The following Income and Expenditure tables give a breakdown of sources of revenue and areas of expenditure.
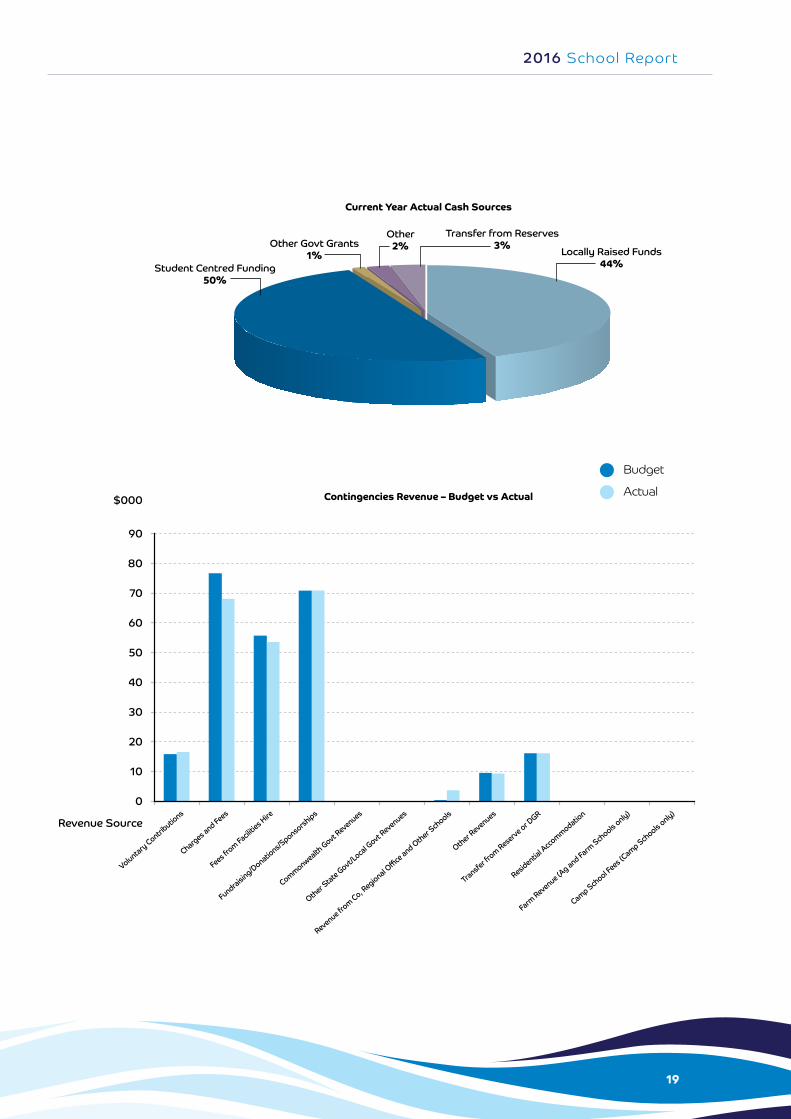
The tables provide detailed information of the Cash Revenue and Expenditure. Only $236,795 of the school grant was allocated to cash. The remainder of the One Line Budget was spent on staffing. The school was compliant with the requirement to spend at least 96% of the school budget within the current school year.
REVENUE – CASH BUDGET ACTUAL1 Voluntary Contributions $ 15,900.00 $ 16,645.00
2 Charges and Fees $ 76,645.00 $ 68,061.09
3 Fees from Facilities Hire $ 55,727.00 $ 53,561.81
4 Fundraising/Donations/Sponsorships $ 70,821.00 $ 70,872.42
5 Commonwealth Govt Revenues $ – $ –
6 Other State Govt/Local Govt Revenues $ – $ –
7 Revenue from Co, Regional Office and Other Schools $ 500.33 $ 3,752.33
8 Other Revenues $ 9,611.00 $ 9,388.73
9 Transfer from Reserve or DGR $ 16,230.61 $ 16,231.00
10 Residential Accommodation $ – $ –
11 Farm Revenue (Ag and Farm Schools only) $ – $ –
12 Camp School Fees (Camp Schools only) $ – $ –
Total Locally Raised Funds $ 245,434.94 $ 238,512.38
Opening Balance $ 82,068.00 $ 82,068.40
Student Centred Funding $ 230,495.50 $ 236,795.82
Total Cash Funds Available $ 557,998.44 $ 557,376.60
Total Salary Allocation $ – $ –
Total Funds Available $ 557,998.44 $ 557,376.60
Locally Raised Funds44%
Transfer from Reserves3%
Other2%Other Govt Grants
1%Student Centred Funding
50%
SOUTH PERTH PRIMARY SCHOOL – Financial Summary as at 31 March 2017
Current Year Actual Cash Sources
Contingencies Revenue – Budget vs Actual
90
80
70
60
50
40
30
20
10
0
$000
Revenue Source
Voluntary Contributio
ns
Charges and Fees
Fees from Facili
ties Hire
Fundraising/Donations/Sponsorships
Commonwealth Govt R
evenues
Other State Govt/L
ocal Govt R
evenues
Revenue from Co, R
egional Office and Other S
chools
Other Revenues
Transfer from Reserve or D
GR
Residential A
ccommodatio
n
Farm Revenue (A
g and Farm Schools only)
Camp School Fees (Camp Schools only)
19
2016 School Report
Locally Raised Funds44%
Transfer from Reserves3%
Other2%Other Govt Grants
1%Student Centred Funding
50%
SOUTH PERTH PRIMARY SCHOOL – Financial Summary as at 31 March 2017
Current Year Actual Cash Sources
Contingencies Revenue – Budget vs Actual
90
80
70
60
50
40
30
20
10
0
$000
Revenue Source
Voluntary Contributio
ns
Charges and Fees
Fees from Facili
ties Hire
Fundraising/Donations/Sponsorships
Commonwealth Govt R
evenues
Other State Govt/L
ocal Govt R
evenues
Revenue from Co, R
egional Office and Other S
chools
Other Revenues
Transfer from Reserve or D
GR
Residential A
ccommodatio
n
Farm Revenue (A
g and Farm Schools only)
Camp School Fees (Camp Schools only)
Budget
Actual
20
South Perth Primary School
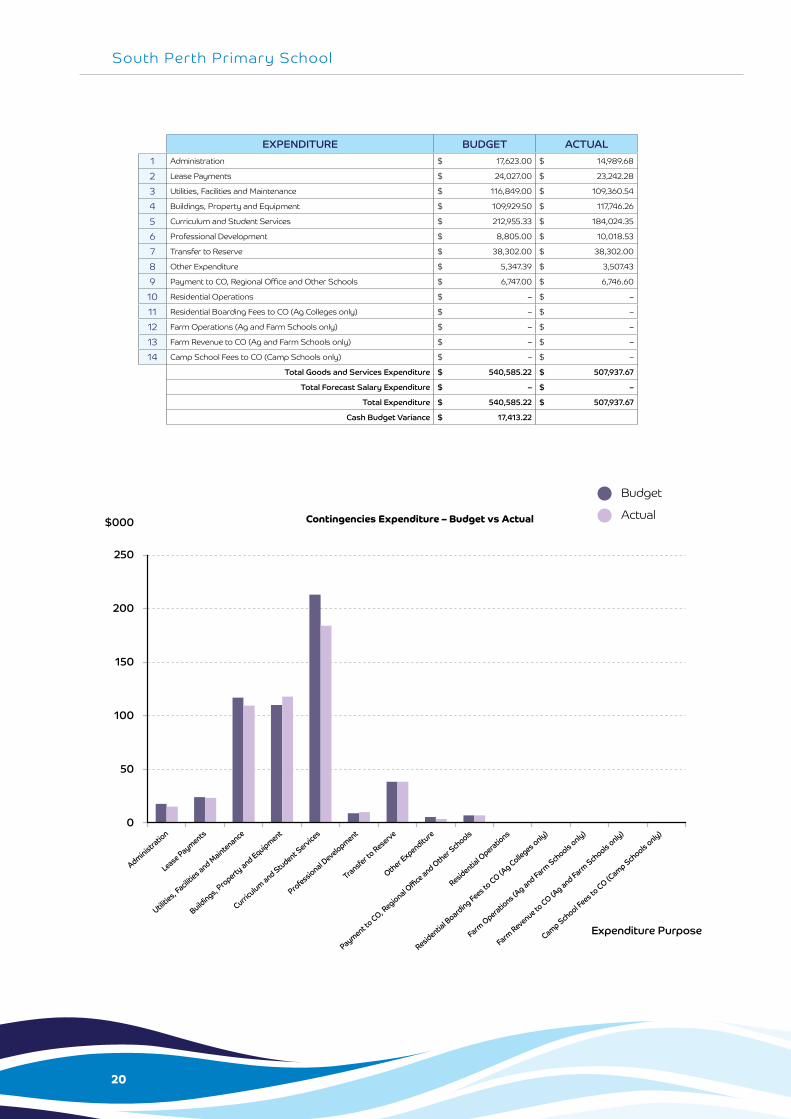
EXPENDITURE BUDGET ACTUAL1 Administration $ 17,623.00 $ 14,989.68
2 Lease Payments $ 24,027.00 $ 23,242.28
3 Utilities, Facilities and Maintenance $ 116,849.00 $ 109,360.54
4 Buildings, Property and Equipment $ 109,929.50 $ 117,746.26
5 Curriculum and Student Services $ 212,955.33 $ 184,024.35
6 Professional Development $ 8,805.00 $ 10,018.53
7 Transfer to Reserve $ 38,302.00 $ 38,302.00
8 Other Expenditure $ 5,347.39 $ 3,507.43
9 Payment to CO, Regional Office and Other Schools $ 6,747.00 $ 6,746.60
10 Residential Operations $ – $ –
11 Residential Boarding Fees to CO (Ag Colleges only) $ – $ –
12 Farm Operations (Ag and Farm Schools only) $ – $ –
13 Farm Revenue to CO (Ag and Farm Schools only) $ – $ –
14 Camp School Fees to CO (Camp Schools only) $ – $ –
Total Goods and Services Expenditure $ 540,585.22 $ 507,937.67
Total Forecast Salary Expenditure $ – $ –
Total Expenditure $ 540,585.22 $ 507,937.67
Cash Budget Variance $ 17,413.22
Contingencies Expenditure – Budget vs Actual
250
200
150
100
50
0
$000
Expenditure Purpose
Administratio
n
Lease Payments
Utilities, Facili
ties and M
aintenance
Buildings, Property
and Equipment
Curriculum and Student S
ervices
Professional Development
Transfer to Reserve
Other Expenditu
re
Payment to CO, R
egional Office and Other S
chools
Residential O
perations
Residential B
oarding Fees to CO (A
g Colleges only)
Farm Operatio
ns (Ag and Farm
Schools only)
Farm Revenue to
CO (Ag and Farm
Schools only)
Camp School Fees to CO (C
amp Schools only)
Budget
Actual
21
2016 School Report
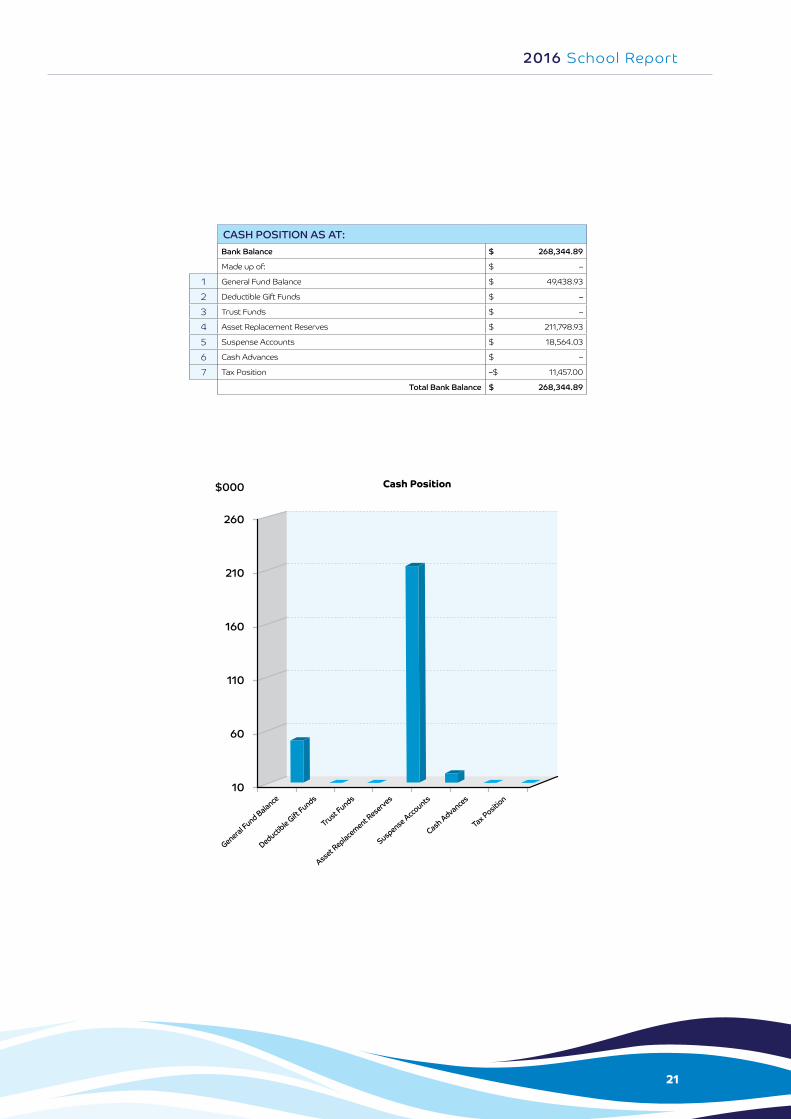
CASH POSITION AS AT:Bank Balance $ 268,344.89
Made up of: $ –
1 General Fund Balance $ 49,438.93
2 Deductible Gift Funds $ –
3 Trust Funds $ –
4 Asset Replacement Reserves $ 211,798.93
5 Suspense Accounts $ 18,564.03
6 Cash Advances $ –
7 Tax Position –$ 11,457.00
Total Bank Balance $ 268,344.89
Cash Position
260
210
160
110
60
10
$000
General Fund Balance
Deductible Gift
Funds
Trust Funds
Asset Replacement R
eserves
Suspense Accounts
Cash Advances
Tax Position