Kyle VanderLugt Kevin Fitzsimmons. Aquaculture Development Photos from AwF.
17
Kyle VanderLugt Kevin Fitzsimmons
-
Upload
ernest-mckenzie -
Category
Documents
-
view
215 -
download
0
Transcript of Kyle VanderLugt Kevin Fitzsimmons. Aquaculture Development Photos from AwF.

Kyle VanderLugtKevin Fitzsimmons

Photos from AwF

Aquaculture Development
Aquaculture cages in Bay of Manila photos: Reefbase/J. Oliver
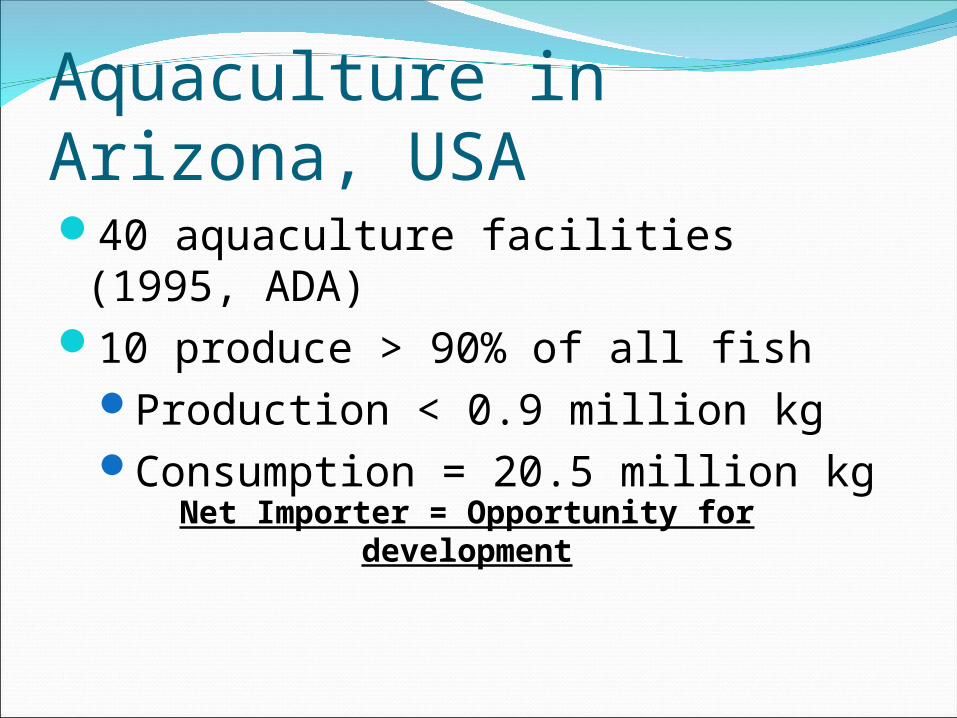
Aquaculture in Arizona, USA40 aquaculture facilities (1995,
ADA)10 produce > 90% of all fish
Production < 0.9 million kgConsumption = 20.5 million kg
Net Importer = Opportunity for development

Local Production
Local Demand
In State
Out of State
Local Supply = Local demandNon-basic markets
Local supply = Non-local demandBasic markets
Local Demand
Non-local demand
Non-local demand

Generate high capital inflow with minimum distribution costs.--How to make the most money?
What happens to money?--multiplier effects?
Local Production
Non-Basic Market
Basic Markets
Out of State
In State
Predict the increase in economic activity for each new dollar generated by industry sales.

Materials and Methods
Local Production
Non-Basic Market
Basic Markets
In state
Out of state
Survey method10 farms
Number of employeesFish production (Kg)Breakdown of expenditures and
receiptsLocal (within home county)Within balance of stateOut of state

Multiplier Modeling
Keynesian ModelingPropensity of industry to purchase inputs from
local economy versus from the outside economy.
Tiebout’s ModelingPropensity of firms and households to
purchase locally versus from outside economy
Location Quotient% of sales outside of home locality
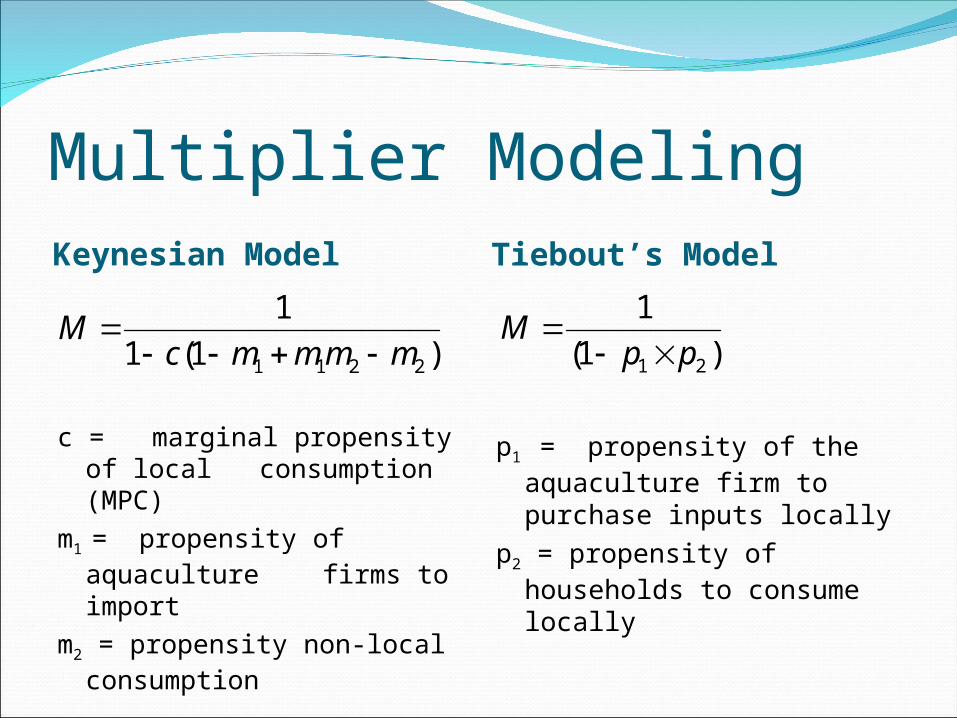
Multiplier ModelingKeynesian Model Tiebout’s Model
c = marginal propensity of local consumption (MPC)
m1 = propensity of aquaculture firms to import
m2 = propensity non-local consumption
p1 = propensity of the aquaculture firm to purchase inputs locally
p2 = propensity of households to consume locally
)1(1
1
2211 mmmmcM
)1(
1
21 ppM

Results: Keynesian model
Expend in
county
Expend in State
Expend out
State
Total expend
Sales in county
Sales in state
Sales out
state
Total sales
$845,000
$407,000
$910,000
$2,162,000
$599,000
$935,000
$227,000
$1,761,000
39% 19% 42% 100% 34% 53% 13% 100%
c = 0.85 m2 = 0.33 (Olfert and Stabler, 1994)m1 = 0.61M = 1.29
Non-basic Basic market
)1(1
1
2211 mmmmcM

Results: Keynesian model
Expend in
county
Expend in State
Expend out
State
Total expend
Sales in county
Sales in state
Sales out
state
Total sales
$845,000
$407,000
$910,000
$2,162,000
$599,000
$935,000
$227,000
$1,761,000
39% 19% 42% 100% 34% 53% 13% 100%
c = 0.85 m2 = 0.33 (Olfert and Stabler, 1994)X1 = 0.42M = 1.50
Non-basic market Basic
)1(1
1
2211 mmmmcM

Results: Tiebout’s model
Expend in
county
Expend in State
Expend out
State
Total expend
Sales in county
Sales in state
Sales out
state
Total sales
$845,000
$407,000
$910,000
$2,162,000
$599,000
$935,000
$227,000
$1,761,000
39% 19% 42% 100% 34% 53% 13% 100%
p1 = 0.39p2 = 0.66M = 1.34
Non-basic Basic market
)1(
1
21 ppM
Non-basic Basic market

Results: Tiebout’s model
Expend in
county
Expend in State
Expend out
State
Total expend
Sales in county
Sales in state
Sales out
state
Total sales
$845,000
$407,000
$910,000
$2,162,000
$599,000
$935,000
$227,000
$1,761,000
39% 19% 42% 100% 34% 53% 13% 100%
p1 = 0.58p2 = 0.66M = 1.62
Non-basic market Basic
)1(
1
21 ppM
Non-basic market Basic

Results: Location Quotient
Expend in
county
Expend in State
Expend out
State
Total expend
Sales in county
Sales in state
Sales out
state
Total sales
$845,000
$407,000
$910,000
$2,162,000
$599,000
$935,000
$227,000
$1,761,000
39% 19% 42% 100% 34% 53% 13% 100%
On county base: 34% fish sold locally (66% basic)
On state base: 87% sold locally (13% basic)

Summary
Local EconomyCommunity
Local Economy State-wide
Keynesian 1.29 1.5
Tiebout’s 1.34 1.62
Location Quotient
66% 13%

ConclusionsMultipliers increase as the definition of local
is increasedResults consistently demonstrate aquaculture
development in Arizona will have small multiplier effect.
Increase economic base by increasing location quotient export more fish out of state

Future Work
AGRIC AGRIC AGRIC R TRADE
AGRIC SERVS
CONSTR
TCPUT TOTALS
feed chemicals
labor fuel fingerling
repairs
Deprec. water
Operating 0.48 0.005 0.14 0.01 0.12 0.025
0 0.05 0.86
Investment
0 0 0 0 0 0 0.08 0 0.14
$1,037,760
$10,810 $302,680
$21,620 $259,440
$54,050
$172,960
$108,100
$2,162,000Multiplier non-basic employment using
matrix models by Vias and Mulligan