
Kwamena Quagrainie Purdue University, USA Steve Amisah Kwame Nkrumah University of Science &...
20
STUDY OF FISH FARMERS SOURCE OF AQUACULTURE INFORMATION IN GHANA Kwamena Quagrainie Purdue University, USA Steve Amisah Kwame Nkrumah University of Science & Technology, Ghana
-
Upload
isabel-carroll -
Category
Documents
-
view
213 -
download
1
Transcript of Kwamena Quagrainie Purdue University, USA Steve Amisah Kwame Nkrumah University of Science &...

STUDY OF FISH FARMERS SOURCE OF
AQUACULTURE INFORMATION IN
GHANAKwamena Quagrainie
Purdue University, USA
Steve AmisahKwame Nkrumah University of Science & Technology, Ghana

Main species are tilapia (Oreochromis niloticus) and catfish (Clarias gariepinus)
Total production about 950 mt/year Farms concentrated in Ashanti region Majority of farmers are small-scale operators using extensive fish farming practices
Aquaculture in Ghana

In 2005 Government took steps to support and accelerate aquaculture development by providing◦ extension services
◦ training in fish farming techniques
◦ training in basic bookkeeping & business plan preparation
◦ fingerlings for sale to fish farmers
Purpose of Study

Government parastatals Non-Governmental Organizations
– GTZ, FAO, WorldFish Center, etc
Universities Farmer groups
Other agencies involved in aquaculture

Where do farmers obtain
information about fish farming?
What is the source of technical
assistantship on fish farming?
What factors influence farmers’
choice of information source?
Questions?
Questionnaire solicited information on:
◦Source of information for aquaculture
◦Demographics
◦General Farm operations
◦Fish Farm operations
Methodology
Results - Demographics
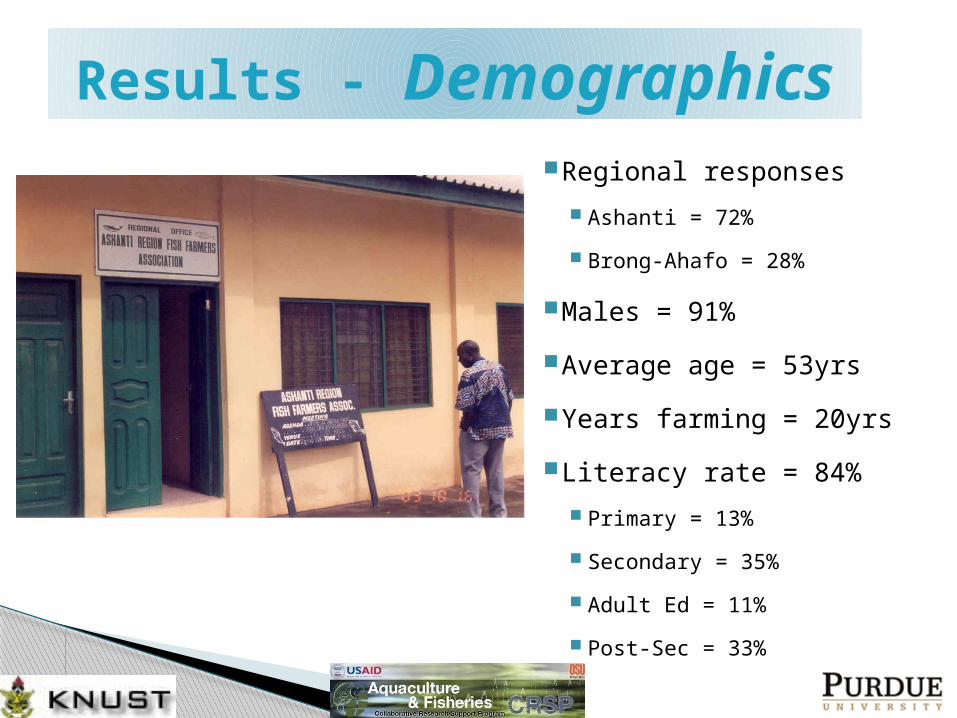
Regional responses
Ashanti = 72%
Brong-Ahafo = 28%
Males = 91%
Average age = 53yrs
Years farming = 20yrs
Literacy rate = 84%
Primary = 13%
Secondary = 35%
Adult Ed = 11%
Post-Sec = 33%

Results - Demographics
Average agricultural farm size = 44 acres Average pond acreage = 1 acre
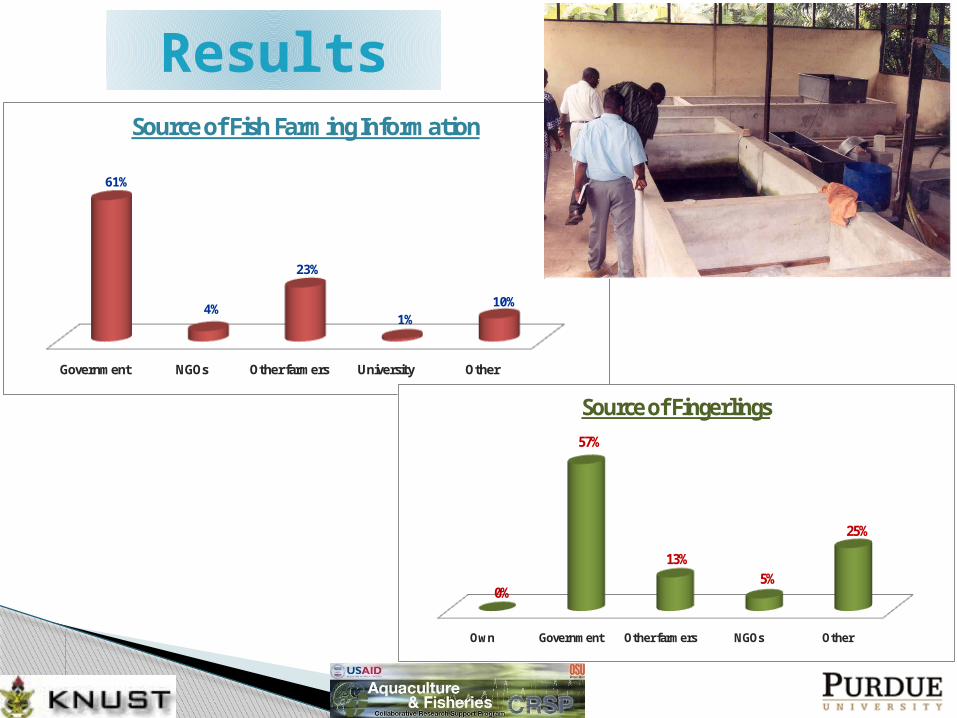
Results
Government NGOs Other farmers University Other
61%
4%
23%
1%10%
Source of Fish Farming Information
Own Government Other farmers NGOs Other
0%
57%
13%5%
25%
Source of Fingerlings

Results
Other producers
Direct to cosumers
Fish vendors Other Multiple outlets
4%
82%
10%3% 0%
Market Outlet

Multinomial Logit Analysis
Dependent Variable (Aqua Info
Source)
Y0 = Government Y1 = NGOs
Y2 = Other Farmers Y3 =
University
Y4 = Other
Explanatory variables
Region; Ashanti=1, otherwise=0
Number of years farming
Educational level; Read/write=1,
otherwise=0
Total pond acreage

Marginal Effects Averaged Over Individuals
VariableY=00 Gov
Y=01 NGO
Y=02 OFM
Y=03 UNI
Y=04 OTH
Ashanti region -0.269 0.067 -0.081 0.018 0.265
Farming years 0.082 -0.054 0.099 -0.006 -0.121
Literacy 0.434 -0.103 -0.062 -0.016 -0.253
Pond acreage 0.338 0.026 0.004 -0.413 0.046
Actual 61% 4% 23% 1% 10%Predicted Prob 59% 5% 25% 1% 10%
Overall % Correct Prediction 61%
Pseudo R-squared 0.14
Interpretation of Results
Ashanti Region farmers Farmers have increasing probability of
sourcing information from NGOs (7%),
university (2%) and other sources (27%)
But a declining probability of obtaining
aquaculture information from the
government (-27%) and other farmers (-
8%)
(Relative to Brong-Ahafo farmers)

Interpretation of Results
Number of years farming With more experience in farming, there is
increasing probability of farmers seeking
aquaculture information from the government
(8%) and other farmers (10%)
But a decreasing probability of sourcing
information from NGOs (-5%), university (-
1%) and other sources (-12%)

Interpretation of Results
Literacy Literate farmers have an
increasing probability of
obtaining aquaculture
information from the
government (43%)
But a decreasing probability
of sourcing information from
all others
(Relative to
Illiterates)
Interpretation of Results
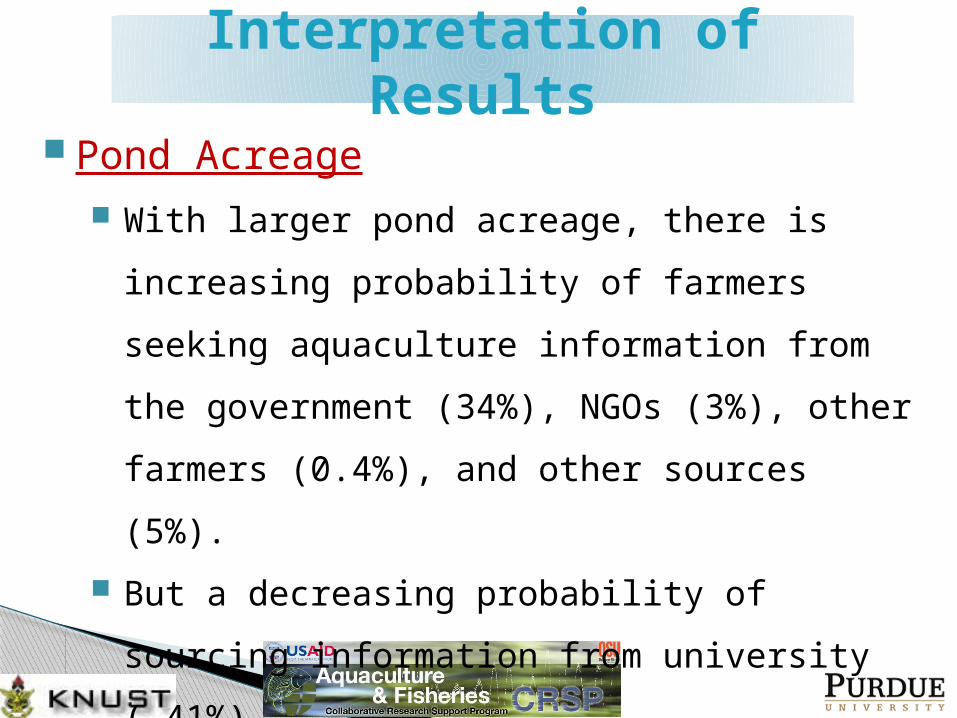
Pond Acreage With larger pond acreage, there is increasing
probability of farmers seeking aquaculture
information from the government (34%),
NGOs (3%), other farmers (0.4%), and other
sources (5%).
But a decreasing probability of sourcing
information from university (-41%).
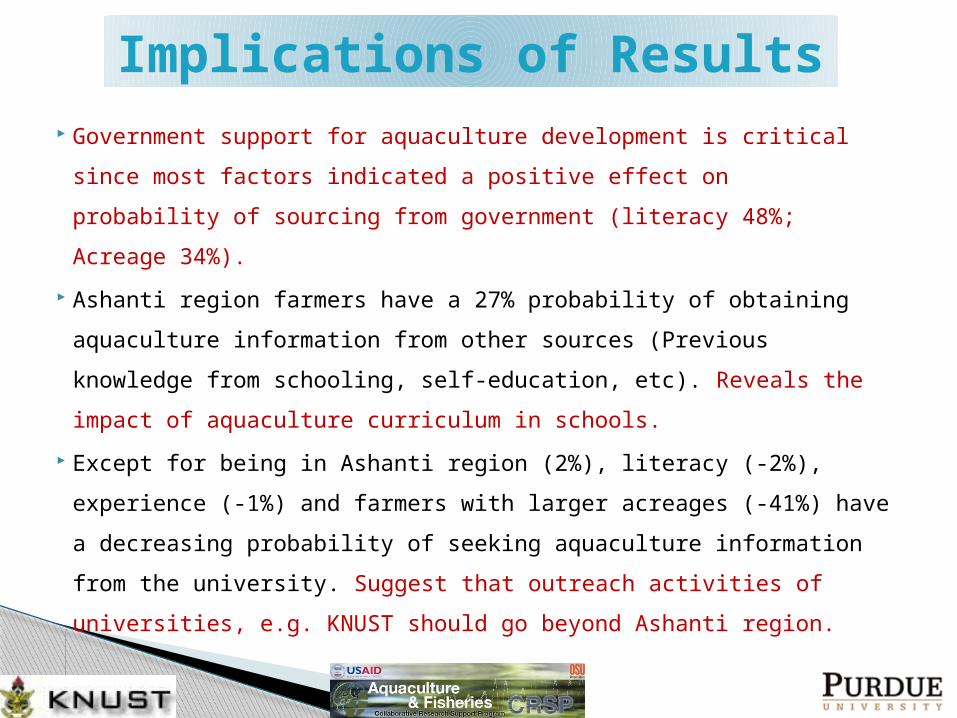
Government support for aquaculture development is critical
since most factors indicated a positive effect on probability of
sourcing from government (literacy 48%; Acreage 34%).
Ashanti region farmers have a 27% probability of obtaining
aquaculture information from other sources (Previous knowledge
from schooling, self-education, etc). Reveals the impact of
aquaculture curriculum in schools.
Except for being in Ashanti region (2%), literacy (-2%),
experience (-1%) and farmers with larger acreages (-41%) have a
decreasing probability of seeking aquaculture information from
the university. Suggest that outreach activities of universities,
e.g. KNUST should go beyond Ashanti region.
Implications of Results
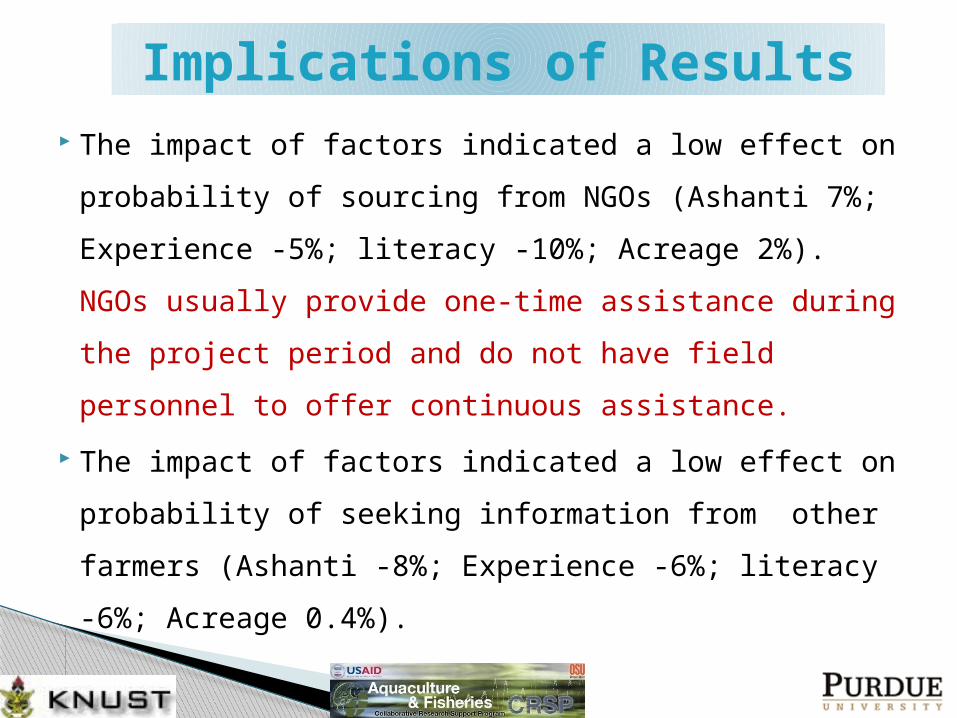
The impact of factors indicated a low effect on
probability of sourcing from NGOs (Ashanti 7%;
Experience -5%; literacy -10%; Acreage 2%). NGOs
usually provide one-time assistance during the
project period and do not have field personnel to
offer continuous assistance.
The impact of factors indicated a low effect on
probability of seeking information from other
farmers (Ashanti -8%; Experience -6%; literacy -6%;
Acreage 0.4%).
Implications of Results

This study was sponsored by the Aquaculture
& Fisheries Collaborative Research
Support Program (AquaFish CRSP) funded
under USAID Grant No. EPP-A-00-06-00012-
00 and by Purdue University, USA and
Kwame Nkrumah University of Science and
Technology, Ghana.
Acknowledgement


![Dr. Kwame Nkrumah - Papeles de · PDF fileDr. Kwame Nkrumah (1909-1972) A Short Biography Kwame Nkrumah Photo Gallery Excerpts from Speeches The Big Six ... [ John Henrik Clarke ]](https://static.fdocuments.in/doc/165x107/5aa47a957f8b9ab4788bf417/dr-kwame-nkrumah-papeles-de-kwame-nkrumah-1909-1972-a-short-biography-kwame.jpg)

