KUTNER BLOOD PRESSURE DATA -- UNBALANCED DESIGN … · kutner blood pressure data -- unbalanced...
50
KUTNER BLOOD PRESSURE DATA -- UNBALANCED DESIGN 1 BSBP = BASELINE, FSBP = FOLLOWUP, ISBP = F - B CHANGE 08:01 Monday, April 19, 2004 Obs DRUG DISEASE ISBP MISS BSBP FSBP 1 1 1 42 0 142 184 2 1 1 44 0 136 180 3 1 1 36 0 118 154 4 1 1 13 0 114 127 5 1 1 19 0 107 126 6 1 1 22 0 116 138 7 1 2 33 0 125 158 8 1 2 26 0 115 141 9 1 2 33 0 132 165 10 1 2 21 0 115 136 11 1 3 31 0 119 150 12 1 3 -3 0 92 89 13 1 3 25 0 121 146 14 1 3 25 0 117 142 15 1 3 24 0 111 135 16 2 1 28 0 109 137 17 2 1 23 0 116 139 18 2 1 34 0 126 160 19 2 1 42 0 139 181 20 2 1 13 0 112 125 21 2 2 34 0 116 150 22 2 2 33 0 134 167 23 2 2 31 0 127 158 24 2 2 36 0 119 155 25 2 3 3 0 76 79 26 2 3 26 0 98 124 27 2 3 28 0 118 146 28 2 3 32 0 115 147 29 2 3 4 0 100 104 30 2 3 16 0 97 113 31 3 1 1 0 95 96 32 3 1 29 0 102 131 33 3 1 19 0 114 133 34 3 2 11 0 104 115 35 3 2 9 0 115 124 36 3 2 7 0 126 133 37 3 2 1 0
Transcript of KUTNER BLOOD PRESSURE DATA -- UNBALANCED DESIGN … · kutner blood pressure data -- unbalanced...

KUTNER BLOOD PRESSURE DATA -- UNBALANCED DESIGN 1
BSBP = BASELINE, FSBP = FOLLOWUP, ISBP = F - B CHANGE08:01 Monday, April 19, 2004
Obs DRUG DISEASE ISBP MISS BSBP FSBP
1 1 1 42 0 142 184
2 1 1 44 0 136 180
3 1 1 36 0 118 154
4 1 1 13 0 114 127
5 1 1 19 0 107 126
6 1 1 22 0 116 138
7 1 2 33 0 125 158
8 1 2 26 0 115 141
9 1 2 33 0 132 165
10 1 2 21 0 115 136
11 1 3 31 0 119 150
12 1 3 -3 0 92 89
13 1 3 25 0 121 146
14 1 3 25 0 117 142
15 1 3 24 0 111 135
16 2 1 28 0 109 137
17 2 1 23 0 116 139
18 2 1 34 0 126 160
19 2 1 42 0 139 181
20 2 1 13 0 112 125
21 2 2 34 0 116 150
22 2 2 33 0 134 167
23 2 2 31 0 127 158
24 2 2 36 0 119 155
25 2 3 3 0 76 79
26 2 3 26 0 98 124
27 2 3 28 0 118 146
28 2 3 32 0 115 147
29 2 3 4 0 100 104
30 2 3 16 0 97 113
31 3 1 1 0 95 96
32 3 1 29 0 102 131
33 3 1 19 0 114 133
34 3 2 11 0 104 115
35 3 2 9 0 115 124
36 3 2 7 0 126 133
37 3 2 1 0 104 105
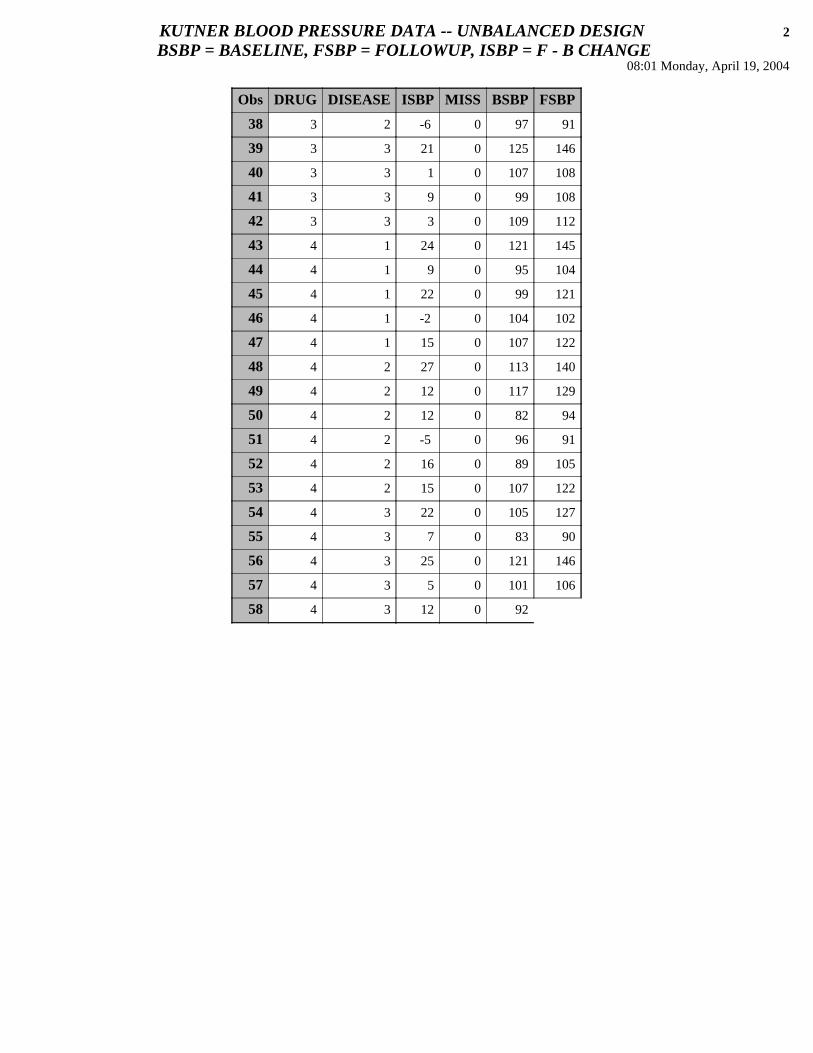
KUTNER BLOOD PRESSURE DATA -- UNBALANCED DESIGN 2
BSBP = BASELINE, FSBP = FOLLOWUP, ISBP = F - B CHANGE08:01 Monday, April 19, 2004
Obs DRUG DISEASE ISBP MISS BSBP FSBP
38 3 2 -6 0 97 91
39 3 3 21 0 125 146
40 3 3 1 0 107 108
41 3 3 9 0 99 108
42 3 3 3 0 109 112
43 4 1 24 0 121 145
44 4 1 9 0 95 104
45 4 1 22 0 99 121
46 4 1 -2 0 104 102
47 4 1 15 0 107 122
48 4 2 27 0 113 140
49 4 2 12 0 117 129
50 4 2 12 0 82 94
51 4 2 -5 0 96 91
52 4 2 16 0 89 105
53 4 2 15 0 107 122
54 4 3 22 0 105 127
55 4 3 7 0 83 90
56 4 3 25 0 121 146
57 4 3 5 0 101 106
58 4 3 12 0 92 104

KUTNER BLOOD PRESSURE DATA -- UNBALANCED DESIGN 3
BSBP = BASELINE, FSBP = FOLLOWUP, ISBP = F - B CHANGEDRUG EFFECT ON FOLLOWUP B.P., UNADJUSTED
08:01 Monday, April 19, 2004
The GLM Procedure
Class LevelInformation
Class Levels Values
DRUG 4 1 2 3 4
Number of observations 58

KUTNER BLOOD PRESSURE DATA -- UNBALANCED DESIGN 4
BSBP = BASELINE, FSBP = FOLLOWUP, ISBP = F - B CHANGEDRUG EFFECT ON FOLLOWUP B.P., UNADJUSTED
08:01 Monday, April 19, 2004
The GLM Procedure
Dependent Variable: FSBP
Source DFSum of
Squares Mean Square F Value Pr > F
Model 3 9895.46897 3298.48966 6.98 0.0005
Error 54 25502.60000 472.27037
Corrected Total 57 35398.06897
R-Square Coeff Var Root MSE FSBP Mean
0.279548 16.79248 21.73178 129.4138
Source DF Type III SS Mean Square F Value Pr > F
DRUG 3 9895.468966 3298.489655 6.98 0.0005
Parameter EstimateStandard
Error t Value Pr > |t|
Intercept 115.5000000 B 5.43294562 21.26 <.0001
DRUG 1 29.2333333 B 7.81035143 3.74 0.0004
DRUG 2 23.5000000 B 7.81035143 3.01 0.0040
DRUG 3 1.3333333 B 8.29896152 0.16 0.8730
DRUG 4 0.0000000 B . . .
NOTE: The X'X matrix has been found to be singular, and a generalized inverse was used to solve the normal equations. Terms whoseestimates are followed by the letter 'B' are not uniquely estimable.

KUTNER BLOOD PRESSURE DATA -- UNBALANCED DESIGN 5
BSBP = BASELINE, FSBP = FOLLOWUP, ISBP = F - B CHANGEDRUG EFFECT ON FOLLOWUP B.P., UNADJUSTED
08:01 Monday, April 19, 2004
The GLM ProcedureLeast Squares Means
DRUG FSBP LSMEANStandard
Error Pr > |t|LSMEAN
Number
1 144.733333 5.611122 <.0001 1
2 139.000000 5.611122 <.0001 2
3 116.833333 6.273425 <.0001 3
4 115.500000 5.432946 <.0001 4
Least Squares Means for effect DRUGPr > |t| for H0: LSMean(i)=LSMean(j)
Dependent Variable: FSBP
i/j 1 2 3 4
1 0.4731 0.0016 0.0004
2 0.4731 0.0110 0.0040
3 0.0016 0.0110 0.8730
4 0.0004 0.0040 0.8730
NOTE: To ensure overall protection level, only probabilities associated with pre-planned comparisons should be used.

KUTNER BLOOD PRESSURE DATA -- UNBALANCED DESIGN 6
BSBP = BASELINE, FSBP = FOLLOWUP, ISBP = F - B CHANGEREGRESSION OF FOLLOWUP ON BASELINE 08:01 Monday, April 19, 2004
The GLM Procedure
Number of observations 58
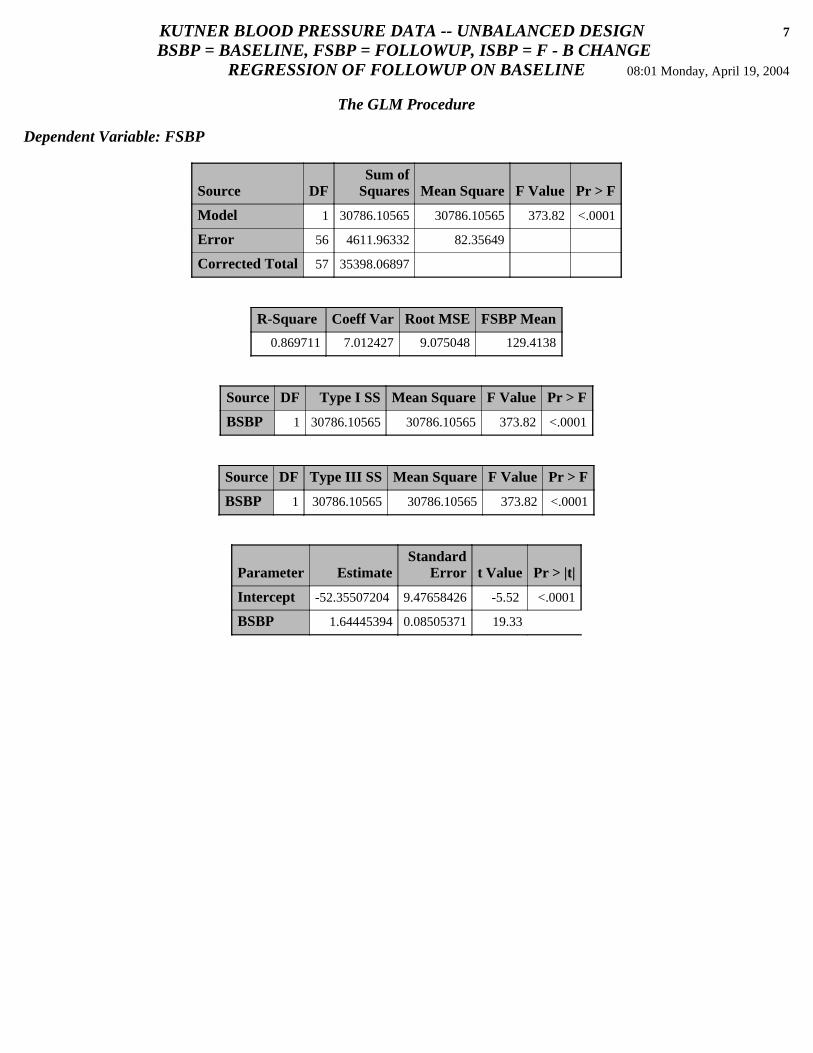
KUTNER BLOOD PRESSURE DATA -- UNBALANCED DESIGN 7
BSBP = BASELINE, FSBP = FOLLOWUP, ISBP = F - B CHANGEREGRESSION OF FOLLOWUP ON BASELINE 08:01 Monday, April 19, 2004
The GLM Procedure
Dependent Variable: FSBP
Source DFSum of
Squares Mean Square F Value Pr > F
Model 1 30786.10565 30786.10565 373.82 <.0001
Error 56 4611.96332 82.35649
Corrected Total 57 35398.06897
R-Square Coeff Var Root MSE FSBP Mean
0.869711 7.012427 9.075048 129.4138
Source DF Type I SS Mean Square F Value Pr > F
BSBP 1 30786.10565 30786.10565 373.82 <.0001
Source DF Type III SS Mean Square F Value Pr > F
BSBP 1 30786.10565 30786.10565 373.82 <.0001
Parameter EstimateStandard
Error t Value Pr > |t|
Intercept -52.35507204 9.47658426 -5.52 <.0001
BSBP 1.64445394 0.08505371 19.33 <.0001
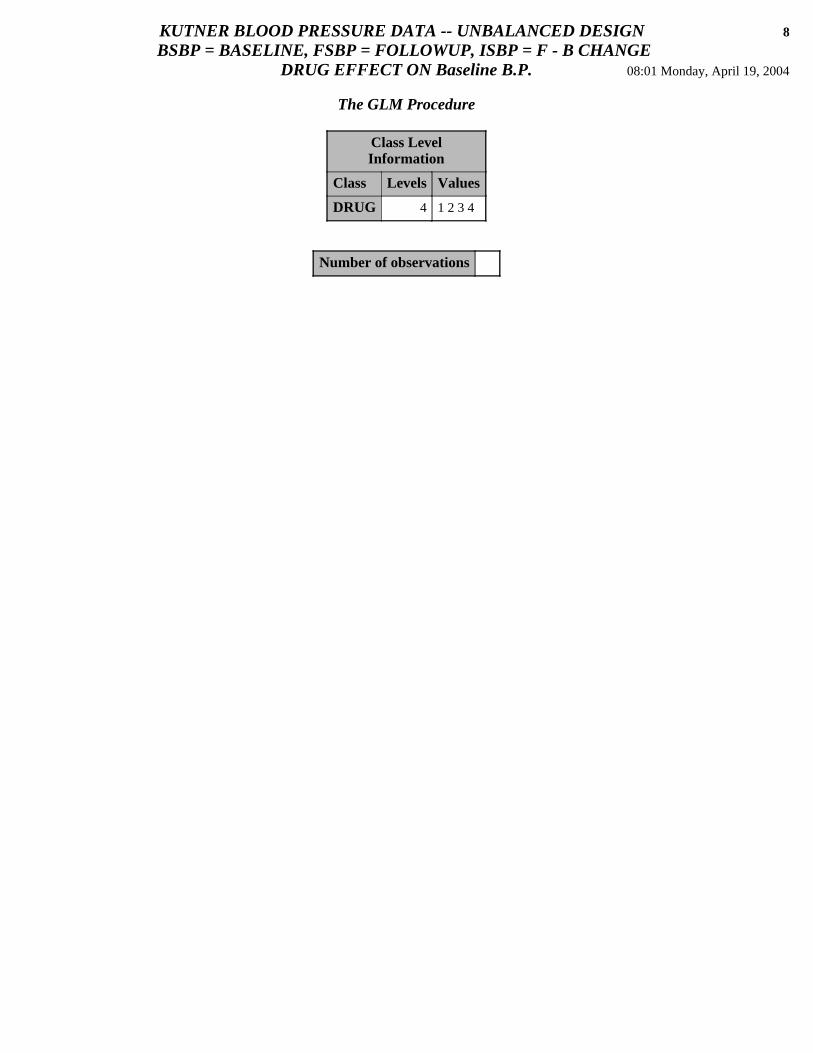
KUTNER BLOOD PRESSURE DATA -- UNBALANCED DESIGN 8
BSBP = BASELINE, FSBP = FOLLOWUP, ISBP = F - B CHANGEDRUG EFFECT ON Baseline B.P. 08:01 Monday, April 19, 2004
The GLM Procedure
Class LevelInformation
Class Levels Values
DRUG 4 1 2 3 4
Number of observations 58
KUTNER BLOOD PRESSURE DATA -- UNBALANCED DESIGN 9
BSBP = BASELINE, FSBP = FOLLOWUP, ISBP = F - B CHANGEDRUG EFFECT ON Baseline B.P. 08:01 Monday, April 19, 2004
The GLM Procedure
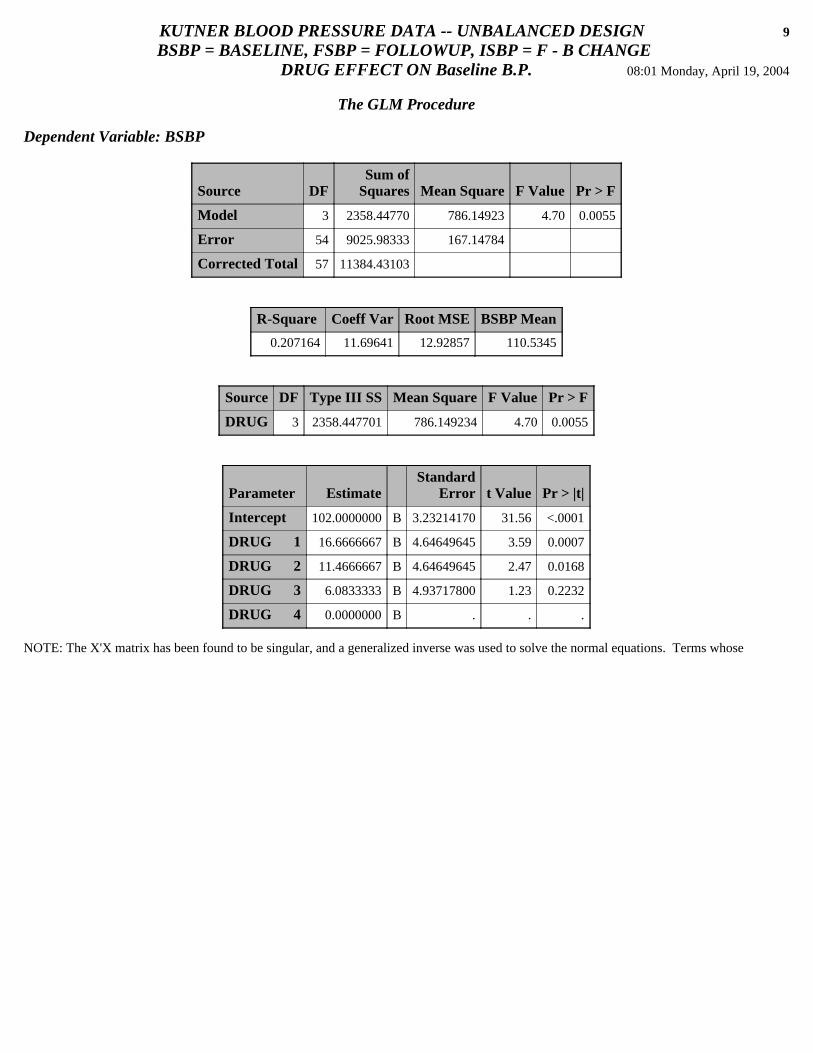
Dependent Variable: BSBP
Source DFSum of
Squares Mean Square F Value Pr > F
Model 3 2358.44770 786.14923 4.70 0.0055
Error 54 9025.98333 167.14784
Corrected Total 57 11384.43103
R-Square Coeff Var Root MSE BSBP Mean
0.207164 11.69641 12.92857 110.5345
Source DF Type III SS Mean Square F Value Pr > F
DRUG 3 2358.447701 786.149234 4.70 0.0055
Parameter EstimateStandard
Error t Value Pr > |t|
Intercept 102.0000000 B 3.23214170 31.56 <.0001
DRUG 1 16.6666667 B 4.64649645 3.59 0.0007
DRUG 2 11.4666667 B 4.64649645 2.47 0.0168
DRUG 3 6.0833333 B 4.93717800 1.23 0.2232
DRUG 4 0.0000000 B . . .
NOTE: The X'X matrix has been found to be singular, and a generalized inverse was used to solve the normal equations. Terms whoseestimates are followed by the letter 'B' are not uniquely estimable.

KUTNER BLOOD PRESSURE DATA -- UNBALANCED DESIGN 10
BSBP = BASELINE, FSBP = FOLLOWUP, ISBP = F - B CHANGEDRUG EFFECT ON Baseline B.P. 08:01 Monday, April 19, 2004
The GLM ProcedureLeast Squares Means
DRUG BSBP LSMEANStandard
Error Pr > |t|LSMEAN
Number
1 118.666667 3.338142 <.0001 1
2 113.466667 3.338142 <.0001 2
3 108.083333 3.732156 <.0001 3
4 102.000000 3.232142 <.0001 4
Least Squares Means for effect DRUGPr > |t| for H0: LSMean(i)=LSMean(j)
Dependent Variable: BSBP
i/j 1 2 3 4
1 0.2756 0.0392 0.0007
2 0.2756 0.2871 0.0168
3 0.0392 0.2871 0.2232
4 0.0007 0.0168 0.2232
NOTE: To ensure overall protection level, only probabilities associated with pre-planned comparisons should be used.

KUTNER BLOOD PRESSURE DATA -- UNBALANCED DESIGN 11
BSBP = BASELINE, FSBP = FOLLOWUP, ISBP = F - B CHANGEDRUG EFFECT ON FOLLOWUP B.P., ADJUSTED FOR BASELINE B.P.
08:01 Monday, April 19, 2004
The GLM Procedure
Class LevelInformation
Class Levels Values
DRUG 4 1 2 3 4
Number of observations 58
KUTNER BLOOD PRESSURE DATA -- UNBALANCED DESIGN 12
BSBP = BASELINE, FSBP = FOLLOWUP, ISBP = F - B CHANGEDRUG EFFECT ON FOLLOWUP B.P., ADJUSTED FOR BASELINE B.P.
08:01 Monday, April 19, 2004
The GLM Procedure
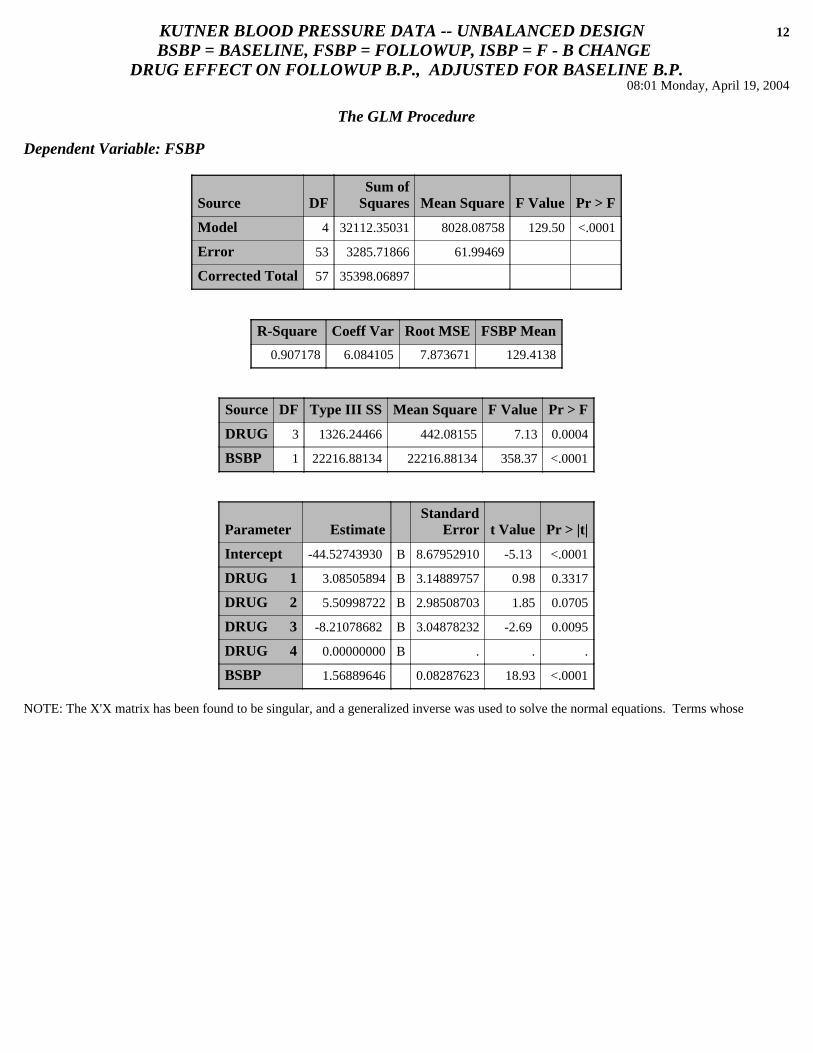
Dependent Variable: FSBP
Source DFSum of
Squares Mean Square F Value Pr > F
Model 4 32112.35031 8028.08758 129.50 <.0001
Error 53 3285.71866 61.99469
Corrected Total 57 35398.06897
R-Square Coeff Var Root MSE FSBP Mean
0.907178 6.084105 7.873671 129.4138
Source DF Type III SS Mean Square F Value Pr > F
DRUG 3 1326.24466 442.08155 7.13 0.0004
BSBP 1 22216.88134 22216.88134 358.37 <.0001
Parameter EstimateStandard
Error t Value Pr > |t|
Intercept -44.52743930 B 8.67952910 -5.13 <.0001
DRUG 1 3.08505894 B 3.14889757 0.98 0.3317
DRUG 2 5.50998722 B 2.98508703 1.85 0.0705
DRUG 3 -8.21078682 B 3.04878232 -2.69 0.0095
DRUG 4 0.00000000 B . . .
BSBP 1.56889646 0.08287623 18.93 <.0001
NOTE: The X'X matrix has been found to be singular, and a generalized inverse was used to solve the normal equations. Terms whoseestimates are followed by the letter 'B' are not uniquely estimable.

KUTNER BLOOD PRESSURE DATA -- UNBALANCED DESIGN 13
BSBP = BASELINE, FSBP = FOLLOWUP, ISBP = F - B CHANGEDRUG EFFECT ON FOLLOWUP B.P., ADJUSTED FOR BASELINE B.P.
08:01 Monday, April 19, 2004
The GLM ProcedureLeast Squares Means
Coefficients for DRUG Least Square Means
DRUG Level
Effect 1 2 3 4
Intercept 1 1 1 1
DRUG 1 1 0 0 0
DRUG 2 0 1 0 0
DRUG 3 0 0 1 0
DRUG 4 0 0 0 1
BSBP 110.534483 110.534483 110.534483 110.534483
DRUG FSBP LSMEANStandard
Error Pr > |t|LSMEAN
Number
1 131.974779 2.141777 <.0001 1
2 134.399707 2.047445 <.0001 2
3 120.678933 2.281993 <.0001 3
4 128.889720 2.091638 <.0001 4
Least Squares Means for effect DRUGPr > |t| for H0: LSMean(i)=LSMean(j)
Dependent Variable: FSBP
i/j 1 2 3 4
1 0.4080 0.0008 0.3317
2 0.4080 <.0001 0.0705
3 0.0008 <.0001 0.0095
4 0.3317 0.0705 0.0095
NOTE: To ensure overall protection level, only probabilities associated with pre-planned comparisons should be used.

KUTNER BLOOD PRESSURE DATA -- UNBALANCED DESIGN 14
BSBP = BASELINE, FSBP = FOLLOWUP, ISBP = F - B CHANGEDRUG BY DISEASE EFFECTS ON FOLLOWUP B.P., UNADJUSTED
08:01 Monday, April 19, 2004
The GLM Procedure
Class Level Information
Class Levels Values
DRUG 4 1 2 3 4
DISEASE 3 1 2 3
Number of observations 58

KUTNER BLOOD PRESSURE DATA -- UNBALANCED DESIGN 15
BSBP = BASELINE, FSBP = FOLLOWUP, ISBP = F - B CHANGEDRUG BY DISEASE EFFECTS ON FOLLOWUP B.P., UNADJUSTED
08:01 Monday, April 19, 2004
The GLM Procedure
Dependent Variable: FSBP
Source DFSum of
Squares Mean Square F Value Pr > F
Model 11 15468.63563 1406.23960 3.25 0.0024
Error 46 19929.43333 433.24855
Corrected Total 57 35398.06897
R-Square Coeff Var Root MSE FSBP Mean
0.436991 16.08378 20.81462 129.4138
Source DF Type III SS Mean Square F Value Pr > F
DRUG 3 10191.88576 3397.29525 7.84 0.0002
DISEASE 2 2181.69748 1090.84874 2.52 0.0917
DRUG*DISEASE 6 3018.68300 503.11383 1.16 0.3434
Parameter EstimateStandard
Error t Value Pr > |t|
Intercept 114.6000000 B 9.30858261 12.31 <.0001
DRUG 1 17.8000000 B 13.16432377 1.35 0.1829
DRUG 2 4.2333333 B 12.60388043 0.34 0.7385
DRUG 3 3.9000000 B 13.96287391 0.28 0.7813
DRUG 4 0.0000000 B . . .
DISEASE 1 4.2000000 B 13.16432377 0.32 0.7511
DISEASE 2 -1.1000000 B 12.60388043 -0.09 0.9308
DISEASE 3 0.0000000 B . . .
DRUG*DISEASE 1 1 14.9000000 B 18.22518099 0.82 0.4178
DRUG*DISEASE 1 2 18.7000000 B 18.81009436 0.99 0.3254
DRUG*DISEASE 1 3 0.0000000 B . . .
DRUG*DISEASE 2 1 25.3666667 B 18.22518099 1.39 0.1707
DRUG*DISEASE 2 2 39.7666667 B 18.42221570 2.16 0.0361
DRUG*DISEASE 2 3 0.0000000 B . . .
DRUG*DISEASE 3 1 -2.7000000 B 20.64043947 -0.13 0.8965
DRUG*DISEASE 3 2 -3.8000000 B 18.81009436 -0.20 0.8408
DRUG*DISEASE 3 3 0.0000000 B . . .
DRUG*DISEASE 4 1 0.0000000 B . . .

KUTNER BLOOD PRESSURE DATA -- UNBALANCED DESIGN 16
BSBP = BASELINE, FSBP = FOLLOWUP, ISBP = F - B CHANGEDRUG BY DISEASE EFFECTS ON FOLLOWUP B.P., UNADJUSTED
08:01 Monday, April 19, 2004
The GLM ProcedureDependent Variable: FSBP
Parameter EstimateStandard
Error t Value Pr > |t|
DRUG*DISEASE 4 2 0.0000000 B . . .
DRUG*DISEASE 4 3 0.0000000 B . . .
NOTE: The X'X matrix has been found to be singular, and a generalized inverse was used to solve the normal equations. Terms whoseestimates are followed by the letter 'B' are not uniquely estimable.
KUTNER BLOOD PRESSURE DATA -- UNBALANCED DESIGN 17
BSBP = BASELINE, FSBP = FOLLOWUP, ISBP = F - B CHANGEDRUG BY DISEASE EFFECTS ON FOLLOWUP B.P., UNADJUSTED
08:01 Monday, April 19, 2004
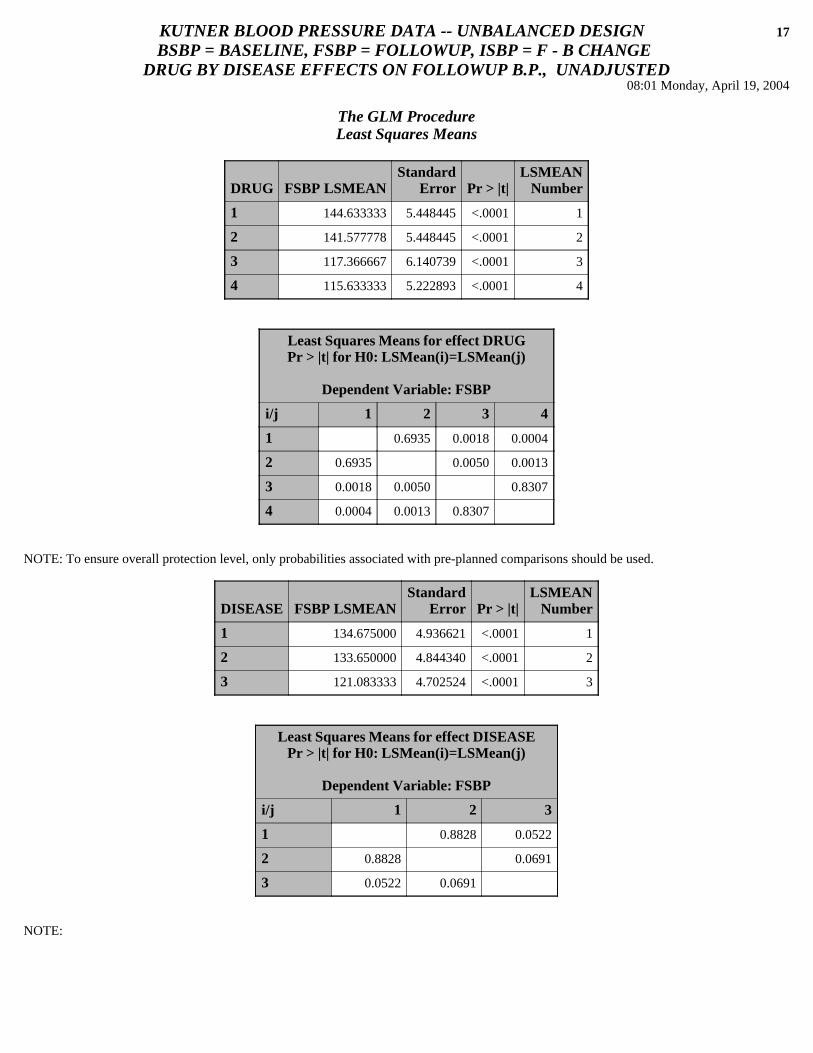
The GLM ProcedureLeast Squares Means
DRUG FSBP LSMEANStandard
Error Pr > |t|LSMEAN
Number
1 144.633333 5.448445 <.0001 1
2 141.577778 5.448445 <.0001 2
3 117.366667 6.140739 <.0001 3
4 115.633333 5.222893 <.0001 4
Least Squares Means for effect DRUGPr > |t| for H0: LSMean(i)=LSMean(j)
Dependent Variable: FSBP
i/j 1 2 3 4
1 0.6935 0.0018 0.0004
2 0.6935 0.0050 0.0013
3 0.0018 0.0050 0.8307
4 0.0004 0.0013 0.8307
NOTE: To ensure overall protection level, only probabilities associated with pre-planned comparisons should be used.
DISEASE FSBP LSMEANStandard
Error Pr > |t|LSMEAN
Number
1 134.675000 4.936621 <.0001 1
2 133.650000 4.844340 <.0001 2
3 121.083333 4.702524 <.0001 3
Least Squares Means for effect DISEASEPr > |t| for H0: LSMean(i)=LSMean(j)
Dependent Variable: FSBP
i/j 1 2 3
1 0.8828 0.0522
2 0.8828 0.0691
3 0.0522 0.0691
NOTE: To ensure overall protection level, only probabilities associated with pre-planned comparisons should be used.
KUTNER BLOOD PRESSURE DATA -- UNBALANCED DESIGN 18
BSBP = BASELINE, FSBP = FOLLOWUP, ISBP = F - B CHANGEDRUG BY DISEASE EFFECTS ON FOLLOWUP B.P., UNADJUSTED
08:01 Monday, April 19, 2004
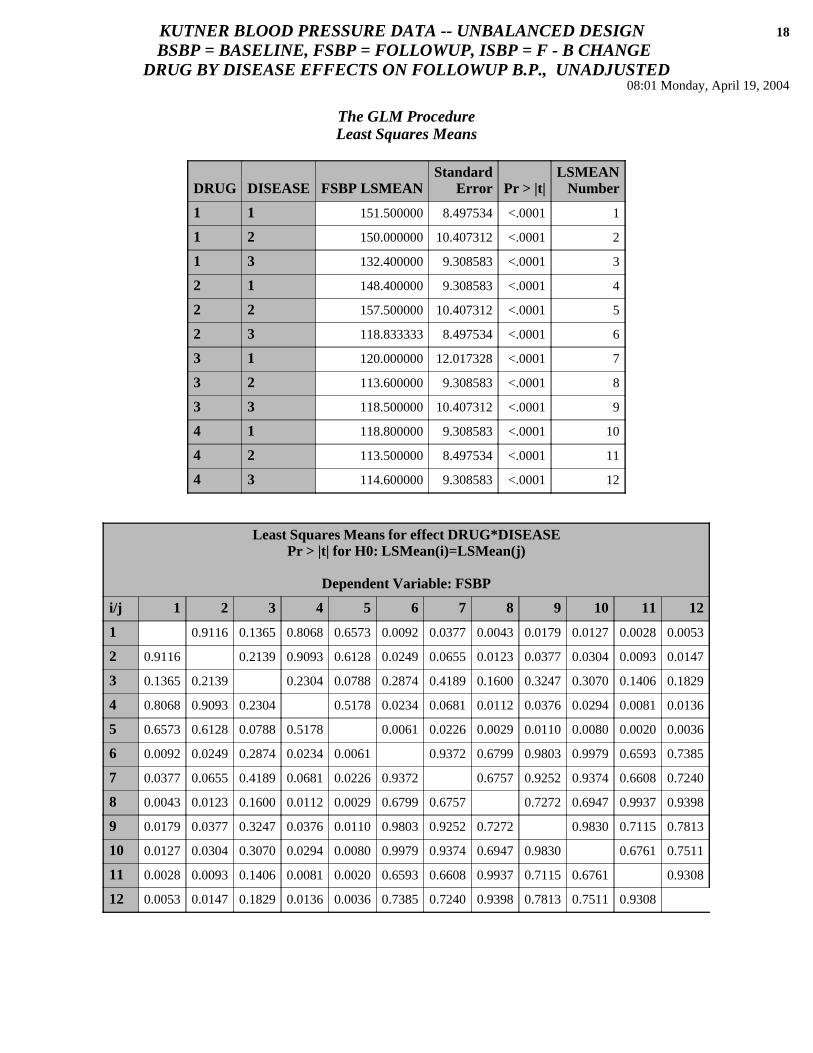
The GLM ProcedureLeast Squares Means
DRUG DISEASE FSBP LSMEANStandard
Error Pr > |t|LSMEAN
Number
1 1 151.500000 8.497534 <.0001 1
1 2 150.000000 10.407312 <.0001 2
1 3 132.400000 9.308583 <.0001 3
2 1 148.400000 9.308583 <.0001 4
2 2 157.500000 10.407312 <.0001 5
2 3 118.833333 8.497534 <.0001 6
3 1 120.000000 12.017328 <.0001 7
3 2 113.600000 9.308583 <.0001 8
3 3 118.500000 10.407312 <.0001 9
4 1 118.800000 9.308583 <.0001 10
4 2 113.500000 8.497534 <.0001 11
4 3 114.600000 9.308583 <.0001 12
Least Squares Means for effect DRUG*DISEASEPr > |t| for H0: LSMean(i)=LSMean(j)
Dependent Variable: FSBP
i/j 1 2 3 4 5 6 7 8 9 10 11 12
1 0.9116 0.1365 0.8068 0.6573 0.0092 0.0377 0.0043 0.0179 0.0127 0.0028 0.0053
2 0.9116 0.2139 0.9093 0.6128 0.0249 0.0655 0.0123 0.0377 0.0304 0.0093 0.0147
3 0.1365 0.2139 0.2304 0.0788 0.2874 0.4189 0.1600 0.3247 0.3070 0.1406 0.1829
4 0.8068 0.9093 0.2304 0.5178 0.0234 0.0681 0.0112 0.0376 0.0294 0.0081 0.0136
5 0.6573 0.6128 0.0788 0.5178 0.0061 0.0226 0.0029 0.0110 0.0080 0.0020 0.0036
6 0.0092 0.0249 0.2874 0.0234 0.0061 0.9372 0.6799 0.9803 0.9979 0.6593 0.7385
7 0.0377 0.0655 0.4189 0.0681 0.0226 0.9372 0.6757 0.9252 0.9374 0.6608 0.7240
8 0.0043 0.0123 0.1600 0.0112 0.0029 0.6799 0.6757 0.7272 0.6947 0.9937 0.9398
9 0.0179 0.0377 0.3247 0.0376 0.0110 0.9803 0.9252 0.7272 0.9830 0.7115 0.7813
10 0.0127 0.0304 0.3070 0.0294 0.0080 0.9979 0.9374 0.6947 0.9830 0.6761 0.7511
11 0.0028 0.0093 0.1406 0.0081 0.0020 0.6593 0.6608 0.9937 0.7115 0.6761 0.9308
12 0.0053 0.0147 0.1829 0.0136 0.0036 0.7385 0.7240 0.9398 0.7813 0.7511 0.9308
NOTE: To ensure overall protection level, only probabilities associated with pre-planned comparisons should be used.

KUTNER BLOOD PRESSURE DATA -- UNBALANCED DESIGN 19
BSBP = BASELINE, FSBP = FOLLOWUP, ISBP = F - B CHANGEDRUG BY DISEASE DIFFERENCES IN BASELINE B.P.
08:01 Monday, April 19, 2004
The GLM Procedure
Class Level Information
Class Levels Values
DRUG 4 1 2 3 4
DISEASE 3 1 2 3
Number of observations 58
KUTNER BLOOD PRESSURE DATA -- UNBALANCED DESIGN 20
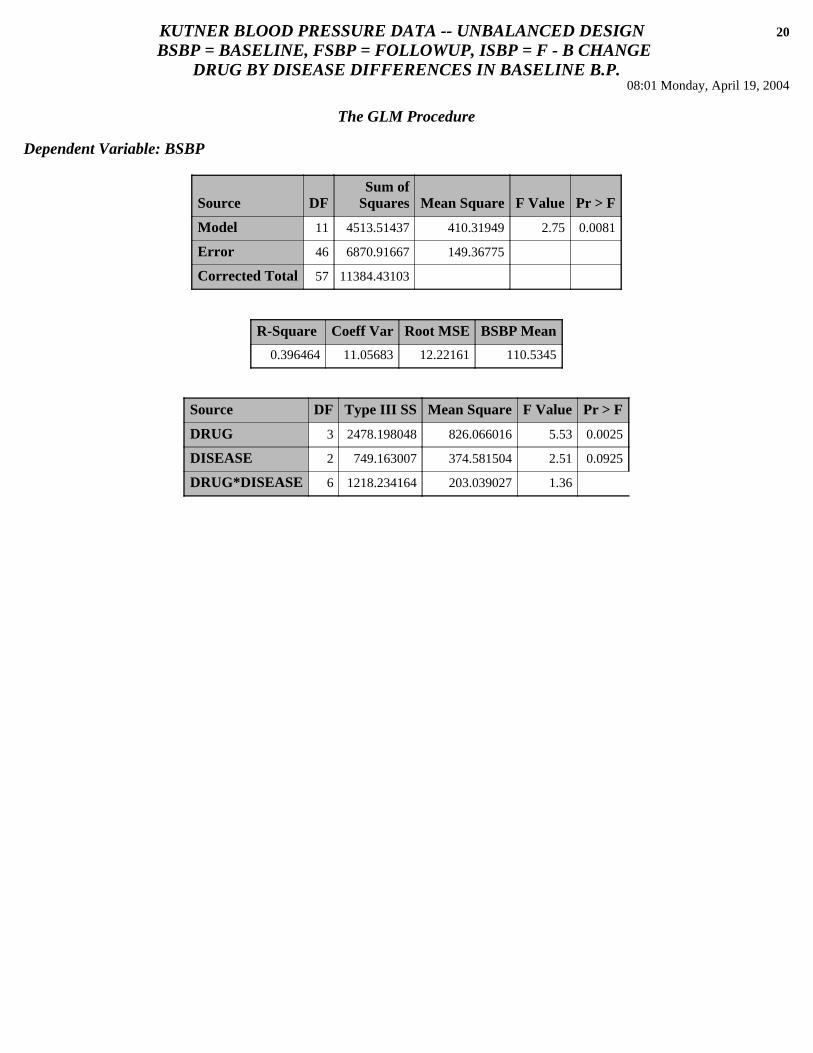
BSBP = BASELINE, FSBP = FOLLOWUP, ISBP = F - B CHANGEDRUG BY DISEASE DIFFERENCES IN BASELINE B.P.
08:01 Monday, April 19, 2004
The GLM Procedure
Dependent Variable: BSBP
Source DFSum of
Squares Mean Square F Value Pr > F
Model 11 4513.51437 410.31949 2.75 0.0081
Error 46 6870.91667 149.36775
Corrected Total 57 11384.43103
R-Square Coeff Var Root MSE BSBP Mean
0.396464 11.05683 12.22161 110.5345
Source DF Type III SS Mean Square F Value Pr > F
DRUG 3 2478.198048 826.066016 5.53 0.0025
DISEASE 2 749.163007 374.581504 2.51 0.0925
DRUG*DISEASE 6 1218.234164 203.039027 1.36 0.2511
KUTNER BLOOD PRESSURE DATA -- UNBALANCED DESIGN 21
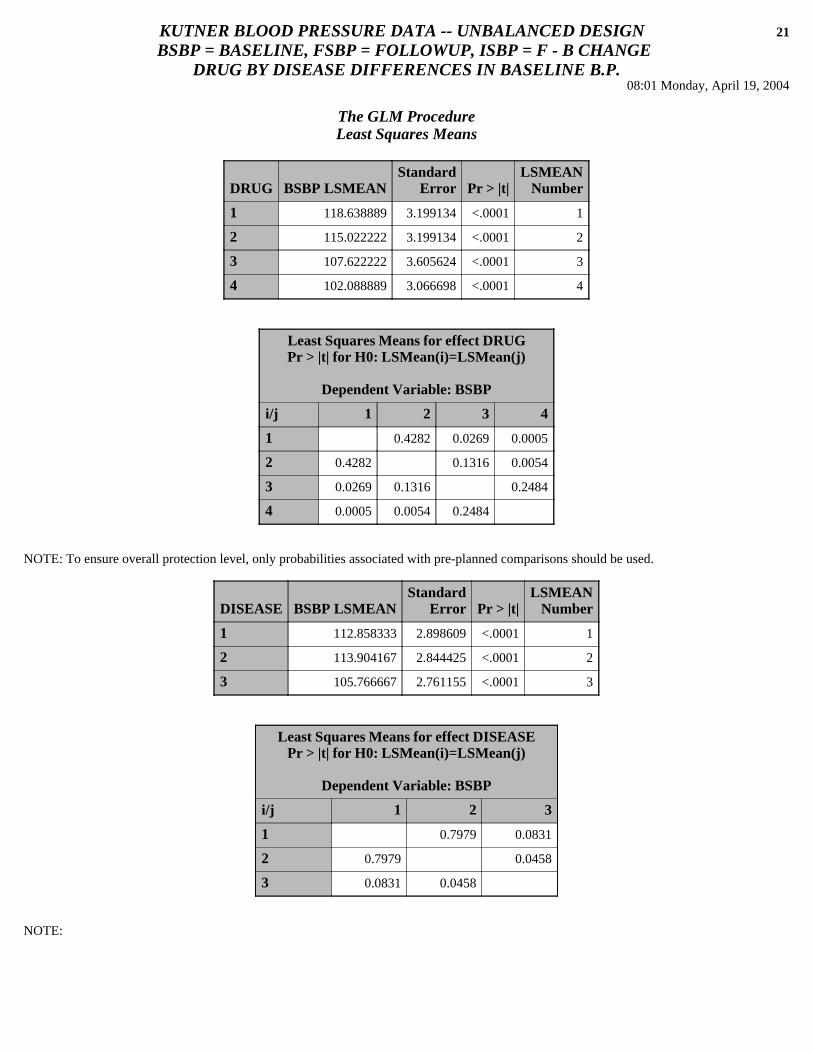
BSBP = BASELINE, FSBP = FOLLOWUP, ISBP = F - B CHANGEDRUG BY DISEASE DIFFERENCES IN BASELINE B.P.
08:01 Monday, April 19, 2004
The GLM ProcedureLeast Squares Means
DRUG BSBP LSMEANStandard
Error Pr > |t|LSMEAN
Number
1 118.638889 3.199134 <.0001 1
2 115.022222 3.199134 <.0001 2
3 107.622222 3.605624 <.0001 3
4 102.088889 3.066698 <.0001 4
Least Squares Means for effect DRUGPr > |t| for H0: LSMean(i)=LSMean(j)
Dependent Variable: BSBP
i/j 1 2 3 4
1 0.4282 0.0269 0.0005
2 0.4282 0.1316 0.0054
3 0.0269 0.1316 0.2484
4 0.0005 0.0054 0.2484
NOTE: To ensure overall protection level, only probabilities associated with pre-planned comparisons should be used.
DISEASE BSBP LSMEANStandard
Error Pr > |t|LSMEAN
Number
1 112.858333 2.898609 <.0001 1
2 113.904167 2.844425 <.0001 2
3 105.766667 2.761155 <.0001 3
Least Squares Means for effect DISEASEPr > |t| for H0: LSMean(i)=LSMean(j)
Dependent Variable: BSBP
i/j 1 2 3
1 0.7979 0.0831
2 0.7979 0.0458
3 0.0831 0.0458
NOTE: To ensure overall protection level, only probabilities associated with pre-planned comparisons should be used.

KUTNER BLOOD PRESSURE DATA -- UNBALANCED DESIGN 22
BSBP = BASELINE, FSBP = FOLLOWUP, ISBP = F - B CHANGEDRUG BY DISEASE DIFFERENCES IN BASELINE B.P.
08:01 Monday, April 19, 2004
The GLM ProcedureLeast Squares Means
DRUG DISEASE BSBP LSMEANStandard
Error Pr > |t|LSMEAN
Number
1 1 122.166667 4.989451 <.0001 1
1 2 121.750000 6.110805 <.0001 2
1 3 112.000000 5.465670 <.0001 3
2 1 120.400000 5.465670 <.0001 4
2 2 124.000000 6.110805 <.0001 5
2 3 100.666667 4.989451 <.0001 6
3 1 103.666667 7.056150 <.0001 7
3 2 109.200000 5.465670 <.0001 8
3 3 110.000000 6.110805 <.0001 9
4 1 105.200000 5.465670 <.0001 10
4 2 100.666667 4.989451 <.0001 11
4 3 100.400000 5.465670 <.0001 12
Least Squares Means for effect DRUG*DISEASEPr > |t| for H0: LSMean(i)=LSMean(j)
Dependent Variable: BSBP
i/j 1 2 3 4 5 6 7 8 9 10 11 12
1 0.9581 0.1762 0.8124 0.8173 0.0038 0.0376 0.0864 0.1299 0.0265 0.0038 0.0051
2 0.9581 0.2404 0.8699 0.7958 0.0104 0.0589 0.1327 0.1806 0.0494 0.0104 0.0124
3 0.1762 0.2404 0.2828 0.1501 0.1325 0.3554 0.7188 0.8084 0.3836 0.1325 0.1403
4 0.8124 0.8699 0.2828 0.6626 0.0105 0.0672 0.1541 0.2110 0.0553 0.0105 0.0129
5 0.8173 0.7958 0.1501 0.6626 0.0049 0.0345 0.0776 0.1121 0.0265 0.0049 0.0060
6 0.0038 0.0104 0.1325 0.0105 0.0049 0.7301 0.2548 0.2429 0.5432 1.0000 0.9714
7 0.0376 0.0589 0.3554 0.0672 0.0345 0.7301 0.5383 0.5009 0.8644 0.7301 0.7160
8 0.0864 0.1327 0.7188 0.1541 0.0776 0.2548 0.5383 0.9227 0.6073 0.2548 0.2608
9 0.1299 0.1806 0.8084 0.2110 0.1121 0.2429 0.5009 0.9227 0.5611 0.2429 0.2477
10 0.0265 0.0494 0.3836 0.0553 0.0265 0.5432 0.8644 0.6073 0.5611 0.5432 0.5377
11 0.0038 0.0104 0.1325 0.0105 0.0049 1.0000 0.7301 0.2548 0.2429 0.5432 0.9714
12 0.0051 0.0124 0.1403 0.0129 0.0060 0.9714 0.7160 0.2608 0.2477 0.5377 0.9714
NOTE: To ensure overall protection level, only probabilities associated with pre-planned comparisons should be used.

KUTNER BLOOD PRESSURE DATA -- UNBALANCED DESIGN 23
BSBP = BASELINE, FSBP = FOLLOWUP, ISBP = F - B CHANGEDRUG BY DISEASE EFFECTS ON FOLLOWUP B.P., ADJUSTED FOR BSBP
08:01 Monday, April 19, 2004
The GLM Procedure
Class Level Information
Class Levels Values
DRUG 4 1 2 3 4
DISEASE 3 1 2 3
Number of observations 58

KUTNER BLOOD PRESSURE DATA -- UNBALANCED DESIGN 24
BSBP = BASELINE, FSBP = FOLLOWUP, ISBP = F - B CHANGEDRUG BY DISEASE EFFECTS ON FOLLOWUP B.P., ADJUSTED FOR BSBP
08:01 Monday, April 19, 2004
The GLM Procedure
Dependent Variable: FSBP
Source DFSum of
Squares Mean Square F Value Pr > F
Model 12 32632.94394 2719.41200 44.26 <.0001
Error 45 2765.12502 61.44722
Corrected Total 57 35398.06897
R-Square Coeff Var Root MSE FSBP Mean
0.921885 6.057181 7.838828 129.4138
Source DF Type III SS Mean Square F Value Pr > F
DRUG 3 1004.31971 334.77324 5.45 0.0028
DISEASE 2 77.44095 38.72047 0.63 0.5371
DRUG*DISEASE 6 480.01760 80.00293 1.30 0.2759
BSBP 1 17164.30831 17164.30831 279.33 <.0001
Parameter EstimateStandard
Error t Value Pr > |t|
Intercept -44.08633346 B 10.12112729 -4.36 <.0001
DRUG 1 -0.53427757 B 5.07762456 -0.11 0.9167
DRUG 2 3.81185569 B 4.74671300 0.80 0.4262
DRUG 3 -11.27319523 B 5.33623888 -2.11 0.0402
DRUG 4 0.00000000 B . . .
DISEASE 1 -3.38659762 B 4.97844733 -0.68 0.4998
DISEASE 2 -1.52147765 B 4.74671300 -0.32 0.7500
DISEASE 3 0.00000000 B . . .
DRUG*DISEASE 1 1 6.41776239 B 6.88237665 0.93 0.3561
DRUG*DISEASE 1 2 3.71120124 B 7.14046097 0.52 0.6058
DRUG*DISEASE 1 3 0.00000000 B . . .
DRUG*DISEASE 2 1 1.76391853 B 7.00741651 0.25 0.8024
DRUG*DISEASE 2 2 3.30885035 B 7.27268983 0.45 0.6513
DRUG*DISEASE 2 3 0.00000000 B . . .
DRUG*DISEASE 3 1 14.89669169 B 7.84420858 1.90 0.0640
DRUG*DISEASE 3 2 -2.11408942 B 7.08463646 -0.30 0.7668
DRUG*DISEASE 3 3 0.00000000 B . . .
KUTNER BLOOD PRESSURE DATA -- UNBALANCED DESIGN 25
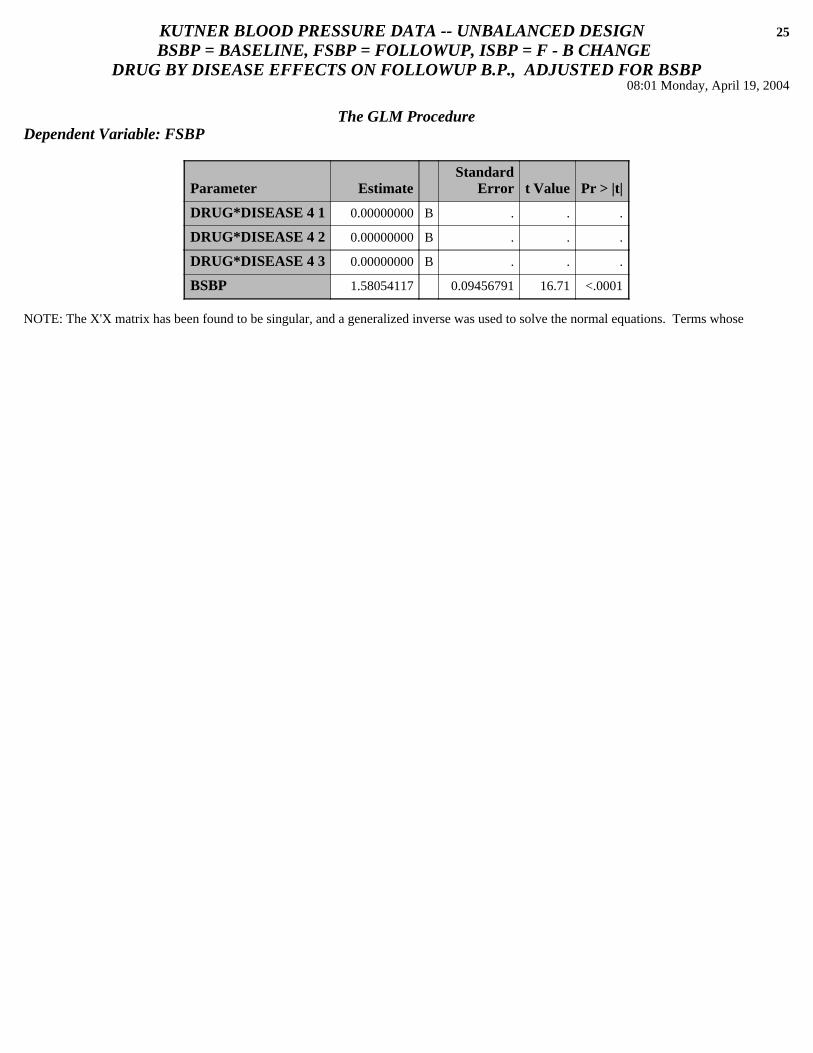
BSBP = BASELINE, FSBP = FOLLOWUP, ISBP = F - B CHANGEDRUG BY DISEASE EFFECTS ON FOLLOWUP B.P., ADJUSTED FOR BSBP
08:01 Monday, April 19, 2004
The GLM ProcedureDependent Variable: FSBP
Parameter EstimateStandard
Error t Value Pr > |t|
DRUG*DISEASE 4 1 0.00000000 B . . .
DRUG*DISEASE 4 2 0.00000000 B . . .
DRUG*DISEASE 4 3 0.00000000 B . . .
BSBP 1.58054117 0.09456791 16.71 <.0001
NOTE: The X'X matrix has been found to be singular, and a generalized inverse was used to solve the normal equations. Terms whoseestimates are followed by the letter 'B' are not uniquely estimable.
KUTNER BLOOD PRESSURE DATA -- UNBALANCED DESIGN 26
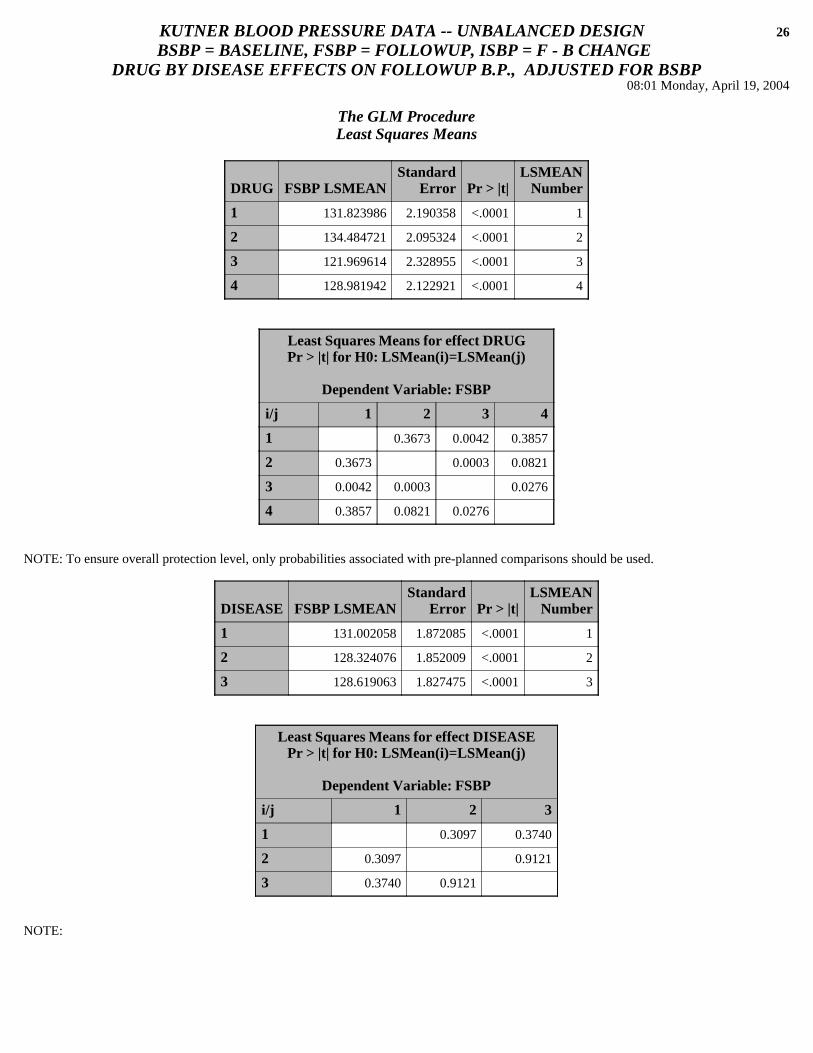
BSBP = BASELINE, FSBP = FOLLOWUP, ISBP = F - B CHANGEDRUG BY DISEASE EFFECTS ON FOLLOWUP B.P., ADJUSTED FOR BSBP
08:01 Monday, April 19, 2004
The GLM ProcedureLeast Squares Means
DRUG FSBP LSMEANStandard
Error Pr > |t|LSMEAN
Number
1 131.823986 2.190358 <.0001 1
2 134.484721 2.095324 <.0001 2
3 121.969614 2.328955 <.0001 3
4 128.981942 2.122921 <.0001 4
Least Squares Means for effect DRUGPr > |t| for H0: LSMean(i)=LSMean(j)
Dependent Variable: FSBP
i/j 1 2 3 4
1 0.3673 0.0042 0.3857
2 0.3673 0.0003 0.0821
3 0.0042 0.0003 0.0276
4 0.3857 0.0821 0.0276
NOTE: To ensure overall protection level, only probabilities associated with pre-planned comparisons should be used.
DISEASE FSBP LSMEANStandard
Error Pr > |t|LSMEAN
Number
1 131.002058 1.872085 <.0001 1
2 128.324076 1.852009 <.0001 2
3 128.619063 1.827475 <.0001 3
Least Squares Means for effect DISEASEPr > |t| for H0: LSMean(i)=LSMean(j)
Dependent Variable: FSBP
i/j 1 2 3
1 0.3097 0.3740
2 0.3097 0.9121
3 0.3740 0.9121
NOTE: To ensure overall protection level, only probabilities associated with pre-planned comparisons should be used.

KUTNER BLOOD PRESSURE DATA -- UNBALANCED DESIGN 27
BSBP = BASELINE, FSBP = FOLLOWUP, ISBP = F - B CHANGEDRUG BY DISEASE EFFECTS ON FOLLOWUP B.P., ADJUSTED FOR BSBP
08:01 Monday, April 19, 2004
The GLM ProcedureLeast Squares Means
DRUG DISEASE FSBP LSMEANStandard
Error Pr > |t|LSMEAN
Number
1 1 133.114854 3.383973 <.0001 1
1 2 132.273413 4.060386 <.0001 2
1 3 130.083690 3.508369 <.0001 3
2 1 132.807144 3.627652 <.0001 4
2 2 136.217196 4.121088 <.0001 5
2 3 134.429823 3.333471 <.0001 6
3 1 130.854866 4.572114 <.0001 7
3 2 115.709205 3.507901 <.0001 8
3 3 119.344772 3.919740 <.0001 9
4 1 127.231370 3.541742 <.0001 10
4 2 129.096490 3.333471 <.0001 11
4 3 130.617967 3.634277 <.0001 12
Least Squares Means for effect DRUG*DISEASEPr > |t| for H0: LSMean(i)=LSMean(j)
Dependent Variable: FSBP
i/j 1 2 3 4 5 6 7 8 9 10 11 12
1 0.8687 0.5346 0.9486 0.5431 0.7922 0.6992 0.0009 0.0110 0.2465 0.4223 0.6317
2 0.8687 0.6836 0.9196 0.4808 0.6936 0.8208 0.0036 0.0270 0.3630 0.5620 0.7702
3 0.5346 0.6836 0.5902 0.2603 0.3765 0.8944 0.0058 0.0472 0.5711 0.8402 0.9167
4 0.9486 0.9196 0.5902 0.5208 0.7518 0.7439 0.0015 0.0155 0.2858 0.4707 0.6819
5 0.5431 0.4808 0.2603 0.5208 0.7476 0.3983 0.0005 0.0049 0.1125 0.2037 0.3322
6 0.7922 0.6936 0.3765 0.7518 0.7476 0.5228 0.0003 0.0052 0.1379 0.2448 0.4262
7 0.6992 0.8208 0.8944 0.7439 0.3983 0.5228 0.0115 0.0621 0.5301 0.7528 0.9672
8 0.0009 0.0036 0.0058 0.0015 0.0005 0.0003 0.0115 0.4929 0.0251 0.0079 0.0048
9 0.0110 0.0270 0.0472 0.0155 0.0049 0.0052 0.0621 0.4929 0.1421 0.0640 0.0402
10 0.2465 0.3630 0.5711 0.2858 0.1125 0.1379 0.5301 0.0251 0.1421 0.6974 0.4998
11 0.4223 0.5620 0.8402 0.4707 0.2037 0.2448 0.7528 0.0079 0.0640 0.6974 0.7500
12 0.6317 0.7702 0.9167 0.6819 0.3322 0.4262 0.9672 0.0048 0.0402 0.4998 0.7500
NOTE: To ensure overall protection level, only probabilities associated with pre-planned comparisons should be used.
KUTNER BLOOD PRESSURE DATA -- UNBALANCED DESIGN 28
BSBP = BASELINE, FSBP = FOLLOWUP, ISBP = F - B CHANGEREGRESSION OF CHANGE ON BASELINE 08:01 Monday, April 19, 2004
The GLM Procedure
Number of observations 58
KUTNER BLOOD PRESSURE DATA -- UNBALANCED DESIGN 29
BSBP = BASELINE, FSBP = FOLLOWUP, ISBP = F - B CHANGEREGRESSION OF CHANGE ON BASELINE 08:01 Monday, April 19, 2004
The GLM Procedure
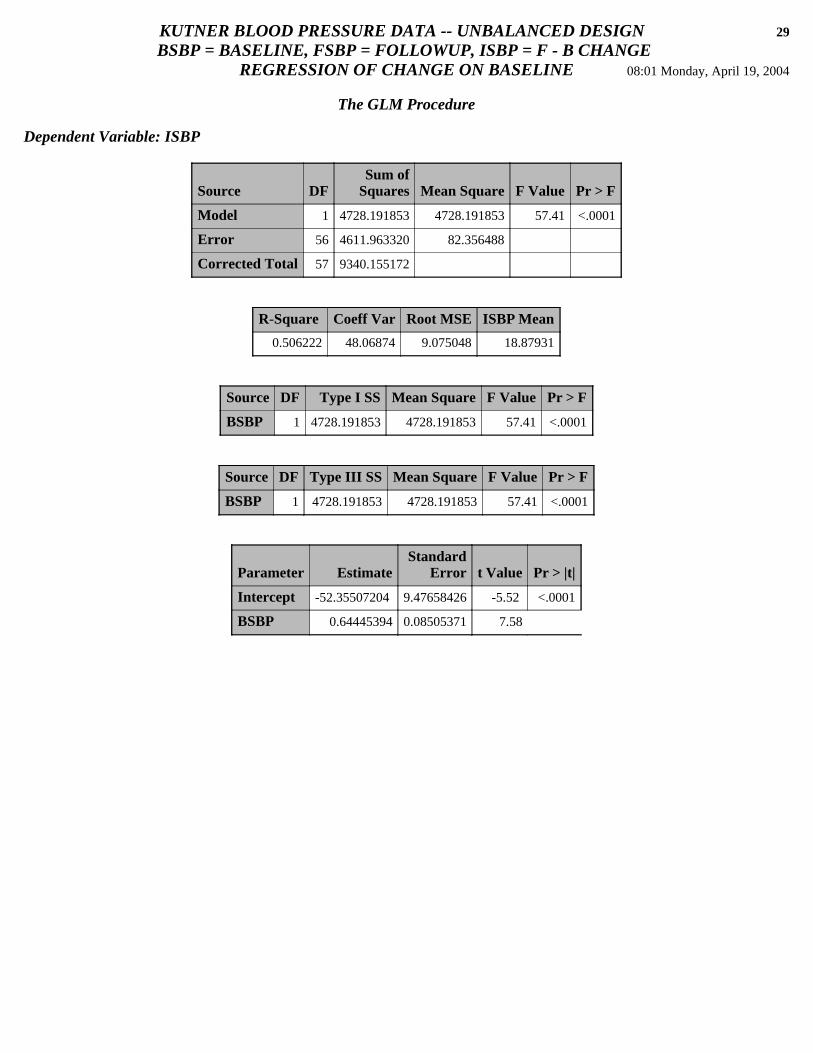
Dependent Variable: ISBP
Source DFSum of
Squares Mean Square F Value Pr > F
Model 1 4728.191853 4728.191853 57.41 <.0001
Error 56 4611.963320 82.356488
Corrected Total 57 9340.155172
R-Square Coeff Var Root MSE ISBP Mean
0.506222 48.06874 9.075048 18.87931
Source DF Type I SS Mean Square F Value Pr > F
BSBP 1 4728.191853 4728.191853 57.41 <.0001
Source DF Type III SS Mean Square F Value Pr > F
BSBP 1 4728.191853 4728.191853 57.41 <.0001
Parameter EstimateStandard
Error t Value Pr > |t|
Intercept -52.35507204 9.47658426 -5.52 <.0001
BSBP 0.64445394 0.08505371 7.58 <.0001

KUTNER BLOOD PRESSURE DATA -- UNBALANCED DESIGN 30
BSBP = BASELINE, FSBP = FOLLOWUP, ISBP = F - B CHANGEDRUG BY DISEASE EFFECTS ON CHANGE IN B.P., UNADJUSTED
08:01 Monday, April 19, 2004
The GLM Procedure
Class Level Information
Class Levels Values
DRUG 4 1 2 3 4
DISEASE 3 1 2 3
Number of observations 58
KUTNER BLOOD PRESSURE DATA -- UNBALANCED DESIGN 31
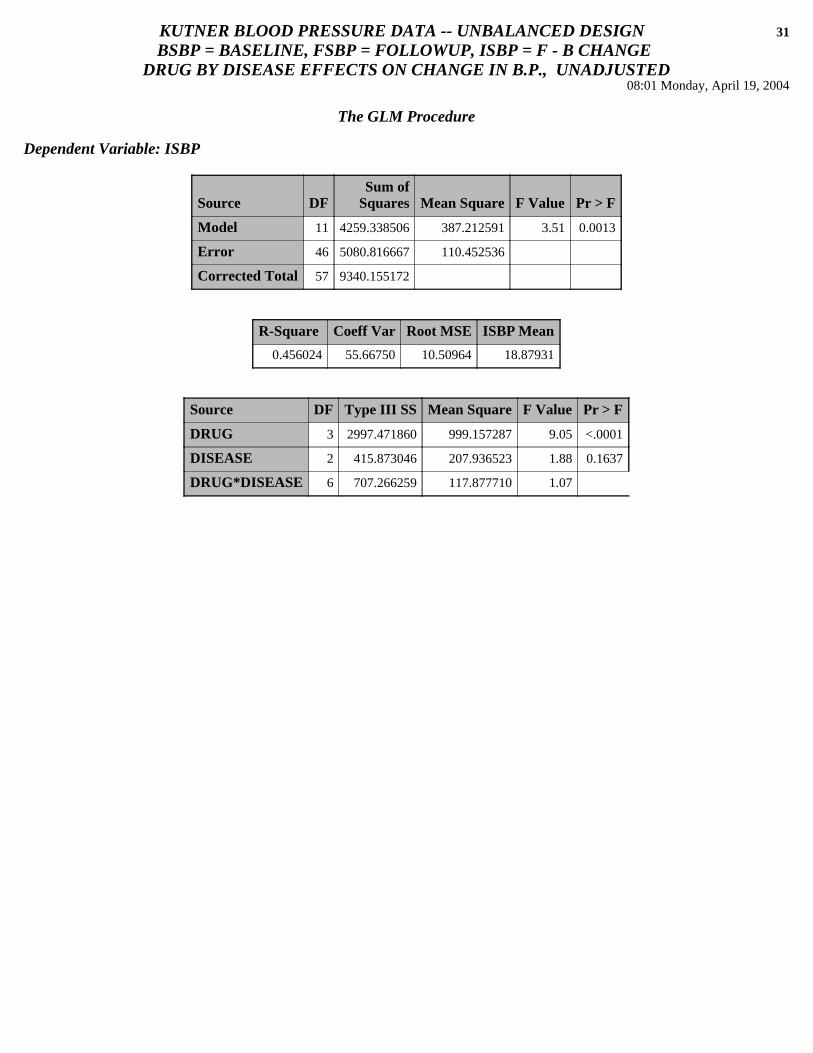
BSBP = BASELINE, FSBP = FOLLOWUP, ISBP = F - B CHANGEDRUG BY DISEASE EFFECTS ON CHANGE IN B.P., UNADJUSTED
08:01 Monday, April 19, 2004
The GLM Procedure
Dependent Variable: ISBP
Source DFSum of
Squares Mean Square F Value Pr > F
Model 11 4259.338506 387.212591 3.51 0.0013
Error 46 5080.816667 110.452536
Corrected Total 57 9340.155172
R-Square Coeff Var Root MSE ISBP Mean
0.456024 55.66750 10.50964 18.87931
Source DF Type III SS Mean Square F Value Pr > F
DRUG 3 2997.471860 999.157287 9.05 <.0001
DISEASE 2 415.873046 207.936523 1.88 0.1637
DRUG*DISEASE 6 707.266259 117.877710 1.07 0.3958
KUTNER BLOOD PRESSURE DATA -- UNBALANCED DESIGN 32
BSBP = BASELINE, FSBP = FOLLOWUP, ISBP = F - B CHANGEDRUG BY DISEASE EFFECTS ON CHANGE IN B.P., UNADJUSTED
08:01 Monday, April 19, 2004
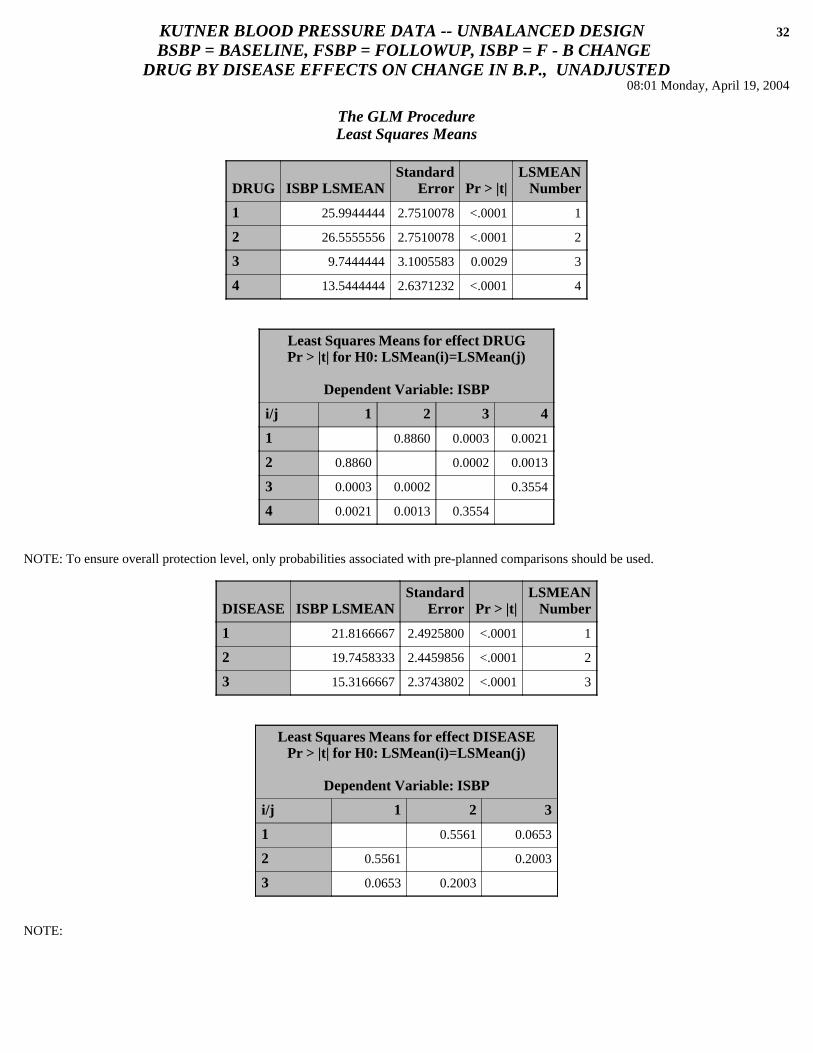
The GLM ProcedureLeast Squares Means
DRUG ISBP LSMEANStandard
Error Pr > |t|LSMEAN
Number
1 25.9944444 2.7510078 <.0001 1
2 26.5555556 2.7510078 <.0001 2
3 9.7444444 3.1005583 0.0029 3
4 13.5444444 2.6371232 <.0001 4
Least Squares Means for effect DRUGPr > |t| for H0: LSMean(i)=LSMean(j)
Dependent Variable: ISBP
i/j 1 2 3 4
1 0.8860 0.0003 0.0021
2 0.8860 0.0002 0.0013
3 0.0003 0.0002 0.3554
4 0.0021 0.0013 0.3554
NOTE: To ensure overall protection level, only probabilities associated with pre-planned comparisons should be used.
DISEASE ISBP LSMEANStandard
Error Pr > |t|LSMEAN
Number
1 21.8166667 2.4925800 <.0001 1
2 19.7458333 2.4459856 <.0001 2
3 15.3166667 2.3743802 <.0001 3
Least Squares Means for effect DISEASEPr > |t| for H0: LSMean(i)=LSMean(j)
Dependent Variable: ISBP
i/j 1 2 3
1 0.5561 0.0653
2 0.5561 0.2003
3 0.0653 0.2003
NOTE: To ensure overall protection level, only probabilities associated with pre-planned comparisons should be used.

KUTNER BLOOD PRESSURE DATA -- UNBALANCED DESIGN 33
BSBP = BASELINE, FSBP = FOLLOWUP, ISBP = F - B CHANGEDRUG BY DISEASE EFFECTS ON CHANGE IN B.P., UNADJUSTED
08:01 Monday, April 19, 2004
The GLM ProcedureLeast Squares Means
DRUG DISEASE ISBP LSMEANStandard
Error Pr > |t|LSMEAN
Number
1 1 29.3333333 4.2905426 <.0001 1
1 2 28.2500000 5.2548201 <.0001 2
1 3 20.4000000 4.7000540 <.0001 3
2 1 28.0000000 4.7000540 <.0001 4
2 2 33.5000000 5.2548201 <.0001 5
2 3 18.1666667 4.2905426 0.0001 6
3 1 16.3333333 6.0677436 0.0099 7
3 2 4.4000000 4.7000540 0.3541 8
3 3 8.5000000 5.2548201 0.1126 9
4 1 13.6000000 4.7000540 0.0058 10
4 2 12.8333333 4.2905426 0.0045 11
4 3 14.2000000 4.7000540 0.0041 12
Least Squares Means for effect DRUG*DISEASEPr > |t| for H0: LSMean(i)=LSMean(j)
Dependent Variable: ISBP
i/j 1 2 3 4 5 6 7 8 9 10 11 12
1 0.8738 0.1671 0.8350 0.5421 0.0722 0.0869 0.0003 0.0036 0.0172 0.0092 0.0216
2 0.8738 0.2713 0.9719 0.4835 0.1440 0.1445 0.0015 0.0108 0.0433 0.0278 0.0522
3 0.1671 0.2713 0.2588 0.0696 0.7272 0.5988 0.0201 0.0982 0.3116 0.2405 0.3558
4 0.8350 0.9719 0.2588 0.4393 0.1292 0.1353 0.0009 0.0081 0.0355 0.0213 0.0435
5 0.5421 0.4835 0.0696 0.4393 0.0286 0.0378 0.0002 0.0016 0.0070 0.0038 0.0088
6 0.0722 0.1440 0.7272 0.1292 0.0286 0.8062 0.0358 0.1609 0.4766 0.3840 0.5362
7 0.0869 0.1445 0.5988 0.1353 0.0378 0.8062 0.1268 0.3342 0.7234 0.6399 0.7823
8 0.0003 0.0015 0.0201 0.0009 0.0002 0.0358 0.1268 0.5637 0.1730 0.1917 0.1472
9 0.0036 0.0108 0.0982 0.0081 0.0016 0.1609 0.3342 0.5637 0.4731 0.5261 0.4230
10 0.0172 0.0433 0.3116 0.0355 0.0070 0.4766 0.7234 0.1730 0.4731 0.9046 0.9285
11 0.0092 0.0278 0.2405 0.0213 0.0038 0.3840 0.6399 0.1917 0.5261 0.9046 0.8309
12 0.0216 0.0522 0.3558 0.0435 0.0088 0.5362 0.7823 0.1472 0.4230 0.9285 0.8309
NOTE: To ensure overall protection level, only probabilities associated with pre-planned comparisons should be used.

KUTNER BLOOD PRESSURE DATA -- UNBALANCED DESIGN 34
BSBP = BASELINE, FSBP = FOLLOWUP, ISBP = F - B CHANGEDRUG BY DISEASE EFFECTS ON CHANGE IN B.P., ADJUSTED FOR BSBP
08:01 Monday, April 19, 2004
The GLM Procedure
Class Level Information
Class Levels Values
DRUG 4 1 2 3 4
DISEASE 3 1 2 3
Number of observations 58

KUTNER BLOOD PRESSURE DATA -- UNBALANCED DESIGN 35
BSBP = BASELINE, FSBP = FOLLOWUP, ISBP = F - B CHANGEDRUG BY DISEASE EFFECTS ON CHANGE IN B.P., ADJUSTED FOR BSBP
08:01 Monday, April 19, 2004
The GLM Procedure
Dependent Variable: ISBP
Source DFSum of
Squares Mean Square F Value Pr > F
Model 12 6575.030151 547.919179 8.92 <.0001
Error 45 2765.125021 61.447223
Corrected Total 57 9340.155172
R-Square Coeff Var Root MSE ISBP Mean
0.703953 41.52073 7.838828 18.87931
Source DF Type III SS Mean Square F Value Pr > F
DRUG 3 1004.319714 334.773238 5.45 0.0028
DISEASE 2 77.440949 38.720474 0.63 0.5371
DRUG*DISEASE 6 480.017598 80.002933 1.30 0.2759
BSBP 1 2315.691646 2315.691646 37.69 <.0001
Parameter EstimateStandard
Error t Value Pr > |t|
Intercept -44.08633346 B 10.12112729 -4.36 <.0001
DRUG 1 -0.53427757 B 5.07762456 -0.11 0.9167
DRUG 2 3.81185569 B 4.74671300 0.80 0.4262
DRUG 3 -11.27319523 B 5.33623888 -2.11 0.0402
DRUG 4 0.00000000 B . . .
DISEASE 1 -3.38659762 B 4.97844733 -0.68 0.4998
DISEASE 2 -1.52147765 B 4.74671300 -0.32 0.7500
DISEASE 3 0.00000000 B . . .
DRUG*DISEASE 1 1 6.41776239 B 6.88237665 0.93 0.3561
DRUG*DISEASE 1 2 3.71120124 B 7.14046097 0.52 0.6058
DRUG*DISEASE 1 3 0.00000000 B . . .
DRUG*DISEASE 2 1 1.76391853 B 7.00741651 0.25 0.8024
DRUG*DISEASE 2 2 3.30885035 B 7.27268983 0.45 0.6513
DRUG*DISEASE 2 3 0.00000000 B . . .
DRUG*DISEASE 3 1 14.89669169 B 7.84420858 1.90 0.0640
DRUG*DISEASE 3 2 -2.11408942 B 7.08463646 -0.30 0.7668
DRUG*DISEASE 3 3 0.00000000 B . . .

KUTNER BLOOD PRESSURE DATA -- UNBALANCED DESIGN 36
BSBP = BASELINE, FSBP = FOLLOWUP, ISBP = F - B CHANGEDRUG BY DISEASE EFFECTS ON CHANGE IN B.P., ADJUSTED FOR BSBP
08:01 Monday, April 19, 2004
The GLM ProcedureDependent Variable: ISBP
Parameter EstimateStandard
Error t Value Pr > |t|
DRUG*DISEASE 4 1 0.00000000 B . . .
DRUG*DISEASE 4 2 0.00000000 B . . .
DRUG*DISEASE 4 3 0.00000000 B . . .
BSBP 0.58054117 0.09456791 6.14 <.0001
NOTE: The X'X matrix has been found to be singular, and a generalized inverse was used to solve the normal equations. Terms whoseestimates are followed by the letter 'B' are not uniquely estimable.

KUTNER BLOOD PRESSURE DATA -- UNBALANCED DESIGN 37
BSBP = BASELINE, FSBP = FOLLOWUP, ISBP = F - B CHANGEDRUG BY DISEASE EFFECTS ON CHANGE IN B.P., ADJUSTED FOR BSBP
08:01 Monday, April 19, 2004
The GLM ProcedureLeast Squares Means
DRUG ISBP LSMEANStandard
Error Pr > |t|LSMEAN
Number
1 21.2895030 2.1903578 <.0001 1
2 23.9502380 2.0953245 <.0001 2
3 11.4351316 2.3289553 <.0001 3
4 18.4474594 2.1229207 <.0001 4
Least Squares Means for effect DRUGPr > |t| for H0: LSMean(i)=LSMean(j)
Dependent Variable: ISBP
i/j 1 2 3 4
1 0.3673 0.0042 0.3857
2 0.3673 0.0003 0.0821
3 0.0042 0.0003 0.0276
4 0.3857 0.0821 0.0276
NOTE: To ensure overall protection level, only probabilities associated with pre-planned comparisons should be used.
DISEASE ISBP LSMEANStandard
Error Pr > |t|LSMEAN
Number
1 20.4675757 1.8720848 <.0001 1
2 17.7895931 1.8520092 <.0001 2
3 18.0845802 1.8274747 <.0001 3
Least Squares Means for effect DISEASEPr > |t| for H0: LSMean(i)=LSMean(j)
Dependent Variable: ISBP
i/j 1 2 3
1 0.3097 0.3740
2 0.3097 0.9121
3 0.3740 0.9121
NOTE: To ensure overall protection level, only probabilities associated with pre-planned comparisons should be used.
KUTNER BLOOD PRESSURE DATA -- UNBALANCED DESIGN 38
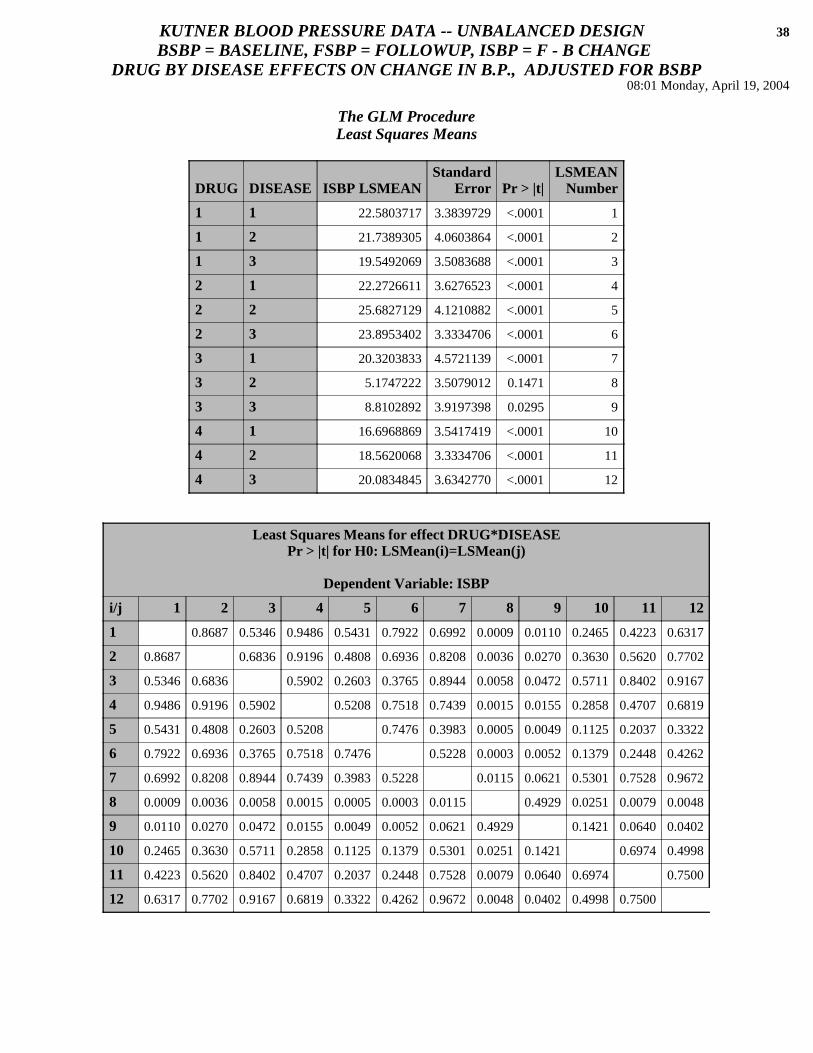
BSBP = BASELINE, FSBP = FOLLOWUP, ISBP = F - B CHANGEDRUG BY DISEASE EFFECTS ON CHANGE IN B.P., ADJUSTED FOR BSBP
08:01 Monday, April 19, 2004
The GLM ProcedureLeast Squares Means
DRUG DISEASE ISBP LSMEANStandard
Error Pr > |t|LSMEAN
Number
1 1 22.5803717 3.3839729 <.0001 1
1 2 21.7389305 4.0603864 <.0001 2
1 3 19.5492069 3.5083688 <.0001 3
2 1 22.2726611 3.6276523 <.0001 4
2 2 25.6827129 4.1210882 <.0001 5
2 3 23.8953402 3.3334706 <.0001 6
3 1 20.3203833 4.5721139 <.0001 7
3 2 5.1747222 3.5079012 0.1471 8
3 3 8.8102892 3.9197398 0.0295 9
4 1 16.6968869 3.5417419 <.0001 10
4 2 18.5620068 3.3334706 <.0001 11
4 3 20.0834845 3.6342770 <.0001 12
Least Squares Means for effect DRUG*DISEASEPr > |t| for H0: LSMean(i)=LSMean(j)
Dependent Variable: ISBP
i/j 1 2 3 4 5 6 7 8 9 10 11 12
1 0.8687 0.5346 0.9486 0.5431 0.7922 0.6992 0.0009 0.0110 0.2465 0.4223 0.6317
2 0.8687 0.6836 0.9196 0.4808 0.6936 0.8208 0.0036 0.0270 0.3630 0.5620 0.7702
3 0.5346 0.6836 0.5902 0.2603 0.3765 0.8944 0.0058 0.0472 0.5711 0.8402 0.9167
4 0.9486 0.9196 0.5902 0.5208 0.7518 0.7439 0.0015 0.0155 0.2858 0.4707 0.6819
5 0.5431 0.4808 0.2603 0.5208 0.7476 0.3983 0.0005 0.0049 0.1125 0.2037 0.3322
6 0.7922 0.6936 0.3765 0.7518 0.7476 0.5228 0.0003 0.0052 0.1379 0.2448 0.4262
7 0.6992 0.8208 0.8944 0.7439 0.3983 0.5228 0.0115 0.0621 0.5301 0.7528 0.9672
8 0.0009 0.0036 0.0058 0.0015 0.0005 0.0003 0.0115 0.4929 0.0251 0.0079 0.0048
9 0.0110 0.0270 0.0472 0.0155 0.0049 0.0052 0.0621 0.4929 0.1421 0.0640 0.0402
10 0.2465 0.3630 0.5711 0.2858 0.1125 0.1379 0.5301 0.0251 0.1421 0.6974 0.4998
11 0.4223 0.5620 0.8402 0.4707 0.2037 0.2448 0.7528 0.0079 0.0640 0.6974 0.7500
12 0.6317 0.7702 0.9167 0.6819 0.3322 0.4262 0.9672 0.0048 0.0402 0.4998 0.7500
NOTE: To ensure overall protection level, only probabilities associated with pre-planned comparisons should be used.

KUTNER BLOOD PRESSURE DATA -- UNBALANCED DESIGN 39
BSBP = BASELINE, FSBP = FOLLOWUP, ISBP = F - B CHANGEASSESSMENT OF DRUG BY BSBP INTERACTION -- TEST OF HOMOGENEITY OF SLOPES
08:01 Monday, April 19, 2004
The GLM Procedure
Class LevelInformation
Class Levels Values
DRUG 4 1 2 3 4
Number of observations 58

KUTNER BLOOD PRESSURE DATA -- UNBALANCED DESIGN 40
BSBP = BASELINE, FSBP = FOLLOWUP, ISBP = F - B CHANGEASSESSMENT OF DRUG BY BSBP INTERACTION -- TEST OF HOMOGENEITY OF SLOPES
08:01 Monday, April 19, 2004
The GLM Procedure
Dependent Variable: FSBP
Source DFSum of
Squares Mean Square F Value Pr > F
Model 7 32453.95927 4636.27990 78.74 <.0001
Error 50 2944.10969 58.88219
Corrected Total 57 35398.06897
R-Square Coeff Var Root MSE FSBP Mean
0.916829 5.929409 7.673473 129.4138
Source DF Type III SS Mean Square F Value Pr > F
DRUG 3 271.33816 90.44605 1.54 0.2167
BSBP 1 18288.60540 18288.60540 310.60 <.0001
BSBP*DRUG 3 341.60897 113.86966 1.93 0.1361
Parameter EstimateStandard
Error t Value Pr > |t|
Intercept -23.34840426 B 16.58997516 -1.41 0.1655
DRUG 1 -54.31126788 B 26.20952684 -2.07 0.0434
DRUG 2 -18.58725894 B 22.13291416 -0.84 0.4050
DRUG 3 -6.17007090 B 29.73375116 -0.21 0.8365
DRUG 4 0.00000000 B . . .
BSBP 1.36125887 B 0.16155576 8.43 <.0001
BSBP*DRUG 1 0.51283950 B 0.23464594 2.19 0.0336
BSBP*DRUG 2 0.23335626 B 0.20607458 1.13 0.2629
BSBP*DRUG 3 -0.00719433 B 0.27892730 -0.03 0.9795
BSBP*DRUG 4 0.00000000 B . . .
NOTE: The X'X matrix has been found to be singular, and a generalized inverse was used to solve the normal equations. Terms whoseestimates are followed by the letter 'B' are not uniquely estimable.

KUTNER BLOOD PRESSURE DATA -- UNBALANCED DESIGN 41
BSBP = BASELINE, FSBP = FOLLOWUP, ISBP = F - B CHANGEASSESSMENT OF DRUG EFFECT WITH NESTED SLOPE MODEL
08:01 Monday, April 19, 2004
The GLM Procedure
Class LevelInformation
Class Levels Values
DRUG 4 1 2 3 4
Number of observations 58

KUTNER BLOOD PRESSURE DATA -- UNBALANCED DESIGN 42
BSBP = BASELINE, FSBP = FOLLOWUP, ISBP = F - B CHANGEASSESSMENT OF DRUG EFFECT WITH NESTED SLOPE MODEL
08:01 Monday, April 19, 2004
The GLM Procedure
Dependent Variable: FSBP
Source DFSum of
Squares Mean Square F Value Pr > F
Model 7 32453.95927 4636.27990 78.74 <.0001
Error 50 2944.10969 58.88219
Corrected Total 57 35398.06897
R-Square Coeff Var Root MSE FSBP Mean
0.916829 5.929409 7.673473 129.4138
Source DF Type III SS Mean Square F Value Pr > F
DRUG 3 271.33816 90.44605 1.54 0.2167
BSBP(DRUG) 4 22558.49031 5639.62258 95.78 <.0001
Parameter EstimateStandard
Error t Value Pr > |t|
Intercept -23.34840426 B 16.58997516 -1.41 0.1655
DRUG 1 -54.31126788 B 26.20952684 -2.07 0.0434
DRUG 2 -18.58725894 B 22.13291416 -0.84 0.4050
DRUG 3 -6.17007090 B 29.73375116 -0.21 0.8365
DRUG 4 0.00000000 B . . .
BSBP(DRUG) 1 1.87409836 0.17017184 11.01 <.0001
BSBP(DRUG) 2 1.59461513 0.12793150 12.46 <.0001
BSBP(DRUG) 3 1.35406454 0.22737673 5.96 <.0001
BSBP(DRUG) 4 1.36125887 0.16155576 8.43 <.0001
NOTE: The X'X matrix has been found to be singular, and a generalized inverse was used to solve the normal equations. Terms whoseestimates are followed by the letter 'B' are not uniquely estimable.
KUTNER BLOOD PRESSURE DATA -- UNBALANCED DESIGN 43
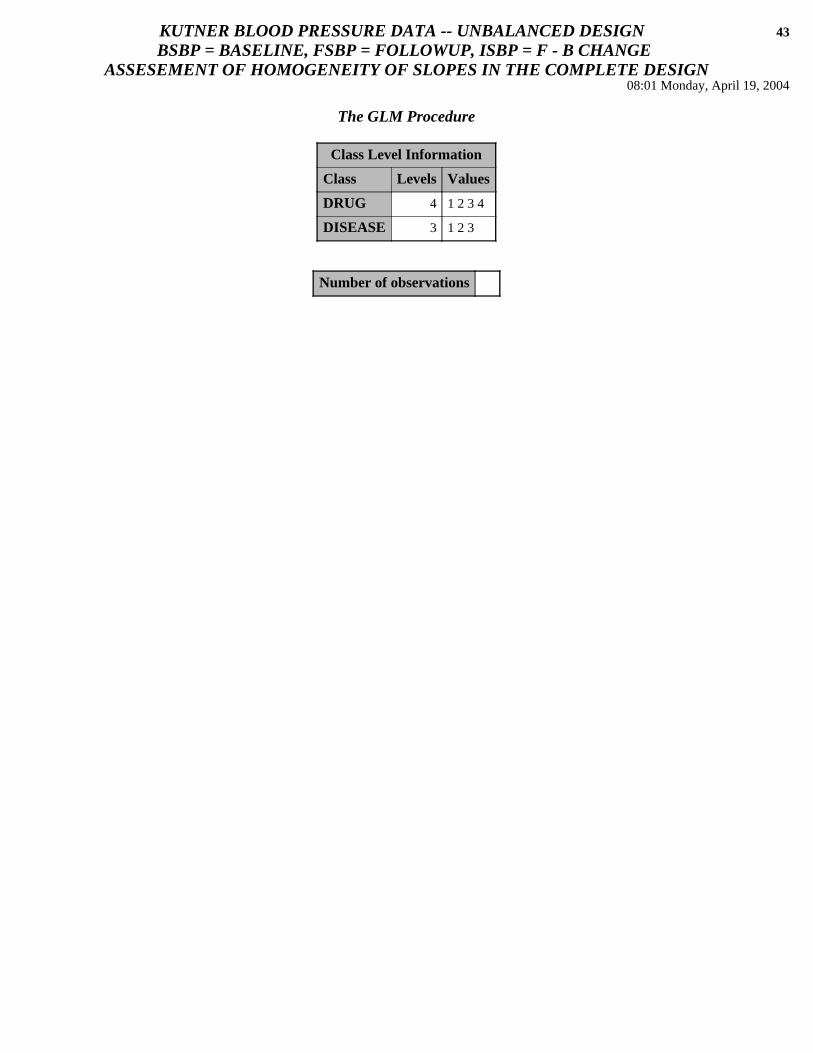
BSBP = BASELINE, FSBP = FOLLOWUP, ISBP = F - B CHANGEASSESEMENT OF HOMOGENEITY OF SLOPES IN THE COMPLETE DESIGN
08:01 Monday, April 19, 2004
The GLM Procedure
Class Level Information
Class Levels Values
DRUG 4 1 2 3 4
DISEASE 3 1 2 3
Number of observations 58

KUTNER BLOOD PRESSURE DATA -- UNBALANCED DESIGN 44
BSBP = BASELINE, FSBP = FOLLOWUP, ISBP = F - B CHANGEASSESEMENT OF HOMOGENEITY OF SLOPES IN THE COMPLETE DESIGN
08:01 Monday, April 19, 2004
The GLM Procedure
Dependent Variable: FSBP
Source DFSum of
Squares Mean Square F Value Pr > F
Model 23 33106.78967 1439.42564 21.36 <.0001
Error 34 2291.27930 67.39057
Corrected Total 57 35398.06897
R-Square Coeff Var Root MSE FSBP Mean
0.935271 6.343355 8.209176 129.4138
Source DF Type III SS Mean Square F Value Pr > F
DRUG 3 161.62330 53.87443 0.80 0.5028
DISEASE 2 162.03311 81.01655 1.20 0.3130
DRUG*DISEASE 6 93.94756 15.65793 0.23 0.9631
BSBP 1 11489.86351 11489.86351 170.50 <.0001
BSBP*DRUG*DISEASE 11 473.84572 43.07688 0.64 0.7827

KUTNER BLOOD PRESSURE DATA -- UNBALANCED DESIGN 45
BSBP = BASELINE, FSBP = FOLLOWUP, ISBP = F - B CHANGEMODEL WITH SEPARATE SLOPES WITHIN CELLS
08:01 Monday, April 19, 2004
The GLM Procedure
Class Level Information
Class Levels Values
DRUG 4 1 2 3 4
DISEASE 3 1 2 3
Number of observations 58

KUTNER BLOOD PRESSURE DATA -- UNBALANCED DESIGN 46
BSBP = BASELINE, FSBP = FOLLOWUP, ISBP = F - B CHANGEMODEL WITH SEPARATE SLOPES WITHIN CELLS
08:01 Monday, April 19, 2004
The GLM Procedure
Dependent Variable: FSBP
Source DFSum of
Squares Mean Square F Value Pr > F
Model 23 33106.78967 1439.42564 21.36 <.0001
Error 34 2291.27930 67.39057
Corrected Total 57 35398.06897
R-Square Coeff Var Root MSE FSBP Mean
0.935271 6.343355 8.209176 129.4138
Source DF Type III SS Mean Square F Value Pr > F
DRUG 3 161.62330 53.87443 0.80 0.5028
DISEASE 2 162.03311 81.01655 1.20 0.3130
DRUG*DISEASE 6 93.94756 15.65793 0.23 0.9631
BSBP(DRUG*DISEASE) 12 17638.15403 1469.84617 21.81 <.0001
Parameter EstimateStandard
Error t Value Pr > |t|
Intercept -34.40673828 B 29.02948761 -1.19 0.2441
DRUG 1 -66.66088762 B 48.75036454 -1.37 0.1805
DRUG 2 -12.98110670 B 38.15047574 -0.34 0.7358
DRUG 3 -21.98090217 B 56.12558147 -0.39 0.6978
DRUG 4 0.00000000 B . . .
DISEASE 1 0.17891570 B 52.30450371 0.00 0.9973
DISEASE 2 22.56005320 B 39.51441177 0.57 0.5718
DISEASE 3 0.00000000 B . . .
DRUG*DISEASE 1 1 30.89778332 B 73.17430616 0.42 0.6755
DRUG*DISEASE 1 2 31.23429580 B 89.12760257 0.35 0.7282
DRUG*DISEASE 1 3 0.00000000 B . . .
DRUG*DISEASE 2 1 -13.90158646 B 70.69508275 -0.20 0.8453
DRUG*DISEASE 2 2 76.48940794 B 86.16440140 0.89 0.3809
DRUG*DISEASE 2 3 0.00000000 B . . .
DRUG*DISEASE 3 1 -5.67575179 B 94.80203246 -0.06 0.9526
DRUG*DISEASE 3 2 0.21386327 B 73.69675468 0.00 0.9977
DRUG*DISEASE 3 3 0.00000000 B . . .

KUTNER BLOOD PRESSURE DATA -- UNBALANCED DESIGN 47
BSBP = BASELINE, FSBP = FOLLOWUP, ISBP = F - B CHANGEMODEL WITH SEPARATE SLOPES WITHIN CELLS
08:01 Monday, April 19, 2004
The GLM ProcedureDependent Variable: FSBP
Parameter EstimateStandard
Error t Value Pr > |t|
DRUG*DISEASE 4 1 0.00000000 B . . .
DRUG*DISEASE 4 2 0.00000000 B . . .
DRUG*DISEASE 4 3 0.00000000 B . . .
BSBP(DRUG*DISEASE) 1 1 1.81302259 0.26820594 6.76 <.0001
BSBP(DRUG*DISEASE) 1 2 1.62031439 0.57092203 2.84 0.0076
BSBP(DRUG*DISEASE) 1 3 2.08453237 0.34814660 5.99 <.0001
BSBP(DRUG*DISEASE) 2 1 1.74012056 0.33592294 5.18 <.0001
BSBP(DRUG*DISEASE) 2 2 0.85353535 0.58340072 1.46 0.1526
BSBP(DRUG*DISEASE) 2 3 1.65120376 0.24363398 6.78 <.0001
BSBP(DRUG*DISEASE) 3 1 1.75451264 0.60409509 2.90 0.0064
BSBP(DRUG*DISEASE) 3 2 1.34811103 0.36041227 3.74 0.0007
BSBP(DRUG*DISEASE) 3 3 1.58988764 0.43508545 3.65 0.0009
BSBP(DRUG*DISEASE) 4 1 1.45463710 0.41211054 3.53 0.0012
BSBP(DRUG*DISEASE) 4 2 1.24516575 0.26421709 4.71 <.0001
BSBP(DRUG*DISEASE) 4 3 1.48413086 0.28681680 5.17 <.0001
NOTE: The X'X matrix has been found to be singular, and a generalized inverse was used to solve the normal equations. Terms whoseestimates are followed by the letter 'B' are not uniquely estimable.

KUTNER BLOOD PRESSURE DATA -- UNBALANCED DESIGN 48
BSBP = BASELINE, FSBP = FOLLOWUP, ISBP = F - B CHANGENO INTERACTION MODEL WITH COMMON SLOPE FOR BSBP
08:01 Monday, April 19, 2004
The GLM Procedure
Class Level Information
Class Levels Values
DRUG 4 1 2 3 4
DISEASE 3 1 2 3
Number of observations 58

KUTNER BLOOD PRESSURE DATA -- UNBALANCED DESIGN 49
BSBP = BASELINE, FSBP = FOLLOWUP, ISBP = F - B CHANGENO INTERACTION MODEL WITH COMMON SLOPE FOR BSBP
08:01 Monday, April 19, 2004
The GLM Procedure
Dependent Variable: FSBP
Source DFSum of
Squares Mean Square F Value Pr > F
Model 6 32152.92635 5358.82106 84.22 <.0001
Error 51 3245.14262 63.63025
Corrected Total 57 35398.06897
R-Square Coeff Var Root MSE FSBP Mean
0.908324 6.163838 7.976857 129.4138
Source DF Type III SS Mean Square F Value Pr > F
DRUG 3 1263.43283 421.14428 6.62 0.0007
DISEASE 2 40.57604 20.28802 0.32 0.7284
BSBP 1 19702.97372 19702.97372 309.65 <.0001

KUTNER BLOOD PRESSURE DATA -- UNBALANCED DESIGN 50
BSBP = BASELINE, FSBP = FOLLOWUP, ISBP = F - B CHANGENO INTERACTION MODEL WITH COMMON SLOPE FOR BSBP
08:01 Monday, April 19, 2004
The GLM ProcedureLeast Squares Means
DRUG FSBP LSMEANStandard
Error Pr > |t|LSMEAN
Number
1 131.910254 2.188607 <.0001 1
2 134.399091 2.089746 <.0001 2
3 120.822956 2.322981 <.0001 3
4 128.868373 2.140399 <.0001 4
Least Squares Means for effect DRUGPr > |t| for H0: LSMean(i)=LSMean(j)
Dependent Variable: FSBP
i/j 1 2 3 4
1 0.4022 0.0013 0.3525
2 0.4022 <.0001 0.0780
3 0.0013 <.0001 0.0123
4 0.3525 0.0780 0.0123
NOTE: To ensure overall protection level, only probabilities associated with pre-planned comparisons should be used.
DISEASE FSBP LSMEANStandard
Error Pr > |t|LSMEAN
Number
1 130.189924 1.868146 <.0001 1
2 128.220025 1.855264 <.0001 2
3 128.590556 1.856401 <.0001 3
Least Squares Means for effect DISEASEPr > |t| for H0: LSMean(i)=LSMean(j)
Dependent Variable: FSBP
i/j 1 2 3
1 0.4545 0.5524
2 0.4545 0.8904
3 0.5524 0.8904
NOTE: To ensure overall protection level, only probabilities associated with pre-planned comparisons should be used.