Kurt Lindbeck BWYV in southern NSW 2014-0805
12
BWYV in Southern NSW 5 August 2014 Kurt Lindbeck – NSW Department of Primary Industries, Wagga Wagga Joop van Leur – NSW Department of Primary Industries, Tamworth Mohammad Aftab – Department of Environment and Primary Industries, Horsham Angela Freeman – Department of Environment and Primary Industries, Horsham
-
Upload
extensionaus-field-crop-diseases -
Category
Science
-
view
242 -
download
0
Transcript of Kurt Lindbeck BWYV in southern NSW 2014-0805

BWYV in Southern NSW
5 August 2014
Kurt Lindbeck – NSW Department of Primary Industries, Wagga WaggaJoop van Leur – NSW Department of Primary Industries, TamworthMohammad Aftab – Department of Environment and Primary Industries, Horsham Angela Freeman – Department of Environment and Primary Industries, Horsham
Outline
Seasonal summary
What have we seen this season
What have we seen in the past
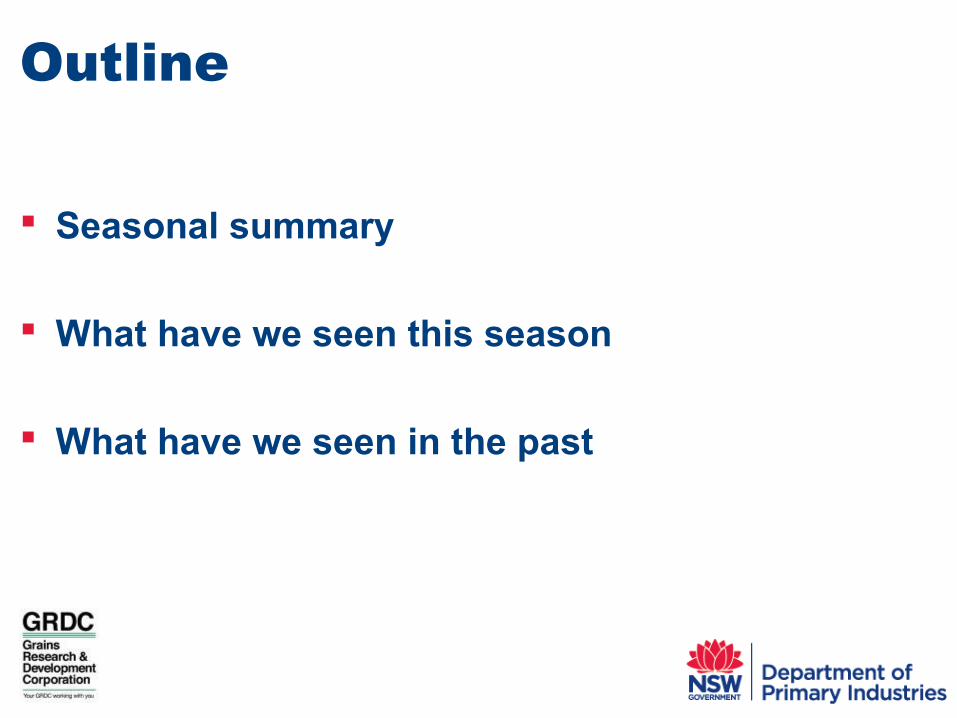
Seasonal summary
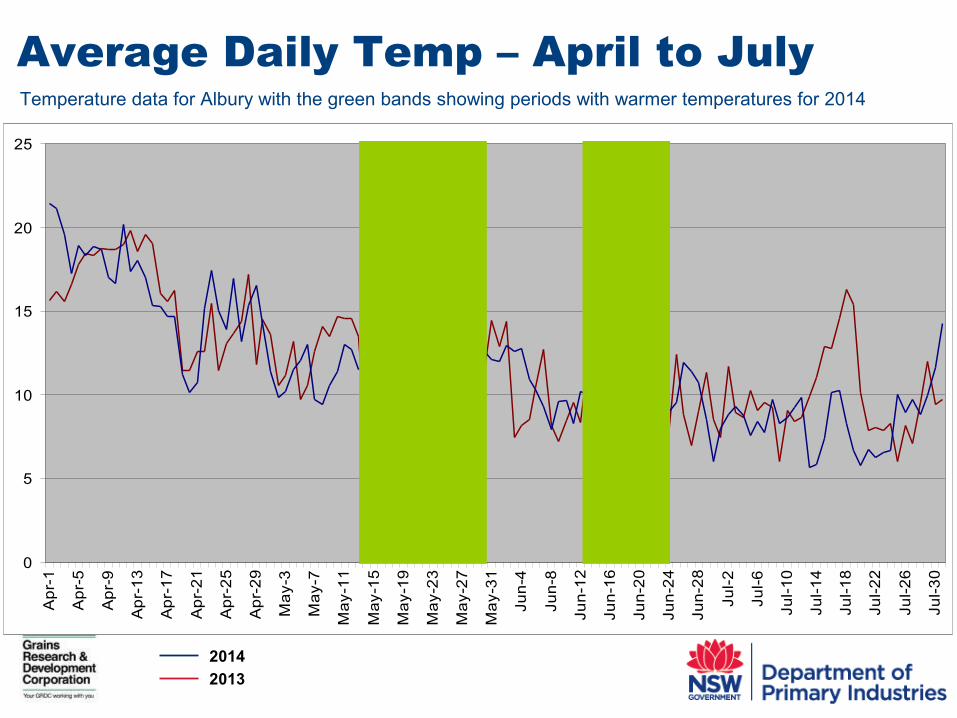
Good autumn rainfalls– High moisture– Mild Temperatures– Plant growth
Early break to the season– Canola sown on time– Emergence (mid April – mid May)
0
5
10
15
20
25
Ap
r-1
Ap
r-5
Ap
r-9
Ap
r-1
3
Ap
r-1
7
Ap
r-2
1
Ap
r-2
5
Ap
r-2
9
Ma
y-3
Ma
y-7
Ma
y-1
1
Ma
y-1
5
Ma
y-1
9
Ma
y-2
3
Ma
y-2
7
Ma
y-3
1
Ju
n-4
Ju
n-8
Ju
n-1
2
Ju
n-1
6
Ju
n-2
0
Ju
n-2
4
Ju
n-2
8
Ju
l-2
Ju
l-6
Ju
l-1
0
Ju
l-1
4
Ju
l-1
8
Ju
l-2
2
Ju
l-2
6
Ju
l-3
0
Average Daily Temp – April to July
2014
2013
Temperature data for Albury with the green bands showing periods with warmer temperatures for 2014
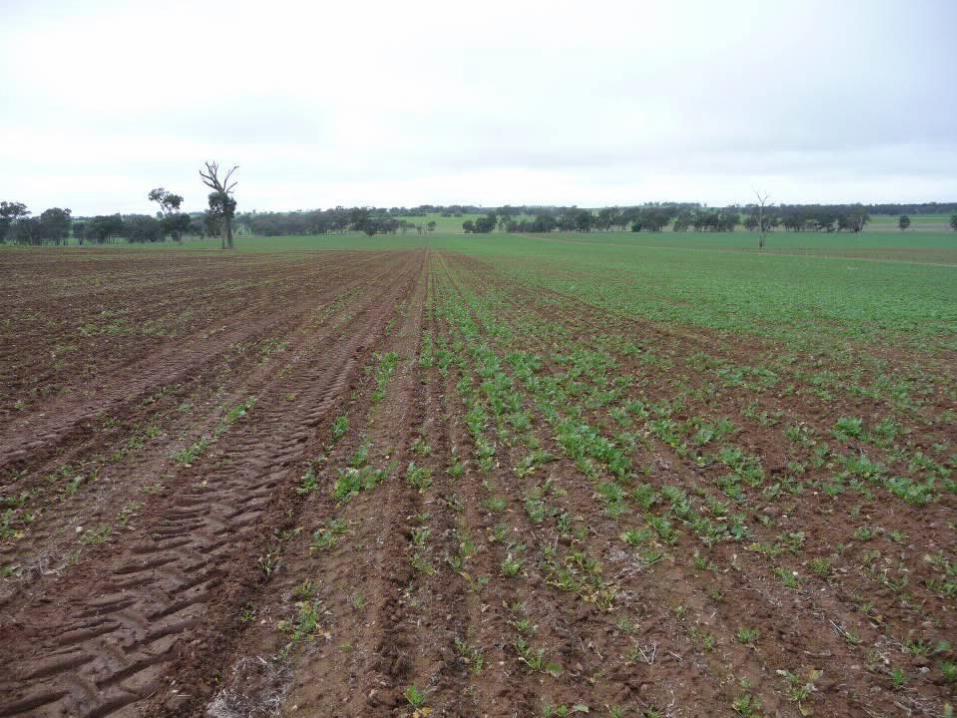
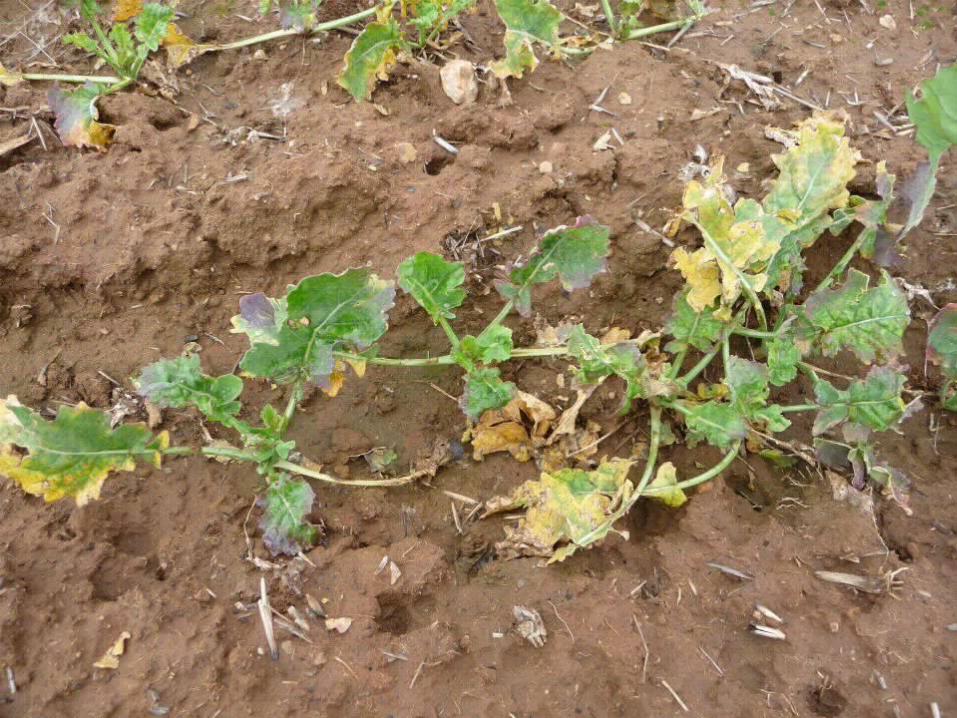
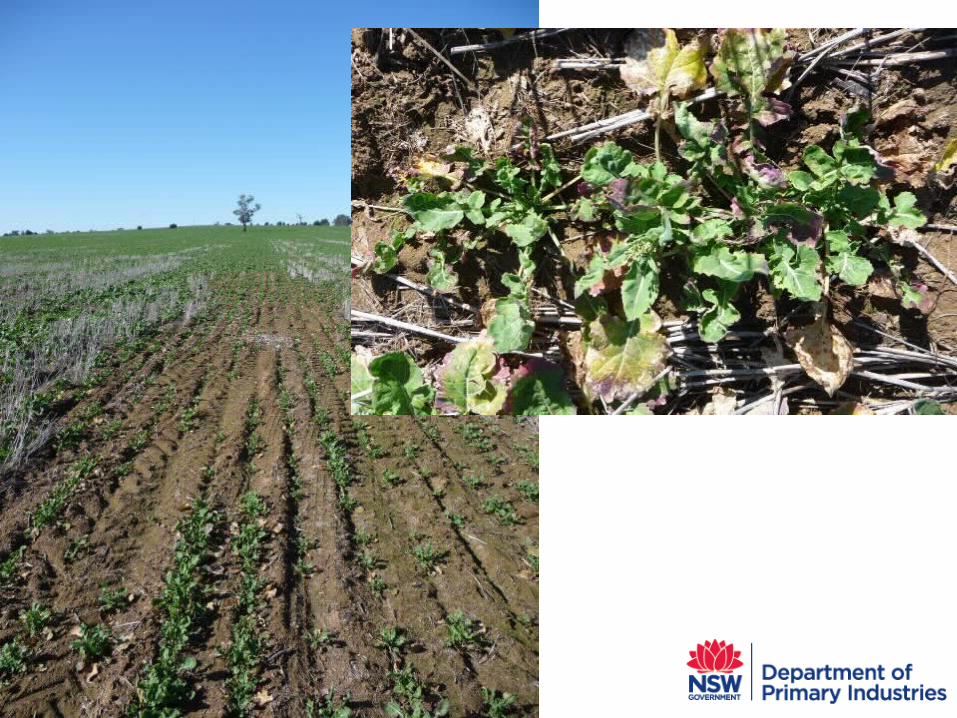
Current Situation Reports of damage in crops
– Henty to Ariah Park
No clear pattern to level of damage– Variety– Sowing date
Level of damage varies
– Large areas to small patches within crops
Measure of yield loss will be case by case

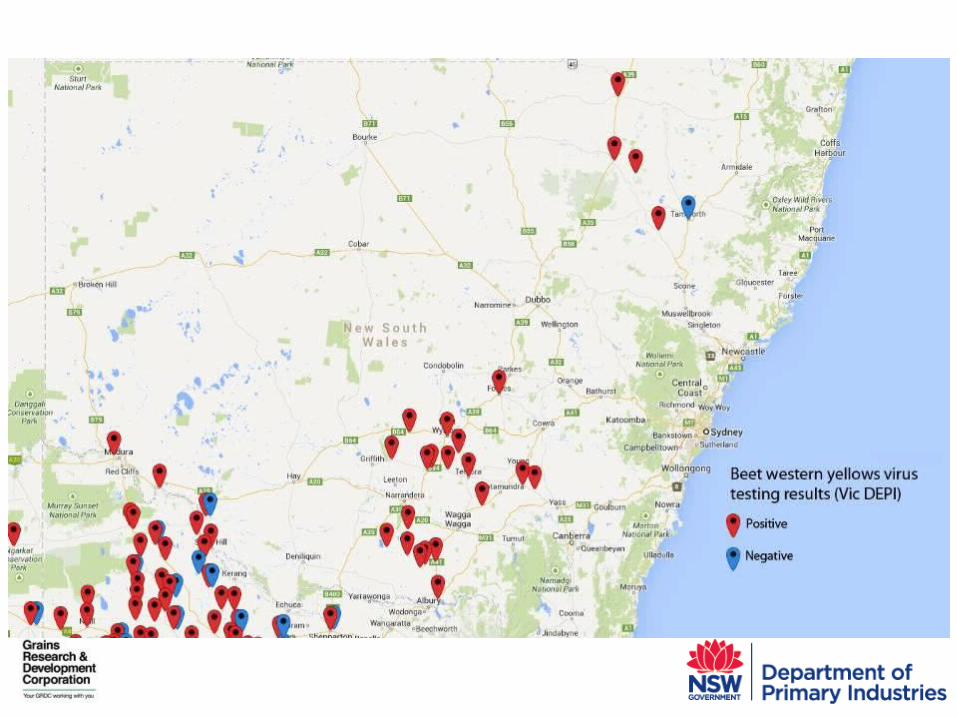
Past Outbreaks of BWYV in NSW
Widespread outbreaks in 2002– Crop survey Moree to Cobram– 2 – 83% incidence in crops
Reported early outbreaks in 2008– Some early patching in crops– No reported yield loss
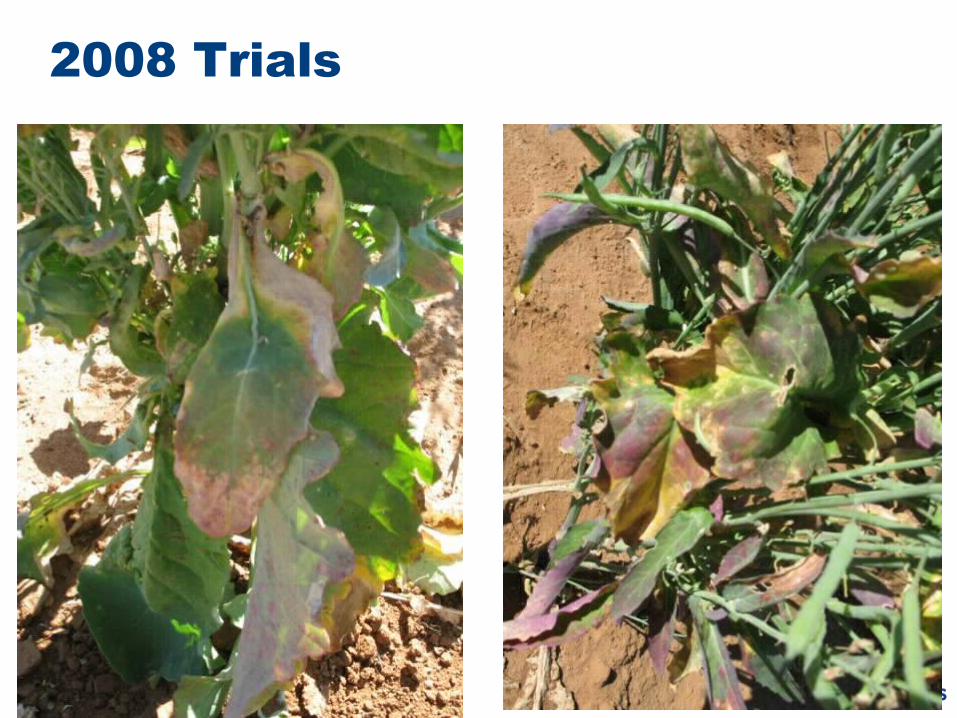
2008 Trials
BWYV Surveys
NVT Canola sites– Sampled for BWYV since 2008– Late podding– Coincide with blackleg assessments– 75 plants sampled per site
Provide a snapshot of final virus levels in crops