Kul-24.4200 Introduction to risk analysis of structures ( 5 cr) Lecturer: Prof. Pentti Kujala...
30
Kul-24.4200 Introduction to risk analysis of structures ( 5 cr) • Lecturer: Prof. Pentti Kujala • Assistant: Ms.Scien.(Eng.) Arsham Mazaheri/ Otto Sormunen (Eng. & Econ.) • Aim – Teach statistical methods in structural design useful for risk analysis – Goal: improve maritime safety through better understanding on critical loads • Passing & grades – Score = Exercises x 50 % + Presentations x 15 % + Exam x 35 % – You must have min 50 % of max total points of the exam AND the exercise/presentations to pass • 0 (fail): < 50 % of max total points • 1: 50- 59 % • 2: 60-69 % • 3: 70-79 % • 4: 80-89 % • 5: 90-100 % • Lectures/presentations on Mondays, 15-17 • Workload: Lectures 20 h, Independent reading: 30h, Exercise: 85 h • Presentations: Volunteer or MATLAB randon number generator will get you! All groups will present at least once.
-
Upload
emory-winfred-nichols -
Category
Documents
-
view
218 -
download
3
Transcript of Kul-24.4200 Introduction to risk analysis of structures ( 5 cr) Lecturer: Prof. Pentti Kujala...

Kul-24.4200 Introduction to risk analysis of structures ( 5 cr)• Lecturer: Prof. Pentti Kujala• Assistant: Ms.Scien.(Eng.) Arsham Mazaheri/ Otto Sormunen (Eng. & Econ.)• Aim
– Teach statistical methods in structural design useful for risk analysis– Goal: improve maritime safety through better understanding on critical loads
• Passing & grades– Score = Exercises x 50 % + Presentations x 15 % + Exam x 35 %– You must have min 50 % of max total points of the exam AND the exercise/presentations to pass
• 0 (fail): < 50 % of max total points • 1: 50- 59 %• 2: 60-69 %• 3: 70-79 %• 4: 80-89 %• 5: 90-100 %
• Lectures/presentations on Mondays, 15-17• Workload: Lectures 20 h, Independent reading: 30h, Exercise: 85 h• Presentations: Volunteer or MATLAB randon number generator will get you! All groups will
present at least once.

Content
• Preliminary timetable
• Introduction, assignment outline 8.9. • Distributions & distribution fitting 15.9.• Monte Carlo Simulation 22.9.• 1. presentations 29.9. (Assignment 1)• Extreme values 6.10.• Reliability calculation 13.10.• 2. presentations 20.10. (A2 & A3)• Risk analysis 27.10. (Last lecture)• 3. presentations 3.11. (A4)• Final presentations 24.11. (A5 & A6)• Exam 1.12.

Link with other courses:
• Kul-24.4230 Safety and Risks of Marine Traffic• More qualitative and general about risk & safety
• Kul-24.4200 Introduction to risk analysis of structures• Quantitative and specific

Why statistics?
• 1. Life outside textbook simplifications is stochastic– Wave loads of ship crossing the Atlantic– Accidents & resulting damages– Material fatigue– Etc…
• Modeled using statistics and applied mathematics
• 2. Practical calculations often time-consuming– Statistical models faster

Structure assignment alternative 1: Ship-tanker collision consequence analysis
Kul-24.4200 Introduction to Risk Analysis of Structures P
Pre-requisites
• Basic Matlab- skills is an absolute must for my part – Otherwise take ice load assignment
• Basic understanding of statistics – Motivation– Team working capability– Understanding and following written instructions
• Stuck? Don’t understand?– Ask assistants in person during reception hours
• See Noppa –portal• At other times e-mail

Learning objectives
• Building and applying a collision consequence estimation model• Turn basic MATLAB skills into routine MATLAB skills
– Important for thesis or working life
Learning the basics of • Modeling real-life with statistics
– Distribution and function fitting to large datasets– Random sampling from statistical distributions – Monte Carlo simulation
• Metamodelling– Logistic regression models– Sensitivity analysis– Evaluating how well a model actually describes reality
• Selected aspects of maritime risk modeling and risk mitigation (FSA etc.)– Tanker spill evaluation using different methods
• Personal skills– Reading scientific articles & theses– Presenting your results in writing & orally – Getting a perspective on thesis writing

Background
• GoF heavily trafficed w. difficult conditions• MarineTraffic.com
– AIS-data
• Collisions 2. most frequent accident type

Theory: Formal Safety Assesment
• FSA• Developed by the IMO
– Piper Alpha explosion 1976

Theory: FSA

FSA step 2 Risk AnalysisAccident Frequency Analysis
• Goerlandt & Kujala (2011): Collision candidates
FSA step 2 Risk AnalysisAccident Frequency Analysis
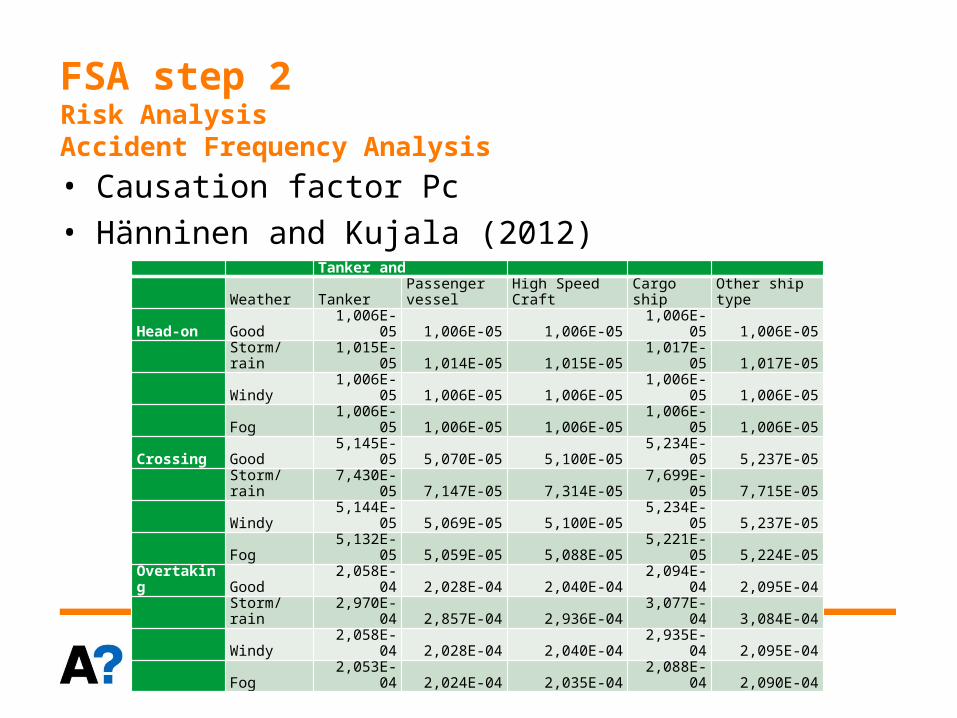
• Causation factor Pc• Hänninen and Kujala (2012)
Tanker and
Weather TankerPassenger vessel
High Speed Craft Cargo ship Other ship type
Head-on Good 1,006E-05 1,006E-05 1,006E-05 1,006E-05 1,006E-05
Storm/rain 1,015E-05 1,014E-05 1,015E-05 1,017E-05 1,017E-05
Windy 1,006E-05 1,006E-05 1,006E-05 1,006E-05 1,006E-05
Fog 1,006E-05 1,006E-05 1,006E-05 1,006E-05 1,006E-05
Crossing Good 5,145E-05 5,070E-05 5,100E-05 5,234E-05 5,237E-05
Storm/rain 7,430E-05 7,147E-05 7,314E-05 7,699E-05 7,715E-05
Windy 5,144E-05 5,069E-05 5,100E-05 5,234E-05 5,237E-05
Fog 5,132E-05 5,059E-05 5,088E-05 5,221E-05 5,224E-05
Overtaking Good 2,058E-04 2,028E-04 2,040E-04 2,094E-04 2,095E-04
Storm/rain 2,970E-04 2,857E-04 2,936E-04 3,077E-04 3,084E-04
Windy 2,058E-04 2,028E-04 2,040E-04 2,935E-04 2,095E-04
Fog 2,053E-04 2,024E-04 2,035E-04 2,088E-04 2,090E-04

FSA step 2 Risk AnalysisAccident Frequency Analysis
– Return period
– Gulf of Finland:• 1 every 45 y
– Most dangerous
location:• 1 every 1175 y
Map: © TraFi
license nr 1803/1024/2010.

Theory: FSA

FSA step 2Risk Analysis Accident Consequence Analysis• Spill estimation• 2 problems: • Accuracy vs general applicability
• Very general– e.g. IMO statistical models– Statistical analysis– Collision variables decoupled
from damage

FSA step 2Risk Analysis Accident Consequence Analysis• FEM- based• More accurate, very specific
– Usually only a few angles and ship sizes
0 20 40 60 80 100 120
0
5
10
15
20
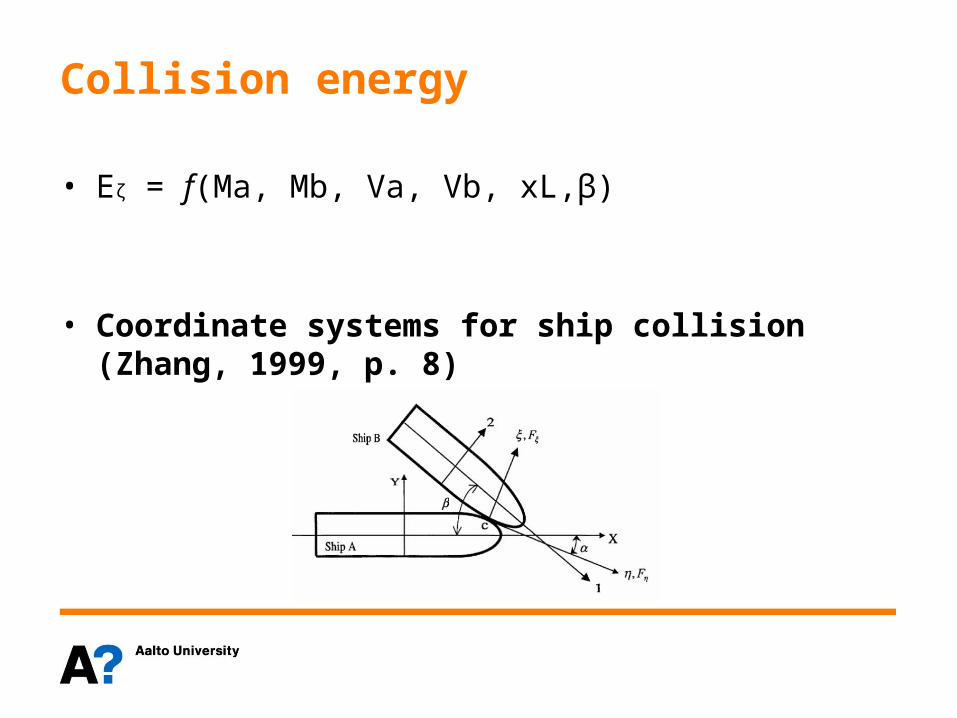
Collision energy
• Eζ = f(Ma, Mb, Va, Vb, xL,β)
• Coordinate systems for ship collision (Zhang, 1999, p. 8)

Solution: FEM + statistics
• Relationship between collision energy, penetration depth and tanker double hull width
• Interpolation to obtain a general model
0 0.5 1 1.5 2 2.50
5
10
15
20
25
30
35
40
125 %
100 %
75 %
50%
FEM 100 %
Penetration [m]
En
erg
y [M
J]
0% 50%
100%
150%
200%
250%
0
20
40
60
80
100
120
140
f(x) = 82.4571428571429 x − 31.7R² = 0.996579871206737
MJ needed for 3 m penetration
Linear (MJ needed for 3 m penetration)
Relative double hull width
MJ
𝛿⏊= 𝐸𝜉 13𝐹𝐵ቀ82.457𝑊𝐷𝐻2 − 31.7ቁ𝑚 = 𝐸𝜉𝐹𝐵ሺ13.743 𝑊𝐷𝐻− 10.567ሻ 𝑚, (1)

FSA step 2Risk Analysis• Risk = Probability x Consequence (R = P x C)
Possibilities:
– Risk = E[chemical spill in tonnes in the GoF / year] E[collisions / year] x Pr[spill | collision] x E[spill size | spill]
– R = E[return period of spill]
– R = E[spill size | spill]
– R = E[spill size > X | spill]
– Etc…

Metamodels
• Faster computing• Availability to others• Sensitivity analysis
– Influence of variables– Changes in parameter values

Metamodelling
• Linear regression • ( )• Coefficient estimation:
• •

Metamodels
• Logistic regression– Two outcomes: no spill (0) or spill (1)– Cut-off point 0.5
• z = x0 + b1x1+b2x2+….. +bNxN• Ordinal logistic regression
– Several outcomes– Each outcome has own coefficients b0- bN

Re-cap on some statistical distributions
• Normal distribution N( μ, )– μ = mean– = standard deviation, = variance– 68 – 95 - 99.7 rule
• Uniform U(a,b)– a = lower boundary– b = upper boundary
• Weibull W(k, λ)– k = shape parameter (>0)– λ = scale parameter (>0)– Never <0
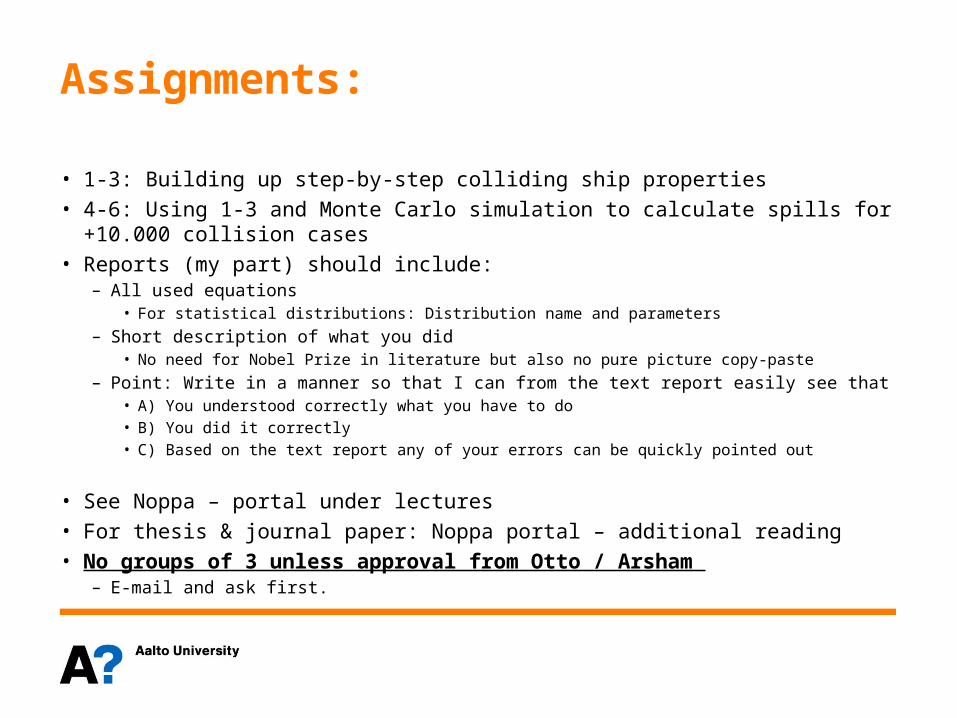
Assignments:
• 1-3: Building up step-by-step colliding ship properties• 4-6: Using 1-3 and Monte Carlo simulation to calculate spills for +10.000 collision
cases • Reports (my part) should include:
– All used equations • For statistical distributions: Distribution name and parameters
– Short description of what you did • No need for Nobel Prize in literature but also no pure picture copy-paste
– Point: Write in a manner so that I can from the text report easily see that • A) You understood correctly what you have to do• B) You did it correctly • C) Based on the text report any of your errors can be quickly pointed out
• See Noppa – portal under lectures • For thesis & journal paper: Noppa portal – additional reading• No groups of 3 unless approval from Otto / Arsham
– E-mail and ask first.

Reading
• See Noppa• Further statistical reading:
– Noppa– Mat-1.2600/ Mat-1.2620 Todari A/B
– https://noppa.aalto.fi/noppa/kurssi/mat-1.2600/etusivu– https://noppa.aalto.fi/noppa/kurssi/mat-1.2620/etusivu– English: Milton J.S. and J.C.Arnold: Introduction to Probability and
Statistics, Third Edition or later, McGraw-Hill.
• Otto’s reception hours: – Mo 9.00-10.30 Otakaari 3, ground floor
Structure assignment alternative 2: Strength analysis of an ice-going vessel
Kul-24.4200 Introduction to Risk Analysis of Structures P

Background
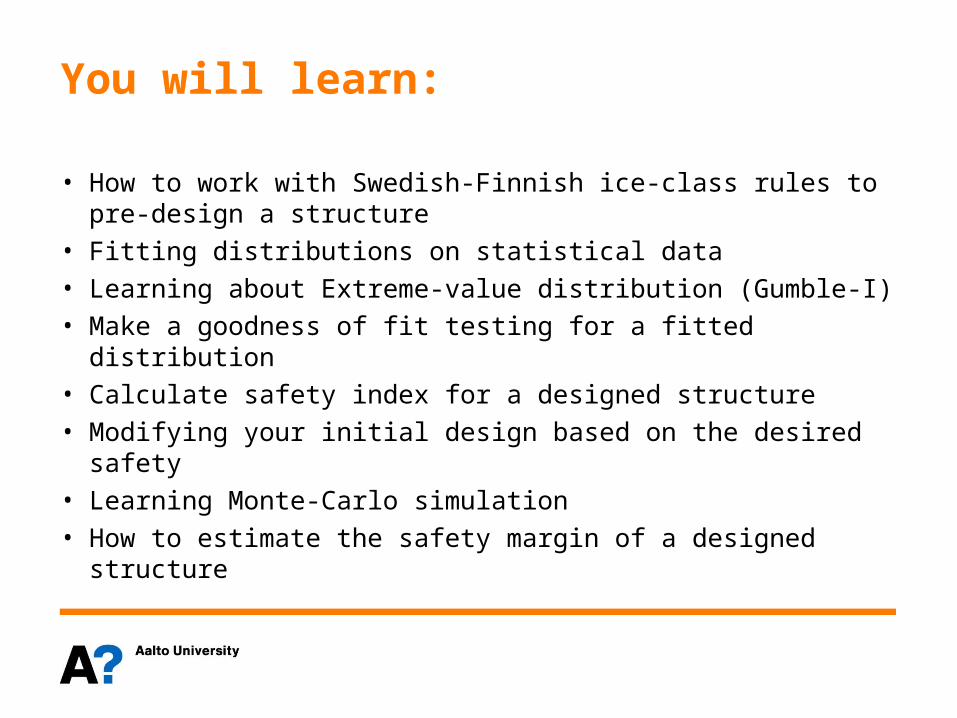
You will learn:
• How to work with Swedish-Finnish ice-class rules to pre-design a structure
• Fitting distributions on statistical data• Learning about Extreme-value distribution (Gumble-I)• Make a goodness of fit testing for a fitted distribution• Calculate safety index for a designed structure• Modifying your initial design based on the desired safety • Learning Monte-Carlo simulation• How to estimate the safety margin of a designed
structure

You
• Do NOT need to be a naval architect• Do NEED to be an engineer (preferably Mechanical) that
is eager to design structures• Do NEED to know what is plastic/elastic section modulus• Do NEED to know a programming software, preferably
MATLAB or R, though EXCEL does OK!• Do NEED to know basics of statistics and probability
distributions• Do NEED to be eager to expand your skills and
knowledge!

Arsham at the office
• Mondays 10:00-12:00• Otakaari 3, ground floor
• You can email me your questions out of the above time, and I will reply in my earliest possibility!