KUDANKULAM NUCLEAR POWER PROJECT 3 TO 6 SITE …
124
NUCLEAR POWER CORPORATION OF INDIA LTD (A Government of India Enterprise) KUDANKULAM NUCLEAR POWER PROJECT 3 TO 6 SITE EVALUATION REPORT FOR KKNPP UNITS 3 TO 6 Report no: I.02.KK. 3-6.0.0.OO.RS. WD 001 MARCH 2011 MUMBAI
Transcript of KUDANKULAM NUCLEAR POWER PROJECT 3 TO 6 SITE …
NUCLEAR POWER CORPORATION OF INDIA LTD ( A G o v e r n m e n t o f I n d i a
E n t e r p r i s e )
KUDANKULAM NUCLEAR POWER PROJECT 3 TO 6
SITE EVALUATION REPORT FOR KKNPP UNITS 3 TO 6
Report no: I.02.KK. 3-6.0.0.OO.RS. WD 001
MARCH 2011
MUMBAI

Nuclear Power Corporation NPP “Kudankulam” Site Evaluation Report for KKNPP unit 3 to 6
DOCUMENT NO. DATE OF ISSUE REVISION NO. PAGE NO.
Contents of I.02.KK.3-6.0.0. OO.RS.WD001 March 2011 1 1 of 8
CONTENTS
Clause No
Sub clause No
Description Page No
1.0 Introduction 1
1.1 Geography, Demography and Topography 2
1.1.1 Site Location and Description 2
1.1.2 Land use 3
1.1.3 Industrial, Military and Transportation facilities in the near vicinity
3
1.1.3.1 Industrial facilities 3
1.1.3.2 Mining and quarrying operations 3
1.1.3.3 Military installations 4
1.1.3.4 Railway traffic 4
1.1.3.5 Road traffic 4
1.1.3.6 Waterways 4
1.1.3.7 Airports and Air Corridors 5
1.1.3.8 Pilgrimage and tourism locations near the site 5
1.1.3.9 Projections of Industrial Growth 5
1.1.3.10 Evaluation of Potential Accidents 5
1.1.4 Population Distribution 6
1.1.4.1 Population within a radius of 16 km 6
1.1.4.2 Population between 16 km and 32 km 6
1.1.4.3 Transient population 6
1.1.4.4 List of schools & hospitals within 16 km radius 7
1.1.4.5 Number of schools & hospitals within 30 km radius
9
1.1.4.6 Summary of population details up to a radius of 32 km around site (as per 2001 census)
10
1.1.4.7 Population Density within 10 km radius as per 2001 census
10
1.1.4.8 Cattle population ttle population 10
1.1.5 Accessibility to site 11
1.1.5.1 Broad Gauge Railway 11
1.1.5.2 National Highway 11
1.1.5.3 Other Roads 11
1.1.5.4 Airports 11
1.1.5.5 Sea port 11
1.1.6 Topography 11
1.2 Meteorology 12
1.2.0 General climate 12
1.2.1 Wind speed and direction 12
1.2.1.1 Design wind velocity 12

Nuclear Power Corporation NPP “Kudankulam” Site Evaluation Report for KKNPP unit 3 to 6
DOCUMENT NO. DATE OF ISSUE REVISION NO. PAGE NO.
Contents of I.02.KK.3-6.0.0. OO.RS.WD001 March 2011 1 2 of 8
1.2.2 Precipitation 13
1.2.2.1 Rainfall data recorded by ESML at KKNPP site during the period 2003 to 2007
13
1.2.2.2 Rainfall data recorded by IMD observatory at Kanyakumari during the period 1969 to 1997
16
1.2.2.3 Rainfall estimates for different return period 17
1.2.2.4 Local intense precipitation 17
1.2.3 Atmospheric Temperature 17
1.2.3.1 Atmospheric Temperature data recorded by ESML at KKNPP site during the period 2003 to 2007.
17
1.2.3.2 Atmospheric Temperature data recorded by IMD observatory at Kanyakumari during the period 1969 to 1996
18
1.2.3.3 Estimates of Atmospheric Temperature for establishing the design basis
18
1.2.4 Relative Humidity 18
1.2.4.1 Relative Humidity data recorded by ESML at KKNPP site during the period 2003 to 2007.
18
1.2.4.2 Relative Humidity data recorded by IMD observatory at Kanyakumari during the period 1969 to 1996
19
1.2.5 Atmospheric stability 19
1.2.5.1 Atmospheric Stability Class data recorded by ESML at KKNPP site during the period 2004 to 2007
19
1.2.5.2 Short term Diffusion Estimates 21
1.2.5.3 Long term Diffusion Estimates 22
1.3 Hydrology & Hydro-geology 26
1.3.1 Introduction: Site & Facilities 26
1.3.2 Quantity & Quality of Water for Plant Use 27
1.3.2.1 Potable Water (Fresh Water) 27
1.3.2.2 Service Sea Water 27
1.3.3 Ground Water Movement, River & Lake Current 27
1.3.4 Contamination 28
1.3.5 Tidal Effect 28
1.3.6 Flooding Protection Requirement 29
1.3.7 Coastal Cyclone & Seiches 29
1.3.8 Effect of Dam failure 30
1.3.9 Shore Line Stability 30
1.4 Geology 31
1.4.1 Basic Geology of Kudankulam site 31
1.4.2 Structural geology around Kudankulam 32
1.4.2.1 Lithology and Stratigraphy 33
1.4.2.2 Plate load tests 35

Nuclear Power Corporation NPP “Kudankulam” Site Evaluation Report for KKNPP unit 3 to 6
DOCUMENT NO. DATE OF ISSUE REVISION NO. PAGE NO.
Contents of I.02.KK.3-6.0.0. OO.RS.WD001 March 2011 1 3 of 8
1.4.2.3 Seismic wave transmission characteristic of the site
36
1.4.3 The ground water level 40
1.4.4 Field permeability test 40
1.4.5 Liquefaction potential 41
1.4.6 Possibility of subsidence, land sliding 41
1.4.7 Stability of Slopes 43
1.4.8 Construction notes from the experience of Unit 1 & 2 Construction
44
1.4.9 References 44
1.5 Seismology 45
1.5.1 Seismology & Basic Geology 45
1.5.1.1 Regional geology 46
1.5.1.2 Site geology 47
1.5.2 Vibratory Ground Motion 48
1.5.2.1 Seismicity 49
1.5.2.2 Geologic structures and tectonic activity 50
1.5.2.3 Correlation of earthquake activity with geologic structure or tectonic provinces
54
1.5.2.4 Maximum earthquake potential 55
1.5.2.5 Safe shutdown earthquake 57
1.5.2.6 Operating Basis Earthquake 60
1.5.3 Surface Faulting 62
1.5.3.1 Evidence of fault offset 62
1.5.3.2 Earthquakes associated with capable faults 62
1.5.3.3 Investigation of capable faults 63
1.5.3.4 Correlation of epicenters with capable faults 63
1.5.3.5 Description of capable faults 63
1.5.3.6 Ground truth verification studies within 5 km 63
1.5.4 References 65
1.6 Radio - Ecology 67
1.6.1 External Radiation 67
1.6.1.1 Survey during May 2001 67
1.6.1.2 Survey during 2004 67
1.6.1.3 Survey during 2005 68
1.6.1.4 Conclusions 69
1.6.1.5 Background Radiation level in Water and Other Items
69
1.6.2 Isodose Estimation 71
1.6.3 Environmental Impact Assessment 79
1.6.3.1 Baseline Environmental Status and Assessment of Impacts
79
1.6.3.1.1 Air Environment 79
1.6.3.1.2 Noise Environment 80
Nuclear Power Corporation NPP “Kudankulam” Site Evaluation Report for KKNPP unit 3 to 6
DOCUMENT NO. DATE OF ISSUE REVISION NO. PAGE NO.
Contents of I.02.KK.3-6.0.0. OO.RS.WD001 March 2011 1 4 of 8
1.6.3.1.3 Water Environment 80
1.6.3.1.4 Land Environment 82
1.6.3.1.5 Biological Environment 83
1.6.3.1.5.1 Aquatic 83
1.6.3.1.5.2 Terrestrial Aspects 84
1.6.3.1.6 Socio-economic Environment 85
1.6.3.2 Environment Management Plan 86
1.6.3.3 Environmental clearance 86
1.7 Thermal Pollution 87
1.7.1 Thermal pollution due to hot water discharge into water body
87
1.7.2 Thermal pollution due to the discharges into the atmosphere
87
1.8 Design Information of Proposed Project 88
1.8.0 Type of plant and location 88
1.8.1 Safety Approach 88
1.8.1.1 Safety Objectives 88
1.8.1.2 Principles & Guidelines 88
1.8.2 Brief description of KKNPP 3-6 89
1.8.2.1 General Description 89
1.8.2.2 The Nuclear Steam Supply system 90
1.8.2.3 Safety Aspects 90
1.8.2.4 Safety Analysis 91
1.8.2.5 The Concept of Defense in Depth 95
1.8.2.6 Barriers to Radioactivity Release 96
1.8.3 Reactor System of KKNPP 3 to 6 97
1.8.3.1 Reactor Pressure Vessel (RPV) and Internals 97
1.8.3.2 Reactor Fuel 98
1.8.3.3 Reactor Coolant System (RCS) and Equipment 98
1.8.3.4 Reactor Coolant Pump (RCP) Set 98
1.8.3.5 Pressuriser 99
1.8.3.6 Steam Generators 99
1.8.3.7 Reactor Control and Protection System 99
1.8.4 Special Features Incorporated In Kudankulam 1&2
100
1.8.4.1 Inherent Safety Features 100
1.8.4.2 Engineered Safety Features 100
1.8.4.2.1 Emergency Core Cooling System 100
1.8.4.2.2 Steam Generator Blow Down and Emergency Cooling System
101
1.8.4.2.3 Passive Heat Removal System 101
1.8.4.2.4 Reactor Containment System 101
1.8.4.2.5 Containment Isolation System 102
1.8.4.2.6 Containment Spray System 102
Nuclear Power Corporation NPP “Kudankulam” Site Evaluation Report for KKNPP unit 3 to 6
DOCUMENT NO. DATE OF ISSUE REVISION NO. PAGE NO.
Contents of I.02.KK.3-6.0.0. OO.RS.WD001 March 2011 1 5 of 8
1.8.4.2.7 Passive Venting of the Annulus 102
1.8.4.2.8 High Pressure Emergency Boron Injection System and Quick Boron Injection System
102
1.8.4.2.9 Molten Core Catcher System 102
1.8.4.2.10 Nuclear Component Cooling Water System 102
1.8.5 Reactor Auxiliary System 103
1.8.5.1 Reactor Volume and Chemical Control System 103
1.8.5.2 Residual Heat Removal System 103
1.8.5.3 Reactor Building Ventilation System 103
1.8.6 Secondary Circuit 103
1.8.7 Cooling Water Supply Systems 104
1.8.7.1 Main Cooling Water System 104
1.8.7.2 Sea Water Cooling System for Essential Services 104
1.8.7.3 Sea Water Cooling System for Non-Essential Loads
104
1.8.8 Fire Protection System 104
1.8.8.1 Automatic fire-fighting system for safety system 105
1.8.8.2 High pressure fire fighting water pipe line 105
1.8.8.3 Gas fire-fighting system 106
1.8.9 Instrumentation and Control (I&C) 106
1.8.10 Electrical System 107
1.8.10.1 Power Output System 107
1.8.10.2 Station Auxiliary Power Supply System 107
1.8.11 Fuel Handling System 108
1.8.12 Plant Auxiliaries 108
1.8.12.1 Ventilation System 108
1.8.13 Contamination Control 108
1.8.14 Radioactive Waste Treatment System 109
1.8.14.1 Liquid Radioactive Wastes 109
1.8.14.2 Gaseous Wastes 110
1.8.14.3 Solid Radioactive Waste System 110
1.8.14.4 Dose apportionment 111
1.8.15 Environmental Monitoring 111
1.8.16 Ultimate Heat Sink (UHS) 111
1.8.17 Offsite Power supplies 112
1.8.18 Emergency plan 112
1.9 Nuclear Security 113
Tables / Figures
Nuclear Power Corporation NPP “Kudankulam” Site Evaluation Report for KKNPP unit 3 to 6
DOCUMENT NO. DATE OF ISSUE REVISION NO. PAGE NO.
Contents of I.02.KK.3-6.0.0. OO.RS.WD001 March 2011 1 6 of 8
Table / Figure
No Description Page No
Figure 1.2.5.1-1 Occurrence of stability classes at KKNPP site 21
Table 1.2.5.2-1 Short-term Diffusion Coefficient at 1.6 km 21
Table 1.2.5.2-2 Short-term Diffusion Coefficient at 5.0 km 22
Table 1.2.5.3-1 Atmospheric dilution factor /Q (1x10⁻⁸ s.m-3) (Jan-Dec 2004)
23
Table 1.2.5.3-2 Atmospheric dilution factor /Q (1x10⁻⁸ s.m-3) (Jan-Dec 2005)
23
Table 1.2.5.3-3 Atmospheric dilution factor /Q (1x10⁻⁸ s.m-3) (Jan-Dec 2006)
24
Table 1.2.5.3-4 Atmospheric dilution factor /Q (1x10⁻⁸ s.m-3) (Jan-Dec 2007)
25
Table 1.5.2.5-1 Events considered for PGA for S2 57
Table 1.6-1 Kudankulam Environment: External Gamma Radiation Survey (2004)
71
Table 1.6-2 Kudankulam Environment : External Gamma
Radiation Survey carried out during the year 2005
76
Table 1.6-3 Kudankulam Environment: Radio Cesium Activity in Coastal Sea Waters (2005)
76
Table 1.6.4 Kudankulam Environment: Radio Cesium Activity in Off-shore Sea Waters (2005)
77
Figure 1.6-1 Annual Gamma Isodose curve for FPNG (Year 2007) 78

Nuclear Power Corporation NPP “Kudankulam” Site Evaluation Report for KKNPP unit 3 to 6
DOCUMENT NO. DATE OF ISSUE REVISION NO. PAGE NO.
Contents of I.02.KK.3-6.0.0. OO.RS.WD001 March 2011 1 7 of 8
LIST OF ANNEXURES
Sl. No: Annexure No:
Title No. of Sheets
1.1 Geography, Demography and Topography
1.1-1 Local Area map covering the National and State Highways and Railways passing near the site
1
1.1-2 Layout of KKNPP Units 1-6 1
1.1-3 Population Distribution & other details in area surrounding Kudankulam site
1
1.1-4 Population details within 16 km radius (as per 2001 census)
1
1.1-5 Projected population within 16 km radius 2
1.1-6 Population details within 16 km & 32 km radius (as per 2001 census)
3
1.1-7 Projected population between 16 km & 32 km radius
1
1.1-8 Population centres with population more than 10000 within 50 km radius around the site (as per 2001 census)
3
1.1-9 Details of cultivation and production of agricultural crops
4
1.1-10 Cattle population data in emergency planning zones ( as per census year 2001 )
3
1.2 Meteorology
1.2-1 Hourly average wind speed at KKNPP site 3
1.2-2 Wind Rose diagrams at 10 m & 60 m heights 1
1.3 Hydrology & Hydro-geology
1.3-1 Layout of the Hydro technical Structures and thermal dispersion
3
1.3-2 Indian Standard Specification for drinking ( Potable ) water quality
3
1.3-3 Sea water Quality 13
1.3-4 Ground water contour and movement 1
1.4 Geology
1.4-1 Geological map of the region around the Site 1
1.4-2 Topographical and Geographical Features of Kudankulam Site
1
1.4-3 Borehole locations and profiles – KKNPP Units 3 & 4
4
1.4-4 Borehole locations and profiles – KKNPP Units 5 & 6
3
1.4-5 Borelogs – KKNPP Units 3 & 4 44

Nuclear Power Corporation NPP “Kudankulam” Site Evaluation Report for KKNPP unit 3 to 6
DOCUMENT NO. DATE OF ISSUE REVISION NO. PAGE NO.
Contents of I.02.KK.3-6.0.0. OO.RS.WD001 March 2011 1 8 of 8
1.4-6 Borelogs – KKNPP Units 5 & 6 36
1.4-7 Test Results of Rock Cores Unit 3 & 4 26
1.4-8 Test Results of Rock Cores Unit 5 & 6 18
1.4-9 Static Plate load tests on soil and Rock Unit 3 & 4 8
1.4 -10 Cross hole tests Results - Unit 3 & 4 9
1.4 -11 Seismic Refraction test – Results – Unit 3 & 4 14
1.4 -12 Seismic Refraction test – Results – Unit 5 & 6 7
1.4 -13 Water Table levels in Boreholes : Units 3 to 6 6
1.5 Seismology
1.5-1 Seismic Zoning Map of India 1
1.5-2 Table of Earthquakes around the Site ( Global data )
2
1.5-3 Location of Epicenters of Micro Earthquakes 2
1.5-4 Geological map of the region around the Site 1
1.5-5 Seismotectonic and Lineament map of the area around Kudankulam Site
1
1.5-6 Geological Section along the centre line of Reactor ; Unit 1 & 2
1
1.5-7 List of Lineament / Faults within 600 KM square around the Site
2
1.5-8 Lineament map of the area around Kudankulam Site, Tamilnadu interpreted from satellite image
1
1.5-9 Events considered for SSE 1
1.5-10 Isoseismal maps of Earthquakes 2
1.5-11 Map of Maximum observed Earthquake intensities in Peninsular India.
1
1.5-12 Log I versus Delta Graphs of Koyna earthquake 1
1.5-13 Normalized Design Response Spectra 4
1.5 -14 Design Basis Dynamic Amplification Factor for Horizontal Motion
4
1.5-15 Time histories for vertical & horizontal motion and comparison between SRDS and THRS.
8
1.5-16 Calculated Maximum Peak Ground acceleration 2
1.5-17 Events considered for OBE 1
1.5-18 Design Basis Peak Ground Accelerations for S1 and S2
1
1.5-19 Seismo-tectonic evaluation report of area within 5 KM radius around KKNPP - NIRM
24
1.5-20 Off-shore extension of lineament L-7 as per the outcome of discussions with the experts from ONGC
1
1.9 Nuclear Security
1.9-1 Layout map indicating escape routes from Units 3&4 area
1
Nuclear Power Corporation NPP “Kudankulam” Site Evaluation Report for KKNPP unit 3 to 6
DOCUMENT NO. DATE OF ISSUE REVISION NO. PAGE NO. I.02.KK.3-6.0.0. OO.RS.WD001 March 2011 1 1 of 113
1.0 Introduction
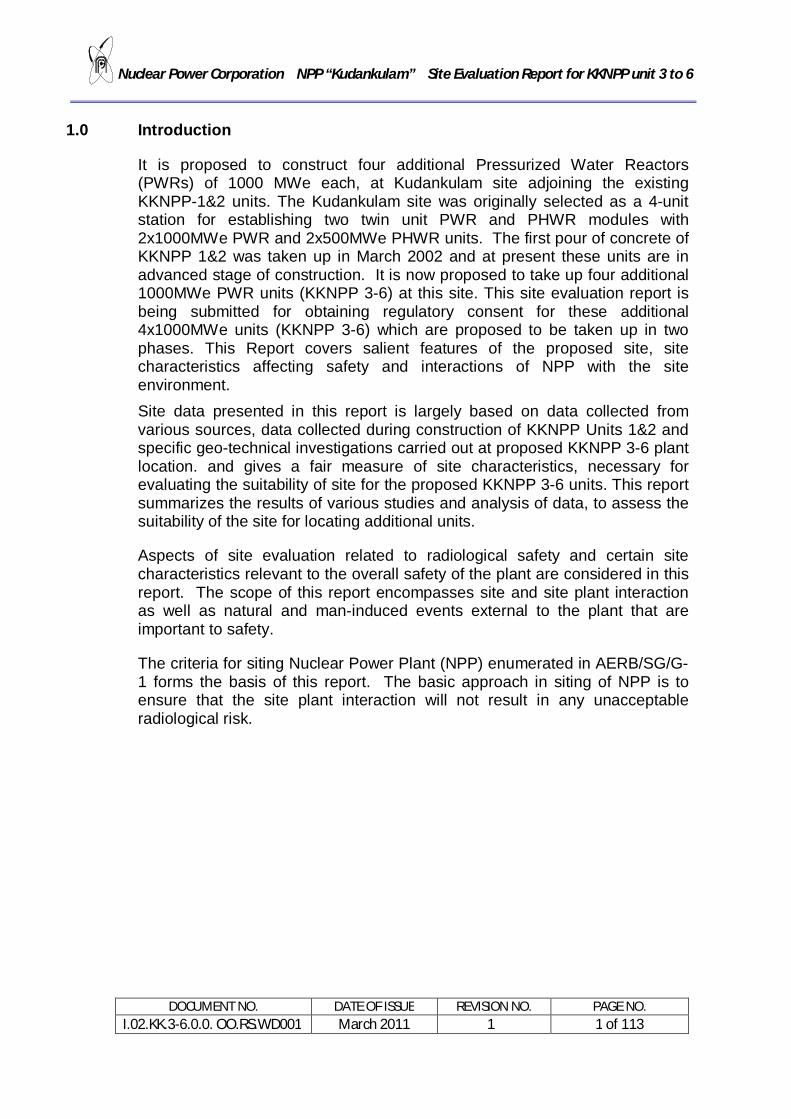
It is proposed to construct four additional Pressurized Water Reactors (PWRs) of 1000 MWe each, at Kudankulam site adjoining the existing KKNPP-1&2 units. The Kudankulam site was originally selected as a 4-unit station for establishing two twin unit PWR and PHWR modules with 2x1000MWe PWR and 2x500MWe PHWR units. The first pour of concrete of KKNPP 1&2 was taken up in March 2002 and at present these units are in advanced stage of construction. It is now proposed to take up four additional 1000MWe PWR units (KKNPP 3-6) at this site. This site evaluation report is being submitted for obtaining regulatory consent for these additional 4x1000MWe units (KKNPP 3-6) which are proposed to be taken up in two phases. This Report covers salient features of the proposed site, site characteristics affecting safety and interactions of NPP with the site environment.
Site data presented in this report is largely based on data collected from various sources, data collected during construction of KKNPP Units 1&2 and specific geo-technical investigations carried out at proposed KKNPP 3-6 plant location. and gives a fair measure of site characteristics, necessary for evaluating the suitability of site for the proposed KKNPP 3-6 units. This report summarizes the results of various studies and analysis of data, to assess the suitability of the site for locating additional units.
Aspects of site evaluation related to radiological safety and certain site characteristics relevant to the overall safety of the plant are considered in this report. The scope of this report encompasses site and site plant interaction as well as natural and man-induced events external to the plant that are important to safety.
The criteria for siting Nuclear Power Plant (NPP) enumerated in AERB/SG/G-1 forms the basis of this report. The basic approach in siting of NPP is to ensure that the site plant interaction will not result in any unacceptable radiological risk.

Nuclear Power Corporation NPP “Kudankulam” Site Evaluation Report for KKNPP unit 3 to 6
DOCUMENT NO. DATE OF ISSUE REVISION NO. PAGE NO. I.02.KK.3-6.0.0. OO.RS.WD001 March 2011 1 2 of 113
1.1 Geography, Demography and Topography 1.1.1 Site Location and Description The site of the proposed Units 3 to6 is located next to the KKNPP Units 1&2
and is 4 km south of Kudankulam village. The site is on the shore of Gulf of Mannar and is located near the South-Eastern tip of India. It is located in Radhapuram taluk of Tirunelveli – Kattabomman district in the state of Tamilnadu. The town of Kanyakumari is about 27 km away from the project site. There are two railway stations (Broad Gauge) near the site, one at Kanyakumari, which is at a distance of 27 km to the South-West of the site, and the other at Vadakku Valliyur at a distance of 27 km to the North of the site. The nearest National Highway (NH- 7) passes through Anjugramam village and is at a radial distance of 15 km from the site. A Major District road runs along the coast at a distance of 3 km from the site and passes through Kudankulam village. The nearest sea port is at Tuticorin which is at a distance of 100 km from the site. The nearest airports are at Trivandrum and Tuticorin, which are about 90 and 100 km from the site respectively.
A local area map covering the National and State Highways and Railways
passing near the site is given in Annexure 1.1-1. The proposed KKNPP units 3-6 are accommodated towards west of the KKNPP1&2 units. Reactor buildings of KKNPP units 3-6 are oriented in line with the Reactor buildings of units 1&2. The total plant area for units 1to 6 is 1053.25 hectares. The site is bounded by 3 m high R.R masonry wall with 0.6 m high barbed wire all along the 2 km radius property boundary measured from the centre of Reactor Buildings. The exclusion radius for the purpose of calculating the doses to the public is 1.5 km from the centre of reactor units.
The NPP site is situated in the coastal track at an elevation of +3.0m to
+45.0m above MSL forming the southern fringe of soil covered plains. These plains extend up to the east of Western Ghats which rise up to a height of 1679.8m above MSL. The Hanuman Nadi and the Nambiar River rise in the eastern slopes of the Western Ghat range and flow in E, SE and SSE direction in the coastal areas both entering the Gulf of Mannar at about 5 km West and 9 km NE of the site respectively. Rivers in the area are seasonal. There are no major lakes or dams within 20 km radius around project site except some local rain fed tanks, which serve the local needs.
There are no industrial, commercial, institutional, recreational or permanent
residential structures within the site area.
Nuclear Power Corporation NPP “Kudankulam” Site Evaluation Report for KKNPP unit 3 to 6
DOCUMENT NO. DATE OF ISSUE REVISION NO. PAGE NO. I.02.KK.3-6.0.0. OO.RS.WD001 March 2011 1 3 of 113
1.1.2 Land use
Within the 2 Km radius about 34% of the area falls in the sea. Remaining constitutes barren land, agricultural land and unirrigated cultivable wasteland amounting to about 7%, 1% and 58 % respectively.
Within 30 Km radius about 50 % of the area falls in the sea. The remaining area consists of agricultural and barren lands. The main agricultural crops are paddy, grams, millets, groundnut, coconut and chilies. The subsidiary crops are tobacco, pulses, cotton, and oil seeds.
The other cultivation is mainly for vegetables like brinjal, cluster beans, banana, ladies finger, drumstick, ash gourd, pumpkin etc.
Being a coastal site, fishing is the main source of livelihood in the immediate
vicinity of the site area. There are three fishing villages viz. Idinthakarai, Koothankuzhi, and Perumanal at distances of 4 Km, 10 Km and 6 Km respectively from the site.
Common diet of the people in the area is rice, fish and vegetables.
The total number of population involved in fishing activity is 9523 within 16km radius from the plant. Marine production in these areas is 11,600 tonnes per annum.
The details of land under cultivation and production of agricultural crops within 16 km are given in annexure- 1.1-10
1.1.3 Industrial, Military and Transportation facilities in the near vicinity
1.1.3.1 Industrial facilities
There are no industrial or manufacturing units in the near vicinity (within 8 Km radius of the site). Also there are no refineries, chemical plants, oil storage units and oil & gas pipe lines in the near vicinity. The nearest chemical plant is at Tuticorin, which is about 100 Km away. Hence there is no potential of any industrial accidents or their consequences, which may result in any radiological hazard.
1.1.3.2 Mining and quarrying operations
No mining activity is carried out within the plant boundary and also within 2km to 5km radius. Only surface mining is being adopted for extraction of lime stone and no blasting activity is conducted for this purpose from areas beyond 5km from the Plant.

Nuclear Power Corporation NPP “Kudankulam” Site Evaluation Report for KKNPP unit 3 to 6
DOCUMENT NO. DATE OF ISSUE REVISION NO. PAGE NO. I.02.KK.3-6.0.0. OO.RS.WD001 March 2011 1 4 of 113
There is a stone quarry at Erukkanthurai which is beyond 5 Km from the site. Only controlled blasting is used for quarrying. No granite mining is carried out in the sterilized zone. Also there is a stone quarry at a distance of 5 Km from the site at Vijayapathi, where only open soft excavation is carried out up to 2 m depth. The other stone quarries are at Manpothai, Kottaikarumkulam and Pothayadi, which are at 18 Km, 20 Km and 24 Km respectively from the site. Hence the effects of explosion, fire, emission of toxic and corrosive clouds due to mines are insignificant on the Nuclear Power Station.
1.1.3.3 Military installations There are no military installations in the near vicinity. There is a Naval facility
at Vijayanarayaram which is about 25 Km from the site. Also there are no missile sites in the near vicinity. Hence there are no associated risks to the NPP in this regard.
1.1.3.4 Railway traffic
The nearest Railway Stations are at Kanyakumari, which is about 27 Kms away and at Vadakku-Valliyoor which is also about 27 Kms away. Both these stations have broad-gauge railway track. Kanyakumari is a terminus and a tourist centre. Mostly passenger trains run between Trivandrum and Kanyakumari. Vadakku Valliyoor is a Station between Tirunelveli and Nagercoil and mostly passenger trains run between these stations. As such the effect any of explosive fires or any forms of accidents associated with inflammable materials that may be transported by trains, on the plant, are negligible as nearest railway line is at a radial distance of around 20km from the site.
1.1.3.5 Road traffic One Major District road along the coast passes through Kudankulam village,
which is about 3 Km from the site. This road connects Nagercoil and Thiruchendur. Buses carrying passengers ply between these places. The intensity of traffic on this road is very less. The major transport road is National Highway-7, which is about 20 Km from the site, connecting Tirunelveli and Kanyakumari. As such the effect of any explosive fires or any forms of accidents associated with inflammable materials that may be transported by NH-7 are negligible on the plant since the same is at a distance of about 20km from the site.
1.1.3.6 Waterways
There is no navigable waterway nearby. The nearest port is at Tuticorin, which is 100 Km away. Hence the chance of ships or barges carrying dangerous materials sailing near the site is remote. A mini port for berthing

Nuclear Power Corporation NPP “Kudankulam” Site Evaluation Report for KKNPP unit 3 to 6
DOCUMENT NO. DATE OF ISSUE REVISION NO. PAGE NO. I.02.KK.3-6.0.0. OO.RS.WD001 March 2011 1 5 of 113
barges, which bring equipment to KKNPP Site, has been constructed on the coast of KK site. As the port is directly under the control of the Plant personnel, full control on the barges coming to the Jetty is with the KKNPP authorities. Also these barges do not carry any explosive cargo.
1.1.3.7 Airports and Air Corridors
There is no Airport nearby. The nearest Airports are at Trivandrum and Tuticorin, which are at about 90 Km and 100 Km away from the site respectively.
1.1.3.8 Pilgrimage and tourism locations near the site
Kanyakumari, which is at a radial distance of 20 km from the site and Suchindram which is at a radial distance of about 25 km from the site are the two locations of interest from pilgrimage and tourism considerations in the near vicinity of the site.
1.1.3.9 Projections of Industrial Growth There is no Industrial activity at present in the 5 Kms radius of the site. There
is no possibility for any new type of activity in this area, as no industry will be permitted, as per the government notification.
1.1.3.10 Evaluation of Potential Accidents
There are no military bases, missile sites, waterways, airports, air corridors, railways etc in the near vicinity of the site. Hence there is no possibility of accidents involving explosions, flammable vapors manufacturing plant, chemical plants, refineries, oil and gas pipelines, oil storage, toxic chemicals, fires etc affecting the Nuclear power station.
Category I structures of KKNPP are designed for a shock wave front pressure
of 30 KPa. This pressure is estimated to be higher than a shock wave impact due to explosion of a truck carrying explosive material along the nearest district road, 3.0 km away from the plant site.
Also structures important to safety such as Reactor Building and New Fuel Storage Building are designed for aircraft impact.
No oil slick has been reported in the coastal shores of Kudankulam. Also, as there is no major port / shipping route close to the site, no oil slick is expected to occur in this region.

Nuclear Power Corporation NPP “Kudankulam” Site Evaluation Report for KKNPP unit 3 to 6
DOCUMENT NO. DATE OF ISSUE REVISION NO. PAGE NO. I.02.KK.3-6.0.0. OO.RS.WD001 March 2011 1 6 of 113
1.1.4 Population Distribution
Following are the demographic details around Kudankulam site area based on the latest census carried out in the year 2001.
1.1.4.1 Population within a radius of 16 km
A location map indicating the population centres up to a radius of 32 km around the KKNPP site is given in Annexure 1.1-3. The whole area is divided into 16 sectors of 22½ deg. each and each of these sectors is designated by letters “A” to “P”. These sectors are further sub-divided into radial zones of 0-2km, 2 to 5 km, 5 to 8 km, 8 to 16 km and 16 to 32 km. These radial zones are designated by indices 0, 1, 2, 3 and 4 respectively. The exclusion zone is acquired and owned by NPCIL. This exclusion area is fenced and no public habitation is allowed in this zone.
Total population within the sterilized zone, ie. the annulus between 2 km and
5 km is about 19500, of which 95% are residing in Kudankulam and Vijayapati (Idinthakarai) villages.
The total population within 16 km radius around the site is 118480. The population distribution in various sectors / radial zones up to a radius of
16 km around the KKNPP site is given in Annexure 1.1-4. The population growth rate between 1991 and 2001 for the state of Tamil
Nadu was 11.72%. and the population growth rate within 16 km radius in the same period was 35.98 %. There for the population growth rate of 36% is assumed for population projections for a further period of 40 years (from 2016) and these details are given in Annexure 1.1-5.
1.1.4.2 Population between 16 km and 32 km
Population details between 16 km and 32 km radius are given in Annexure 1.1-6. Assuming the growth rate as 11.72%, the population projections for a further period of 40 years (from 2016) are worked out and these details are given in Annexure 1.1-7.
A list of population centres within 50 km radius from plant site having population of more than 10000 is given in Annexure 1.1-8.
1.1.4.3 Transient population
Population around the NPP Site is mostly resident population. Kanyakumari, at a radial distance of 20 km from the Site, is a tourist and pilgrimage spot where some tourist population can be expected.

Nuclear Power Corporation NPP “Kudankulam” Site Evaluation Report for KKNPP unit 3 to 6
DOCUMENT NO. DATE OF ISSUE REVISION NO. PAGE NO. I.02.KK.3-6.0.0. OO.RS.WD001 March 2011 1 7 of 113
At Suchindram (radial distance of about 25 km from the site), there is a historic temple, which is also visited by tourists.
Transient population covering the details of tourists visiting these centres during 5 years from 1996 to 2000 are given below
SL.NO. YEAR KANYAKUMARI SUCHINDRAM
1 1996 1614464 875312
2 1997 1515758 732415
3 1998 1158167 612316
4 1999 1552885 757318
5 2000 1320950 631416
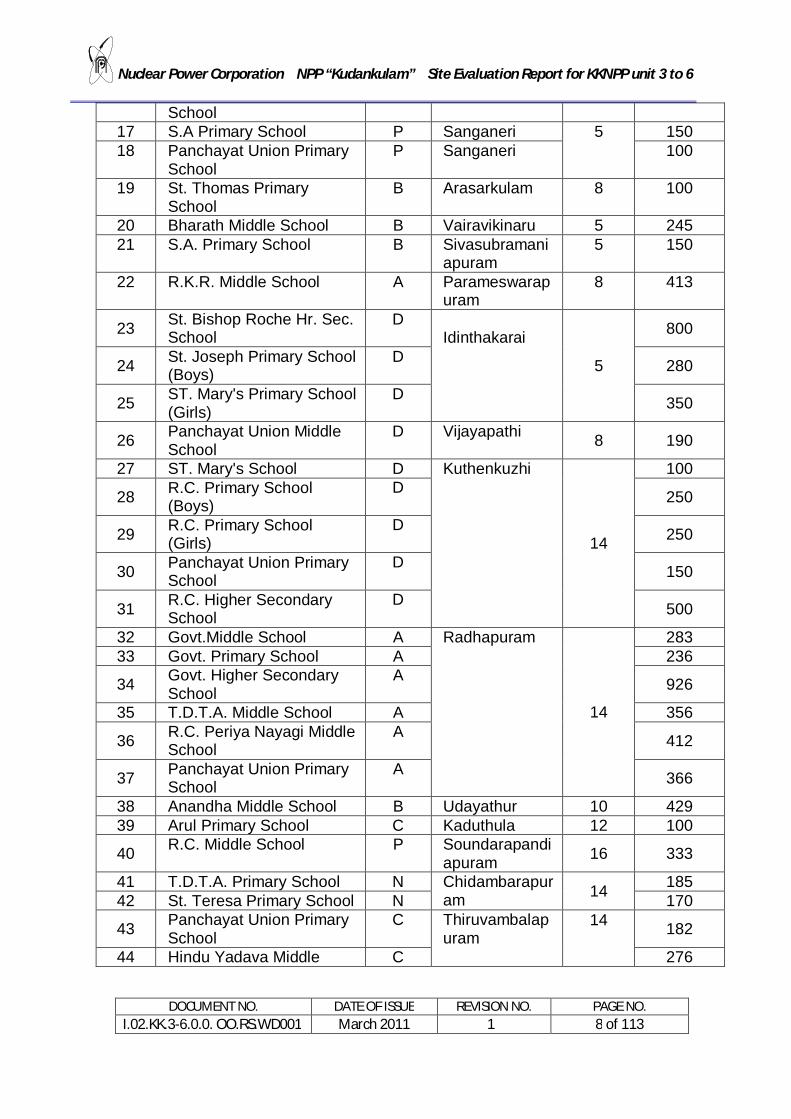
1.1.4.4 List of schools & hospitals within 16 km radius
a) List of schools within 16 km radius
Sl.No: Name of School Sector Location Road distance (km)
Occupancy (persons)
1 Govt. High School B Kudankulam 3 125 2 T.D.T.A. Middle School B
Kudankulam 3 - 4
800 3 Hindu Middle School 732 4 St. Anne's Primary School 600 5 St. Anne's Hr. Sec. School 956
6 Govt. Higher Secondary School
M Chettikulam
11 900
7 T.D.T.A. Primary School M 200 8 Hindu Middle School M 200
9 Panchayat Union Primary School
M Pudhumanai 11 320
10 Primary School M Srirenganarayanapuram 10 200
11 St. Xavier Middle School M Perumanal 11 240
12 St. Joseph Higher Sec. School
M Kootapuly 14 641
13 Panchayat Union Primary School
N Ponnarkulam 10 50
14 Sri Kuttalam Memorial Middle School
N Errukanthurai 10 250
15 St. Teresa High School N Keezhkulam 11 150 16 Panchayat Union Primary M Kothankulam 10 50
Nuclear Power Corporation NPP “Kudankulam” Site Evaluation Report for KKNPP unit 3 to 6
DOCUMENT NO. DATE OF ISSUE REVISION NO. PAGE NO. I.02.KK.3-6.0.0. OO.RS.WD001 March 2011 1 8 of 113
School 17 S.A Primary School P Sanganeri 5 150 18 Panchayat Union Primary
School P Sanganeri 100
19 St. Thomas Primary School
B Arasarkulam 8 100
20 Bharath Middle School B Vairavikinaru 5 245 21 S.A. Primary School B Sivasubramani
apuram 5 150
22 R.K.R. Middle School A Parameswarapuram
8 413
23 St. Bishop Roche Hr. Sec. School
D Idinthakarai
5
800
24 St. Joseph Primary School (Boys)
D 280
25 ST. Mary's Primary School (Girls)
D 350
26 Panchayat Union Middle School
D Vijayapathi 8 190
27 ST. Mary's School D Kuthenkuzhi
14
100
28 R.C. Primary School (Boys)
D 250
29 R.C. Primary School (Girls)
D 250
30 Panchayat Union Primary School
D 150
31 R.C. Higher Secondary School
D 500
32 Govt.Middle School A Radhapuram
14
283 33 Govt. Primary School A 236
34 Govt. Higher Secondary School
A 926
35 T.D.T.A. Middle School A 356
36 R.C. Periya Nayagi Middle School
A 412
37 Panchayat Union Primary School
A 366
38 Anandha Middle School B Udayathur 10 429 39 Arul Primary School C Kaduthula 12 100
40 R.C. Middle School P Soundarapandiapuram 16 333
41 T.D.T.A. Primary School N Chidambarapuram 14 185
42 St. Teresa Primary School N 170
43 Panchayat Union Primary School
C Thiruvambalapuram
14
182
44 Hindu Yadava Middle C 276

Nuclear Power Corporation NPP “Kudankulam” Site Evaluation Report for KKNPP unit 3 to 6
DOCUMENT NO. DATE OF ISSUE REVISION NO. PAGE NO. I.02.KK.3-6.0.0. OO.RS.WD001 March 2011 1 9 of 113
School 45 Muslim Middle School C 310 46 St. John Primary School B Vattavilai 10 150
47 T.D.T.A. Primary School C Kannakangulam 15 188
48 T.D.T.A. School C Chokkalingam 15 195
49 Panchayat Union Primary School
M Kannangulam 16 180
50 Panchayat Union Primary School
M Sankanapuram 12 190
51 Govt. Middle School M Karungulam 15 311 52 Govt. High School N Pazhavoor 15 360
53 Panchayat Union Primary School
A Aathukurichi 14 210
54 Panchayat Union Primary School
A Ilayanainarkulam 16
177
55 Panchayat Union Primary School
A Pannayarkulam 16 140
56 Panchayat Union Primary School
C Thottavilai 14 180
57 Panchayat Union Primary School
D Thomayarpuram 12 195
58 Panchayat Union Primary School
B Pappangulam 16 80
b) List of hospitals within 16 km radius
1.1.4.5 Number of schools & hospitals within 30 km radius
SL.NO. INSTITUTION NUMBER
1. SCHOOLS 105
2 HOSPITALS 20
NO SECTOR
HOSPITAL LOCATION DISTANCE
IN KM
STRENGTH NO. OF
BEDS
1. A GOVT. Radhapuram 10 17 32
2. B PHC Kudankulam 03 13 04
Nuclear Power Corporation NPP “Kudankulam” Site Evaluation Report for KKNPP unit 3 to 6
DOCUMENT NO. DATE OF ISSUE REVISION NO. PAGE NO. I.02.KK.3-6.0.0. OO.RS.WD001 March 2011 1 10 of 113
1.1.4.6 Summary of population details up to a radius of 32 km around site (as per
2001 census) Population within 2 km radius : 0
Population between 2 and 5 km radius : 19,497
Population between 5 and 8 km radius : 12,238
Population between 8 and 16 km radius : 86,745
Population between 16 km and 32 km : 7, 50,499
The cumulative population within 32 km radius as per 2001 census works out to 868979. Considering the population growth rate same as that for the State of Tamilnadu i.e 11.72% as per census 2001 data, total population with in 32 km radius as on 2009 works out to 950455.
1.1.4.7 Population Density within 10 km radius as per 2001 census
Population = 48206 Area = 157.07 sq.km Density = 307 persons per sq.km. As per AERB safety guide on population distribution (AERB/SG/S-9),
desirable population density within 10 km radius is, less than 2/3 of state average
Total population of Tamilnadu state : 62405679 Total area of Tamilnadu state : 130058 Sq.Km Density of Population : 479.83 ~~ 480 2/3 of the state average : 320 Therefore the actual population density within the 10km radius is less than
2/3rd state average and is in line with the desired criteria. Actual population will be taken in to account while making the detailed
emergency preparedness plans, which will indicate the actions to be taken under emergency, the responsible authority during emergency, the escape routes etc.
1.1.4.8 Cattle Population The details of the cattle population inside the different zones of emergency
planning as per 2001 census are given in Annexure 1.1 -10.

Nuclear Power Corporation NPP “Kudankulam” Site Evaluation Report for KKNPP unit 3 to 6
DOCUMENT NO. DATE OF ISSUE REVISION NO. PAGE NO. I.02.KK.3-6.0.0. OO.RS.WD001 March 2011 1 11 of 113
1.1.5 Accessibility to site
1.1.5.1 Broad Gauge Railway
There are two railway stations (Broad Gauge) near the site. The first station, Kanyakumari, is at a distance of 27 km to the South-West of the site. The second station, Vadakku Valliyur, is at a distance of 27 km to the North of the site.
1.1.5.2 National Highway
The nearest National Highway (NH- 7) passes through Anjugramam village and is at a radial distance of 15 km from the site.
1.1.5.3 Other Roads
A Major District road (connecting Nagercoil and Thiruchendur) runs along the coast at a distance of 3 km the site and passes through Kudankulam village.
1.1.5.4 Airports
The nearest airports are at Trivandrum and Tuticorin, which are about 90 and 100 km respectively from the site.
1.1.5.5 Sea port
The nearest sea port is at Tuticorin which is at a distance of 100 km from the site.
1.1.6 Topography
The NPP site is situated in the coastal track at an elevation of +3 to +45m above MSL forming the southern fringe of soil covered plains. The topography of the site is such that it has slope towards the sea. Thekkumalai is an isolated hill with an altitude of about +800m and is located in North- West direction of site. Ground water occurs under unconfined water table conditions and shows a gradient towards the sea. The site is generally underlain by banded and foliated biotite granite gneissic rocks covered by varying thickness of weathered gneiss and shell limestone. The bedrock of biotite granite gneiss encloses lenticular bands of charnockites and quartzites. Rock outcrops are seen at the tie between the high and low tide lines all along the shore and also in high ground and nalla cuttings in the area.
The site is in Seismic Zone II (as per seismic zoning map of India given in IS: 1893-2002, Part I). This zone is associated with low seismic potential. There are no major lakes, dams or ponds with in 20 km radius around project site, except some local rain fed tanks, which serve the local needs.

Nuclear Power Corporation NPP “Kudankulam” Site Evaluation Report for KKNPP unit 3 to 6
DOCUMENT NO. DATE OF ISSUE REVISION NO. PAGE NO. I.02.KK.3-6.0.0. OO.RS.WD001 March 2011 1 12 of 113
1.2 Meteorology
1.2.0 General climate
The climate of the area is arid. The site experiences a tropical climate with relative humidity ranging from 20% to 100%. The site experiences mainly winter monsoon during the months of October, November and December. The air masses are mainly of tropical nature with wind speeds in the range of 5 to 30 km/hr. Atmospheric air temperatures range from 18.5 o C to 39.6o C. The precipitation is low, the yearly average being around 700 mm.
Severe weather phenomena such as hurricanes, tornados, waterspouts, and hail do not occur in the site region. Similarly freezing rain and dust storms do not occur at or near the site region. The region does not experience any snowfall. Average daily evaporation worked out from the Thiruvanathapuram data for the period 1969 to 1996 is 4.00mm per day. With this rate of evaporation, the annual evaporation per year will be about 1.5m.
1.2.1 Wind speed and direction
Hourly average wind speed data at 10m height, as recorded by Environmental Survey & Meteorological Laboratory (ESML) at KKNPP site, for the period 2005 to 2007 is given in Annexure 1.2-1. The maximum and minimum hourly average wind speeds as recorded during this period are 8.39 m/s (30.21 km/hr) and 1.6 m/s (5.77 km/hr) respectively.
Combined Wind Rose data for the period 2003 to 2007 (at 10m & 60m heights) as recorded by ESML at KKNPP site is given in Annexure 1.2-2. From these figures it can be seen that the wind direction at 10m height above the ground level in this area is predominantly from West and at 60m height the wind direction is predominantly from WNW (west of north-west).
1.2.1.1 Design wind velocity
(a) Using the wind speed data recorded by class II A observatory of Indian Meteorological Department (IMD) at Kanyakumari and after carrying out the Gumbel’s method of linear regression analysis, the extreme wind speeds obtained for 100 and 1000 year return periods are as follows.
For 100 year return period : 11.43 m/s (41.14 km/hr) For 1000 year return period : 12.98 m/s (46.73 km/hr)
(b) Dr Shirvaikar, HPD, BARC has arrived at the following maximum wind speeds at Kudankulam using Isopeth Technique.
For 100 year return period : 40 m/s (145 km/hr)

Nuclear Power Corporation NPP “Kudankulam” Site Evaluation Report for KKNPP unit 3 to 6
DOCUMENT NO. DATE OF ISSUE REVISION NO. PAGE NO. I.02.KK.3-6.0.0. OO.RS.WD001 March 2011 1 13 of 113
For 1000 year return period : 46 m/s (165 km/hr) For 10000 year return period : 55 m/s (198 km/hr) (c) Using the provisions of IS 875 (part-3), max. wind velocities (at 10m
height) calculated for various return periods are as follows. For 100 year return period : 43.41 m/s (156.3 km/hr) For 1000 year return period : 52.85 m/s (190.3 km/hr) For 10000 year return period : 62.28 m/s (224.2 km/hr) Highest of the above three estimates (i.e values arrived as per the provisions
of IS875 as listed above), will be adopted for the design of civil structures. Characteristics of the maximum probable cyclonic storm with exceedance
probability of 0.01% passing through any point of the construction site or in 25 km radius shall be as adopted for Units 1&2. Same are as follows.
i) Translational Speed : 5.5 m/s
ii) Storm crater wall rotational Speed : 55 m/s
iii) Maximum pressure differential between: 6 KPa
periphery and crater
As Kudankulam Site is not prone to Tornados / extreme cyclones, the design data for Cyclonic Storm / Tornado, which was a part of the Technical Assignment for the design of the Plant is reproduced above.
1.2.2 Precipitation
1.2.2.1 Rainfall data recorded by ESL at KKNPP site during the period 2003 to 2007
Rainfall Data for the Year 2003
Month Number of Rainy Days
Total Rainfall during
month(mm)
Max. Rainfall in a day(mm)
Jul 5 16.70 3.80 Aug 1 11.43 11.43 Sept 1 1.70 1.70 Oct 5 32.90 12.40 Nov 10 239.90 87.80 Dec 1 3.0 3.00
Annual 23 305.63 87.80

Nuclear Power Corporation NPP “Kudankulam” Site Evaluation Report for KKNPP unit 3 to 6
DOCUMENT NO. DATE OF ISSUE REVISION NO. PAGE NO. I.02.KK.3-6.0.0. OO.RS.WD001 March 2011 1 14 of 113
Rainfall Data for the Year 2004
Month Number of Rainy Days
Total Rainfall during month(mm)
Max. Rainfall in a day(mm)
Jan 1 26.6 16.5 Feb 1 3.4 3.4 Mar Nil Nil Nil Apr 3 29.5 13.4 May 7 114.6 40.0 Jun 8 83.7 35.7 Jul 2 8.7 4.5 Aug 2 14.9 10.0 Sept 5 90.3 49.2 Oct 10 105.2 23.0 Nov 9 220.1 65.6 Dec 2 23.1 11.8
Annual 50 720.1 65.6
Rainfall Data for the Year 2005
Month Number of Rainy Days
Total Rainfall during month(mm)
Max. Rainfall in a day(mm)
Jan Nil Nil Nil Feb Nil Nil Nil Mar 1 46.2 46.2 Apr 4 196.4 100.8 May Nil Nil Nil Jun 3 31.6 25.3 Jul 9 138.16 50.7 Aug Nil Nil Nil Sept 3 14.8 12 Oct 7 58.1 14.6 Nov 13 329 69.5 Dec 7 153.9 94
Annual 47 968.16 100.8

Nuclear Power Corporation NPP “Kudankulam” Site Evaluation Report for KKNPP unit 3 to 6
DOCUMENT NO. DATE OF ISSUE REVISION NO. PAGE NO. I.02.KK.3-6.0.0. OO.RS.WD001 March 2011 1 15 of 113
Rainfall Data for the Year 2006
Month Number of Rainy Days
Total Rainfall during
month(mm)
Max. Rainfall in a day(mm)
Jan 3 161.2 147 Feb Nil Nil Nil Mar 2 14.5 12.1 Apr 1 1.8 1.8 May 6 33.9 13 Jun 5 44.2 16.1 Jul 4 25.3 15.4 Aug 4 16.4 11.2 Sept 13 97.5 48 Oct 11 263.1 87.8 Nov 13 240.9 68.5 Dec 2 24.5 18
Annual 64 923.3 147
Rainfall Data for the Year 2007
Month Number of Rainy Days
Total Rainfall during
month(mm)
Max. Rainfall in a day(mm)
Jan 2 14.8 8.5 Feb 2 3 1.7 Mar Nil Nil Nil Apr 6 131.5 41.3 May 1 4.5 4.5 Jun 8 101.5 42 Jul 3 91.3 66.2 Aug 3 4.9 2.2 Sept 7 27.6 12 Oct 9 111.5 41.2 Nov 4 74.5 25 Dec 3 32.2 22
Annual 48 597.3 66.2
From the above data recorded at KKNPP site during the period 2003 to 2007, average annual rainfall works out to 703mm.
Nuclear Power Corporation NPP “Kudankulam” Site Evaluation Report for KKNPP unit 3 to 6
DOCUMENT NO. DATE OF ISSUE REVISION NO. PAGE NO. I.02.KK.3-6.0.0. OO.RS.WD001 March 2011 1 16 of 113
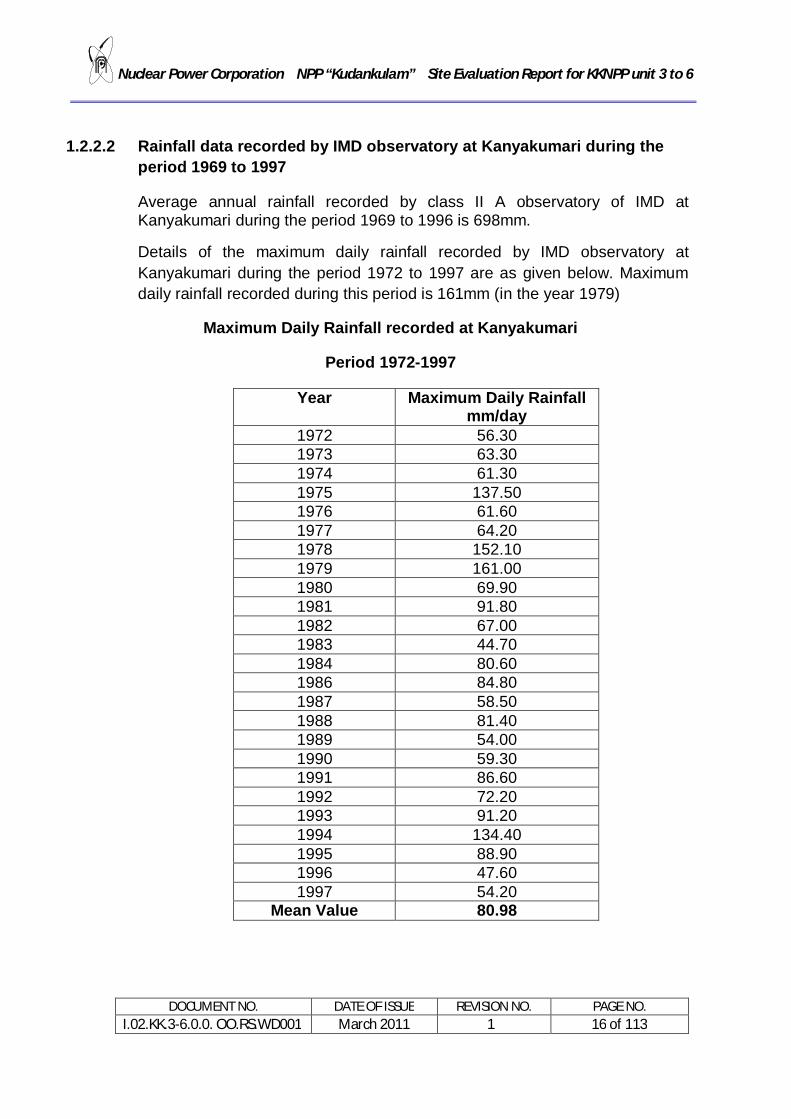
1.2.2.2 Rainfall data recorded by IMD observatory at Kanyakumari during the period 1969 to 1997
Average annual rainfall recorded by class II A observatory of IMD at Kanyakumari during the period 1969 to 1996 is 698mm.
Details of the maximum daily rainfall recorded by IMD observatory at Kanyakumari during the period 1972 to 1997 are as given below. Maximum daily rainfall recorded during this period is 161mm (in the year 1979)
Maximum Daily Rainfall recorded at Kanyakumari
Period 1972-1997
Year Maximum Daily Rainfall mm/day
1972 56.30 1973 63.30 1974 61.30 1975 137.50 1976 61.60 1977 64.20 1978 152.10 1979 161.00 1980 69.90 1981 91.80 1982 67.00 1983 44.70 1984 80.60 1986 84.80 1987 58.50 1988 81.40 1989 54.00 1990 59.30 1991 86.60 1992 72.20 1993 91.20 1994 134.40 1995 88.90 1996 47.60 1997 54.20
Mean Value 80.98

Nuclear Power Corporation NPP “Kudankulam” Site Evaluation Report for KKNPP unit 3 to 6
DOCUMENT NO. DATE OF ISSUE REVISION NO. PAGE NO. I.02.KK.3-6.0.0. OO.RS.WD001 March 2011 1 17 of 113
1.2.2.3 Rainfall estimates for different return periods
Using the rainfall data recorded at Kanyakumari during the period 1972 to 1997, rainfall estimates for different return periods have been worked by Gumbel’s distribution, by CWPRS, Pune as follows.
Rainfall estimates for different return periods using Gumbel’s distribution
Duration
(Hour)
Rainfall estimate (mm) for return period (Years) of 2 50 100 1000
1 40 69 75 95 12 75 147 161 208 24 84 169 186 242
1.2.2.4 Local intense precipitation
For calculation of rainfall intensity, published data (in the form of iso -pluvial maps) by Central Water Commission (CWC) is used. From this data maximum rainfall intensity for the site area can be specified as 50 mm/hr and 20 mm/ 15 min for 50 year return period.. However, as a conservative approach, a value of 100 mm/hr has been considered for the area drainage and 40 mm/15 min. adopted for design of roof drainage.
1.2.3 Atmospheric Temperature
1.2.3.1 Atmospheric Temperature data recorded by ESL at KKNPP site during the period 2003 to 2007
Maximum and minimum temperatures recoded by ESL, KKNPP during the period 2003 to 2007 are as follows.
Year
Max. Temp Min. Temp (in 0 c) Recorded in
month (in 0 c) Recorded in
month 2003 39 Jun 21 Oct 2004 39 Aug 22 Mar & Dec 2005 37.8 May 22 Nov & Dec 2006 37.8 May 22 Nov & Dec 2007 38.5 May 20.4 Dec

Nuclear Power Corporation NPP “Kudankulam” Site Evaluation Report for KKNPP unit 3 to 6
DOCUMENT NO. DATE OF ISSUE REVISION NO. PAGE NO. I.02.KK.3-6.0.0. OO.RS.WD001 March 2011 1 18 of 113
Maximum and minimum temperatures recorded during the above period are 390 c and 20.40 c respectively.
1.2.3.2 Atmospheric Temperature data recorded by IMD observatory at Kanyakumari during the period 1969 to 1996
Absolute maximum and minimum temperatures recorded by Kanyakumari observatory during the period 1969 to 1996 are 39.60 c and 18.60 c respectively.
1.2.3.3 Estimates of Atmospheric Temperature for establishing the design basis
From the temperature data recorded at Kanyakumari during the period 1969 to 1985, daily maximum and minimum temperatures with 0.01% exceedance (1 in 10000 years recurrence) work out to 400 c and 180 c respectively.
Following maximum & minimum temperature values as adopted earlier for KKNPP Units 1 & 2 shall be adopted for proposed units 3 to 6 also.
a) values that will be adopted for the design of Category II and III structures Absolute maximum air temperature : + 40.0 deg C
Absolute minimum air temperature : + 18.0 deg C
b) values that will be adopted for the design of Category I structures Absolute maximum air temperature : + 47.6 deg C
Absolute minimum air temperature : + 12.5 deg C
1.2.4 Relative Humidity
1.2.4.1 Relative Humidity data recorded by ESL at KKNPP site during the period 2003 to 2007
Maximum and minimum values of Relative Humidity recoded by ESL, KKNPP during the period 2003 to 2007 are as follows.
Year Max. Relative Humidity (in % )
Min. Relative Humidity (in %)
2003 100 34 2004 98 32 2005 97 33

Nuclear Power Corporation NPP “Kudankulam” Site Evaluation Report for KKNPP unit 3 to 6
DOCUMENT NO. DATE OF ISSUE REVISION NO. PAGE NO. I.02.KK.3-6.0.0. OO.RS.WD001 March 2011 1 19 of 113
2006 97 33 2007 90 32
Maximum and minimum values of Relative Humidity recorded during the above period are 100% and 32% respectively.
1.2.4.2 Relative Humidity data recorded by IMD observatory at Kanyakumari during the period 1969 to 1996
Maximum and Minimum values of Relative Humidity recorded by Kanyakumari observatory during the period 1969 to 1996 are 100% and 20% respectively.
1.2.5 Atmospheric stability
1.2.5.1 Atmospheric Stability Class data recorded by ESL at KKNPP site during the period 2005 to 2007
Month wise and annual Atmospheric Stability Class data worked out by ESL, KKNPP site for the period 2005 to 2007 is as follows.
YEAR – 2005
Month Stability Class (in %) A B C D E F
Jan 0.25 3.2 17.1 77.6 1.8 0 Feb 0.1 1.18 24.4 72.3 2.16 0 Mar 2.3 5.9 24.7 63.7 3.4 0 Apr 6.6 11.3 17.78 64.1 0.2 0 May 3.2 4.96 20.8 67.7 3.2 0 Jun 0.99 1.65 14.85 82.51 0 0 Jul 0.14 0.55 14.07 82.25 0 0 Aug 1.19 1.94 21.76 74.96 0.15 0 Sept 0.17 0.5 17.58 81.76 0 0 Oct 2.13 3.91 20.43 72.82 0.71 0 Nov 0.75 8.67 16.29 74.29 0 0 Dec 4.14 4.87 16.25 74.7 0 0

Nuclear Power Corporation NPP “Kudankulam” Site Evaluation Report for KKNPP unit 3 to 6
DOCUMENT NO. DATE OF ISSUE REVISION NO. PAGE NO. I.02.KK.3-6.0.0. OO.RS.WD001 March 2011 1 20 of 113
YEAR – 2006
Month Stability Class (in %) A B C D E F
Jan 0 0.68 17.78 80.71 0 0 Feb 0.16 1.47 25.41 72.96 0 0 Mar 4.45 10.71 19.61 64.4 0.83 0 Apr 4.54 10.4 18.01 66.3 0.73 0 May 0.14 1 19.89 78.97 0 0 Jun 0.17 0.33 21.67 77.83 0 0 Jul 0.27 0.4 14.54 84.66 0.13 0 Aug 0.88 1.18 21.06 76.58 0.29 0 Sept 2.43 3.24 21.88 71.8 0.49 0.16 Oct 0.57 5.66 20.93 72.84 0 0 Nov 0.72 4.17 20.29 74.82 0 0 Dec 0 0.4 18.35 81.24 0 0
YEAR – 2007
Month Stability Class (in %) A B C D E F
Jan 0 0.14 22.16 77.7 0 0 Feb 1.56 2.34 26.37 68.33 1.4 0 Mar 2.17 9.1 25.14 53.61 9.5 0 Apr 4.98 10.4 17.86 66.47 0.29 0 May 0.16 1.12 23.6 74.96 0.16 0 Jun 0.14 2.92 16.69 80.11 0.14 0 Jul 0 0.97 19.03 80 0 0 Aug 0.54 1.89 19.14 77.49 0.4 0 Sept 0.71 2.71 14.43 81 0.86 0 Oct 1.77 7.64 19.1 71.08 0.41 0 Nov 3.45 9.27 21.55 63.79 1.72 0 Dec 0.15 2.23 19.61 78.01 0 0
The frequency of occurrence of stability classes at KKNPP site, combined for the years 2005 to 2007 is shown in Fig 1.2.5.1-1 below.

Nuclear Power Corporation NPP “Kudankulam” Site Evaluation Report for KKNPP unit 3 to 6
DOCUMENT NO. DATE OF ISSUE REVISION NO. PAGE NO. I.02.KK.3-6.0.0. OO.RS.WD001 March 2011 1 21 of 113
Fig 1.2.5.1-1 Occurrence of stability classes at KKNPP site
From the above figure it can be seen that the site is dominated by the D- stability category ( 74 % ) and C- stability category (19.7%), owing primarily to the high associated wind speed. This will apply to night as well as daytime weather The E and F category weather frequencies together add up to only less than 1 %.
1.2.5.2 Short term Diffusion Estimates
From the hourly meteorological data such as wind speed, wind direction, stability category, rainfall and the Triple Joint Frequency Distribution (TJFD) for the year 2004, recorded by KKNPP local met station, estimates of the dilution factor were processed, considering the height of stack as 100m.The results are summarized as short –term diffusion coefficient estimates at 1.6 km and Short-term diffusion coefficient estimates at 5.0 km, and are indicated in the tables 1.2.5.2-1 and 1.2.5.2-2 below, respectively.
Value
Diffusion Coefficient /Q ( s/m3)
hourly 0-8 hours 8-24 h 1-4 days 4-30 days
Mean 6.82 x 10 -7 6.82 x 10 -7 6.79 x 10 -7 6.81 x 10 -7 6.87 x 10 -7 Max 3.89 x 10 –5 8.54 x 10 -6 5.41 x 10 –6 2.20 x 10 –6 1.04 x 10 -6 Min 5.92 x 10 –11 1.42 x 10 -7 2.30 x 10 -7 3.03 x 10 -7 3.85 x 10 -7 5 % 2.61 x 10 -7 3.31 x 10 -7 3.58 x 10 -7 3.95 x 10 -7 4.39 x 10 -7 50 % 4.82 x 10 -7 5.46 x 10 -7 5.73 x 10 -7 5.82 x 10 -7 6.85 x 10 -7 95 % 1.65 x 10 -6 1.42 x 10 –6 1.41 x 10 -6 1.27 x 10 -6 1.00 x 10 -6
1.4 3.9
19.7
74.0
0.8 0.00.0
10.0
20.0
30.0
40.0
50.0
60.0
70.0
80.0
A B C D E F
Perc
enta
ge F
requ
ency
Stability Class
Figure 2.3.4-1 Occurance of Stability Catagory

Nuclear Power Corporation NPP “Kudankulam” Site Evaluation Report for KKNPP unit 3 to 6
DOCUMENT NO. DATE OF ISSUE REVISION NO. PAGE NO. I.02.KK.3-6.0.0. OO.RS.WD001 March 2011 1 22 of 113
Table 1.2.5.2-1: Short-term Diffusion Coefficient at 1.6 km
Value
Diffusion Coefficient /Q ( s/m3)
hourly 0-8 hours 8-24 h 1-4 days 4-30 days
Mean 5.68 x 10 -7 5.64 x 10 -7 5.65 x 10 -7 5.68 x 10 -7 5.73 x 10 -7 Max 4.97 x 10 –5 1.06 x 10 –5 6.78 x 10 –6 2.09 x 10 –6 8.08 x 10 –7 Min 9.02 x 10 –9 4.80 x 10 -8 6.98 x 10 –8 1.95 x 10 -7 3.34 x 10 -7 5 % 1.68 x 10 -7 2.73 x 10 -7 2.86 x 10 -7 3.30 x 10 -7 4.12 x 10 -7 50 % 4.98 x 10 -7 5.03 x 10 -7 5.05 x 10 -7 5.10 x 10 -7 5.83 x 10 -7 95 % 1.06 x 10 -6 1.00 x 10 –6 9.52 x 10 -7 9.04 x 10 -7 7.53 x 10 -7
Table 1.2.5.2-2: Short-term Diffusion Coefficient at 5.0 km
From the above two tables, it can be deduced that the mean value of the dilution factor at 1.6 km is 6.82 x 10 –7 s/m3 for both hourly and 8-hourly data. This can be compared with the sector-averaged long-term mean dilution factor of 3.28 x 10 –8 s/m3. The comparable values for the 5-km distance are 5.68 x 10 –7 s/m3 (1-hour data), 6.64 x 10 –7 s/m3 (8 hourly data) and 2.43 x 10 –8 s/m3 (annual averaged value).
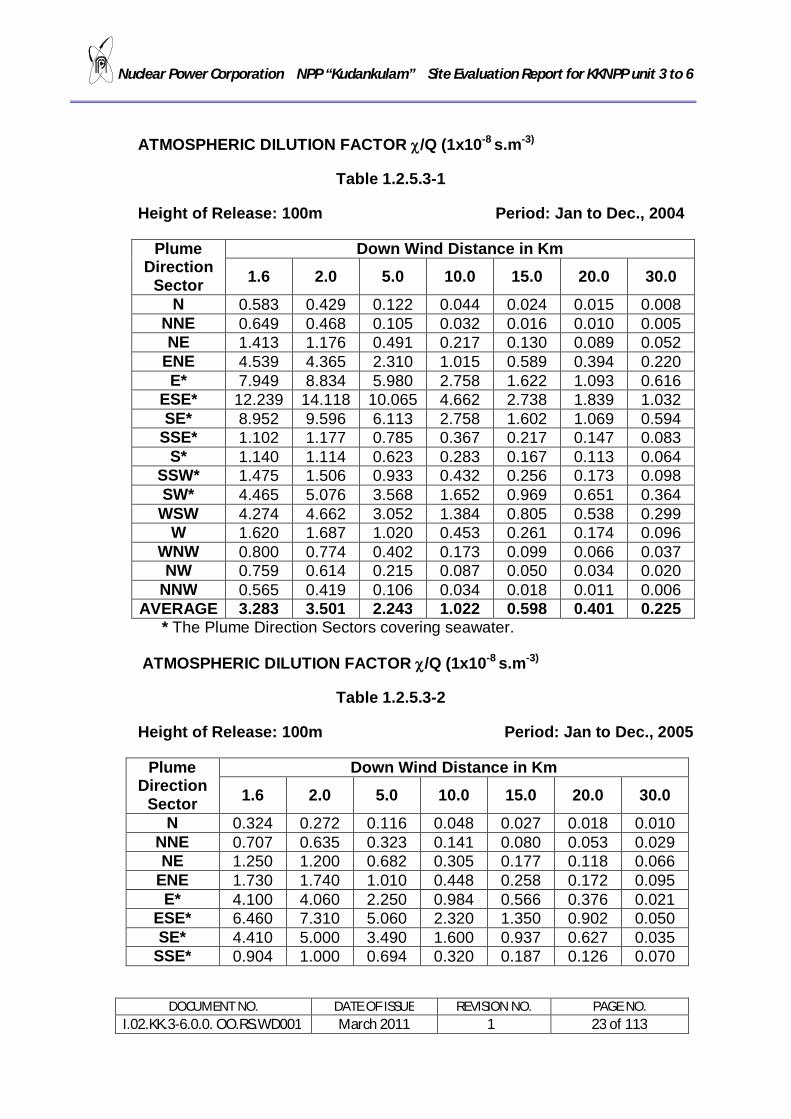
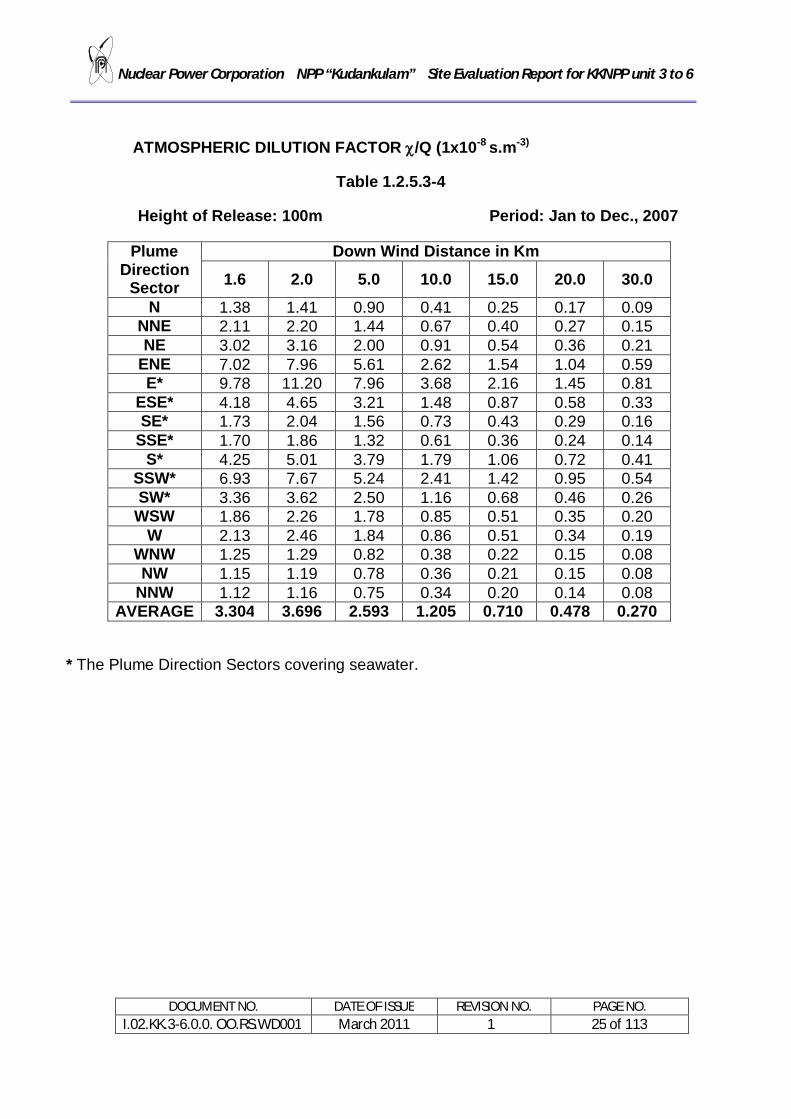
1.2.5.3 Long term Diffusion Estimates
Estimates of annual average atmospheric transport and diffusion characteristics up to 30 Kms have been evaluated from the wind speed and direction data obtained from the met station at KKNPP Site.
These annual average atmospheric dilution factors /Q (s/m3) for KKNPP site were computed through Gaussian Plume Model at various downward distances(1.6Km,2Km,5Km,10Km,15Km,20Km and 30Km) in 16 plume sectors using Triple Joint Frequency Distribution of wind speed, wind direction and stability category for the year 2004 to 2007.
At 1.6Km distance the maximum annual average dilution factor was 12.24x10⁻⁸ s/m3 obtained in ESE plume sector and the minimum dilution was 0.324 x10⁻⁸ s/m3 in N plume sector during the years 2004 to 2007. The annual average atmospheric dilution factors /Q (s/m3) for various downward distances during the period 2004 to 2007 are given below in tables 1.2.5.3-1 to 1.2.5.3-4 respectively.
Nuclear Power Corporation NPP “Kudankulam” Site Evaluation Report for KKNPP unit 3 to 6
DOCUMENT NO. DATE OF ISSUE REVISION NO. PAGE NO. I.02.KK.3-6.0.0. OO.RS.WD001 March 2011 1 23 of 113
ATMOSPHERIC DILUTION FACTOR /Q (1x10⁻⁸ s.m-3)
Table 1.2.5.3-1
Height of Release: 100m Period: Jan to Dec., 2004
Plume Direction
Sector
Down Wind Distance in Km
1.6 2.0 5.0 10.0 15.0 20.0 30.0 N 0.583 0.429 0.122 0.044 0.024 0.015 0.008
NNE 0.649 0.468 0.105 0.032 0.016 0.010 0.005 NE 1.413 1.176 0.491 0.217 0.130 0.089 0.052
ENE 4.539 4.365 2.310 1.015 0.589 0.394 0.220 E* 7.949 8.834 5.980 2.758 1.622 1.093 0.616
ESE* 12.239 14.118 10.065 4.662 2.738 1.839 1.032 SE* 8.952 9.596 6.113 2.758 1.602 1.069 0.594
SSE* 1.102 1.177 0.785 0.367 0.217 0.147 0.083 S* 1.140 1.114 0.623 0.283 0.167 0.113 0.064
SSW* 1.475 1.506 0.933 0.432 0.256 0.173 0.098 SW* 4.465 5.076 3.568 1.652 0.969 0.651 0.364
WSW 4.274 4.662 3.052 1.384 0.805 0.538 0.299 W 1.620 1.687 1.020 0.453 0.261 0.174 0.096
WNW 0.800 0.774 0.402 0.173 0.099 0.066 0.037 NW 0.759 0.614 0.215 0.087 0.050 0.034 0.020
NNW 0.565 0.419 0.106 0.034 0.018 0.011 0.006 AVERAGE 3.283 3.501 2.243 1.022 0.598 0.401 0.225
* The Plume Direction Sectors covering seawater.
ATMOSPHERIC DILUTION FACTOR /Q (1x10⁻⁸ s.m-3)
Table 1.2.5.3-2
Height of Release: 100m Period: Jan to Dec., 2005
Plume Direction
Sector
Down Wind Distance in Km
1.6 2.0 5.0 10.0 15.0 20.0 30.0 N 0.324 0.272 0.116 0.048 0.027 0.018 0.010
NNE 0.707 0.635 0.323 0.141 0.080 0.053 0.029 NE 1.250 1.200 0.682 0.305 0.177 0.118 0.066
ENE 1.730 1.740 1.010 0.448 0.258 0.172 0.095 E* 4.100 4.060 2.250 0.984 0.566 0.376 0.021
ESE* 6.460 7.310 5.060 2.320 1.350 0.902 0.050 SE* 4.410 5.000 3.490 1.600 0.937 0.627 0.035
SSE* 0.904 1.000 0.694 0.320 0.187 0.126 0.070

Nuclear Power Corporation NPP “Kudankulam” Site Evaluation Report for KKNPP unit 3 to 6
DOCUMENT NO. DATE OF ISSUE REVISION NO. PAGE NO. I.02.KK.3-6.0.0. OO.RS.WD001 March 2011 1 24 of 113
S* 0.670 0.756 0.556 0.263 0.155 0.105 0.059 SSW* 1.23 1.40 1.03 0.487 0.288 0.194 0.109 SW* 3.820 4.260 2.980 1.380 0.812 0.546 0.306
WSW 4.670 4.730 2.760 1.230 0.716 0.479 0.267 W 1.560 1.630 1.010 0.459 0.268 0.179 0.010
WNW 1.360 1.480 0.964 0.439 0.256 0.171 0.096 NW 1.560 1.390 0.596 0.246 0.139 0.092 0.051
NNW 0.590 0.498 0.192 0.075 0.042 0.027 0.015 AVERAGE 2.209 2.335 1.482 0.672 0.391 0.262 0.080
* The Plume Direction Sectors covering seawater.
ATMOSPHERIC DILUTION FACTOR /Q (1x10⁻⁸ s.m-3)
Table 1.2.5.3-3
Height of Release: 100m Period: Jan to Dec., 2006
Plume Direction
Sector
Down Wind Distance in Km
1.6 2.0 5.0 10.0 15.0 20.0 30.0 N 1.08 1.15 0.772 0.362 0.216 0.147 0.084
NNE 1.44 1.53 1.04 0.482 0.283 0.19 0.107 NE 2.14 2.35 1.63 0.756 0.446 0.301 0.170
ENE 3.9 4.77 3.77 1.79 1.06 0.719 0.407 E* 10.6 13.6 11.1 5.24 3.08 2.07 1.16
ESE* 3.2 3.98 3.13 1.47 0.868 0.584 0.328 SE* 1.29 1.50 1.14 0.536 0.316 0.212 0.119
SSE* 1.15 1.33 1.01 0.473 0.278 0.187 0.105 S* 5.61 6.65 5.09 2.39 1.41 0.945 0.530
SSW* 5.33 6.26 4.74 2.22 1.31 0.881 0.495 SW* 2.64 2.98 2.15 1.00 0.59 0.397 0.223
WSW 2.11 2.37 1.73 0.814 0.482 0.327 0.185 W 1.38 1.59 1.18 0.553 0.326 0.220 0.124
WNW 1.15 1.24 0.835 0.386 0.227 0.153 0.086 NW 0.76 0.805 0.547 0.256 0.152 0.103 0.058
NNW 0.96 1.00 0.672 0.315 0.187 0.127 0.072
AVERAGE
2.79
3.31
2.53
1.19
0.70
0.47
0.26
* The Plume Direction Sectors covering seawater.
Nuclear Power Corporation NPP “Kudankulam” Site Evaluation Report for KKNPP unit 3 to 6
DOCUMENT NO. DATE OF ISSUE REVISION NO. PAGE NO. I.02.KK.3-6.0.0. OO.RS.WD001 March 2011 1 25 of 113
ATMOSPHERIC DILUTION FACTOR /Q (1x10⁻⁸ s.m-3)
Table 1.2.5.3-4
Height of Release: 100m Period: Jan to Dec., 2007
Plume Direction
Sector
Down Wind Distance in Km
1.6 2.0 5.0 10.0 15.0 20.0 30.0 N 1.38 1.41 0.90 0.41 0.25 0.17 0.09
NNE 2.11 2.20 1.44 0.67 0.40 0.27 0.15 NE 3.02 3.16 2.00 0.91 0.54 0.36 0.21
ENE 7.02 7.96 5.61 2.62 1.54 1.04 0.59 E* 9.78 11.20 7.96 3.68 2.16 1.45 0.81
ESE* 4.18 4.65 3.21 1.48 0.87 0.58 0.33 SE* 1.73 2.04 1.56 0.73 0.43 0.29 0.16
SSE* 1.70 1.86 1.32 0.61 0.36 0.24 0.14 S* 4.25 5.01 3.79 1.79 1.06 0.72 0.41
SSW* 6.93 7.67 5.24 2.41 1.42 0.95 0.54 SW* 3.36 3.62 2.50 1.16 0.68 0.46 0.26
WSW 1.86 2.26 1.78 0.85 0.51 0.35 0.20 W 2.13 2.46 1.84 0.86 0.51 0.34 0.19
WNW 1.25 1.29 0.82 0.38 0.22 0.15 0.08 NW 1.15 1.19 0.78 0.36 0.21 0.15 0.08
NNW 1.12 1.16 0.75 0.34 0.20 0.14 0.08 AVERAGE 3.304 3.696 2.593 1.205 0.710 0.478 0.270
* The Plume Direction Sectors covering seawater.
Nuclear Power Corporation NPP “Kudankulam” Site Evaluation Report for KKNPP unit 3 to 6
DOCUMENT NO. DATE OF ISSUE REVISION NO. PAGE NO. I.02.KK.3-6.0.0. OO.RS.WD001 March 2011 1 26 of 113
1.3 Hydrology & Hydro-geology
1.3 .1 Introductions: Site & Facilities
Kudankulam site is a coastal site on the shores of Gulf of Mannar located on the South-Eastern tip of India near Kanyakumari. It is located in Radhapuram Taluk of Tirunelveli – Kattabomman district of Tamilnadu state. The site area slopes towards the sea about 1 in 30 to 1 in 40. The ground elevation varies from + 4.00 m near shore to +28.00 m above mean sea level (MSL) at the 2.0 Km plant boundary.
The main plant structures for unit 1&2 are located within the coordinate 000 to 1000 East & 100 South to 600 North in the face of Gulf of Mannar coast. The proposed islands for unit 3&4 and unit 5&6 was decided to be of similar configuration. The centre line (North parallel line) for unit 3to6 is proposed to be kept that of same of Unit 1&2. A sketch of the proposed site layout for unit 1to6 is enclosed at Annexure 1.1-2. By keeping the proposed island in the same alignment as that of unit 1&2 will help in planning similar type of outfall facilities as that of unit 1&2. Central Water and Power Research Station (CWPRS), Pune was consulted to advise NPCIL about the type of proposed intake & outfall system for the thermal dispersion of hot water discharge from all the 6 units. CWPRS vide their Technical Report 4517 dt January 2008 and subsequent supplementary report dt June 2008, suggested an optimal scheme of intake & out fall encompassing the out fall of all the six units to be let into one wide common discharge channel of width approximately 270m at top & 180m at bottom and length of the channel approximate 4km with two gates at both ends. The gates are to be controlled from the control room depending upon the seasonal variation of current direction. By this study it has been observed that operation of all the six units with full capacity can be continued without violating the norms of MOEF regarding condenser discharge temperature at the confluence ( greater than 7OC of ambient ). The proposed layout of hydro technical structures for units 1 to 6 is enclosed at Annexure 1.3-1. The thermal dispersion of the hot water is also given in the same Annexure.
Further presently RF designers are evaluating various options of the intake and out fall scheme by carrying out mathematical thermo hydraulic studies. The final scheme will be selected based on the techno economic evaluation of the feasible schemes, and taking into consideration ease of construction, under sea inlet for prevention of floating debris / oil entering the intake, minimum impact to the shore line etc.

Nuclear Power Corporation NPP “Kudankulam” Site Evaluation Report for KKNPP unit 3 to 6
DOCUMENT NO. DATE OF ISSUE REVISION NO. PAGE NO. I.02.KK.3-6.0.0. OO.RS.WD001 March 2011 1 27 of 113
1.3.2 Quantity & Quality of Water for Plant Use
1.3.2.1 Potable Water (Fresh Water)
The total potable water requirement for Unit 3 to 6 is mainly to cater for domestic use, make up to service water, fire water and DM plant water. The total quantity of potable water required for twin units of 1000MWe is about 6742 m3 per day. This requirement is proposed to be met by installing desalination plant of adequate capacity (7680 m3 per day) similar to Unit 1&2.
The quality of fresh potable water as received from the Desalination Plant is enclosed at Annexure 1.3-2
1.3.2. 2 Service Sea Water
The availability of sea water for condenser and other cooling purposes can be achieved by the proposed intake and out fall facility studied by CWPRS, Pune vide their report mentioned above. A dyke intake pool is already in existence for unit 1&2. Similar dyke pool for other units will create a stationary water front in the Gulf of Mannar as observed during the thermo hydraulic study conducted by CWPRS, Pune. CWPRS suggested under sea tunnel / small Dyke Pool for two units each as intake for the respective units of KKNPP 3-6. The total quantity of sea water required for cooling as well as other safety related use was calculated by the Designer is 2.9 lakhs cubic metre / hour for each unit of 1000 MWe. This quantity of water will be available from Gulf of Mannar sea for all the six units.
Detailed Biofouling studies have been carried out for the area around the Kudankulam Site by M/s CECRI, Karaikudi during 1994. They had recommended continuous chlorination for addressing the bio fouling aspects. This is being implemented at the intake location of Unit 1 and 2. Similarly for units 3 to 6 also chlorination will be considered for controlling the Biofouling of the intakes. Also experience gained from the working of Units 1&2 will be an added advantage.
The quality of sea water is same as that of Unit 1 & 2 and is reproduced as Annexure 1.3-3
1.3.3 Ground Water Movement, River & Lake Current
As there is no lake, river and other water source at or near the plant site, no water control structures exist. Bore hole study carried out at site indicate very low yield of ground water and generally ground water levels varies from 5m to 7m below ground level.
The main source of ground water recharge is from the scanty rainfall during the North East monsoon in October – December period. The ground water flow is towards the south i.e., towards the Gulf of Mannar. A hydro geological

Nuclear Power Corporation NPP “Kudankulam” Site Evaluation Report for KKNPP unit 3 to 6
DOCUMENT NO. DATE OF ISSUE REVISION NO. PAGE NO. I.02.KK.3-6.0.0. OO.RS.WD001 March 2011 1 28 of 113
map showing the ground water table contour and the its movement around the Kudankulam area is given in Annexure 1.3 -4
1.3.4 Contamination
The dilution characteristics of sea water off Kudankulam coast was studied by National Institute of Oceanography (NIO) Goa. It was observed that the overall dilution of the order of 10 times is expected at a point about 2 Km from the shore, for instantaneous releases. It is also observed that no density stratification is expected in the shallow waters of Kudankulam due to efficient mixing in the seawater.
In the liquid pathway dose calculation the credit of dilution in sea is not considered, the dilution due to its mixing with condenser cooling water, is considered.
The liquid effluents with very low activity are released to the sea after proper dilution with the condenser discharge adhering to the acceptable limit.
1.3.5 Tidal Effect
Low tide
The effect of variation of tide levels in Kudankulam area is limited to 0.5 m. The lowest Low Water Level (LLWL) in the sea of Kudankulam is estimated to be – 1.5 m in respect of MSL considering a set down of 1.0m due to storm surge coinciding with the lowest tide.
The LWL at Kudankulam works out as –0.5 m MSL considering only the tidal variations. The outfall channel bottom at its outlet just after the seal pit will be ensured to be 2 m below LWL (tidal effect) i.e. at -2.5 m MSL. As the cooling water is drawn from the sea with intake structures designed taking in to account the LLWL, the reduced flow conditions is not expected to occur under Lowest Low Water Level.
High Tide
Based on the available data on the tidal variations the high tide levels for Kudankulam are given below:
i) Mean high water spring - 0.75 m
ii) Mean high water neap - 0.53 m
From the data observed at Tuticorin port for 19 year period ( 1970 to 88) for a return period of 10000 years the high water level works out to 1.32 m with respect to Chart Datum.(i.e. 0.84m with respect to mean sea level). By

Nuclear Power Corporation NPP “Kudankulam” Site Evaluation Report for KKNPP unit 3 to 6
DOCUMENT NO. DATE OF ISSUE REVISION NO. PAGE NO. I.02.KK.3-6.0.0. OO.RS.WD001 March 2011 1 29 of 113
considering 10% exceedance, the maximum tide level works out to 1.42 m with respect to Chart Datum. This value has been considered in evaluating the safe grade elevation of the site.
1.3.6 Flooding Protection Requirement
For Units 1 & 2 the safe grade elevation was estimated to be equal to 5.44m w.r.t. MSL, wherein 2.5m tsunami height was considered. Keeping an additional 2m margin, above this calculated level of 5.44m, the final safe grade elevation of KKNPP site was arrived to be equal to 7.5m MSL.
All the safety related buildings in Unit 3 to 6 are located above the safe grade elevation of +7.5m which is expected to take care of the any increase in the estimated height of tsunami level in the east coast of India. The latest tsunami incident in 2004 December in Sumatra, Indonesia had caused a rise in water level of about 2.0 m only at the KK Site coast.
1.3.7 Coastal Cyclone & Seiches
The wind set up for the storm surge, comprises of surge due to inverted barometric effect or pressure deficiency and surge due to wind stress on sea surface.
It is observed by IMD that only the following 5 storms have either passed over the Gulf of Mannar or south of Kanyakumari that could be of some concern.
The storm which passed 100km North of KKNPP site on 23-24/11/78 had a maximum wind of 62 knots. The total surge due to inverted barometric effect and wind stress fort he above storm works out to 1.4m
The maximum Storm surge calculated based the 1977 Divi (Andhra Pradesh) cyclone, super imposed at Kudankulam site is 2.46m. The safe grade level of 7.5m ( with 2m safety margin ) has been adopted based on storm surge of 2.46m.
S. No. Date Details
1. 29/11/1912 Severe storm passed 100 Km North of site
2. 18/12/1912 Storm passed over Kanyakumari
3. 29/11/1922 Severe storm passed right over the site
4. 6/11/1925 Storm 150 Km south of site.
5. 23-24/11/1978 Severe storm passed 100 Km North of site.
Nuclear Power Corporation NPP “Kudankulam” Site Evaluation Report for KKNPP unit 3 to 6
DOCUMENT NO. DATE OF ISSUE REVISION NO. PAGE NO. I.02.KK.3-6.0.0. OO.RS.WD001 March 2011 1 30 of 113
Based on 80 years data the possibilities of rise in water level due to seiches is ruled out.
1.3.8 Effect of Dam failure
There are four dams located about 65km from the KKNPP plant site on the Western side of the Western Ghats, their effect on plant site is nil due to any dam failure. This is because KKNPP is located in the East side of Western Ghats and in case of a postulated failure of these dams, water will flow towards the West as rivers flow towards the West direction.
1.3.9 Shore line stability
Shore line stability studies of the Kudankulam Coast have been carried out by M/s CWPRS Pune. (Technical report No: 3830 Dt. October 2001). The report concludes that the Shore Line at Kudankulam may be considered as stable.
Brief of the study
Shoreline stability study was carried out using remote sensing technique by analyzing digital satellite data for a period of about 8 to 10 years covering a length of about 10 km along Kudankulam coast. The Kudankulam coast was also inspected by a walk through along the coast towards either side of the project site.
The study was carried out by doing the following activities:
Collection of available information such as tide tables and tidal information in the region of interest.
Selection of remotely sensed digital data from satellite passes covering the area of interest, satisfying spatial and temporal conditions of study area and the status of tide at the time of satellite pass.
Digital processing of satellite imageries for different years to compare / ascertain submergence and recedence which includes geo-referencing and delineation of land-water boundary
Superimposition of land-water boundary contours of imageries for different years for the comparison of shoreline.
Interpretation of imageries processed for shoreline stability analysis to arrive at conclusion.
Conclusions
The shoreline at Kudankulam was found to be fairly stable during the period of years between 1992 to 2000. There is no indication of shoreline erosion or
Nuclear Power Corporation NPP “Kudankulam” Site Evaluation Report for KKNPP unit 3 to 6
DOCUMENT NO. DATE OF ISSUE REVISION NO. PAGE NO. I.02.KK.3-6.0.0. OO.RS.WD001 March 2011 1 31 of 113
accretion along the coast during the whole period as well as intermediate periods. The salient features of Kudankulam coast, as reported by the site inspection study also carried out by CWPRS earlier indicate stable shoreline at Kudankulam. This supports the validity of the study on shoreline stability at Kudankulam carried out using remote sensing technique.
1.4 GEOLOGY 1.4.1 Basic Geology of Kudankulam site Basic Geology
The site is located in the coastal plains of the east coast, which represents a flat undulating country and landforms sculptured by marine action and Aeolian agents. The basement rock in the area is charnockite ( hypersthene granite) trending ENE. Lying unconformably over the charnockites are calcareous sandstones, dull white to pale brown in colour, fine grained and indurate. The khondalite suite of rocks comprise of high-grade metamorphic rocks such as granetiferous gneisses and calcareous granulites. Further north, bands of quartzite and crystalline lime stones also occur. Bodies of charnockites, linear ( trending NW ) and lenticular in shape occur within the khondalite.
Regional geology
On a regional basis, the rock formations explored in Tirunelveli district consist of micaceous and granetiferous gneisses and associated charnockites together with other meta sedimentary rock, viz., quartzite and crystalline lime stones belonging to Archaean system of Precambrian age. These are overlain by sub recent raised beaches formed of buff coloured sandstones, shell - limestone ( kankar ), Teri soil ( red loamy soil ) and beach sands.
The distribution of different rock types in the area is shown in the geological map enclosed in Annexure 1.4 -1.
The sand dunes are generally confined to the coastal belt in the Nanguneri taluk. The dunes are of two kinds, the older red sands of teris and the younger white coastal dunes. There are a few deposits of tuffaceous kankar associated with the calcareous sandstones. A fairly extensive occurrence of this type of kankar limestones is noticed capping the ridges along the coastal track south of Kudankulam.
The regional trend of charnockites is ENE-WSW with steep dip of 70 deg to the SSW. In the north, the strike abruptly changes to WNW- ESE or E-W due to folding. Occasionally, NE and NNE dips are also noticed in some granetiferous gneisses and charnockites in the Nanguneri region. A NW-SE line of discordance (6-6), probably indicating a zone of faulting and thrusting

Nuclear Power Corporation NPP “Kudankulam” Site Evaluation Report for KKNPP unit 3 to 6
DOCUMENT NO. DATE OF ISSUE REVISION NO. PAGE NO. I.02.KK.3-6.0.0. OO.RS.WD001 March 2011 1 32 of 113
runs from NW of Rajapalayam upto 17 Kms NW of Tiruchendur. Along the line of discordance, lenses of anorthosites and pink gneisses are also reported.
Site geology Site Physiography
Physiographically the area forms a gentle undulating plain country. Occasionally the mounds reaching to a height upto 49 m are found here and there. In view of the low relief, small hills and gullies constitute the minor drainage lines and trend due south. The minor existing drainage lines do not give any clue to the physiographic development of the area. Actually there is a gradual drop of the elevations towards the coast. Most of the minor drainage is from north to south in the area.
Local landforms
The landforms of the Kudankulam area are attributed to two principal agents viz, fluvial and marine. The fluvial forms present are an older surface with palaeo channels and associated features, while the present day forms are present day flood plain with associated channel and point bars and natural levels. The marine forms present in the area are wave cut terraces, standard lines, tidal flats, coastal ridges / dunes and lagoons. Site topographic map showing the principal plant facility area is enclosed as Annexure 1.4 -2. Configuration of land forms and geological set up:
The geomorphologic / geological characteristics of the site indicate the stable nature of the NPP site during construction and operation. The NPP site forms part of the characteristic terrain of the archaean super group and overlain by tertiary sandstones. The sandstones are fine grained composed of quartz and feldspars with calcareous matrix. These sandstones are generally horizontal but at places show a dip of 8 deg towards NW. There are two sets of joints within the sandstone and these are mostly tight. The Archaean super group is underlying the sandstone. The Kudankulam site being a part of peninsular region composed of a peninsular shed with geologically ancient rocks of diverse origin and having exposed for long ages to denudation and approaching penetration. Over these ancient rocks lie a few basins of Precambrian and later sediments and extensive sheets of horizontally bedded lavas of Deccan trap formation. The mesozoaic and tertiary sediments are found mainly along coastal regions.
1.4.2 Structural geology around Kudankulam
The major rock type in the Kudankulam site area is banded and foliated migmatic granetiferous biotite gneisses enclosing lenticular bands of charnockite and quartzite, exposed in outcrops occurring as small hillocks in an otherwise plain country. These rocks extend right up to the seacoast near

Nuclear Power Corporation NPP “Kudankulam” Site Evaluation Report for KKNPP unit 3 to 6
DOCUMENT NO. DATE OF ISSUE REVISION NO. PAGE NO. I.02.KK.3-6.0.0. OO.RS.WD001 March 2011 1 33 of 113
Kudankulam and outcrops are noticed between the high tide and low tide lines along the shore. Their general trend is ENE- WSW with dips of 50 deg-70 deg towards SSE.
Locally in the site area, outcrops of shell lime stones of variable thickness ( from 2 cm to about few metres ) are exposed occasionally from the coast line for a distance of about 800 metres in land, sub-horizontally overlaying the biotite granite-gnesis. This shell limestone is a typical shallow water marine transgression deposit during upper Pleistocene times. Quartz veins and pegmatites occur as intrusive in the country rock. Only one dolerite dyke was noticed cutting the garnetiferous biotite gneisses in a well section in this area. The three sets of prominent joints observed in the gneisses are joints parallel to foliation of gneisses and those tending N 25 deg. E and N 10 deg. W. Most of quartz veins and pegmatites in the gneisses are 5 to 13 cm wide and run parallel to the foliation.
1.4.2.1 Lithology and Stratigraphy
The NPP main plants of Unit 3 to 6 at Kudankulam site shall be located between lines 0-0 and 600 N in N-S direction and 100 W to 1700 W in the E-W direction. The discharge channel is proposed as a canal running parallel to coast line from 1900 E to 2700 W collecting the hot water discharges from the condensers of the different units. Auxiliary buildings such as waste water treatment structures, boiler house, oil storage structures and tanks etc, are planned to be located on either side of the main plant. Detailed subsoil investigation has been carried out for the area for Unit 3 & 4 and limited investigation for the area of Unit 5& 6.
The investigation for the unit 3 & 4 included drilling of 109 boreholes of depth varying from 20 m to 100m. The total depth drilled was about 4268m. In addition to the drilling of the boreholes, various laboratory tests on the soil and rock samples collected were carried out. Various field tests, such as plate load tests, pressure meter test, permeability tests, were also carried out. Geophysical tests such as cross hole seismic test, seismic refraction test, electrical resistivity test and density logging by Gamma logging were also done.
In the unit 5 & 6 area a total of 29 boreholes with depths varying from 30 to 100m were drilled. Laboratory tests on soil / rock samples and field permeability tests and pressure meter tests were carried out. Seismic refraction survey and electrical resistivity survey were also done in the proposed unit 5 & 6 area.
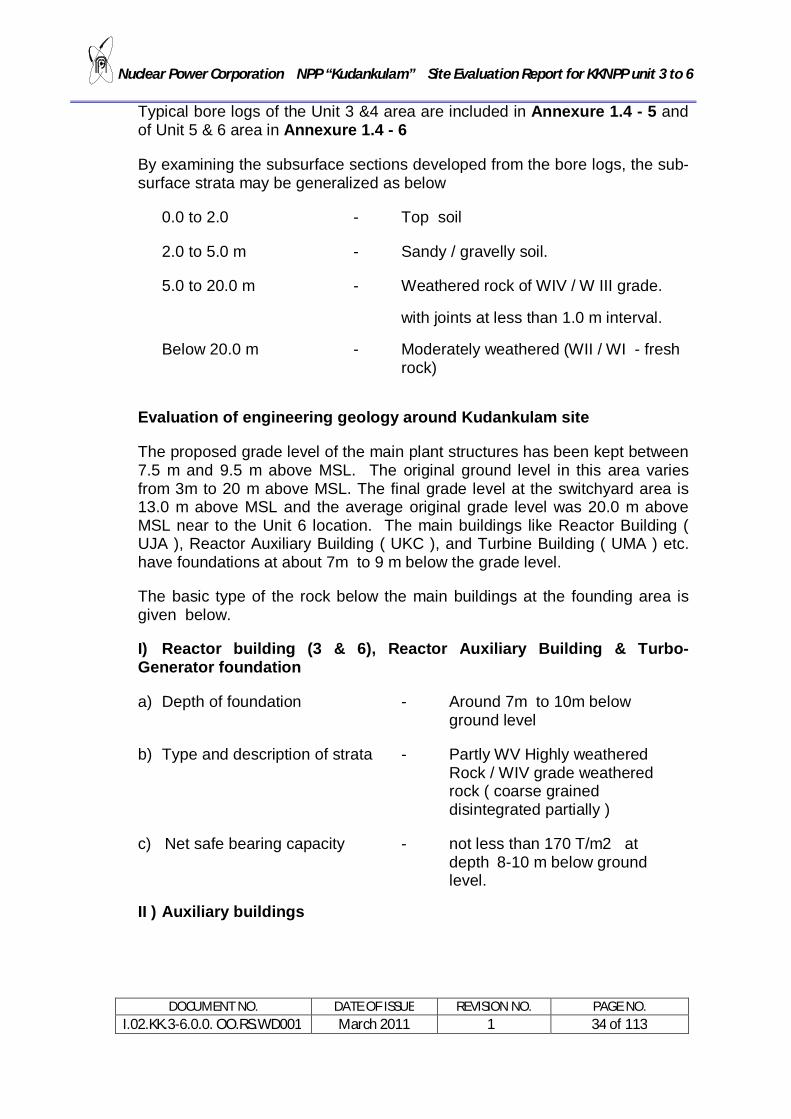
Nuclear Power Corporation NPP “Kudankulam” Site Evaluation Report for KKNPP unit 3 to 6
DOCUMENT NO. DATE OF ISSUE REVISION NO. PAGE NO. I.02.KK.3-6.0.0. OO.RS.WD001 March 2011 1 34 of 113
Typical bore logs of the Unit 3 &4 area are included in Annexure 1.4 - 5 and of Unit 5 & 6 area in Annexure 1.4 - 6
By examining the subsurface sections developed from the bore logs, the sub-surface strata may be generalized as below
0.0 to 2.0 - Top soil
2.0 to 5.0 m - Sandy / gravelly soil.
5.0 to 20.0 m - Weathered rock of WIV / W III grade.
with joints at less than 1.0 m interval.
Below 20.0 m - Moderately weathered (WII / WI - fresh rock)
Evaluation of engineering geology around Kudankulam site
The proposed grade level of the main plant structures has been kept between 7.5 m and 9.5 m above MSL. The original ground level in this area varies from 3m to 20 m above MSL. The final grade level at the switchyard area is 13.0 m above MSL and the average original grade level was 20.0 m above MSL near to the Unit 6 location. The main buildings like Reactor Building ( UJA ), Reactor Auxiliary Building ( UKC ), and Turbine Building ( UMA ) etc. have foundations at about 7m to 9 m below the grade level.
The basic type of the rock below the main buildings at the founding area is given below.
I) Reactor building (3 & 6), Reactor Auxiliary Building & Turbo-Generator foundation
a) Depth of foundation - Around 7m to 10m below ground level
b) Type and description of strata - Partly WV Highly weathered Rock / WIV grade weathered rock ( coarse grained disintegrated partially )
c) Net safe bearing capacity - not less than 170 T/m2 at depth 8-10 m below ground level.
II ) Auxiliary buildings
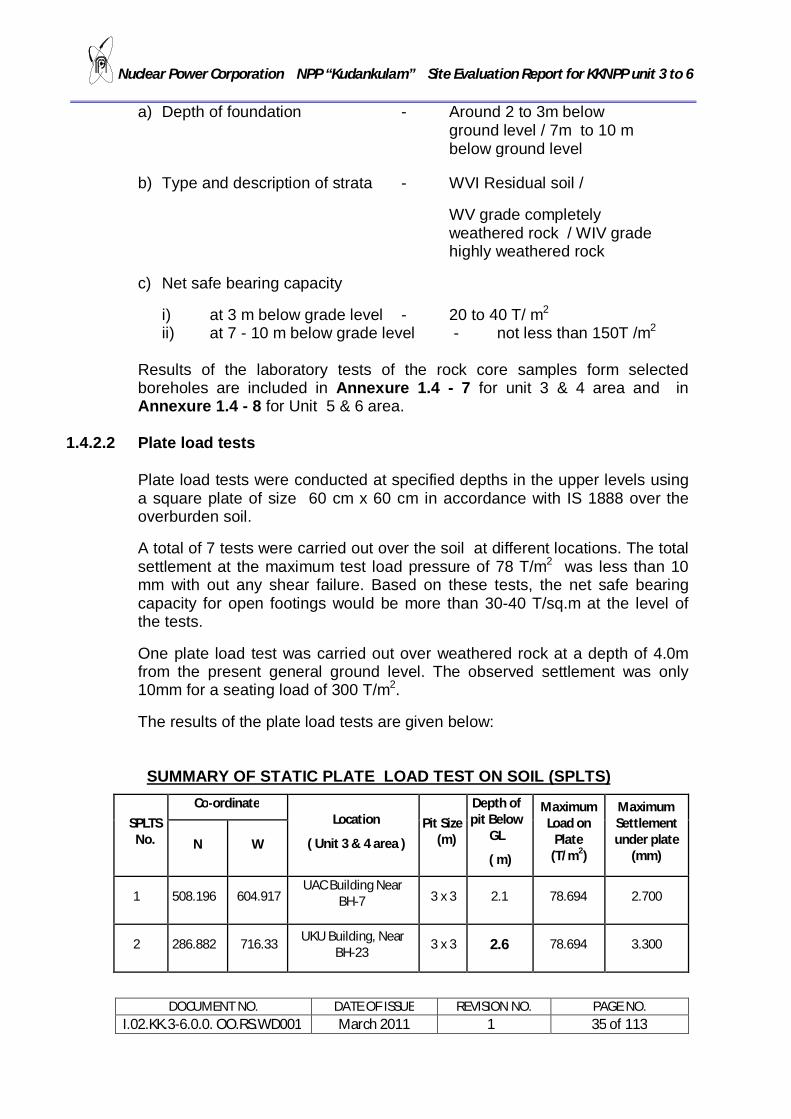
Nuclear Power Corporation NPP “Kudankulam” Site Evaluation Report for KKNPP unit 3 to 6
DOCUMENT NO. DATE OF ISSUE REVISION NO. PAGE NO. I.02.KK.3-6.0.0. OO.RS.WD001 March 2011 1 35 of 113
a) Depth of foundation - Around 2 to 3m below ground level / 7m to 10 m below ground level
b) Type and description of strata - WVI Residual soil /
WV grade completely weathered rock / WIV grade highly weathered rock
c) Net safe bearing capacity
i) at 3 m below grade level - 20 to 40 T/ m2 ii) at 7 - 10 m below grade level - not less than 150T /m2
Results of the laboratory tests of the rock core samples form selected boreholes are included in Annexure 1.4 - 7 for unit 3 & 4 area and in Annexure 1.4 - 8 for Unit 5 & 6 area.
1.4.2.2 Plate load tests
Plate load tests were conducted at specified depths in the upper levels using a square plate of size 60 cm x 60 cm in accordance with IS 1888 over the overburden soil.
A total of 7 tests were carried out over the soil at different locations. The total settlement at the maximum test load pressure of 78 T/m2 was less than 10 mm with out any shear failure. Based on these tests, the net safe bearing capacity for open footings would be more than 30-40 T/sq.m at the level of the tests.
One plate load test was carried out over weathered rock at a depth of 4.0m from the present general ground level. The observed settlement was only 10mm for a seating load of 300 T/m2.
The results of the plate load tests are given below:
SUMMARY OF STATIC PLATE LOAD TEST ON SOIL (SPLTS)
SPLTS No.
Co-ordinate Location
( Unit 3 & 4 area ) Pit Size
(m)
Depth of pit Below
GL
( m)
Maximum Load on
Plate (T/m2)
Maximum Settlement under plate
(mm) N W
1 508.196 604.917 UAC Building Near
BH-7
3 x 3 2.1 78.694 2.700
2 286.882 716.33 UKU Building, Near BH-23 3 x 3 2.6 78.694 3.300

Nuclear Power Corporation NPP “Kudankulam” Site Evaluation Report for KKNPP unit 3 to 6
DOCUMENT NO. DATE OF ISSUE REVISION NO. PAGE NO. I.02.KK.3-6.0.0. OO.RS.WD001 March 2011 1 36 of 113
3 134.425 722.130 UTF Building, Near BH-26 3 x 3 2.85 78.694 9.210
4 82.604 982.784 UGU , Near BH-73 3 x 3 1.6 78.694 0.345
5 155.294 780.489 UBF-04 Transformer Area 3 x 3 1.05 78.694 1.710
6 28.687 515.573 5 UKD, Near BH-85 3 x 3 1.50 78.694 5.710
7 115.654 318.201 Auxiliary Building,
Near BH 93 3 x 3 2.90 78.694
7.850
STATIC PLATE LOAD TEST ON ROCK
1
383.604 885.243
4-2 UKD,
Near BH-11 4.0 x 4.0 4.0 314.778 10.0325
The settlement curve for all the plate load tests are given in Annexure1.4-9.
1.4.2.3 Seismic wave transmission characteristic of the site
Geophysical surveys Geophysical surveys such as seismic refraction survey, electrical resistivity survey and seismic cross hole survey were conducted by M/s DBM Geotechnics and Construction Pvt Limited, to ascertain the thickness of various layers of soil and depths of rock and also to find design parameters such as the compressional wave velocity, shear wave velocity and electrical resistivity of soil etc. From the wave velocity, the dynamic modulus of elasticity and modulus of rigidity were also calculated. Cross Hole test: In the area of the proposed Unit 3 & 4 KKNPP site, a total of 8 nos of cross-hole studies were carried out for determining compressional and shear wave velocities. The locations of the tests are as given below:
Crosshole Number
Building Northing Westing Ground RL (m)
CHT-1 4 UKD 368.50 889.50 10.444
CHT-2 3 UKD 368.50 643.00 11.779
CHT-3 4 UJA 243.50 861.50 6.786
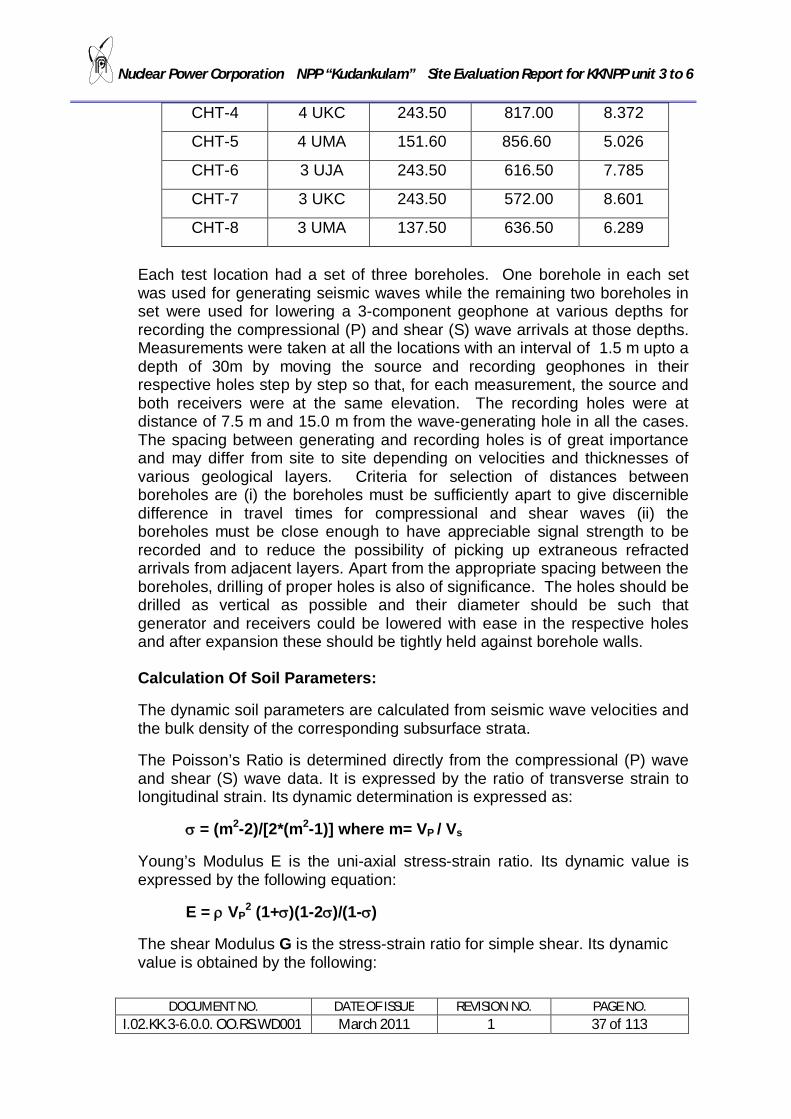
Nuclear Power Corporation NPP “Kudankulam” Site Evaluation Report for KKNPP unit 3 to 6
DOCUMENT NO. DATE OF ISSUE REVISION NO. PAGE NO. I.02.KK.3-6.0.0. OO.RS.WD001 March 2011 1 37 of 113
CHT-4 4 UKC 243.50 817.00 8.372
CHT-5 4 UMA 151.60 856.60 5.026
CHT-6 3 UJA 243.50 616.50 7.785
CHT-7 3 UKC 243.50 572.00 8.601
CHT-8 3 UMA 137.50 636.50 6.289
Each test location had a set of three boreholes. One borehole in each set was used for generating seismic waves while the remaining two boreholes in set were used for lowering a 3-component geophone at various depths for recording the compressional (P) and shear (S) wave arrivals at those depths. Measurements were taken at all the locations with an interval of 1.5 m upto a depth of 30m by moving the source and recording geophones in their respective holes step by step so that, for each measurement, the source and both receivers were at the same elevation. The recording holes were at distance of 7.5 m and 15.0 m from the wave-generating hole in all the cases. The spacing between generating and recording holes is of great importance and may differ from site to site depending on velocities and thicknesses of various geological layers. Criteria for selection of distances between boreholes are (i) the boreholes must be sufficiently apart to give discernible difference in travel times for compressional and shear waves (ii) the boreholes must be close enough to have appreciable signal strength to be recorded and to reduce the possibility of picking up extraneous refracted arrivals from adjacent layers. Apart from the appropriate spacing between the boreholes, drilling of proper holes is also of significance. The holes should be drilled as vertical as possible and their diameter should be such that generator and receivers could be lowered with ease in the respective holes and after expansion these should be tightly held against borehole walls. Calculation Of Soil Parameters:
The dynamic soil parameters are calculated from seismic wave velocities and the bulk density of the corresponding subsurface strata.
The Poisson’s Ratio is determined directly from the compressional (P) wave and shear (S) wave data. It is expressed by the ratio of transverse strain to longitudinal strain. Its dynamic determination is expressed as:
= (m2-2)/[2*(m2-1)] where m= VP / Vs
Young’s Modulus E is the uni-axial stress-strain ratio. Its dynamic value is expressed by the following equation:
E = VP2 (1+)(1-2)/(1-)
The shear Modulus G is the stress-strain ratio for simple shear. Its dynamic value is obtained by the following:

Nuclear Power Corporation NPP “Kudankulam” Site Evaluation Report for KKNPP unit 3 to 6
DOCUMENT NO. DATE OF ISSUE REVISION NO. PAGE NO. I.02.KK.3-6.0.0. OO.RS.WD001 March 2011 1 38 of 113
G = E/2 (1+ ) = Vs2
Bulk Modulus (k) is the ratio of the confining pressure to the fractional reduction of volume in response to the applied hydro static pres sure. The volume strain is the change in volume of the sample divided by the original volume. Bulk Modulus is also termed the Modulus of Incompressibility.
K = 1/3 [E/(1-2)]
Where is bulk density in Kg/m3, is Poisson’s ratio, VP is P-wave velocity in m/sec, Vs is S-wave velocity in m/sec. E & G & K are in N/m2.
The summary of the results of Cross hole test are given below: SUMMARY OF DETAILS OF CROSS HOLE TEST
S.No CHT No
Co Ordinates
BH No Depth
(m)
Avg Vp (m/s)
Avg Vs (m/s)
Avg Density (Kg/m3)
Avg Poisson
Ratio
Avg Youngs's Modulus
(Mpa)
Avg Shear
Modulus (Mpa)
North
West
1 CHT 1
368.50 889.50 BH 12 1.5 to 27.0
2561.66 1411.66 2877.77 0.29 19315.30 7607.21
2 CHT2
368.50 643.00 BH 17 1.5 to 27.0
2391.66 1313.33 2747.22 0.30 16681.32 6574.03
3 CHT 3
243.50 861.50 BH 33 1.5 to 27.0
2535.00 1402.22 2688.88 0.29 17608.01 6939.08
4 CHT 4
243.50 817.00 BH 35 1.5 to 27.0
2073.61 1124.72 2758.33 0.30 11534.61 4508.34
5 CHT 5
151.65 856.62 BH 41 1.5 to 27.0
2510.00 1390.00 2600.00 0.29 16464.35 6488.13
6 CHT 6
243.50 616.50 BH 56 1.5 to 27.0
2347.22 1306.38 2777.77 0.28 16251.69 6416.77
7 CHT 7
243.50 572.00 BH 58 1.5 to 27.0
2649.44 1489.44 2830.55 0.28 20030.39 7930.12
8 CHT 8
137.50 636.50 BH 67 1.5 to 27.0
2456.66 1355.55 2825.00 0.29 17208.73 6781.99
The results show shear wave velocities in the range of 400-700 m/s in the upper soil, 600-1400 m/s in weathered rock, and velocities in the range of 2200-2700 m/s at places higher in the rock strata.

Nuclear Power Corporation NPP “Kudankulam” Site Evaluation Report for KKNPP unit 3 to 6
DOCUMENT NO. DATE OF ISSUE REVISION NO. PAGE NO. I.02.KK.3-6.0.0. OO.RS.WD001 March 2011 1 39 of 113
The density values as obtained from logging of various boreholes by gamma – method have been used for calculations of various parameters.
The results of the crosshole test have been presented as tables along with the calculated parameters such as compressional and shear wave velocities, Poisson’s ratio, Young’s Modulus and Shear modulus in Annexure 1.4 - 10. Seismic Refraction Survey
Unit 3 & 4 area
The Seismic refraction survey was conducted along various lines on the proposed site. The setting of seismic survey lines, reduced level and co-ordinates of all shooting points were carried out prior to the start of the seismic refraction survey.
Total 9 Nos. of seismic lines were surveyed and the co-ordinates of the start and end points were marked. The co-ordinates and ground length surveyed are summarized in Table given below:
Summary of End Co-Ordinates of Seismic Survey Lines
S. No Line No Co-Ordinates Length (m) Start End
1 H1 41 N 100 W 41 N 1000 W 900 2 H2 153 N 100 W 153 N 1000 W 900 3 H3 244 N 400 W 244 N 1000 W 600 4 H4 353 N 400 W 353 N 1000 W 600 5 H5 508 N 400 W 508 N 1000 W 600 6 V1 530 W 00 N 530 W 600 N 600 7 V2 614 W 00 N 614 W 600 N 600 8 V3 720 W 00 N 720 W 600 N 600 9 V4 856 W 00 N 856 W 600 N 600
Stratigraphy as Per the Seismic Survey Results: Seismic wave velocity in soil and rock is dependent on the soil type and its condition. For rocks, degree of weathering, jointing, fracturing etc., are important. Based on the observed velocities in the surveyed area at Kudankulam site the stratigraphy can be summarized as follows: The seismic refraction survey of the site gives a geophysical model that corresponds to a three to four-layer stratigraphy. Based on P-wave refraction a three to four-layer model is established comprising shallow top soil layer on top followed by relatively compact layers. The second layer corresponds to highly weathered and decomposed rock, third layer of weathered rock and last layer of relatively fresh rock.

Nuclear Power Corporation NPP “Kudankulam” Site Evaluation Report for KKNPP unit 3 to 6
DOCUMENT NO. DATE OF ISSUE REVISION NO. PAGE NO. I.02.KK.3-6.0.0. OO.RS.WD001 March 2011 1 40 of 113
The top layer is overburden soil, followed by weathered rock and rock layers. The highest P wave velocities encountered are in the range of 4,500 m/s. The gradually changing strata as derived from the results have been presented in the velocity models on the following pages. The results of seismic refraction along different lines have been presented as sections with marking of depth and distance. The levels were taken using Total Station and Auto Levels all along the seismic lines. Seismic lines have been presented based on actual ground levels and incorporating topographic correction of the profiles. The seismic refraction survey revealed presence of inter-layering and confirmed that there is no significant lateral variation. There is no indication of any anomalous zone indicating sheared zone or fault zone traversing across survey lines. The results of the seismic refraction survey along with the velocity profiles are given in Annexure 1.4 - 11.
Unit 5 & 6 area
Total 6 Nos. of seismic lines were surveyed and the co-ordinates of the start and end points were marked. The co-ordinates and ground length surveyed are summarized in Table given below:
Summary of End Co-Ordinates of Seismic Survey Lines
S.No Line No Co-Ordinates Length (m) Start End
1 HW1 153 N 1100 W 153 N 1500 W 400 2 HW2 244 N 1100 W 153 N 1500 W 400 3 HW3 353 N 1100 W 244 N 1500 W 400 4 VW1 0 N 1100 W 400 N 1100 W 400 5 VW2 0 N 1300 W 400 N 1300 W 400 6 VW3 0 N 1440 N 400 N 1440 N 400
The results of the seismic refraction survey of the Unit 5 & 6 area along with the velocity profiles are given in Annexure 1.4 - 12.
1.4.3 The ground water level
The site area slopes towards the sea and the depth of the water table from the ground level is found to increase away from the coast. However the water table level was found to be fairly stable. The water table obtained at the different bore holes during the drilling and tabulated are enclosed in Annexure 1.4 - 13.
1.4.4 Field permeability test

Nuclear Power Corporation NPP “Kudankulam” Site Evaluation Report for KKNPP unit 3 to 6
DOCUMENT NO. DATE OF ISSUE REVISION NO. PAGE NO. I.02.KK.3-6.0.0. OO.RS.WD001 March 2011 1 41 of 113
Permeability tests carried out at the site in different bore holes had indicated a very low permeability value of less than 1 Lugeon. Double and single packer permeability tests were conducted to estimate the permeability of rocks at different levels.
1 lugeon unit = 1 litre of water taken per meter of test length ( I m length of the borehole ), per minute, at 10 bars pressure (150 psi approx) Also, 1 lugeon unit = 1.3 x 10- 5 cm/second (approx ) The volume of ground water seeping into excavation pit of the Reactor building Unit 1 & 2 was very low. This confirmed the low permeability value of the underlying rock.
1.4.5 Liquefaction potential
As the substrata is weathered rock and tightly jointed, and also as the water table level is at lower depths, the possibility of soil liquefaction does not exist at Kudankulam site.
1.4.6 Possibility of subsidence, land sliding
1. The basic geological features have been described in section 1.4.1
The geological studies indicate that karstic features are not present in the foundation media. The foundation is stable and do not subscribe to subsidence and swelling. The geo topographic set up at the site also overrules slides and slips and the formation of ravines and mud streams.
2. During the investigation, there was no report of loss of large scale drilling fluid / observance of cavities during drilling of the boreholes.
3. The foundation medium is stable in nature with no history of deposition and erosion, and the area is not prone to glacial deposits.
4. Kudankulam site is located on a weathered rock mass, which, though having joints at regular intervals, is very tightly held, ruling out possibility of sliding along joints.
Also, the foundation strata below the main buildings such as Reactor Building and Reactor Auxiliary Building will be further consolidated by cement grouting as carried out in the case of Unit 1&2. This is to fill all existing tightly held cracks within the weathered rock.
The periodic settlement reading taken during the construction period of the reactor building unit 1 indicated a very low settlement giving the indication that the foundation is stable and capable of taking the applied loads.

Nuclear Power Corporation NPP “Kudankulam” Site Evaluation Report for KKNPP unit 3 to 6
DOCUMENT NO. DATE OF ISSUE REVISION NO. PAGE NO. I.02.KK.3-6.0.0. OO.RS.WD001 March 2011 1 42 of 113
Nuclear Power Corporation NPP “Kudankulam” Site Evaluation Report for KKNPP unit 3 to 6
DOCUMENT NO. DATE OF ISSUE REVISION NO. PAGE NO. I.02.KK.3-6.0.0. OO.RS.WD001 March 2011 1 43 of 113
1.4.7 Stability of Slopes
The present topography is formed after years of weathering action by marine and aeolian agents. The ground profile has a gentle slope towards the seashore. The seashore marks the southern boundary of the site. Near the northern boundary a hill of about 40 to 45 m height above sea level, exists. The whole site slopes downward north to south at about 1 in 30 to 1 in 40 towards the shoreline. The site in general has a topsoil layer 4 to 6 meters thick above the weathered rock of various degrees. Since the topsoil is highly compacted, and also as the slope is gentle, the chances of slopes getting unstable is not present. Also, all the safety related buildings are located in well-defined terraces and hence there is no possibility of slope failure.
Embankments and Dams
A small water storage reservoir of capacity 65000 m3 has been constructed in the northern part of the plant area. The reservoir is constructed on a natural trough with an earthen embankment of about 7m high on one side. This embankment has been design checked for an earthquake of SSE level by M/s CWPRS Pune. M/s CWPRS, Pune, also studied the potential of liquefaction below the foundation of the embankment as well as the drainage through the embankment. The study revealed that the reservoir embankment is safe for all the above aspects. No other major embankments or dams are present at or near the site.

Nuclear Power Corporation NPP “Kudankulam” Site Evaluation Report for KKNPP unit 3 to 6
DOCUMENT NO. DATE OF ISSUE REVISION NO. PAGE NO. I.02.KK.3-6.0.0. OO.RS.WD001 March 2011 1 44 of 113
1.4.8 Construction notes from the experience of Unit 1 & 2 Construction.
No specific construction difficulties during the excavation or requirement of large scale dewatering was encountered during construction of Units 1&2 due to any of the site characteristics.
The only major natural incident to occur at site was the Tsunami of 26th December 2004, which caused an increase in the water level in the sea off Kudankulam coast by about 2.0m. This was well within the anticipated water level rise due to any Tsunami occurrence estimated for KKNPP Site( Refer PSAR report, Chapter 2 of KKNPP Unit 1 & 2 ).
1.4.9 References: The details included in the above section are from the various investigations
and studies carried out by the following agencies: A) Geological Survey of India A report on the detailed Geotechnical Investigation of the Kudankulam Atomic Power Project, Tamil Nadu B) AFCONS Sub Soil Investigation Report - Unit 1 & 2 C) DBM Geotechnics and Construction Pvt Ltd Sub soil investigation report in the area of Unit 3 to 6. D) Central Water and Power Research Station Geophysical investigations in the Unit 1& 2 area.
Nuclear Power Corporation NPP “Kudankulam” Site Evaluation Report for KKNPP unit 3 to 6
DOCUMENT NO. DATE OF ISSUE REVISION NO. PAGE NO. I.02.KK.3-6.0.0. OO.RS.WD001 March 2011 1 45 of 113
1.5 SEISMOLOGY
This section provides information regarding the seismic & geologic characteristics, Seismic history of the KKNPP Site & the region surrounding the Site, method followed for establishing the design basis vibratory ground motion. This section also gives the results of the investigations carried out by various agencies such as Geological Survey of India, National Geophysical Research Institute, Dr A.K. Ghosh & D. C. Banerjee, Atomic Minerals Division presently known as Directorate for Exploration and Research.
1.5.1 Seismology & Basic Geology Basic Geology
The site is located in the coastal plains of the east coast, which represents a flat undulating country and landforms sculptured by marine action and aeolian agents. In the Western portion of the area, are structural / denudation hills. The drainage courses in the area are in E-W direction for half their length ( near to the Western Ghats ), turning to NW-SE towards the coast.
The basement rock in the area is charnockite (hypersthene granite) trending ENE. Lying unconformably over the charnockites are calcareous sandstones, dull white to pale brown in colour, fine grained and indurate. The khondalite suite of rocks comprise of high-grade metamorphic rocks such as granetiferous gneisses and calcareous granulites. Further north, bands of quartzite and crystalline lime stones also occur. Bodies of charnockites, linear ( trending NW ) and lenticular in shape occur within the khondalite.
Seismic Information
The site lies in Zone II of the seismic zoning map of India (IS 1893 - 2002) where shocks of intensity VI or magnitude 5 can occur. The seismic zoning map of India is enclosed as Annexure 1.5-1. However, no shock of this magnitude is known to have occurred at less than 100 Km of the site. Within a distance of about 300 Km, some 27 earthquakes of intensity IV to VIII or a magnitude 4 to 5.7 are known to have occurred from 1341 to 1972 as given in different catalogues. As noted from the Gauribidanur Array data, another 27 possible tremors of magnitude 2.2 - 4.8 have occurred during 1968 – 1985. The above earthquake data are enclosed in Annexure 1.5-2.
Similarly micro seismic data was recorded in eight seismic stations in a network within a distance of 50 Km from Kudankulam central station for a period of eight years from 1990 to 1998. During the study period of eight years, 29 local earthquakes of magnitude 0.4 to 3.5 have been recorded. These are presented in Annexure 1.5– 3.
Nuclear Power Corporation NPP “Kudankulam” Site Evaluation Report for KKNPP unit 3 to 6
DOCUMENT NO. DATE OF ISSUE REVISION NO. PAGE NO. I.02.KK.3-6.0.0. OO.RS.WD001 March 2011 1 46 of 113
1.5.1.1 Regional geology
On a regional basis, the rock formations explored in Tirunelveli district consist of micaceous and granetiferous gneisses and associated charnockites together with other meta sedimentary rock, viz., quartzite and crystalline lime stones belonging to Archaean system of Precambrian age. These are overlain by sub recent raised beaches formed of buff coloured sandstones, shell - limestone ( kankar ), Teri soil ( red loamy soil ) and beach sands.
The distribution of different rock types in the area is shown in the geological map enclosed in Annexure 1.5-4.
The sand dunes are generally confined to the coastal belt in the Nanguneri taluk. The dunes are of two kinds, the older red sands of teris and the younger white coastal dunes. There are a few deposits of tuffaceous kankar associated with the calcareous sandstones. A fairly extensive occurrence of this type of kankar limestones is noticed capping the ridges along the coastal track south of Kudankulam.
The regional trend of charnockites is ENE-WSW with steep dip of 70 deg to the SSW. In the north, the strike abruptly changes to WNW- ESE or E-W due to folding. Occasionally, NE and NNE dips are also noticed in some granetiferous gneisses and charnockites in the Nanguneri region. A NW-SE line of discordance (6-6), probably indicating a zone of faulting and thrusting runs from NW of Rajapalayam upto 17 Km NW of Tiruchendur. Along the line of discordance, lenses of anorthosites and pink gneisses are also reported.
Geotectonic provinces
Tectonically, most of the area within the circle of radius 300 Km around the site covers, for the major part, archaean granulitic facies terrain of South India - Sri Lanka and has been termed as the charnockitic mobile belt. This mobile belt is bordering the Karnataka carton composed of Dharwarian greenstones and peninsular quartzo-feldspathic gneisses. This charnockitic mobile belt is a high temperature metamorphic facies assemblage of khondalities, charnockities and gneisses.
Some mafic complexes anorthosites (near Salem), alkali plutons and carbonatites are indicative of intrusive episodes, controlled by major lineaments and faults which are mostly NE-SW, NNE-SSW, and NNW-SSE. The courses of the major rivers follow the older lineaments and dislocations.
The next important assemblage are the tertiary younger sediments east of the postulated boundary fault in eastern coast of India and west of boundary fault in the northern part of Sri Lanka forming the graben structure. Pleistocene sedimentsalso occur as thin bands along the western coast from south of Calicut upto Quilon indicating tertiary faulting and deposition.
Nuclear Power Corporation NPP “Kudankulam” Site Evaluation Report for KKNPP unit 3 to 6
DOCUMENT NO. DATE OF ISSUE REVISION NO. PAGE NO. I.02.KK.3-6.0.0. OO.RS.WD001 March 2011 1 47 of 113
Several tectonic features have been identified and the major faults and lineaments around Kudankulam site are shown in Drg No. AMD/CR/61 and is enclosed as Annexure 1.5-5 (Seismotectonic and lineament map of peninsular India ).
1.5.1.2 Site geology
Site Physiography
Physiographically the area forms a gentle undulating plain country. Occasionally the mounds reaching to a height up to 49 m are found here and there. In view of the low relief, small hills and gullies constitute the minor drainage lines and trend due south. The minor existing drainage lines do not give any clue to the physiographic development of the area. Actually there is a gradual drop of the elevations towards the coast. Most of the minor drainage is from north to south in the area.
Configuration of land forms and geological set up:
The geomorphologic / geological characteristics of the site indicate the stable nature of the NPP site during construction and operation. The NPP site forms part of the characteristic terrain of the archaean super group and overlain by tertiary sandstones. The sandstones are fine grained composed of quartz and feldspars with calcareous matrix. These sandstones are generally horizontal but at places show a dip of 8 deg towards NW. There are two sets of joints within the sandstone and these are mostly tight. The Archaean super group is underlying the sandstone. The Kudankulam site being a part of peninsular region composed of a peninsular shed with geologically ancient rocks of diverse origin and having exposed for long ages to denudation and approaching penetration. Over these ancient rocks lie a few basins of Precambrian and later sediments and extensive sheets of horizontally bedded lavas of Deccan trap formation. The mesozoaic and tertiary sediments are found mainly along coastal regions.
Structural geology around Kudankulam
The major rock type in the Kudankulam site area is banded and foliated migmatic granetiferous biotite gneisses enclosing lenticular bands of charnockite and quartzite, exposed in outcrops occurring as small hillocks in an otherwise plain country. These rocks extend right up to the seacoast near Kudankulam and outcrops are noticed between the high tide and low tide lines along the shore. Their general trend is ENE- WSW with dips of 50 deg-70 deg towards SSE.
Locally in the site area, outcrops of shell lime stones of variable thickness ( from 2 cm to about few metres ) are exposed occasionally from the coast line for a distance of about 800 metres in land, sub-horizontally overlaying the biotite granite-gnesis. This shell limestone is a typical shallow water marine

Nuclear Power Corporation NPP “Kudankulam” Site Evaluation Report for KKNPP unit 3 to 6
DOCUMENT NO. DATE OF ISSUE REVISION NO. PAGE NO. I.02.KK.3-6.0.0. OO.RS.WD001 March 2011 1 48 of 113
transgression deposit during upper Pleistocene times. Quartz veins and pegmatites occur as intrusive in the country rock. Only one dolerite dyke was noticed cutting the garnetiferous biotite gneisses in a well section in this area. The three sets of prominent joints observed in the gneisses are joints parallel to foliation of gneisses and those tending N 25 deg. E and N 10 deg. W. Most of quartz veins and pegmatites in the gneisses are 5 to 13 cm wide and run parallel to the foliation.
Relationship of site structure with regional tectonics
The rocks exposed in the vicinity of the project site range in age from archaean to holocene. At Kudankulam site proper, charnockite groups of rocks are exposed whose foliation trends in the direction of NE-SW with moderate to steep dips towards south. These rocks have undergone intense migmatization as a result of which occurrence of foliation shears are ubiquitous. The rocks have also been traversed by acid and basic intrusives both in a concordant and discordant manner. A little north of Kudankulam village near borehole no. 64 (Phase I) the contact of charnockite and khondalites occurs, over charnockite group of rocks sedimentary rocks of possible miopliocene period have been deposited. The borehole data obtained has also indicated that at the contact between crystalline and sedimentaries the rocks are affected only by weathering and the tectonic manifestation such as shearing, fracturing etc are nonexistent. The geological sections of the sub-surface strata (Annexure 1.5-6) do not indicate that the basement rock is affected by displacement. The shears encountered are predominantly foliation shears and vertical shears noticed are inferred to be non-penetrative type suggesting a possibility that the shears may not be post deformational.
1.5.2 Vibratory Ground Motion
As per the IAEA guide 50-SG-SI (1979) earthquakes of two levels of severity are to be determined for specifying the earthquake design basis of NPPs. These are the S 1 and S 2 levels of ground motion (OBE and SSE in the USNRC parlance). The S 1 level corresponds to the maximum ground motion which can reasonably be expected to be experienced at the site once during the life of the nuclear power plant. The S2 level corresponds directly to the ultimate safety requirements, and is that levels of ground motion, which has a very low probability of being exceeded. The S2 level of motion represents the maximum level of ground motion to be used for items important to safety. The S 1 is derived on the basis of historical earthquakes that have affected the site area. It can be expressed as the ground motion having a defined probability of not being exceeded, and may be derived using a probabilistic approach or a combined seismotectonic and probabilistic approach. The S2 is derived on the basis of maximum earthquake potential associated with the tectonic structures and the seismotectonic provinces in the region.

Nuclear Power Corporation NPP “Kudankulam” Site Evaluation Report for KKNPP unit 3 to 6
DOCUMENT NO. DATE OF ISSUE REVISION NO. PAGE NO. I.02.KK.3-6.0.0. OO.RS.WD001 March 2011 1 49 of 113
1.5.2.1 Seismicity
The site lies in the zone II of the seismic-zoning map of India ( IS 1893: 1984 ). The earthquake data relevant for the site have been drawn from i) Global sources eg, World Data Centre, CWPRS, IMD and published literature ii) From the recordings made at the Gauribidanur Array ( GBA ), data on the time of occurrence, location and magnitude of the earthquakes are given in Annexure 1.5-2. For quantitative applications, epicentral intensity ( Io ) has been converted to an equivalent magnitude ( M ) on the basis of Gutenburg’s empirical relation.
M= 2/3 Io +1. From these two sets of data the following observations can be made
i) The largest earthquake in this region within the Indian Peninsula is the
Coimbatore earthquake of Feb 8, 1900. Several catalogues give the MM intensity as VII; However, IMD assigned a magnitude of 6.0 ( Richter ) to this earthquake. The epicentre of the event lies around the periphery of the 300 Km radius circle.
ii) The nearest epicentre is around Trivandrum about 88 Km NNW of the
site where two events of MM intensity V corresponding to magnitude of 4.3 has been recorded.
iii) There are two more epicentres along the west coast. The one is east
of Cochin about 240 Km NNW where an earthquake intensity VI ( magnitude 5 ) took place on July 26, 1953 and the other is near Calicut at a distance of over 300 Km where a series of earth tremors were felt during Oct. 1964.
iv) There have been a few offshore events in the region, three of them
falling within the 300 Km radius circle. The epicentres of these earthquakes of magnitude 6.0 and 3.5 lie at distances of about 160 Km and 270 Km respectively. Incidentally, a magnitude of 6.0 for the Gulf of Mannar earthquake has been assigned by IMD while the other references quote the magnitude between 5.3 and 5.9.
v) The epicentres of two events of magnitude 5 and three events of magnitude 4.3 in Srilanka at distances of the order of 270-280 Km lie within the said circle.

Nuclear Power Corporation NPP “Kudankulam” Site Evaluation Report for KKNPP unit 3 to 6
DOCUMENT NO. DATE OF ISSUE REVISION NO. PAGE NO. I.02.KK.3-6.0.0. OO.RS.WD001 March 2011 1 50 of 113
vi) There have been five earthquakes around Travancore (near Kottayam) at a distance of about 190 Km NNW of the site. Three of the events had registered MM intensity of V (Magnitude 4.3) while two were of intensity of IV.
vii) There are a few clusters of epicentres around Mangalam and
Neriyamangalam at distance between 200-300 Km NNW from the site.
1.5.2.2 Geologic structures and tectonic activity
Tectonically, most of the area within the circle of radius 300 Km around the site covers for the major part archaean granulitic facies terrain of south India and Sri Lanka and has been termed as the charnockite mobile belt. This mobile belt borders the Karnataka craton composed of Dharwarian green stones and peninsular quartz – feldsparic gneisses. The approximate craton-mobile belt boundary as per the published information is shown in Annexure 1.5-5.
This charnockite mobile belt is a high temperature metamorphic facies assemblage of khondalites, charnockite and gneisses. Some mafic complexes anorthosites ( near Salem ), alkali plutons and carbonatites are indicative of intrusive episodes, controlled by major lineaments and faults which are mostly NE-SW, NNE-SSW, and NNW-SSE. The courses of the major rivers follow the older lineaments and dislocations. The next important assemblage are the tertiary younger sediments east of the postulated boundary fault in eastern coast of India and west of boundary fault in the northern part of Sri Lanka forming the graben structure. Pleistocene sediments also occur as these bands along the western coast from south of Calicut up to Quilon indicating tertiary faulting and deposition.
Several tectonic features have been identified in the area by the studies carried out by several agencies like GSI, ONGC and UNDP specialists working with the Tamil Nadu Government. Many fractures so reported are sometimes delineated by aerial photographs and topographical maps. Lineaments identified as fold-axes are not considered in this work. Most of the faults postulated in the southern part of the Indian Peninsula are based on - (i) Geophysical investigations and exploratory drilling carried out by ONGC ( Raiverman, S. Rao, V.R. –1965) in Cauvery basin and by Tamil Nadu circle of GSI; (ii) Regional, geological and seismic data obtained by Soviet Ship Academic Archangeleisky in Cochin-Laccadive offshore region and other areas ( Eremenko – 1968 ); (iii) Pattern of distribution of charnockite and associated ultramafics ( periodites etc.) in the area ( Fermor-1936, Krishnan-1966 and Narayanaswami – 1964, 1967 ); (iv) Disposition of Bouger gravity anomalies ( Qureshi – 1964 ) and (v) Geomorphologic, photogeological and
Nuclear Power Corporation NPP “Kudankulam” Site Evaluation Report for KKNPP unit 3 to 6
DOCUMENT NO. DATE OF ISSUE REVISION NO. PAGE NO. I.02.KK.3-6.0.0. OO.RS.WD001 March 2011 1 51 of 113
geophysical evidences (positive gravity anomalies, airborne magnetic and radiometric surveys) and many other associated features viz., presence of igneous intrusions, pegmatite, alkaline complexes, carbonites, breccia zones, off-setting of dolerite dykes etc. along the postulated fault zones ( Grady, C.J. – 1971 ). In addition Eremenko and Gagelsganz (1966 ) and UNESCO experts like Prof. Gubin ( 1969 ) and Auden ( 1971, 1972 ) have put forward different types of fault patterns on the basis of geomorphology and seismicity. A detailed account of the faults and lineaments within 600 sq Km around the site (except those in Sri Lanka) is listed in Annexure 1.5-7. Some of the major faults and lineaments are described in Annexure 1.5-5.
i) A NW-SE trending fault (no.6) passes about 55 Km NE of Kudankulam site, running from near Rajagopalyam upto 17 Km NW of Tiruchendur ( Narayanaswamy, 1967).
ii) Eremenko and Gagelsganz (1966) have postulated the following faults, which are reflected in the tectonic map of ONGC (1968).
(a) The NW-SE trending faults marked 5, 9 and 17 lie at distances of about 60 Km, 190 Km and 330 Km NE of the site.
(b) The N-S trending Karakul coastal fault (no.16) runs from south of Pondicherry to the west coast of Ceylon (Sri Lanka) about 250 Km east of the site.
(c) A NE-SW trending deep fault (no.24) runs from near Cochin to Pulicat Lake cutting across the charnockite and peninsular gneiss belts passing about 270 Km NNW of the site.
(d) A NNW-SSE trending coastal fault (no. 25) extending from the west of Cochin to beyond Trivandrum lies about 115 Km W of the site.
iii) The other faults in the region identified by ONGC are the following
(a) A deep seated fault (no.26) trending ENE-WSW running from the coast near south of Cochin and extending beyond Vellore at a distance of about 330 Km NNW from the site.
(b) A major E-W trending lineament system marked by three faults no. 30, 27 and 18 lies at a distance of about 310 Km from the site.
iv) Apart from the fault no.6 described earlier by Narayanaswami of GSI, G.S.
Murthy of GSI in his geotechnical report (1973-74 ) on Kudankulam site has described the following two faults which are also mentioned by Vemban, et al of the Tamil Nadu circle of GSI ( Vemban et al in GSI Miscellaneous Publication. no. 31, 1977 ).

Nuclear Power Corporation NPP “Kudankulam” Site Evaluation Report for KKNPP unit 3 to 6
DOCUMENT NO. DATE OF ISSUE REVISION NO. PAGE NO. I.02.KK.3-6.0.0. OO.RS.WD001 March 2011 1 52 of 113
(a) The lineament no.7 trending ENE-WSW marks the boundary
between the crystalline formations and Miocene sediments. This lineament has now been studied in detail by Geological Survey of India both on the land sat imageries and on aerial photographs. This lineament has been affected by a cross fault shifting the contact by 2-3 Km. The study of the bore wells drilled by Central Ground Water Board as well as the open wells in the area indicate that the thickness of the sedimentary rocks vary from 30 m close to the contact to 120 m near the coast ( 7 Km away ). Thus it could be attributed to a post depositional faulting or by basin configuration with a slope of 1 in 33 towards the sea. Gravity and magnetic anomaly maps as available do not show any abnormal gradients or lows. ONGC map with a cross section across the Cauvery basin ( 1:2000,000 ) also supplement the above observation. Study of the area around the lineament has indicated that recent and quaternary sediments do not manifest any disturbance thereby suggesting lack of neotectonic activity in the area. This lineament no.7 is at a distance of 12.5 Km from the site. However for the purpose of seismic risk analysis, the above lineament has been considered as a fault with a capability of generating an earthquake of magnitude 5 on the Richter scale.
b) The N-S extending lineament no.1 ( Length plotted about 60 Km )
located at a shortest distance of about 6 Km west of the site was originally reflected in an unpublished report of Varadarajan and Balakrishnan (1982 ) of ONGC and the same was later incorporated by Ghosh & Banerjee in 1988 in their report of Earthquake Design Basis report for the site. However Varadarajan & Ganju ( ONGC 1989 ) have not reflected this lineament in a later publication. Further its existence is also not reported in the map of Project Vasundhara ( GSI & ISRO - 1994) and is also not corroborated by the remote sensing studies carried out by AMD ( Shantikumar-1997). Therefore, lineament no. 1-1 considered in the EBD report of Ghosh & Banerjee (1988), is non-existent as corroborated by ONGC (1989), GSI & ISRO ( Project Vasundhara -1994 ) and AMD ( Shantikumar-1997 ). Lineament no. 2 (NE – SW ), 3 (NW-SE) and 4 (WNW-ESE) identified by KDMIPE-ONGC (1982) lie at distances of about 32 Km (North), 13 Km (east) and 31 Km (East) from the site.
v) The Tamil Nadu Circle of GSI has identified some minor lineaments in the region some of which are described here. Lineament no.8 trending NW-SE lie about 130 Km due NE of the site, lineament no.10 trending NE-SW lie about 185 Km due northeast of the site, lineament no.13 trending NE-SW lie at about 200 Km north east of the site and lineament no.22 trending EW to ENE -WSW lies about 200 Km north of the site.

Nuclear Power Corporation NPP “Kudankulam” Site Evaluation Report for KKNPP unit 3 to 6
DOCUMENT NO. DATE OF ISSUE REVISION NO. PAGE NO. I.02.KK.3-6.0.0. OO.RS.WD001 March 2011 1 53 of 113
vi) A NNE-SSW trending fault marked as 21 lie at a distance of about 175 Km from the site has been described by Grady (1971) as the Attur fault zone.
vii) Three NE-SW trending lineaments marked as 31, 32 and 33 at distances of 230,280 and 370 Km and a NW-SE trending lineament no.34 at a distance of 230 Km east of the site in Sri Lanka have been described by Katz (1977) based on the work of the Sri Lankan geologists. Lineament no. 11 & 15 marks the boundary fault between the crystalline and sediments.
viii)KDMIPE-ONGC (1982) has delineated a number of WNW-ESE basement faults some of which are the extensions of the already marked faults/lineaments no.9, 19 and 5 in the earlier map of ONGC (1963). In addition, a NNW-SSE trending west coast basement fault no. 35 has been shown in their map which more or less coincides with the west coast fault postulated by Gubin. This fault lies about 60 Km WNW of the site.
ix) For Kudankulam site the causative lineaments along which movement have been noticed in recent period should be youngest sets of lineaments i.e. the E-W and WNW-ESE lineaments no. 4 (31 Km), 5 (60 Km) and 9 (187 Km) and the NNW-SSE lineaments e.g. 35 (60 Km), 25 (116 Km) and 23 (176 Km in the western coast.
AMD in their note “Status of lineament in Kudankulam area, Tamil Nadu ( April 2000 )” have further clarified that
i) 2 lineaments La & Lb ( AMD Drg. no. AMD/TN/96 ) vide Annexure 1.5-8 have been reported by Shanti Kumar (1997 ). Out of which La lies at a distance of 8.5 Km to the west of the site whereas Lb lies at a distance of 17 Km from site.
ii) Shanti Kumar (1997 ) also brought to light a number of lineaments/faults of which Achan Kovil Fault (ACF), South Achan Kovil Fault (SAF), Tiruchendur Tuticorin lineaments (TTL), Tambraparani river fault (TF), Manappadu lineaments, (TL) are important but all of them are far away i.e. more than 25 Km from site.
iii) Besides there are some minor lineaments ( M1 M1 / M2 M2 / M3 M3 ) around the site whose lengths are considerably small. Out of these 3 lineaments. M3M3 ( length < 6 Km ) and is closest to site at 5.5 Km whereas M1M1 is at 15 Km from site and M2M2 is at 8.5 Km from site.
Summing up, based on the available information, the major trends of the basement tectonics within the circle of radius 300 Km are:
(i) NW- SE to NS - eg. Lineament nos. 3, 6, 23, 35, 60 etc
ENE –WSW to EW - eg. Lineament nos. 24, 26 etc.
WNW –ESE - eg. Lineament nos. 4, 5, 9,19 etc.

Nuclear Power Corporation NPP “Kudankulam” Site Evaluation Report for KKNPP unit 3 to 6
DOCUMENT NO. DATE OF ISSUE REVISION NO. PAGE NO. I.02.KK.3-6.0.0. OO.RS.WD001 March 2011 1 54 of 113
NNE - SSW to NE - SW - eg. Lineament nos. 2,7,10,11,13,15, 20, 21, 26, 31, 32,33 etc.
NW- SE - eg. Lineament nos. 8,12,17,25,27,28,29,34 etc.
EW - eg. Lineament nos. 14, 18, 22, 27, 30 etc.
These trends have been active from time to time from Precambrian to the recent period in different parts of peninsular India. NNW-SSE Dharwarian trend is the oldest in the central part of this region and then comes the ENE -WSW lineaments of north. In the Cauvery basin, NE-SW trending lineaments mark the pre-miocene unconformity and also responsible for the down faulting of the Gulf of Mannar late in Jurassic times ( 120 million years ). The youngest sets of faults in this area are the WNW-ESE, and the E-W sets, which dislocate the earlier trends as is clearly seen in the Cauvery basin. Adam’s bridge connecting India and Sri Lanka is a coral chain where the growth of corals has been arrested due to recent uplift along these trends ( Varadarajan 1982 ).
In the Western coastal belt which consists of two longitudinal units – the alluvial coastland ( sand beaches, sand bars and lagoons ) and the interior uplands of the lateritic terraces – the alluvial coastland is controlled by reactivation along a set of NNW-SSW trending echelon faults mainly by down faulting starting from late paleocene ( 5 million years ) to the recent period. According to Varadarajan (1982 ) recent movements along WNW - ESE or ENE-WSW trending faults have controlled the formation of Vembanad Lake and Ashtamudi Kayal lagoon near Quilon.
Thus for the Kudankulam site the causative lineaments along which movement have been noticed in recent period should be the youngest sets of lineaments i.e. the E-W and the WNW-ESE lineaments eg. 4, 5, 9 and 19 and the NW to NNW-SSE lineaments e.g. 35, 25 and 23 in the Western coast. However, the lineament no.7 which marks the unconformity between the archaean basement and the tertiary sediments can be considered as additional plane of weakness for possible movements. However, it may be noted that lineament no.9 and 23 are more than 175 Km away from the site.
1.5.2.3 Correlation of earthquake activity with geologic structure or tectonic provinces
The detailed tectonic map is available only for the Indian main land. Some
offshore faults/lineaments in the immediate neighborhood have also been shown. However, most of the area within the 300 Km radius lies in the sea.
Coimbatore earthquakes do not appear to be definitely related to any known
tectonic structure or fault zone. However it is noted that the cluster of earthquakes between 200 to 300 Km due NNW of the site including the Coimbatore event may be related to the faults 24, 26 and 9. The events on

Nuclear Power Corporation NPP “Kudankulam” Site Evaluation Report for KKNPP unit 3 to 6
DOCUMENT NO. DATE OF ISSUE REVISION NO. PAGE NO. I.02.KK.3-6.0.0. OO.RS.WD001 March 2011 1 55 of 113
the west coast and those around Travancore could possibly be due to the faults 19, 24 and 35. Six events between Madurai and Pondicherry can possibly be attributed to the archaean cretaceous boundary faults no. 11 and 15. The events in Sri Lanka within the 300 Km radius circle could possible are related to faults 17 and 34. The event in the Gulf of Mannar and those in the Laccadive - Kerala graben could possibly be associated with the fault 5. Rest of the events within the circle of 300 Km radius around the site are quite scattered.
1.5.2.4 Maximum earthquake potential
The site lies in Seismic zone II ( as per IS stipulation ) close to the boundary of zone III. As per Gubin (1969 ) shocks up to MM intensity VI ( magnitude 5 Richter ) can occur along the west coast. It is noted that the Coimbatore Earthquake of Feb 8, 1900 had been reported to have an epicentral intensity of VII (MM) and subsequently a magnitude of 6.0 has been assigned by IMD. On the basis of geological and seismotectonic consideration the magnitude of 6.0 is taken as the maximum earthquake potential for this portion in India and its immediate off-shore areas. The maximum intensity of events occurring in Sri Lanka and falling within the area of interest is VIII (MM) corresponding to a magnitude of 6.3. However, these events occur at distances of more than 250 Km. From the available information on tectonic structures, they do not appear to be associated with the faults / lineaments running close to the site to influence the considerations for the safe shutdown earthquake.
Considering the archaean strata on either side of the lineaments no. 1 2, 3 and 6 and the absence of any recorded earthquake event around them, these lineaments may not be of any consequence for the seismic design. Moreover lineament no.1 (60 Km ) located at a shortest distance of 6 Km from KK site mentioned in EDB report of Ghosh and Banerjee (1988) is nonexistent. However, from the length and proximity consideration lineament no. 1 and 6 are still considered for the design basis for evaluating the maximum earthquake potential of the site. Two more lineaments ( marked as La & Lb in AMD Drg. no. AMD/TN/96 ) have been reported by Shanti Kumar (1997), out of which La lies at a distance of 8.5 Km to the west of the site whereas Lb lies at a distance of 17 Km from site.
For Kudankulam site, the causative lineaments along which movement has been noticed in recent period should be the youngest sets of lineaments ie. the EW and the WNW-ESE lineaments e.g., 4 (31 Km), 5 (60 Km), and 9 (187 Km ) and the NNW-SSE lineaments e.g. 35 (60 Km), 25 (116 Km) and 23 (176 Km) in the western coast. For the lineaments 4,5,25 and 35, which are the youngest sets of fractures in this area, a magnitude of 6 for SSE is considered adequate. Lineament no.7 which is the boundary between the archaean basement and the Miocene sediments (~ 15 million years). Along the 150 Km length of the lineament there is no recorded event. However, the

Nuclear Power Corporation NPP “Kudankulam” Site Evaluation Report for KKNPP unit 3 to 6
DOCUMENT NO. DATE OF ISSUE REVISION NO. PAGE NO. I.02.KK.3-6.0.0. OO.RS.WD001 March 2011 1 56 of 113
six events between Madurai and Pondicherry are relatable to the archaean-sedimentary fault no. 11 and 15. The maximum magnitude of such events has been reported as 4.2 ( Richter ). As per the geological data these NE-SW trending faults are not the youngest ones along which recent movement have been noticed in the region. The minor lineaments M1M1, M2M2 and M3M3 as shown in AMD’s drawing are very small (lengths less than 10 Km). A magnitude of 5 is considered adequate for these sets of faults including the fault no.7. The faults/lineaments together with the corresponding expected maximum magnitude of earthquakes considered for SSE are listed in Annexure 1.5-9.
Iso-seismal maps of Coimbatore earthquake (Feb 8, 1900), Bhadrachalam earthquake (April 13, 1969), Koyna earthquake (Oct. 17, 1973) Shimoga earthquake (May 12, 1975) and Koyna earthquake (Dec. 10, 1967) are enclosed as Annexure 1.5-10.
A comprehensive map of maximum observed earthquake intensities in peninsular India is enclosed as Annexure 1.5-11.
The attenuation of intensities during Coimbatore and Koyna earthquakes is enclosed as Annexure 1.5-12.
For the events considered for SSE and OBE the intensity at site will not exceed VII and VI respectively.
Ground motion assessment with respect to new lineaments
After the publication of note on “Status of the lineaments in Kudankulam area, Tamil Nadu, March 2000” by AMD, Hyderabad, PGA values with respect to the following lineaments have been re-calculated for S1 & S2 levels of earthquakes.
The empirical formula for S2 & S1 of PGA has been obtained from EDB report of Ghosh & Banerjee.
PGA (S2) a = 0.141 (exp (0.511M))* (R+ 40) – 0.724.
PGA (S1) a = 1.04 exp ((0.483 M))* (R+40) – 1.2
Sl No
Lineament Magnitude for SSE
Magnitude for OBE
Distance (Km) from NPP site
PGA S1 S2
1. La-La 5 3.5 8.5 0.053 0.109
2. 3 5.5 3.5 13.0 0.048 0.132
3. 7 5.5 3.5 12.5 0.0486 0.133
4. M2M2 5.5 3.5 8.75 0.053 0.109
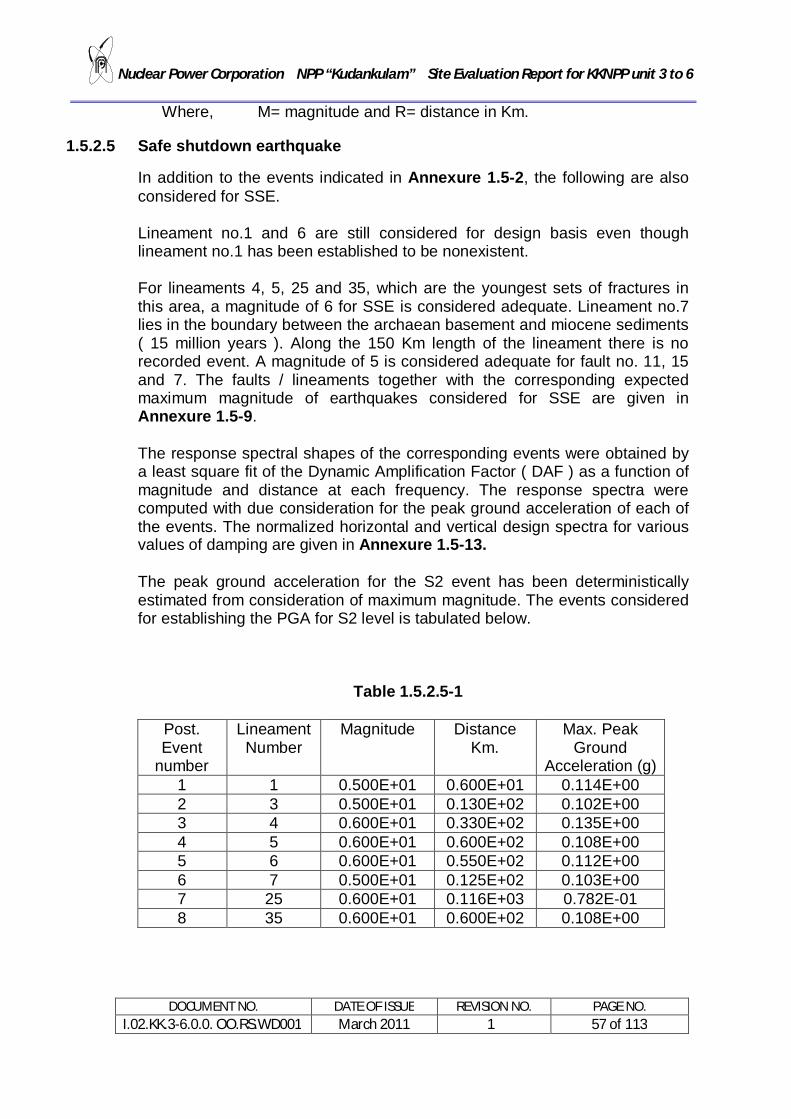
Nuclear Power Corporation NPP “Kudankulam” Site Evaluation Report for KKNPP unit 3 to 6
DOCUMENT NO. DATE OF ISSUE REVISION NO. PAGE NO. I.02.KK.3-6.0.0. OO.RS.WD001 March 2011 1 57 of 113
Where, M= magnitude and R= distance in Km.
1.5.2.5 Safe shutdown earthquake
In addition to the events indicated in Annexure 1.5-2, the following are also considered for SSE. Lineament no.1 and 6 are still considered for design basis even though lineament no.1 has been established to be nonexistent.
For lineaments 4, 5, 25 and 35, which are the youngest sets of fractures in this area, a magnitude of 6 for SSE is considered adequate. Lineament no.7 lies in the boundary between the archaean basement and miocene sediments ( 15 million years ). Along the 150 Km length of the lineament there is no recorded event. A magnitude of 5 is considered adequate for fault no. 11, 15 and 7. The faults / lineaments together with the corresponding expected maximum magnitude of earthquakes considered for SSE are given in Annexure 1.5-9. The response spectral shapes of the corresponding events were obtained by a least square fit of the Dynamic Amplification Factor ( DAF ) as a function of magnitude and distance at each frequency. The response spectra were computed with due consideration for the peak ground acceleration of each of the events. The normalized horizontal and vertical design spectra for various values of damping are given in Annexure 1.5-13.
The peak ground acceleration for the S2 event has been deterministically estimated from consideration of maximum magnitude. The events considered for establishing the PGA for S2 level is tabulated below.
Table 1.5.2.5-1
Post. Event
number
Lineament Number
Magnitude Distance Km.
Max. Peak Ground
Acceleration (g) 1 1 0.500E+01 0.600E+01 0.114E+00 2 3 0.500E+01 0.130E+02 0.102E+00 3 4 0.600E+01 0.330E+02 0.135E+00 4 5 0.600E+01 0.600E+02 0.108E+00 5 6 0.600E+01 0.550E+02 0.112E+00 6 7 0.500E+01 0.125E+02 0.103E+00 7 25 0.600E+01 0.116E+03 0.782E-01 8 35 0.600E+01 0.600E+02 0.108E+00

Nuclear Power Corporation NPP “Kudankulam” Site Evaluation Report for KKNPP unit 3 to 6
DOCUMENT NO. DATE OF ISSUE REVISION NO. PAGE NO. I.02.KK.3-6.0.0. OO.RS.WD001 March 2011 1 58 of 113
A rock site specific formula for the maximum peak horizontal acceleration valid for the range of magnitude and distance of interest was established by Dr.A.K.Ghosh and Banerjee in their EDB report ( Reference 2.5 E ). A formula based on the distance from causative fault is preferred in this context since this is the only available information before an event. The formula obtained is
a = 0.141 exp (0.511 M) (R+40) –0.724 where
‘a’ is the acceleration (g), ‘M’ is the earthquake magnitude and ‘R’ is the distance from the causative fault. It may be seen that this equation is based on distance from causative fault. This equation is developed by using a large and relevant data set. It has been noticed that this correlation yield a smaller standard deviation in comparison to the general formulae in use. Hence this equation is preferred.
From the maximum peak horizontal acceleration, the smaller peak horizontal acceleration and the peak vertical acceleration are evaluated through suitable multipliers obtained by a statistical analysis of a larger number of such data.
rh = 0.923 and rvh = 0.720
where, rh is the ratio of the smaller to the larger peak horizontal ground acceleration and rvh is the ratio of the peak vertical to the larger peak horizontal acceleration.
Based on this, the maximum peak ground acceleration for S2 is fixed as 0.15g after conservatively rounding off the calculated peak acceleration ( Annexure 1.5-9). The epicentral intensity is obtained directly from the historical records for most of the global data. Where initial data has been obtained in terms of magnitude ( M ) ( Richter ), the epicentral intensity (Io) has been evaluated by the Gutenberg relation.
M = 2 /3 * Io + 1
The intensity (I) at a distance of ( Km ) from the epicenter is evaluated as
I = Io exp (-m )
The minimum ‘m’ value for Coimbatore and Koyna earthquakes have been reported as 0.0013 and 0.0059 respectively. Hence the calculations have been performed with the ‘m’ value for Coimbatore earthquake as it predicts a slower attenuation of intensity. Synthetic accelerograms, for both horizontal and vertical motions have been obtained such that the time history generated response spectrum ( THRS )

Nuclear Power Corporation NPP “Kudankulam” Site Evaluation Report for KKNPP unit 3 to 6
DOCUMENT NO. DATE OF ISSUE REVISION NO. PAGE NO. I.02.KK.3-6.0.0. OO.RS.WD001 March 2011 1 59 of 113
closely matches the specified design response spectrum ( SDRS ) for 5% of critical damping. Normalized pseudo absolute acceleration spectra are used in this context.
The ground acceleration is represented by
.. N
Xg = (e-t - e-t) (-1) j-1 Gj sin ( wj t - j ) -------- (1)
j =1
The weights of Gj’s are calculated such that the THRS is compatible with the SDRS. The time history obtained by equation (1) is subjected to a base line correction.
.. ..
X g,c = Xg + C1 + C2t + C3t2 --------------- (2)
The base-line correction has negligible effect on the acceleration time- history as such, however, it is required to ensure realistic velocity and displacement time-histories.
The constants C1, C2 and C3 are evaluated by minimizing the mean square velocity at the end of the record (t=T) i.e.
T
/cj = [1/T] (xg,c) 2 dt = 0; j = 1,2,3 ---------(3)
0
Further constraints are imposed on
i) Peak ground acceleration ii) Duration of motion iii) Time to attain peak acceleration iv) Peak velocity and v) Peak displacement vi) Rate of Zero crossing
such that they reflect the site and the postulated earthquake conditions.
In the present analysis the desired result is obtained by a parametric study on and . The baseline correction is by a modified version of the technique used by Iyengar and Raghu (1983 ).
Nuclear Power Corporation NPP “Kudankulam” Site Evaluation Report for KKNPP unit 3 to 6
DOCUMENT NO. DATE OF ISSUE REVISION NO. PAGE NO. I.02.KK.3-6.0.0. OO.RS.WD001 March 2011 1 60 of 113
Spectrum matching is sought at all the 90 frequencies where the SDRS is specified (Annexure 1.5-14). Simultaneous matching of the spectra for all values of damping has not been attempted. However, it has been verified that even though the SCA ( Spectrum compatible accelerogram ) has been generated from the SDRS for 5% damping, the THRS for other values of damping match the corresponding SDRS equally well.
The synthetic, normalized, acceleration time histories for horizontal and vertical ground motion and the digitized values are given in Annexure 1.5-15. Comparison of the SDRS and THRS for 5% damping are also enclosed in Annexure 1.5-15. Based on the events considered for SSE, it is confirmed that the intensity at the site will not exceed VII in MM scale. The return period for S2 level is 50,000 years.
1.5.2.6 Operating Basis Earthquake
The level of the operating basis earthquakes is based on the historically recorded earthquakes in the region around the site. The estimated values of acceleration felt at the site during the past earthquakes within the circle of radius 300 Km are listed in Annexure 1.5-16. An alternate probabilistic assessment of the peak acceleration of OBE has also been carried out.
Since the epicenters of the past earthquakes are known and not every earthquake can be unambiguously associated with a lineament / fault, a rock -site-specific formula for peak ground acceleration is established in terms of magnitude and epicentral distance. The formula obtained is a = 1.04 exp (0.483 M) (R+40) –1.2 where
‘a’ is the acceleration (g), ‘M’ is the earthquake magnitude and R is the epicentral distance (Km). It may be seen that this equation is based on the epicentral distance and is used to determine the felt acceleration during past earthquakes. This equation is developed by using a large and relevant data set. It was found that this correlation yield a smaller standard duration in comparison to the correlations in common usage. Hence this equation is preferred.
The felt acceleration at the site during past earthquakes is evaluated using the above equation and is also enclosed at Annexure 1.5-16. The list of earthquakes considered for calculating the felt acceleration is given in Annexure 1.5-2. The highest felt acceleration is 0.02935 g and the frequency of occurrence of the peak ground acceleration in specified bands is also given in the above Annexure. However, it is noted that this dataset is too small to draw any quantitative conclusion.
The events considered and the intensity at the site under operating basis earthquakes is enclosed as Annexure 1.5-17. The peak acceleration ( 0.05 g ) being fixed, the corresponding magnitude of causative lineament is
Nuclear Power Corporation NPP “Kudankulam” Site Evaluation Report for KKNPP unit 3 to 6
DOCUMENT NO. DATE OF ISSUE REVISION NO. PAGE NO. I.02.KK.3-6.0.0. OO.RS.WD001 March 2011 1 61 of 113
evaluated from which the intensity at the epicenter and at the site is calculated. If a lineament is beyond 100 Km from the site, it cannot produce acceleration greater than 0.05 g when the maximum magnitude is limited to 6 ( Richter ). Thus only the faults 1, 4, 5, 6, 7 and 35 need be considered. On this basis the intensity at the site does not exceed V ( MM ). On the basis of the historical earthquakes, the maximum peak ground acceleration for S1 ( OBE) is fixed as 0.05 g after conservatively rounding off the felt peak acceleration ( Annexure 1.5-17 ). The data base for the determination of the shape of horizontal and vertical response spectra consisted of 36 recorded horizontal motion accelerograms and the corresponding 18 recorded vertical motion accelerograms. The database was chosen to reflect the site conditions. At the time of developing the design basis spectra in the year 1988, this was all the records available with the authors ( Ghosh and Banerjee ). The AERB catalogue of earthquakes was published a few years after the submission of the EDB report. It has been verified and found that the AERB catalogue does not contain any additional data beyond what had been considered in the EDB report. Subsequently, the analysis with a larger data base (144 horizontal and vertical motion accelerograms for rock sites ) has confirmed the validity of the earlier results. ( vide A.K. Ghosh et al - Development of Spectral Shapes and Attenuation Relations from accelerograms recorded on rock and soil sites, Report BARC/1998/E/016, Bhabha Atomic Research Centre, Govt. of India, 1998 ). For example, the peak ground acceleration for the postulated event No.4 as given in table 1.5.2.6 calculated using the relation
a = 4.63 exp (0.528 M) (R+40) –1.6
as given in the report mentioned above, gives a PGA of 0.115 g as against 0.135 g calculated using the relation given in the EDB report. The AERB/SG/S-11 was published few years after the publication of the EDB report. It is also observed seen from the report that the design basis response spectrum lies above the mean -plus-sigma level spectrum.
The return period for S1 level is estimated to be about 500 years. The evaluation is based on Cornell’s line source model on Seismic risk analysis ( A.C. Cornell- BSSA, 1968 ( Bulletin of the Seismological Society of America ). The magnitude – frequency relationship was assumed to be the same as that used for Kaiga region near Karwar. By plotting the historic and the GBA data it was observed that this is a highly conservative assumption. Thus the return periods are also rather conservative i.e. the actual return periods are expected to be still higher. Conclusions The peak ground accelerations in various directions for S1 (OBE) and S2 (SSE) are listed in Annexure 1.5-18 and are given below:

Nuclear Power Corporation NPP “Kudankulam” Site Evaluation Report for KKNPP unit 3 to 6
DOCUMENT NO. DATE OF ISSUE REVISION NO. PAGE NO. I.02.KK.3-6.0.0. OO.RS.WD001 March 2011 1 62 of 113
Design PGA S1 (OBE) - 0.05g (H) ( both direction )
- 0.036g ( V )
Return Period - 500 years
Design PGA S2 (SSE) - 0.15g ( H ) ( both direction )
- 0.11g ( V )
Return Period - 50,000 years
1.5.3 Surface Faulting
Micro earthquake study was conducted for eight years from 1990 to 1998 to assess seismic hazard around Kudankulam site with a network of 6 to 8 stations. The study has confirmed the non-existence of surface faulting at site. The list of epicenters along with origin time, magnitude etc, of local micro shocks within 50 Km in the vicinity of network from April 1990 to March 1998 is enclosed in Annexure 1.5-3. The geophysical investigations carried out at site has also confirmed the non-existence of surface faults at the plant site.
1.5.3.1 Evidence of fault offset
There is no evidence of fault offset at or near the ground surface in and around the site.
1.5.3.2 Earthquakes associated with capable faults
There is no record of historically reported earthquakes, which have been associated with faults and part of which is within 8 Km from site. The plot of earthquake epicenters superimposed on a map showing the local tectonic structures are shown in Annexure 1.5-5. During the microseismic study period of 8 years ( April 1990 to March 1998 ), 23 local earthquakes of magnitude 0.2 to 3.5 within 50 Km of Kudankulam have been recorded. There was one shock of magnitude 3.0 to 3.5, four shocks of magnitude 2 to 2.9, eleven shocks of magnitude 1 to 1.9 and seven shocks of magnitude less than 1. The nearest earthquake was at a distance of about 10 Km SSW of Kudankulam of magnitude 1.9 on March 2, 1997 and 10 Km SW of Kudankulam of magnitude 2.5 on July 14, 1997. The magnitude 3.5 earthquake on May 15, 1996 occurred at 8.0 Km north of Kudankulam. Depths of most of the shocks are mostly shallower than 15 Km. Some shocks are of depth of about 25 to 30 Km.

Nuclear Power Corporation NPP “Kudankulam” Site Evaluation Report for KKNPP unit 3 to 6
DOCUMENT NO. DATE OF ISSUE REVISION NO. PAGE NO. I.02.KK.3-6.0.0. OO.RS.WD001 March 2011 1 63 of 113
1.5.3.3 Investigation of capable faults
Studies by GSI including limited field checks indicate in general, that except lineament no.7 and the associated younger faults, all other faults are geologically old and dead. This has also been corroborated from drainage signature and allied geomorphologic expressions.
1.5.3.4 Correlation of epicenters with capable faults
The results of the micro seismic study around Kudankulam site for about eight years have not indicated any active tectonic activity. During the 8 years of monitoring, 32 regional shocks i.e. within 50 –200 Km radius of Kudankulam have been located. Maximum magnitude of shock was 5.1. Four shocks are in the magnitude range 2.0 – 2.9, thirteen shocks are in magnitude range 1.0 –1.9 and five shocks are in magnitude range 0.0-0.9. The neotectonic features have not shown any seismicity. The shocks located at shallow depths are related to lineaments and weak zones of archaean ( very old ) times mapped in the area.
1.5.3.5 Description of capable faults
There are no capable faults at a distance of 8 Km from the site. The lineament / fault 1-1, which has been established to be nonexistent, which was considered to be located 6 Km from the site and which was estimated to have a length of about 155 Km ( >1000 feet ) has been considered for arriving at the seismic potential of the site . The nearest lineament has been located as La- La at 8.5 Km west of Kudankulam. Its estimated length is around 20 Km.
1.5.3.6 Ground truth verification studies within 5 km
The ground truth survey of an area within the 50km radius around the NPP project site is being carried out by National Institute of Rock Mechanics, Kolar, Karnataka. As a part of the site evaluation studies, NIRM has submitted the report of the study conducted of the area having a 5km radius around the NPP. The NIRM report is reproduced in Annexure 2.5 – 19. Brief of the report is reproduced below.
The report is developed from the study of the local geology, geomorphology, Drainage pattern, seismicity of the area from published literatures, identifying any faults / lineaments from satellite images and carrying out field surveys.
The conclusions on the status of lineaments within 5 km radius of the proposed site (unit 3 to Unit 6) are given based on studies of the lineaments through remote sensing, subsequent field checking and plotting of historical earthquake events and the microearthquakes that were recorded by NGRI within 30km radius on the same lineament map. The conclusions are:

Nuclear Power Corporation NPP “Kudankulam” Site Evaluation Report for KKNPP unit 3 to 6
DOCUMENT NO. DATE OF ISSUE REVISION NO. PAGE NO. I.02.KK.3-6.0.0. OO.RS.WD001 March 2011 1 64 of 113
1. Lineament L referred in GSI report is a linear feature, trending in NW-SE direction, and originates from the coast near Vijayapati village. The present studies suggest that this linear feature is an abandoned path of a drainage captured by the present Hanuman Nadi near Panakkudi. There are no gullying activities associated with active erosion or any soft sediment deformation observed within the examined sections. It is seen as series of ponds created to store rain water. Field study does not find any surface evidence of fault or neotectonic activity in this direction. No earthquakes are associated with this lineament. This lineament is having a length of 9.0 km located in NE direction with 2.8 km shortest distance from the site.
2. The lineament La as identified as course of Hanuman Nadi and the field /ground truth verification does not show any indications of neotectonic activity on the surface. This is located about 6.48 km from the site unit 3 and 5.65 km from Unit 6. However, the microearthquake data as recorded by NGRI during 1989-1998 indicate 3 microearthquakes along this lineament with magnitude ranging from 0.6 to 1.6 with focal depth ranging 6 to 8.5 km which are of shallow origin. The microearthquake activity observed in the 50km radius of the project is seen to be very low when compared to other parts of peninsular India. Thus the seismicity around the site is very low and of minor level.
3. The lineament M3 is identified as a N-S trending linear, is the course of an unnamed drainage having length of 2.5 km and located about a shortest distance of 5.57 km from the site (unit 3). The drainage is flowing in flat terrain in a wide area of 100 to 200m and does not develop any valley or path and showing braided nature. The nala floor is of calcareous rocks and devoid of any fractures. There are no evidences of gullying or erosion observed along the length of field check. The present field study did not find any surface evidence of faulting in the area. There are no Quaternary or recent deposits seen along this nala. This may indicate that there is no neotectonic activity along this lineament for at least last 50,000 years. No micro earthquakes are seen to be associated with this feature.
4. L7 is a NE – SW trending Crystalline- sedimentary contact fault as per many geologists. The present study does not find this feature in the field investigations. However, there are discontinuous features of enechelon nature observed in the images. During the SEC meeting at site it was suggested by the experts to consider the SESAT maps for locating this fault. Accordingly, the possible extension in to the Gulf of Mannar was extrapolated taking into consideration of the crystalline sedimentary contact fault. Out of these two considered, the major trend worked out to be 13 km from KKNPP site (shortest distance) where as the curved portion of the fault worked out to be 20km from the KK site. On onshore there is no earthquake along L7 and so it can be considered as not active

Nuclear Power Corporation NPP “Kudankulam” Site Evaluation Report for KKNPP unit 3 to 6
DOCUMENT NO. DATE OF ISSUE REVISION NO. PAGE NO. I.02.KK.3-6.0.0. OO.RS.WD001 March 2011 1 65 of 113
on the land. Though no earthquake activity was associated with this lineament on the land, some concentration of micro earthquakes are seen located in the Gulf Mannar which are outside the 5 km radius.
Additionally expertise from ONGC was consulted to get data in the offshore region.
The offshore extension of the onshore lineament L7 (PBF), was reviewed in detail with the experts of ONGC. As the area within the 5 Km radius is very close to the shore, seismic reflection data of this area was not available with ONGC. However, after detailed discussions it was concluded that the least distance of the possible extension of this fault into the sea from the site, is more than 5 km and could be conservatively taken as 9 km from Unit -3.
The measured distances of the extension of this fault from the various reactor centers are given below.
Sl.
Reactor No: Lat0 N Long 0E Shortest Distance
1 RB - 2 8°10’04” 77°42’43” 8.5 Km
2 RB - 3 8°09’58” 77°42’17” 9.35 Km
3 RB - 4 8009’56” 77042’10” 9.57 Km
4 RB - 6 8°09’52” 77°41’51” 10.15 Km
The seismotectonic evaluation report of area within 5 km radius around KKNPP prepared by NIRM is given in Annexure 2.5-20.
The offshore extension of lineament L 7 as per the out come of discussions with experts from ONGC is given in Annexure 2.5-21
1.5.4 References:
The details included in the above section are from the various investigations and studies carried out by the following agencies: A) Geological Survey of India
A report on the detailed Geotechnical Investigation of the Kudankulam Atomic Power Project, Tamil Nadu (1987 - 88)
B) National Geophysical Research Institute, Hyderabad.
Nuclear Power Corporation NPP “Kudankulam” Site Evaluation Report for KKNPP unit 3 to 6
DOCUMENT NO. DATE OF ISSUE REVISION NO. PAGE NO. I.02.KK.3-6.0.0. OO.RS.WD001 March 2011 1 66 of 113
Report on micro seismic study (1990 - 1998) C) Report by Dr A.K. Ghosh and D. C. Bannerjee i) Earthquake Design Basis Report (1989)
ii) Development of spectral shapes and attenuation relations from accelorograms recorded on rock and soil sites by A.K.Ghosh, K.S.Rao, and H.S. Kushwaha (1998)
D) Atomic Minerals Division, presently known as Directorate for Exploration and
Research, Hyderabad. A note on the status of the lineaments in Kudankulam area ( April – 2000 )
Nuclear Power Corporation NPP “Kudankulam” Site Evaluation Report for KKNPP unit 3 to 6
DOCUMENT NO. DATE OF ISSUE REVISION NO. PAGE NO. I.02.KK.3-6.0.0. OO.RS.WD001 March 2011 1 67 of 113
1.6 Radio - Ecology
1.6.1 External Radiation 1.6.1.1 Survey During May 2001
The background radiation levels due to natural and fall out activity were measured by BARC within a radial distance of 30 km at 36 locations in October 2000 and at 61 locations in May 2001. The background gamma radiation was found to vary from 0.03 µGy/hr to 3.00 μGy/hr. The maximum gamma radiation level was observed at Vatakotai beach, where black patches were observed. Higher background areas, are generally on the beach, where black patches of Monazite could be clearly seen. Kalpakkam site is reported to have a background radiation dose rate of 0.20 µGy/hr to 4.0 µGy/hr. It has been reported that there are monazite sand patches in the coastal areas of Kerala and Tamil Nadu, having thorium concentrations ranging from 8% to 10.5% by weight.
1.6.1.2 Survey During 2004 Background Radiation Level (External) During the pre operational surveys carried out earlier, the local beach sands at some places showed radiation levels as high as 20 µGv/h, which was far higher than the normal background of 0.1 to 0.2 µGy/h, observed in the interior. Therefore, the villages up to a radial distance of 30 km from KKNPP were surveyed for background radiation field on a quarterly basis. In general, the background radiation field was found to vary very widely from place to place and from time to time (Table 1.6.1). The background gamma radiation level was found to vary in the range of 0.1 to 4.8 µGy/h in inland areas whereas in beach areas it ranged from 0.1 to 20 µGy/h. Higher background areas are generally on the beach, where black patches of sand could be clearly seen due to the presence of the radioactive monazite mineral in the local beach sands. Radioactivity Measurements Air Particulates Air particulates samples (49 nos.) were collected on continuous basis at ESL, Anuvijay Township and weekly cumulative samples were analysed for long lived gross alpha and beta activities.
Tritium in Air Air moisture samples (52 nos.) were collected from different locations in and around Kudankulam. Tritium Level was Below Detection Limit (≤0.15 Bq/m3) in all the samples.

Nuclear Power Corporation NPP “Kudankulam” Site Evaluation Report for KKNPP unit 3 to 6
DOCUMENT NO. DATE OF ISSUE REVISION NO. PAGE NO. I.02.KK.3-6.0.0. OO.RS.WD001 March 2011 1 68 of 113
Rain Water Rainwater samples (52 nos.) collected from ESL and MML were analysed for Tritium, pH and conductance. Tritium Activity was Below Detection Limit (7 Bq/L) in all the samples. pH and Conductance ranged from 6.3 to 8.0 and 30 to 270 µS/cm respectively. The Cumulative rainwater was anlysed for Cs-137 and was not detected. Direct External Dose Measurements Measurements of dose due to natural sources of external radiation in the nearby villages up to 20 km radial distance from Kudankulam was carried out by placing environmental Thermo Luminescent Dosimeters (TLDs) at different population centers on quarterly basis, which were analysed at TLD lab of EAD, BARC. It can be seen that the annual dose ranged from 795 to 3456 µGy The gamma radiation survey using the survey meter also showed widely varying radiation levels in beach areas (refer Table1.6.1), which were traced to the presence of low levels of monazite in some of the beach areas.
1.6.1.3 Survey during 2005 Background Radiation Level (External) The villages up to radial distance of 30 km from KKNPP were surveyed for background radiation using sensitive survey meter. The radial distance and direction of locations from KKNPP are fixed by GPS. The summary of the radiation levels is shown in Table 1.6.2. The background gamma radiation was found to vary from 0.08 to 24 µGy/h Higher background areas are generally on the beach, where black patches of sand could be clearly seen which on further investigation was found to be due to the presence of the radioactive monazite mineral in the local beach sands. Radioactivity Measurements
Air Particulates Air particulates samples (50 nos.) were collected on continuous basis at ESL, Anuvijay Township. At KK plant site, air particulates (42 nos.) were collected once in a week for 24 hrs using high volume air samplers. These samples were analysed for long-lived gross alpha and beta activities. The geometric mean values of gross alpha and gross beta activities were 0.03 and 0.58 mBq/m3 at Township whereas at KK site, the values were 0.22 and 2.35 mBq/m3. Tritium in Air Air moisture samples (55 nos.) were collected from different locations in and around Kudankulam. Tritium Level was Below Detection Limit (≤ 0.15 Bq/m3) in all the samples.

Nuclear Power Corporation NPP “Kudankulam” Site Evaluation Report for KKNPP unit 3 to 6
DOCUMENT NO. DATE OF ISSUE REVISION NO. PAGE NO. I.02.KK.3-6.0.0. OO.RS.WD001 March 2011 1 69 of 113
Rainwater Rainwater samples (60 nos.) collected from ESL and MML were analysed for Tritium, pH and conductance. Tritium Activity was Below Detection Limit (7 Bq/l) in all the samples. pH and conductance ranged from 6.3 to 8.0 and 30 to 270 µS/cm respectively. The Cumulative rainwater was anlysed for Cs-137 and was not detected.
1.6.1.4 Conclusions Radiation survey around Kudankulam environment revealed that the background gamma radiation level in Kudankulam area is in the range of 0.1 µGy/h to 1.0 µGy/h in inland areas whereas radiation as high as 24 µGy/h was noticed in beach areas. The comparatively higher radiation levels were observed in coastal regions, where black patches of sand were clearly seen. Gamma spectrometric analysis of the beach sand and soil samples revealed that the elevated background levels are due to the presence of monazite. The annual external exposure due to natural sources of radiation in some of the key population centres ranged from 0.85 to 3.50 mGy. The chief contribution to the high background radiation comes from Th-232 (~ 85%) which is comparable with that of high background radiation areas in Kerala. The natural activities due to Th-232 and U-238 in soil and sand were appreciably higher than world average values while K-40 values were less than the world average values7. Among the terrestrial matrices, plantain leaves, grass and pulses recorded maximum natural radio activity while in the case of aquatic vectors, sea weeds registered maximum natural activities. Thus, sea weeds, grass and plantain leaves serve as good indicator samples. The fall out radio nuclides like Cs-137 and Sr-90 were not mostly detectable in terrestrial food produce and fresh waters while in sea waters and sea foods they were at ambient fall out order.
1.6.1.5 Background Radiation level in Water and Other Items The Environmental Survey Laboratory, had conducted background radiation survey and environmental sampling at and around Kudankulam nuclear power plant site in October, 2000. The radiation was found to vary from 0.03-0.50 µGy/h in water, plant parts, edibles, sediment, seawater and ground water near and around Kudankulam site. Year 2000 and 2001 Water Samples Water samples from sea, wells and ponds were collected from different locations and are analyzed for fallout radionuclides Cs137 and Sr90. As expected, seawater samples were found to have higher concentrations of 137Cs as compared to fresh water samples. 137Cs concentration in fresh water varied from BDL to 6.0 and in seawater from 7.4 to 16.6 mBq/l and that of Sr90, values were below detection in all the samples. The levels at Kudankulam are in the same range as observed elsewhere.

Nuclear Power Corporation NPP “Kudankulam” Site Evaluation Report for KKNPP unit 3 to 6
DOCUMENT NO. DATE OF ISSUE REVISION NO. PAGE NO. I.02.KK.3-6.0.0. OO.RS.WD001 March 2011 1 70 of 113
Aquatic Sediment Samples Natural radioactivity levels in aquatic sediment samples collected during October 2000 were observed to be 8330 + 890 mBq/kg for Cesium and 1380 + 490 mBq/kg for Strontium (BARC, 2001) Year 2004 Seawater Sea Water samples (15 nos.) from around Kudankulam site up to 30 km were analysed for Cs-137 and Sr-90. The Cs-137 activity ranged from 0.7 to 1.3 mBq/l. Sr-90 activity was Below Detection Limit (≤1.0 mBq/l) in all samples. Seawater samples (22 nos.) were analysed for Tritium and activity level was Below Detection Limit (≤7 Bq/l) in all the samples. Freshwater Samples Water samples (12 nos.) from village wells, tube wells and rivers were collected up to a sample size of 200 l and analysed for Cs-137 and Sr-90. Cs-137 and Sr-90 activities were not detected in any of the samples. Water samples (59 nos.) consisting of village wells, tube wells and tap water were analysed for tritium and the level of tritium activity was below detection Limit (≤7 Bq/l) in all the samples. Year 2005 Seawater Coastal sea water samples (35 nos.) from around Kudankulam site up to 30 km were analysed for Cs-137 and Sr-90. The Cs-137 activity ranged from BDL (< 0.4) to 1.4 mBq/l. Sr-90 activity was Below Detection Limit (≤ 1.0 mBq/l) in all samples. The results are given in Table 1.6.3. Table 1.6.4 gives Cs-137 concentration in offshore seawater samples (21 nos.) collected at 1 km, 3 km, 5 km, 7 km and 10 km distance from Kudankulam. It can be seen from the table that the levels of Cs-137 activity is similar to that of the water samples collected near the shore. Seawater samples (36 nos.) were analysed for Tritium and activity level was Below Detection Limit (≤ 7 Bq/l) in all the samples. Freshwater Samples Water samples (20 nos.) from village wells, tube wells and rivers were collected and analysed for Cs-137 and Sr-90. Cs-137 and Sr-90 activities were not detected in any of the samples. Water samples (20 nos.) consisting of village wells, tube wells and tap water were analysed for tritium and the level of tritium activity was below detection Limit (≤ 7 Bq/l) in all the samples.
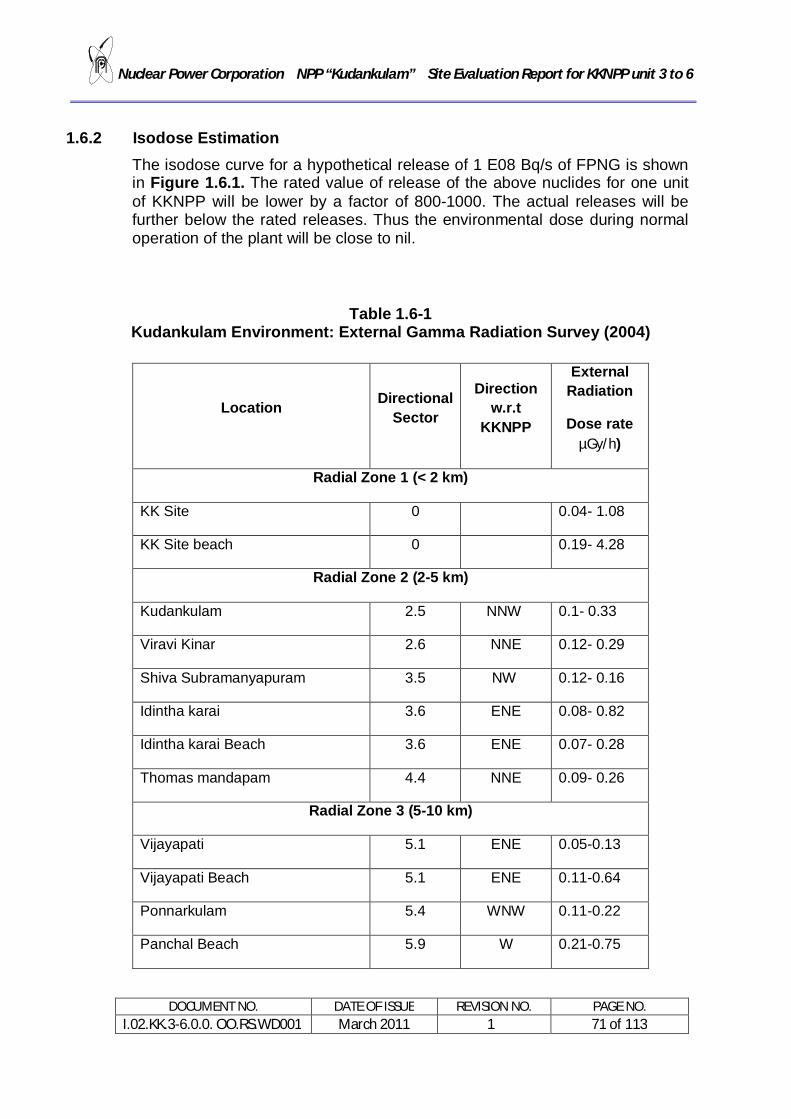
Nuclear Power Corporation NPP “Kudankulam” Site Evaluation Report for KKNPP unit 3 to 6
DOCUMENT NO. DATE OF ISSUE REVISION NO. PAGE NO. I.02.KK.3-6.0.0. OO.RS.WD001 March 2011 1 71 of 113
1.6.2 Isodose Estimation
The isodose curve for a hypothetical release of 1 E08 Bq/s of FPNG is shown in Figure 1.6.1. The rated value of release of the above nuclides for one unit of KKNPP will be lower by a factor of 800-1000. The actual releases will be further below the rated releases. Thus the environmental dose during normal operation of the plant will be close to nil.
Table 1.6-1 Kudankulam Environment: External Gamma Radiation Survey (2004)
Location Directional Sector
Direction w.r.t
KKNPP
External Radiation
Dose rate µGy/h)
Radial Zone 1 (< 2 km)
KK Site 0 0.04- 1.08
KK Site beach 0 0.19- 4.28
Radial Zone 2 (2-5 km)
Kudankulam 2.5 NNW 0.1- 0.33
Viravi Kinar 2.6 NNE 0.12- 0.29
Shiva Subramanyapuram 3.5 NW 0.12- 0.16
Idintha karai 3.6 ENE 0.08- 0.82
Idintha karai Beach 3.6 ENE 0.07- 0.28
Thomas mandapam 4.4 NNE 0.09- 0.26
Radial Zone 3 (5-10 km)
Vijayapati 5.1 ENE 0.05-0.13
Vijayapati Beach 5.1 ENE 0.11-0.64
Ponnarkulam 5.4 WNW 0.11-0.22
Panchal Beach 5.9 W 0.21-0.75

Nuclear Power Corporation NPP “Kudankulam” Site Evaluation Report for KKNPP unit 3 to 6
DOCUMENT NO. DATE OF ISSUE REVISION NO. PAGE NO. I.02.KK.3-6.0.0. OO.RS.WD001 March 2011 1 72 of 113
Location Directional Sector
Direction w.r.t
KKNPP
External Radiation
Dose rate µGy/h)
Sanganeri 6.6 WNW 0.1-0.15
Pullamangalam 6.9 NW 0.1-0.12
Nakaneri 7.0 NW 0.09-0.15
Erukkanthurai 7.3 WNW 0.09-0.2
Kothankulam 7.4 NNE 0.14- 0.17
Sri Ranga Narayanapuram 7.8 W 0.21-0.23
Kuzhanthai Yesu Nagar 7.9 NE 0.33-0.63
Anuvijay Township 8.6 W 0.12-0.22
Koothankuzhi 9.2 NE 1.42-1.48
Koothankuzhi Beach 9.2 NE 0.33-1.42
Ulakarakshakapuram 9.9 NE 0.3-0.33
Pudumanai 10 W 0.11-0.17
Radial Zone 3 (10-15 km)
Chettikulam 10.6 W 0.1- 0.19
Radhapuram 10.8 NNW 0.09- 0.2
Murugandhapuram 11.7 NE 0.55- 1.19
JayaMathapuram 12.7 W 0.14- 0.27
Kootapuli 12.8 WSW 0.16- 1.61
Sankanapuram 12.8 W 0.1- 0.17
Ethangad 13.3 WSW 0.3- 0.35
Thottapalli 13.3 NE 0.45- 0.47
Kannankulam 13.5 W 0.13- 0.16

Nuclear Power Corporation NPP “Kudankulam” Site Evaluation Report for KKNPP unit 3 to 6
DOCUMENT NO. DATE OF ISSUE REVISION NO. PAGE NO. I.02.KK.3-6.0.0. OO.RS.WD001 March 2011 1 73 of 113
Location Directional Sector
Direction w.r.t
KKNPP
External Radiation
Dose rate µGy/h)
Athankarai Pallivasal 14.2 NE 0.18- 0.2
Kanakappapuram 14.4 WSW 0.1- 0.2
Kanimadam 15 WSW 0.1- 0.2
Radial Zone 3 (15-30 km)
Vishwanathapuram 15.2 W 0.05- 0.14
Vallan Villai 15.3 NE 0.25- 0.34
Vadakkankulam 15.5 NW 0.15- 0.2
Levinjipuram 15.6 W 0.1- 0.15
Seelathikulam 15.7 N 0.13- 0.15
Anjugramam 15.9 W 0.1- 0.25
Pazhavoor 15.9 WNW 0.08- 0.14
Navvaladi 16.1 NE 0.24- 0.32
Kasthuri Rangapuram 16.8 NNE 0.14- 0.16
James Town 17.1 W 0.1- 0.14
Palkulam 17.3 WSW 0.11- 0.2
Vattakottai 17.7 WSW 0.6- 0.7
Kumarapuram 18.0 WNW 0.16- 0.21
Azhakappapuram 19.1 W 0.05- 0.14
Shanmugarangapuram 18.6 N 0.10- 0.13
Chinna Muttom beach 18.6 WSW 4.5- 7.8
Laxmipuram 18.6 WSW 1.05- 1.05
Laxmipuram Pond 18.6 WSW 1.97- 10
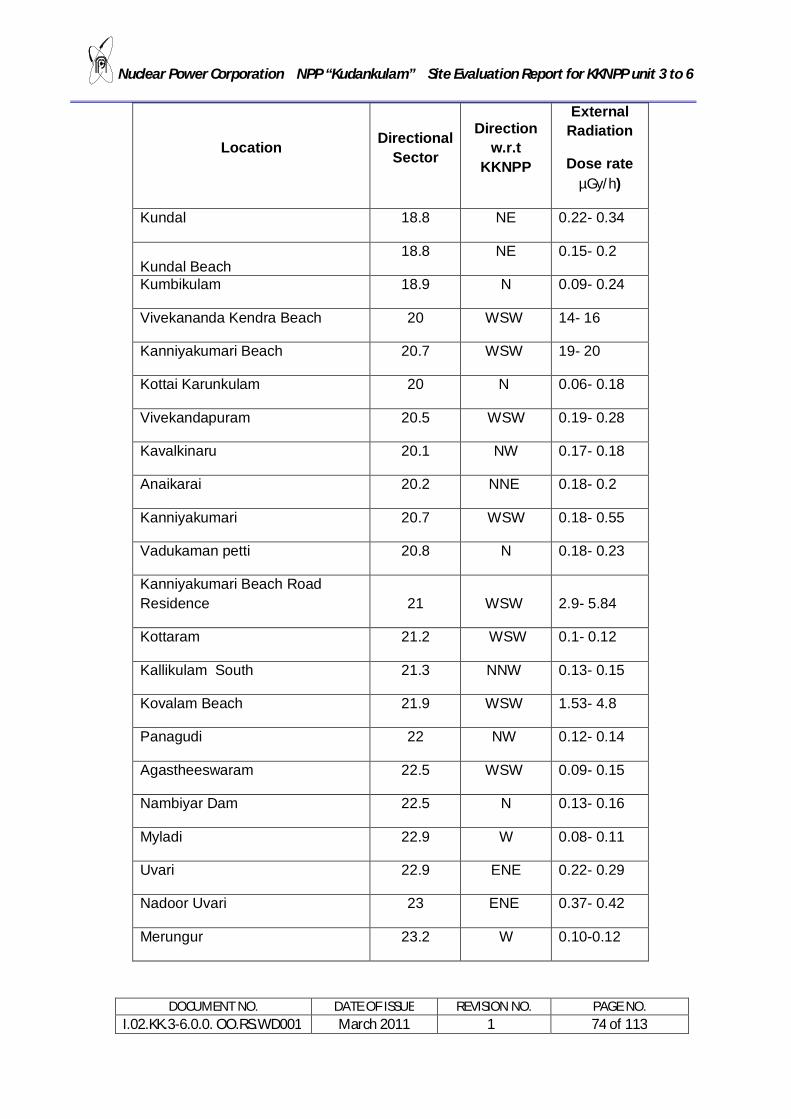
Nuclear Power Corporation NPP “Kudankulam” Site Evaluation Report for KKNPP unit 3 to 6
DOCUMENT NO. DATE OF ISSUE REVISION NO. PAGE NO. I.02.KK.3-6.0.0. OO.RS.WD001 March 2011 1 74 of 113
Location Directional Sector
Direction w.r.t
KKNPP
External Radiation
Dose rate µGy/h)
Kundal 18.8 NE 0.22- 0.34
Kundal Beach 18.8 NE 0.15- 0.2
Kumbikulam 18.9 N 0.09- 0.24
Vivekananda Kendra Beach 20 WSW 14- 16
Kanniyakumari Beach 20.7 WSW 19- 20
Kottai Karunkulam 20 N 0.06- 0.18
Vivekandapuram 20.5 WSW 0.19- 0.28
Kavalkinaru 20.1 NW 0.17- 0.18
Anaikarai 20.2 NNE 0.18- 0.2
Kanniyakumari 20.7 WSW 0.18- 0.55
Vadukaman petti 20.8 N 0.18- 0.23
Kanniyakumari Beach Road Residence 21 WSW 2.9- 5.84
Kottaram 21.2 WSW 0.1- 0.12
Kallikulam South 21.3 NNW 0.13- 0.15
Kovalam Beach 21.9 WSW 1.53- 4.8
Panagudi 22 NW 0.12- 0.14
Agastheeswaram 22.5 WSW 0.09- 0.15
Nambiyar Dam 22.5 N 0.13- 0.16
Myladi 22.9 W 0.08- 0.11
Uvari 22.9 ENE 0.22- 0.29
Nadoor Uvari 23 ENE 0.37- 0.42
Merungur 23.2 W 0.10-0.12

Nuclear Power Corporation NPP “Kudankulam” Site Evaluation Report for KKNPP unit 3 to 6
DOCUMENT NO. DATE OF ISSUE REVISION NO. PAGE NO. I.02.KK.3-6.0.0. OO.RS.WD001 March 2011 1 75 of 113
Location Directional Sector
Direction w.r.t
KKNPP
External Radiation
Dose rate µGy/h)
Mannarpuram 24.3 NNE 0.08- 0.12
Idayankudi 24.4 NE 0.12- 0.16
Tisyanvilai 25.1 NE 0.12- 0.22
Vazhukkanparai 25.8 W 0.12- 0.14
Kizhamanakudi 26.2 WSW 0.17- 0.24
Vallioor 26.8 NNW 0.13- 0.16
Suchindram 27.1 W 0.16- 0.18
Kumarapuram(Tisyanvilai) 27.3 NNE 0.1- 0.14
Parapadi 28.5 N 0.1- 0.13
Ittamozhi 29.2 NNE 0.08- 0.1
Vijaya Narayam 29.2 NNE 0.08- 0.12
Thalapathi Samuthrum 29.8 NNW 0.1- 0.12
Nagarcoil 31.2 W 0.1- 0.13
Papankulam 33.1 N 0.08- 0.12
Source : ESL (BARC)

Nuclear Power Corporation NPP “Kudankulam” Site Evaluation Report for KKNPP unit 3 to 6
DOCUMENT NO. DATE OF ISSUE REVISION NO. PAGE NO. I.02.KK.3-6.0.0. OO.RS.WD001 March 2011 1 76 of 113
Table 1.6-2 Kudankulam Environment: External Gamma Radiation
Survey carried out during the year 2005
Sr. No.
Directional Sector Direction
Radial Zone 2-5 km 5-10 km 10-15 km 15-30 km
Dose rate(µGy/h)
1 A N - 0.09 – 0.22 0.09 – 0.38 0.09 – 0.20
2 B NNE 0.09 – 0.26 0.09 – 0.45 0.09 – 0.21 0.08 – 0.16
3 C NE 0.47 – 0.64 0.11 – 1.60 0.10 – 0.69 0.09 – 0.88
4 D ENE 0.12 – 0.62 0.12 – 0.81 - 0.08 – 1.08
5 L WSW 0.25 – 0.30 0.09 – 0.16 0.08 – 1.03 0.08 – 24.0
6 M W - 0.11 – 0.50 0.08 – 0.85 0.08 – 0.40
7 N WNW - 0.08 – 0.44 0.10 – 0.27 0.08 – 0.29
8 O NW 0.08 – 0.18 0.08 – 0.21 0.08 – 0.25 0.08 – 0.22
9 P NNW 0.08 – 0.21 0.08 – 0.13 0.08 – 0.20 0.08 – 0.30
Source : ESL (BARC)
Table1.6-3
Kudankulam Environment: Radio Cesium Activity
in Coastal Sea Waters (2005)
Sr. No
Location No of Samples
Cs-137 Activity (mBq/l)
Minimum Maximum
1 Anuvijay Township 4 0.8 ± 0.2 1.1 ± 0.2
2 Idinthakarai 4 1.1 ± 0.2 1.1 ± 0.2
3 Kanniyakumari 3 0.7 ± 0.2 1.1 ± 0.2
4 KK Site 3 0.8 ± 0.2 1.1 ± 0.1
5 Kootapuli 3 0.9 ± 0.1 1.3 ± 0.1

Nuclear Power Corporation NPP “Kudankulam” Site Evaluation Report for KKNPP unit 3 to 6
DOCUMENT NO. DATE OF ISSUE REVISION NO. PAGE NO. I.02.KK.3-6.0.0. OO.RS.WD001 March 2011 1 77 of 113
6 Kuthankuzhi 3 0.7 ± 0.2 1.1 ± 0.2
7 Panchal 1 0.8± 0.2 ---
8 Perumanal 3 0.8 ± 0.2 1.4 ± 0.1
9 Vijayapati 4 0.7 ± 0.2 1.2 ± 0.1
10 VV Mill 4 < 0.4 1.1 ± 0.2
11 Uvari 3 0.8 ± 0.2 1.4 ± 0.1
Total 35 GM: 0.95 GSD : 1.3
Table 1.6-4
Kudankulam Environment: Radio Cesium Activity
in Off-shore Sea Waters (2005)
Sr. No
Distance from the shore
No. of Samples
Cs-137 Activity (mBq/l)
Minimum Maximum
1 1.0 km 3 0.67±0.20 0.71 ± 0.18
2 3.0 km 3 0.87±0.24 1.07 ± 0.20
3 5.0 km 3 0.69± 0.17 0.72 ± 0.22
4 7.0 km 6 0.60 ± 0.19 1.16 ± 0.17
5 10.0 km 6 0.80 ± 0.14 0.95 ± 0.18
Total 21 GM: 0.82 GSD : 1.2
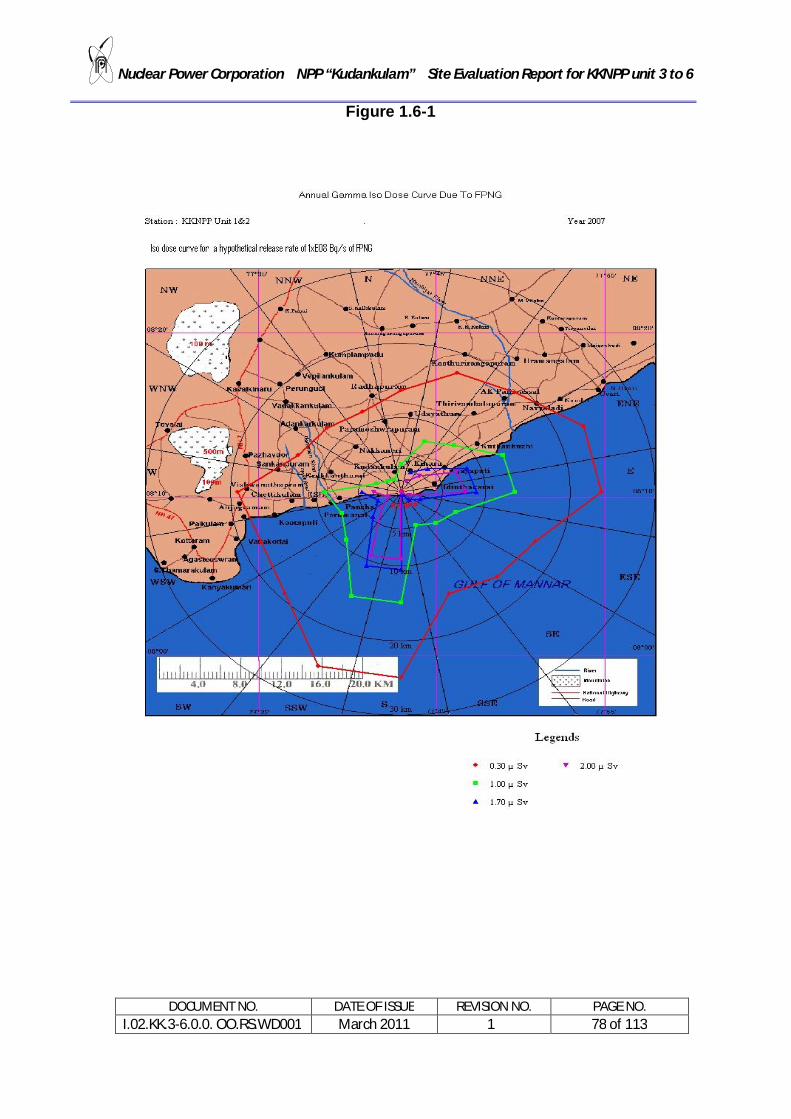
Nuclear Power Corporation NPP “Kudankulam” Site Evaluation Report for KKNPP unit 3 to 6
DOCUMENT NO. DATE OF ISSUE REVISION NO. PAGE NO. I.02.KK.3-6.0.0. OO.RS.WD001 March 2011 1 78 of 113
Figure 1.6-1

Nuclear Power Corporation NPP “Kudankulam” Site Evaluation Report for KKNPP unit 3 to 6
DOCUMENT NO. DATE OF ISSUE REVISION NO. PAGE NO. I.02.KK.3-6.0.0. OO.RS.WD001 March 2011 1 79 of 113
1.6.3 Environmental Impact Assessment
The Comprehensive Environmental Impact Assessment studies for the proposed expansion of KKNPP 3-6 by National Environmental Engineering Research Institute -NEERI, Nagpur was issued in June 2007 had incorporated assessment of baseline environmental quality data during three seasons of the year 2003 for identifying, predicting and evaluating the potential impacts due to the proposed expansion of power plant unit at Kudankulam and for evolving an effective Environmental Management Plan ( EMP) for minimizing the adverse impacts. Baseline data was collected for various environmental components, viz. air, noise, water, land, biological and socio-economic environment within the impact zone of 30km radial distance from the proposed power plant site.
1.6.3. 1 Baseline Environmental Status and Assessment of Impacts
1.6.3.1.1 Air Environment
Suspended Particulate Matter (SPM), Respirable Suspended Particulate Matter (RSPM), SO2 & NOx were monitored on 24 hourly basis. Respirable suspended particulate matter was monitored at a few selected locations in winter season. The data collected was subjected to statistical analysis to arrive at various percentile values. Average SPM concentration (µg/m3) in the study area during winter, summer and post monsoon reason varied from 47-116, 35-137 and 17-114 respectively with maximum and minimum concentrations varying from 141, 270, 190 and 35, 21, 10 respectively. The maximum concentration was recorded at Vijayapathy (winter season), Radhapuram (Summer season) and Nagercoil (Post monsoon season). As regards the 98th percentile values, these values are below CPCB limit of 200 µg/m3 for residential, rural and mixed use area except at Radhapuram in summer season for a short period only. The higher SPM concentrations are primarily due to natural dust getting air borne due to human activities and blowing wind. Three sampling stations viz. Kudankulam (Project Site), Kudankulam township (D/s wind direction), Chettikulam (D/s wind direction) and Udaythur (U/s wind direction) were selected for measurement of RSPM concentration . The average concentrations of RSPM in winter, summer and post monsoon season varied in the range of 38-56 µg/m3, 13-19 µg/m3, and 13-19 µg/m3 respectively. The 98th percentile values as well as the maximum values of RSPM are found to be below the national standard set up by CPCB (100 µg/m3) for residential and rural area. The average concentrations of sulphur-di-oxide in winter, summer and post monsoon season varied in the range of 6-9 µg/m3, 6 µg/m3 and 6 µg/m3 respectively. The 98th percentile values of sulphur-di-oxide are below the AAQM standard set up by CPCB (80 µg/m3) for residential and rural area.

Nuclear Power Corporation NPP “Kudankulam” Site Evaluation Report for KKNPP unit 3 to 6
DOCUMENT NO. DATE OF ISSUE REVISION NO. PAGE NO. I.02.KK.3-6.0.0. OO.RS.WD001 March 2011 1 80 of 113
The average concentration NOx varied in the range of 3-9 µg/m3, 3-5 µg/m3 and 3 µg/m3 in winter, summer and post monsoon season respectively. The data reveals that the maximum value of 98th percentile was 37 µg/m3 at Kanniyakumari in summer season which is below the national standard of 80 µg/m3. The villages up to radial distance of 30 km from KKNPP were surveyed for background radiation using sensitive survey meter. The radial distance and direction of locations from KKNPP are fixed by GPS. The background gamma radiation was found to vary from 0.08 to 24 µSv/h. Higher background areas are generally on the beach, where black patches of sand could be clearly seen which on further investigation was found to be due to the presence of the radioactive monazite mineral in the local beach sands.
1.6.3.1.2 Noise Environment
The noise levels were monitored during day and night time within 10 km, 10-20 km and 20-30 km radial distance. Noise levels were in the range of 40-80 dBA. Higher noise levels were observed at Kanniyakumari, Suchindram and Nagercoil being the major towns or pilgrim center. Higher noise levels were prevailing due to the commercial activities and vehicular traffic. At project site, the noise levels were observed to be in the range of 60-65 dBA during day and 50 - 55 dBA during the night. The noise levels within 10 km radius varied between 46 - 65 dBA during day time and 40 - 55 dBA during night time. The noise levels within the 10-20 km radius varied between 40 - 80 dBA during daytime and 35 - 67 dBA during night time. The noise levels between 20 - 30 km radial area varied between 40 - 80 dBA during day time and 35 - 70 dBA during night time. The results of noise levels monitoring study indicate that in general, the noise levels measured at various places are within the standards prescribed by the Central Pollution Control Board, MoEF 1998.
1.6.3.1.3 Water Environment
For water quality assessment within the study area, samples were collected from groundwater, surface water and marine water in summer, winter and post monsoon season. The groundwater quality was assessed by collecting samples from 7 borewells and 5 dug wells in 12 villages. Two river water sampling locations, namely Sangner (PSP) and Thiruvambalapuram were identified and samples were collected for various parameters. Seawater samples were collected from five locations identified over a stretch of 2 km parallel to the shoreline with central sampling point being just opposite to the proposed NPP site. Two sets of samples were collected each at 50 and 100 meters beyond the low tide water line. Samples were collected once in low tide period.
Nuclear Power Corporation NPP “Kudankulam” Site Evaluation Report for KKNPP unit 3 to 6
DOCUMENT NO. DATE OF ISSUE REVISION NO. PAGE NO. I.02.KK.3-6.0.0. OO.RS.WD001 March 2011 1 81 of 113
Ground water:
The physical parameters pH, temperature and turbidity were found to vary in the range of 7.3-8.5, 23-35 oC, and 0.4-3.0 NTU respectively. Total dissolved solids and conductivity ranged from 171-10110 mg/l, 830-14529 mg/l, 110-1550 mg/l and 300-14000 µmhos, 1200-19000 µmhos, 180-2100 µmhos in winter, summer and postmonsoon season respectively. Highest concentration of TDS was observed at Kamaneri and Panchal. Total alkalinity, total hardness and chlorides were found to vary in winter summer and post monsoon season in the range of 103-302 mg/l, 139-339 mg/l, 71-425 mg/l; 98-6450 mg/l, 97-6476 mg/l, 50-417 mg/l and 23-5463 mg/l, 139-5630 mg/l, 10-479 mg/l respectively. Total hardness was observed to be highest at Kamaneri followed by Kudankulam. Fluoride was observed to vary from 0.21-1.06 mg/l in winter season and 9-80 mg/l in post monsoon season. Sulphates was found to vary from 11-455 mg/l in winter and summer season. Sodium and potassium were observed in winter, summer and Post monsoon season to vary in the range of 20-865 mg/l, 111-1025 mg/l, 23-425 mg/l and 2-21 mg/l, 7-112 mg/l, 3-16 mg/l respectively. The nutrients nitrates and total phosphates were observed in winter, summer and post monsoon season to vary from 0.06-46.5 mg/l, 0.3-85 mg/l, 0.5-4.5 mg/l and 0.27-1.68 mg/l, 0.06-2.02 mg/l, 0.1-2.2 mg/l respectively. Higher levels of nitrates were recorded in Ponnarkulam and Panchal. The COD values ranged from 1-16 mg/l, 12-666 mg/l, and 3-6 mg/l in winter, summer and post monsoon season respectively. Highest COD was observed in Bairabikinaru borewell in summer season. The heavy metal content in groundwater was observed to be very low and below the stipulated standards for drinking water at many places, while the values of total hardness, chlorides, sulphates and nitrates were found to be higher than the Indian Standard/specifications for drinking water (IS:10500, 1991). Surface water:
The surface water was mostly alkaline with pH around 7.9. The temperature of water ranged from 28 oC to 35 oC. The turbidity of the water samples varied from 0.5 to 2 NTU. The variation in other parameters was: total suspended solids (ND-<1 mg/l), total dissolved solids (170 - 40511 mg/l), conductivity (210–20500 µmhos/cm). In inorganic parameters, alkalinity ranged from 77–116 mg/l, total hardness 82-7492mg/l, chlorides 12–20928 mg/l, sulphates 12-3500 mg/l, fluoride 0.22-10 mg/l, sodium 18-8125 mg/l and potassium 1–350 mg/l. The nutrients viz. nitrate and phosphate varied from 0.07-0.65 mg/l, and 0.10-0.9 mg/l respectively. Dissolved Oxygen and COD were found to vary from 5.6 to 6.7 mg/l and 4 to 5 mg/l respectively. Oil & Grease and hydrocarbons were not detected in the water samples.

Nuclear Power Corporation NPP “Kudankulam” Site Evaluation Report for KKNPP unit 3 to 6
DOCUMENT NO. DATE OF ISSUE REVISION NO. PAGE NO. I.02.KK.3-6.0.0. OO.RS.WD001 March 2011 1 82 of 113
Marine water:
It is seen that there is no remarkable variation in marine water quality collected at 50m and 100m distances from sea shore. The physical parameters in winter, summer and post monsoon season observed were: temperature (25-29 oC, 28-30 oC, 29-30 oC), pH (7.9-8.3, 7.4-7.9, 7.7-8.2), turbidity (3-9 NTU, 4-8 NTU, 3-31 NTU), TSS (8-20 mg/l, 16-20 mg/l, 27-64 mg/l), TDS (37918-39120 mg/l in post monsoon season) and conductivity (45-50 mS/cm, 84-55 mS/cm, 50 mS/cm) respectively. The salinity was observed to be uniform and varied from 33-34. Total alkalinity varied from 118-136 mg/l, 125-155 mg/l and 130-145 mg/l in winter, summer and post monsoon season respectively, whereas organic load in terms of organic carbon varied between 2-4 mg/l indicating insignificant organic pollution. Concentrations of heavy metals in case of lead, chromium, cadmium, are observed to be higher than the normal seawater ranges whereas levels of iron, manganese and zinc are within the levels. Fresh water requirement (about 13484 m3/day for KKNPP 3-6 ) is being planned by putting desalination plant similar to KKNPP 1&2. For the proposed 4 units, it is proposed to draw seawater (2,79,36,000 m3/day) for cooling purposes (condenser cooling) and desalination plant.
1.6.3.1.4 Land Environment
Fourteen sampling locations within 30 km radius of the proposed project site were identified for collection of soil samples. Physical characteristics of soil samples are delineated through specific parameters, viz., particle size distribution, texture, bulk density, porosity and water holding capacity. It is observed that soil texture varied from sandy clay loam to sandy loam. Regular cultivation practices increase the bulk density of soils, thus, inducing compaction. This results in reduction in water percolation rate and penetration of root through soils. The bulk density of soils in the region is found to be in the range of 1.28-2.01 gm/cm3 which is considered as moderately good. Soil porosity is a measure of air filled pore spaces and gives information about movement of gases, inherent moisture, development of root system and strength of soil. The porosity and water holding capacity of soils are in the range 27-61 % and 16-49% respectively. The soils in the impact zone have a sandy loam texture with moderate water holding capacity. PH is an important parameter indicative of the alkaline or acidic nature of the soil. It greatly affects the microbial population as well as the solubility of metal ions and regulates nutrient availability. It was observed to be neutral to slightly alkaline (within the range of 6.80 to 8.27) thus indicating that the soils are conducive for the growth of plants. Electrical conductivity, a measure of soluble salts in the soils, is in the range of 0.18 to 0.82 mS/cm.

Nuclear Power Corporation NPP “Kudankulam” Site Evaluation Report for KKNPP unit 3 to 6
DOCUMENT NO. DATE OF ISSUE REVISION NO. PAGE NO. I.02.KK.3-6.0.0. OO.RS.WD001 March 2011 1 83 of 113
Variations in Cation Exchange Capacity (CEC) of the soils were observed in the range from 7-45 indicating that soils are very low to moderate in fertility and that most of the soils have limited to low adsorptivity. Amongst the exchangeable cations, Ca2+ and Mg2+ are observed to be in the range of 0.55 to 2.24 meq/100 gm and 0.90 to 3.40 meq/100 gm of soil respectively. Na+ and K+ are in the range of 0.03 to 0.28 and 0.002 to 0.019 meq/100 gm of soil respectively. Organic matter present in soil influences its physical and chemical properties. It commonly accounts for as much as one third or more of the cation exchange capacity of the surface soils and is responsible for stability of soil aggregates. Organic matter and available nitrogen in soil samples vary in the range of 0.14 to 0.95% and 31.2 to 67.6 meq/100gm respectively. Available phosphorus varies from 0.30 to 2.68 meq/100gm. This shows that the soils are moderately good in organic and nutrient content. All the soils are poor in fertility status. Plants require some of the heavy metals at microgram levels for their metabolic activities. These heavy metals are termed as micronutrients. Their deficiency becomes a limiting factor for plant growth, but at the same time their higher concentration in soils may lead to toxicity for plant growth. About 60% of the area within 30 km radius around the site falls in the sea. The remaining area consists of agricultural land and barren land. The main agricultural crops are paddy, millets and chillies and subsidiary crops are tobacco, pulses, cotton and oil seeds. About 35% of the area within 2 km radius (plant boundary) around the proposed reactors falls in the sea. The land acquired was barren and unirrigated..
1.6.3.1.5 Biological Environment 1.6.3.1.5.1 Aquatic
Under aquatic biology, water samples were collected from surface water, ground water and marine water. Shannon Wiener Index is a measure of diversity of plankton, which takes into account the total count, and individual species count in a water sample collected from a particular source Surface water:
Total count of phytoplankton population varied from ND to 9000 phytoplankton/ml during the study period. The water sample collected from Sriranganarayanpuram showed the presence of phytoplankton in summer and winter season. The Shannon Wiener Index was very low showing low biodiversity and low productivity of water samples. Total count of zooplankton population varied from 55-73 zooplankton/m3 (winter), 200-2300 zoplankton/m3 (summer) and 47-4000 zoplankton/m3 (post monsoon). The total count was observed to be low. The number of zooplankton species per water sample was also very low. The Shannon Wiener Diversity Index values were low indicating low biological productivity of water.
Nuclear Power Corporation NPP “Kudankulam” Site Evaluation Report for KKNPP unit 3 to 6
DOCUMENT NO. DATE OF ISSUE REVISION NO. PAGE NO. I.02.KK.3-6.0.0. OO.RS.WD001 March 2011 1 84 of 113
The list of species of phytoplankton and zooplankton a few species are recorded from surface water samples. Out of these, Oscillatoria, Chlorella and Anacystis were found to be indicators of water pollution, indicating moderate level of organic pollution in surface water samples. Ground water:
Phytoplankton and Zooplankton are not recorded from borewell water samples. However, some of the dugwell water samples showed the presence of planktons in them. Phytoplanktons are recorded from dug well water samples only in winter season. The total algal count was observed to vary from 630 to 855 algae per ml. The count is very low and show low productivity of ground water. The phytoplankton population was dominated by chlorophyceae followed by cyanophyceae showing the high salt content of groundwater. Zooplanktons are recorded from dugwell samples. The total count varied from 55-73 zooplankton/m3 (winter), 200-2300 zooplankton/m3 (summer) and 47-73 zooplankton/m3 (post monsoon). The count is very low showing low productivity of groundwater. Diversity of zooplankton is very less in each water sample. Marine water:
The total count of phytoplankton varied from 1950-4275 phytoplankton/l (winter), 3200 phytoplankton/l (summer) and 1500 phytoplankton /l (Post monsoon). Shannon Wiener Diversity Index varied from 2.12 to 2.45 in winter season while it was 0 in summer and post monsoon season. This indicates that biodiversity is less in marine water. The low phytoplankton count and low diversity indicate species that marine water quality is good, with slight contamination. The total count of zooplankton was observed to range from 320-511 zooplanktons/m3 (winter), 1500-1800 zooplanktons/m3 (summer), and 1500-1800 zooplanktons/m3 (post monsoon), indicating low biodiversity. Thus the marine water was observed to be of good quality. Presence of pollution indicator species indicate slight contamination of marine water.
1.6.3.1.5.2 Terrestrial Aspects
The 30-Km radius study area around Kudankulum Nuclear Power Plant includes part of Kanniyakumari and Tirunelveli Districts of Tamil Nadu State. The Tirunelveli district does not have any forest cover. Most of the area is occupied by agriculture land i.e. 23% (scrub land as per remote sensing data) while Kanniyakumari district showed slightly denser vegetation with hilly forested area on the north side i.e. Tadakmalai reserve forest. Remote sensing data indicate that the vegetation is present in only 8.73% of study area (which is present in Kanniyakumari district) while scrub land occupies 23.39% of study area which is mainly agricultural land.

Nuclear Power Corporation NPP “Kudankulam” Site Evaluation Report for KKNPP unit 3 to 6
DOCUMENT NO. DATE OF ISSUE REVISION NO. PAGE NO. I.02.KK.3-6.0.0. OO.RS.WD001 March 2011 1 85 of 113
Forest in Kanniyakumari district constitutes the Southern tip of Western Ghat Forest. Various types of forest from luxuriant tropical wet evergreen forest to Southern thorn scrub forests occur in this division because of diverse locality factor (edaphic and biotic), varying rainfall from 50 to 310 cm and elevation from sea level to 1829 m. Thorn scrub forest is more common in plain coastal areas around Nuclear power Plant while rich forest is present at higher altitudes in Kanniyakumari district beyond 16-km distance. The most dominant trees in this region are Cocos nucifera, Borassus flabellifer, Dendrocalamus strictus, Ailanthus excelsa and Premna tomentosa forming pure and mixed stands, While Saraka indica, Acacia intsia, Acacia latronum, Bauhinia malbarica, Bombax ceiba, Delonix elata, Mangifera indica, Santalum album, are found in co-association and phytosociological order. Frequency of climbers is more around the villages, but lianas are restricted only to dense vegetation localities and in hilly forest areas in Kanniyakumari district. During the vegetation survey of study area of proposed project, a total of 200 plant species were recorded belonging to 61 families. A total of 94 tree species, 52 shrub species and 54 herb species were recorded from the study area. Dominant families recorded in the study area in descending order (based on number of species in each family) are Fabaceae, Euphorbiaceae, Verbenaceae, Combretaceae, Urticaceae, Malvaceae, Rubiaceae, Acanthaceae, etc. Out of total 200 plants studied, 19 species of trees, 5 species of shrubs and 7 species of herbs are of medicinal value. The percentage of medicinal plants found in the study area is about 15 %. However, these medicinal plants are not commercially exploited for trade due to scarce growth and limited distribution.
1.6.3.1.6 Socio-economic Environment
Keeping Kudankulam (NPP) site as a focal point, a 30 km. radius area was delineated as the study area, which incorporates mainly two Districts, viz. Kanniyakumari and Tirunelveli. The total population of the study area is 404715. The literacy rate is 69% and more than 35.38% are employed. All the villages have primary & middle schools, medical facilities in terms of community health workers and registered medical practitioners, post offices, buses for transportation and electricity. Socio-economic survey was conducted in 21 villages located in all directions with respect to the project site and data was collected for the indicators of quality of life. The average cumulative Quality of Life Index (QoL) of the study area was estimated to be 0.48 indicating satisfactory. It is envisaged that with the implementation of welfare measures including provision of basic facilities / amenities would result into increase in QoL index. Overall, there would be

Nuclear Power Corporation NPP “Kudankulam” Site Evaluation Report for KKNPP unit 3 to 6
DOCUMENT NO. DATE OF ISSUE REVISION NO. PAGE NO. I.02.KK.3-6.0.0. OO.RS.WD001 March 2011 1 86 of 113
positive impact on socio-economic environment due to commissioning of KKNPP 3-6.
1.6.3.2 Environment Management Plan
Based on the baseline data collected during all three seasons for various environmental components viz. air, noise, water, land, biological and socio-economic and also prediction and evaluation of impacts, strategies and control measures have been formulated for minimizing the potential adverse impacts due to installation and commissioning of proposed 4 X 1000 MWe nuclear power plant expansion.
1.6.3.3 Environmental clearance
Ministry of Environment and Forest (MOEF) has accorded environmental clearance under Environment Impact Assessment Notification 2006 to KKNPP 3&4 in September 2008. We are in consultation with MOEF for the environmental clearance of KKNPP 5&6.

Nuclear Power Corporation NPP “Kudankulam” Site Evaluation Report for KKNPP unit 3 to 6
DOCUMENT NO. DATE OF ISSUE REVISION NO. PAGE NO. I.02.KK.3-6.0.0. OO.RS.WD001 March 2011 1 87 of 113
1.7 Thermal pollution
1.7.1 Thermal pollution due to hot water discharge into water body.
Thermal pollution in the sea of Kudankulam is mainly due to discharge of condenser and other cooling water circuits. As per the proposed intake and outfall layout for all the six units the discharges will be let into a common discharge channel which will be situated between grids 1000 West to 2000 West. A detailed thermo hydraulic study was conducted using an advanced mathematical model generated using MIKE 21 by CWPRS, Pune. In this study it was concluded that using the final proposed layout of in take & outfall system, the temperature at the confluence of sea and the discharge channel outlet will be within the permissible limit of 7 degree centigrade over the ambient temperature of the sea water ( Refer Annexure 1.3.1). It was also concluded that the common discharge channel of length 4km with 2 controlling gates each end will disperse the warm water from the discharge channel into the deep sea of Gulf of Mannar and high quantity of discharge from outfall will force a proper mixing thereby nullifying the detrimental effect of thermal plume for marine life.
Further presently RF designers are evaluating various options of the intake and out fall scheme by carrying out mathematical thermo hydraulic studies. The final scheme will be selected based on the techno economic evaluation of the feasible schemes, and taking into consideration ease of construction, under sea inlet for prevention of floating debris / oil entering the intake, minimum impact to the shore line etc.
The final scheme of intake/outfall of the NPP will satisfy the requirement of the MoEF with regard to the temperature rise in the receiving water body does not exceed 70 C over and above the ambient temperature due to the hot water discharge from the condenser
1.7.2 Thermal pollution due to the discharges into the atmosphere.
The Kudankulam reactors are of PWR type and require a large quantity of cooling water and as these units situated on the shore of Gulf of Mannar cooling water is available in abundance in the immediate vicinity. Therefore, there is no requirement of using Natural Draft Cooling Tower (NDCT) or Induced Draft Cooling Tower (IDCT). As a result, there is no possibility of thermal pollution to the atmosphere on account of the cooling towers. The pollution control norms of the Tamilnadu PCB will be adhered with regards to the operation of DG sets.

Nuclear Power Corporation NPP “Kudankulam” Site Evaluation Report for KKNPP unit 3 to 6
DOCUMENT NO. DATE OF ISSUE REVISION NO. PAGE NO. I.02.KK.3-6.0.0. OO.RS.WD001 March 2011 1 88 of 113
1.8 Design Information of proposed Project 1.8.0 Type of plant and location
The proposed rector plants for KKNPP 3-6 are water cooled water moderated power reactors (VVER-1000) similar to the reactors of KKNPP 1&2. Kudankulam site is near to Kudankulam village in Radhapuram taluk of Thirunelveli Kottabomman district of Tamil Nadu state.
1.8.1 Safety approach:
The Kudankulam Nuclear Power Plant (KKNPP) 3-6 design is based on the requirements of Russian codes and standards. IAEA safety codes and guides are taken into account in design and also agreed requirements of AERB codes and guides.
1.8.1.1 Safety Objectives
The objective of nuclear power plant safety is the protection of individuals, society and the environment from undue radiological hazard. Accordingly, the design and operation of nuclear power plants are aimed at achieving following safety goals: 1. During routine operation, to minimize the radiation dose to plant personnel
and to members of the public in accordance with the principle of “As Low as Reasonably Achievable” (ALARA), and in any case not in excess of the prescribed limits specified by AERB.
2. To minimize the risk to public from release of radioactivity, if any, under abnormal and postulated accident conditions. For normal and off normal scenarios within the design basis (i.e. the operational transients and accidents that have been considered in the plant design) the radioactivity releases will be within the specified limits. This requirement is met by incorporating engineered safety features in the plant design with sufficient redundancy and diversity. Further the design philosophy ensures that plant conditions associated with high radiological consequences have low probability of occurrence, and plant conditions with high likelihood of occurrence have only small or no radiological consequences.
3. Incorporate emergency preparedness measures to deal with situations arising out of highly unlikely accidents.
4. To meet the Nuclear Security requirements as specified in AERB manual on Security.
1.8.1.2 Principles & Guidelines
The safety goal for protection of public from accidental release of radioactivity is achieved by adherence to the following well established principles and guidelines:

Nuclear Power Corporation NPP “Kudankulam” Site Evaluation Report for KKNPP unit 3 to 6
DOCUMENT NO. DATE OF ISSUE REVISION NO. PAGE NO. I.02.KK.3-6.0.0. OO.RS.WD001 March 2011 1 89 of 113
1. Application of defence-in-depth approach, incorporating several echelons
of defense, viz. (a) Sound design, construction and operation to prevent failures and
deviation from normal operation.
(b) Detect and intercept failures and deviations from normal operation conditions, in order to prevent these from escalating into accidents.
(c) Limit the consequences of accident conditions through engineered safety features.
(d) In addition to the above, for Beyond Design Basis Accidents (BDBA), protection of the public is ensured by making use of the safety capability of the plant, and appropriate plans for emergency actions.
2. Application of defence-in-depth concept to containment of radioactive material, by a series of physical barriers.
3. Provision of more than one means/systems for the performance of each of the three safety functions, viz. shutdown of reactor, core cooling, and containment of radioactivity.
4. Provision of intermediate close loop process water system for cooling all the reactor process system i.e. the reactor process system is cooled by intermediate reactor cooling water system and this in turn is cooled by sea water system. Thus in view of the closed primary and secondary systems, radioactivity is well confined to the system itself.
5. Provision of redundancy in safety related systems such that minimum safety function can be performed, even in the event of single failure in the system.
6. Specifying unavailability targets for safety systems and equipment. 7. Provision of physical and functional separation, and independence to the
extent practicable, in various systems to prevent common cause failure. 8. Consideration given at all stages of design for components, equipment,
logics and instrumentation that in case of a failure, they fail in safe direction.
9. Provision of periodic testability of active components in safety systems, preferably on line as far as possible.
10. Application of appropriate Quality Assurance measures during design, construction, commissioning and operation of the plant to ensure a high standard of safety and availability.
1.8.2 Brief description of KKNPP 3-6 (4x1000 MWe) PROJECT
1.8.2.1 General Description
The VVER Nuclear Power Plant (pressurized water reactor) at KKNPP 3 to 6 is similar to KKNPP 1&2 (repeat design) which consists of four Primary Coolant System (PCS) loops transferring the energy from the reactor to the

Nuclear Power Corporation NPP “Kudankulam” Site Evaluation Report for KKNPP unit 3 to 6
DOCUMENT NO. DATE OF ISSUE REVISION NO. PAGE NO. I.02.KK.3-6.0.0. OO.RS.WD001 March 2011 1 90 of 113
Steam Generator (SG). Each loop of PCS consists of a Reactor Coolant Pump (RCP) and a SG, independently connected to the Reactor. The Fuel Assemblies (FA) are arranged in a lattice in the Reactor. The In/Out movements of the Control & Protection System Absorber Rods (CPS-AR) control the nuclear fission energy generated in the Reactor. The forced circulation of Primary Coolant by RCP transfers the Heat Energy in the Reactor to the SG. The Primary coolant flows through the tube side of the SG and after transferring the heat energy to the Secondary side water on the shell side of the SG, returns to the RCP suction.
The water in the shell side of the SG, called Secondary side is evaporated and the steam is fed to the Turbo-Generator to generate electricity. The Steam works on the blades of the turbine, thereby rotating the Turbo-Generator shaft, expands and enters the Condenser. Condenser cooling water system condenses the low enthalpy Steam that enters the condenser to water.
1.8.2.2 The Nuclear Steam Supply system (NSSS):
VVER is an acronym for Russian designed “Water Cooled, Water Moderated Energy Reactor”. The VVER reactors belong to the family of Pressurized Water Reactors (PWRs), which are the predominant type in operation, world over. This type of reactor uses light water as coolant and moderator and enriched uranium (about 4.0% U235) as fuel. The VVER-1000 reactor plant consists of four circulating loops each containing a horizontal steam generator and a main circulating pump. The loops are connected with the Reactor Pressure Vessel (RPV) Assembly by interconnecting piping, Pressurizing System, High Pressure Emergency Injection Systems, passive parts of Emergency Core Cooling System hydro-accumulators, Emergency and Planned Cooling Down of Primary Circuit and Fuel Pool Cooling System and Chemical and Volume Control System. The Reactor plant also consists of reactor protection and regulation system, engineered safety features actuation systems, auxiliary system, fuel handling and storage system, steam generator emergency cool down and blow down system, etc. and passive heat removal system to cater to total loss of power in the station.
The reactor that is planned at Kudankulam site is similar to KKNPP 1&2, which incorporates all the features of a modern PWR as per the current Russian, Western, and IAEA standards.
1.8.2.3 Safety Aspects
The design of reactors is based on the basis of the requirements of the modern safety regulations accepted in Russian Federation nuclear power as well as International Atomic Energy Authority’s (IAEA) recommendations and additional requirements of Indian side.
Nuclear Power Corporation NPP “Kudankulam” Site Evaluation Report for KKNPP unit 3 to 6
DOCUMENT NO. DATE OF ISSUE REVISION NO. PAGE NO. I.02.KK.3-6.0.0. OO.RS.WD001 March 2011 1 91 of 113
The design as a whole complies with the requirements and trends in the requirements of the safety regulations, accepted worldwide in developing the nuclear power installations.
1.8.2.4 Safety Analysis
To demonstrate that the safety objective of protection of the public from accidental releases is met, safety analysis is performed to evaluate the consequences of postulated initiating events, and event sequences considered as part of the design basis. Safety assessment of NPP includes the analysis of NPP behavior in case of postulated external disturbances as well as during postulated malfunctions or failures or human errors. The influence of above postulations is considered in order to define their consequences and to evaluate nuclear power plant inherent capability to control and to mitigate such failures and situations. Basic safety criteria and design limits
For Kudankulam NPP the following dose limits for population are established:
During normal operation exposure doses to the critical group of population should not exceed:
0.2 mSv (20 mrem) – the whole body; 0.6 mSv (60 mrem) – thyroid; 1.2 mSv (120 mrem) – any individual organ.
The Rated and permissible values of atmospheric releases of radionuclides from KK NPP are as follows:-
Radionuclides Rated values of gas-aerosol ejections into ventilation pipe
Permissible daily and monthly average ejections of aerosols into atmosphere from one unit of NPP
Inert radioactive kinds of gas (any mixture)
1,14·1010 Bq/day 1,85·1013 Bq/day
I131 2,48·105 Bq/day 3,7·108 Bq/day
Mixture of long-lived nuclides
2,62·105 Bq/day 5,55·108 Bq/day
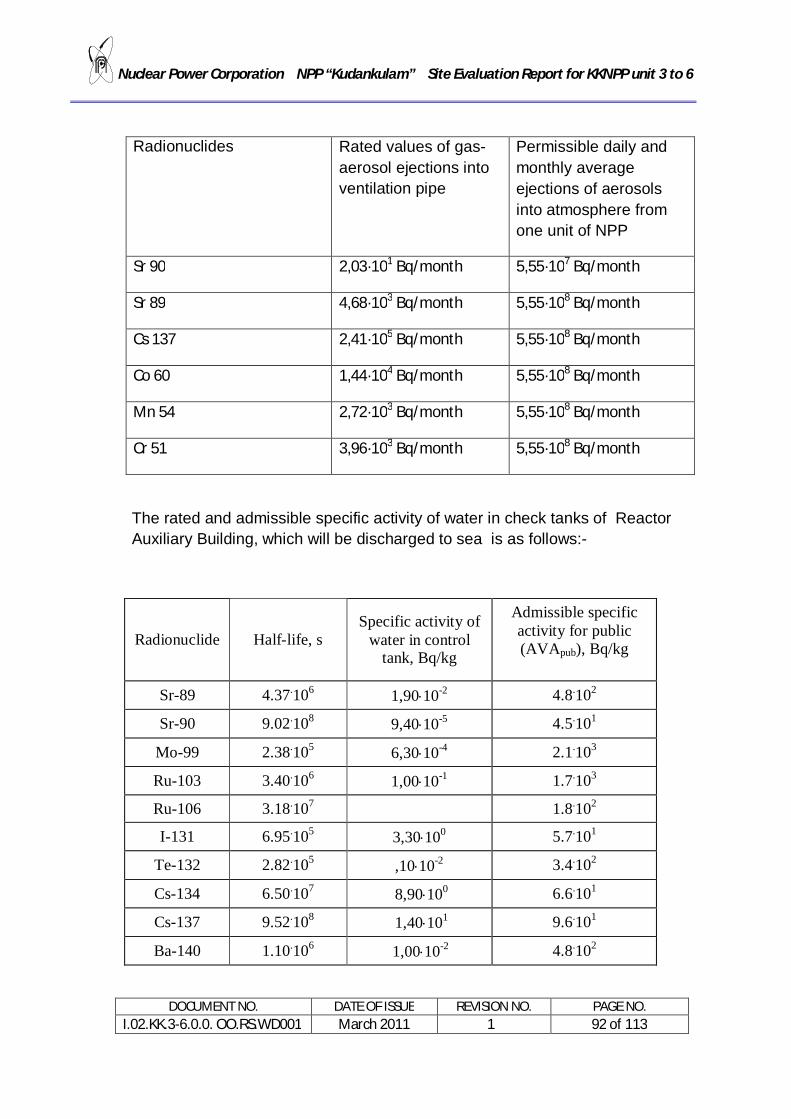
Nuclear Power Corporation NPP “Kudankulam” Site Evaluation Report for KKNPP unit 3 to 6
DOCUMENT NO. DATE OF ISSUE REVISION NO. PAGE NO. I.02.KK.3-6.0.0. OO.RS.WD001 March 2011 1 92 of 113
Radionuclides Rated values of gas-aerosol ejections into ventilation pipe
Permissible daily and monthly average ejections of aerosols into atmosphere from one unit of NPP
Sr 90 2,03·101 Bq/month 5,55·107 Bq/month
Sr 89 4,68·103 Bq/month 5,55·108 Bq/month
Cs 137 2,41·105 Bq/month 5,55·108 Bq/month
Co 60 1,44·104 Bq/month 5,55·108 Bq/month
Mn 54 2,72·103 Bq/month 5,55·108 Bq/month
Cr 51 3,96·103 Bq/month 5,55·108 Bq/month
The rated and admissible specific activity of water in check tanks of Reactor Auxiliary Building, which will be discharged to sea is as follows:-
Radionuclide Half-life, s Specific activity of
water in control tank, Bq/kg
Admissible specific activity for public (AVApub), Bq/kg
Sr-89 4.37.106 1,9010-2 4.8.102
Sr-90 9.02.108 9,4010-5 4.5.101
Mo-99 2.38.105 6,3010-4 2.1.103
Ru-103 3.40.106 1,0010-1 1.7.103
Ru-106 3.18.107 1.8.102
I-131 6.95.105 3,30100 5.7.101
Te-132 2.82.105 ,1010-2 3.4.102
Cs-134 6.50.107 8,90100 6.6.101
Cs-137 9.52.108 1,40101 9.6.101
Ba-140 1.10.106 1,0010-2 4.8.102

Nuclear Power Corporation NPP “Kudankulam” Site Evaluation Report for KKNPP unit 3 to 6
DOCUMENT NO. DATE OF ISSUE REVISION NO. PAGE NO. I.02.KK.3-6.0.0. OO.RS.WD001 March 2011 1 93 of 113
La-140 1.45.105 6,4010-2 6.3.102
Ce-141 2.81.106 1,3010-1 1.8.103
Ce-144 2.46.107 6,4010-2 2.4.102
Zr-95 5.53.106 2,4010-2 1.3.103
Nb-95 3.02.106 1,4010-2 2.1.103
Cr-51 2.39.106 7,8010-3 3.3.104
Mn-54 2.70.107 1,2010-2 1.8.103
Co-58 6.12.106 6,8010-3 1.7.103
Fe-59 3.90.106 4,7010-2 6.9.102
Co-60 1.66.108 1,2010-1 3.7.102
Na-24 5.40.104 2,1010-3 2.90.103
Total - 2.68101 -
H-3 3,88·108 1,2·106 3,0·104
The normal operation dose at exclusion radii for twin units is 3.79E-5 mSv per year against the limit of 0.2 mSv per year, for whole body as given in table 11.7-3 of PSAR S-11 for KK NPP 1, 2, is 4.38E-5 mSv per year for child’s thyroid against the limit of 0.6 mSv per year, and is 3.75E-5 mSv per year for lungs against the limit of 1.2 mSv per year. During design basis accidents exposure doses to the critical group of population on the boundary of the exclusion zone and beyond it should not exceed 100 mSv (10 rem) for the whole body and 500 mSv (50 rem) for thyroid gland. The radius of the sanitary protection zone shall be equal to 1.5 km. The source term for accidental releases is given in PSAR S-15/13 & S-15/7 for DBAs considered for KK NPP. The DBA with maximum release is accident with ejection of CPS AR (sudden fast removal of one CPS AR from input position to an extreme upper position Version 1 (event of CPS AR ejection along with a jacket break of the CPS drive causing efflux of the primary coolant with break size of 58 mm) .is of worst consequence. The source term for this DBA is given in following table:-

Nuclear Power Corporation NPP “Kudankulam” Site Evaluation Report for KKNPP unit 3 to 6
DOCUMENT NO. DATE OF ISSUE REVISION NO. PAGE NO. I.02.KK.3-6.0.0. OO.RS.WD001 March 2011 1 94 of 113
Table: Release to atmosphere for a 30 day period in the result of the accident with ejection of AR CPS
Radionuclide
Release from containment, Bq
Release at operation of the
secondary steam
discharge devices, Bq
Total release to atmosphere,
Bq Stack Bypass
Molecular iodine
I-131 1.8109 1.801011 1.1107 1.821011
I-132 2.3108 2.301010 1.0107 2.321010
I-133 4.3108 4.301010 9.4106 4.341010
I-134 7.5107 7.50109 3.1106 7.58109
I-135 1.4108 1.401010 3.8106 1.411010
Organic iodine
I-131 6.41010 6.401011 – 7.041011
I-132 2.3109 2.301010 – 2.531010
I-133 1.01010 1.001011 – 1.101011
I-134 3.8108 3.80109 – 4.18109
I-135 2.3109 2.301010 – 2.531010
Noble Gases
Kr-85m 1.21012 1.201011 5.0105 1.321012
Kr-87 7.81011 7.801010 7.4105 8.581011
Kr-88 2.71012 2.701011 1.4106 2.971012
Xe-133 6.31014 6.301013 2.9107 6.931014
Xe-135 2.91012 2.901011 8.0105 3.191012
Xe-138 2.41011 2.401010 8.5105 2.641011
Aerosols
Cs-134 2.4107 7.20109 4.7106 7.23109
Cs-137 1.2107 3.60109 2.5106 3.61109

Nuclear Power Corporation NPP “Kudankulam” Site Evaluation Report for KKNPP unit 3 to 6
DOCUMENT NO. DATE OF ISSUE REVISION NO. PAGE NO. I.02.KK.3-6.0.0. OO.RS.WD001 March 2011 1 95 of 113
The whole body dose to the public at 1.6 km exclusion boundary is 0.038 Sv against the limit of 0.1 Sv. The thyroid dose is 0.14 Sv against the limit of 0.5 Sv, for this accident as per PSAR S-15/13.
1.8.2.5 The Concept of Defense in Depth
The safety of the NPP is ensured due to consecutive implementation of the defense-in-depth concept. This concept implies a system of physical barriers on the way by which the ionizing radiation and radioactive substances can release into the environment. This system is used together with a complex of engineering and managerial measures for protecting these barriers and maintaining their effectiveness and measures for protecting the personnel, population and the environment. The complex of engineering and managerial measures forms the following five levels of defense in depth. Level 1: Conditions of Siting the NPP and prevention of anticipated
operational occurrences:
Assessing and selecting a site suitable for placing the NPP
Establishing a exclusion zone and an emergency planning zone around the NPP in which the protective measures are planned
Developing the design using a conservative approach with inherent safety features of the reactor plant
Ensuring the required quality of the systems (components) at the NPP and works being accomplished
Operating the NPP in accordance with the requirements of the relevant normative documents, process stipulations and operating manuals
Maintaining, in the proper condition, the systems (components) essential for safety by timely detecting flaws, taking preventive measures, replacing the equipment that have completed its maximum operating life and establishing an efficient system for documenting the results of work and checks
Selecting the personnel for the NPP and maintaining their required qualification level to ensure their properly acting under normal and violation of normal operating conditions including pre- emergency situations, accidents and creation of safety culture
Level 2: Preventing design-basis accidents by the systems of normal operation
Revealing deviations from normal operation and removing them
Nuclear Power Corporation NPP “Kudankulam” Site Evaluation Report for KKNPP unit 3 to 6
DOCUMENT NO. DATE OF ISSUE REVISION NO. PAGE NO. I.02.KK.3-6.0.0. OO.RS.WD001 March 2011 1 96 of 113
Control under conditions of Anticipated Operational Occurrence (AOO) Level 3: Preventing beyond the design basis accidents by safety system
Preventing initiating events from their developing into design basis accidents and employing the safety systems
Mitigating the consequences of the accidents whose prevention was not met with success by localizing the releasing radioactive substances
Level 4: Control of beyond the design basis accidents
Preventing beyond the design basis accidents from their developing and mitigating their consequences
Protecting the hermetic enclosure from destruction under beyond the design basis accidents and maintaining its service operability
Returning the NPP into a controllable condition, in which the chain fission reaction is stopped, the nuclear fuel is continuously cooled and the radioactive substances are kept in the preset boundaries
Level 5: Emergency planning
Preparing and implementing when necessary, plans of emergency measures at the NPP site and beyond its boundaries
The concept of defense-in-depth is conveyed at all phases or activities related to ensuring the NPP safety. Here, the strategy for preventing unfavorable initiating events, especially for the 1st and 2nd level is of primary importance.
1.8.2.6 Barriers to Radioactivity Release
Several barriers against the release of radioactivity to the environment exist. These are: - 1. Fuel matrix 2. Fuel sheath 3. Reactor coolant system boundary 4. Containment 5. Exclusion zone.
Fuel
The uranium dioxide (UO2) fuel is a ceramic material with high melting point and chemically inert. As the ceramic material is porous, the fission products remain entrapped in its matrix. During normal operation virtually all the fission products are permanently retained in UO2 matrix and only a fraction of noble gases and volatile products diffuse into the inter-space between fuel and cladding.

Nuclear Power Corporation NPP “Kudankulam” Site Evaluation Report for KKNPP unit 3 to 6
DOCUMENT NO. DATE OF ISSUE REVISION NO. PAGE NO. I.02.KK.3-6.0.0. OO.RS.WD001 March 2011 1 97 of 113
Fuel Sheath
Fuel Sheath also called fuel cladding is made of zircoloy with 1% Nb, and encapsulates the fuel pellets. This forms the second barrier and is designed to withstand stresses resulting from UO2 expansion, fission gas pressure, external hydraulic pressure and mechanical loads imposed by fuel handling.
Reactor coolant System
The fuel and coolant are contained in the reactor coolant system. This is a closed system and forms the third barrier to fission product release.
Containment
The fourth barrier is the containment building, which houses the reactor and associated nuclear systems. The Containment system consists of an inner (Primary) containment with steel lining enveloped by an outer (Secondary) containment. The primary containment is of Pre stressed Cement Concrete (PCC) and the secondary containment is of Reinforced Cement Concrete (RCC). During normal operation of the plant, the primary and secondary containments remain at a small negative pressure with respect to the ambient. The containments are provided with a quick isolation feature. The primary containment structures are designed to withstand the maximum pressure and temperature generated by postulated accidents and maintain acceptably low leak rates consistent with regulatory and design limits following the postulated accident conditions. Containment system performs its functions in association with the related engineered safety features (ESFs). Exclusion Zone The site boundary extends upto 1.5 km from the plant. This is called exclusion zone. This measure gives an added safety.
1.8.3 Reactor System of KKNPP 3 to 6 1.8.3.1 Reactor Pressure Vessel (RPV) and Internals
The reactor vessel is a cylindrical high-pressure vessel manufactured of high-strength heat-resistant alloy steel. The vessel internal surface is clad with corrosion-resistant austenitic steel. The reactor vessel is designed to contain the vessel internals and fuel assemblies of the core. The reactor vessel houses core barrel, which in-turn houses all the core components including the fuel assembly. The core barrel has perforations at bottom, which allow circulating water to enter reactor core and perforations at top for exit of hot water from core. All core components are made of austenitic stainless steel.

Nuclear Power Corporation NPP “Kudankulam” Site Evaluation Report for KKNPP unit 3 to 6
DOCUMENT NO. DATE OF ISSUE REVISION NO. PAGE NO. I.02.KK.3-6.0.0. OO.RS.WD001 March 2011 1 98 of 113
The reactor pressure vessel with the top cover is kept in a concrete pit inside the containment. On the top of the Reactor vessel, the head assembly, containing the control rod drive mechanisms, is mounted.
1.8.3.2 Reactor Fuel
The fuel is uranium-di-oxide enriched. Spring-loaded upper block assembly keeps the fuel assemblies in their position. Loading and unloading of fuel is achieved with the help of specially designed fuelling machine positioned above the reactor. The Fuel and Fuel Clad forms the primary barrier against the release of radioactivity, generated in the reactor and is designed to ensure a high degree of integrity through out the life of the plant.
1.8.3.3 Reactor Coolant System (RCS) and Equipment
The coolant is supplied by the reactor coolant pumps through four inlet nozzles, flows down in annular space between the vessel and reactor core Barrel and enters the Fuel Assemblies (FA), through perforation in the bottom and support tubes of the Barrel. When passing through FA the coolant is heated due to nuclear fission reaction inside the fuel. The primary purpose of reactor coolant system (RCS) is to transfer the heat generated in the reactor core to the steam generators where steam is produced to drive turbine- generator. The borated demineralized water coolant of RCS also acts as a neutron moderator, absorber and reflector and is a means for variation of reactor power. The RCS pressure boundary provides a secondary barrier against the release of radioactivity, generated in the reactor and is designed to ensure a high degree of integrity through out the life of the plant. The coolant in the primary circuit is kept under pressure to keep it sub-cooled during plant operation. The thermal-hydraulic design of the RCS rules out coolant boiling in the fuel assemblies and guarantees optimum selection of steam generator size and reactor coolant pump power. The sub-division of RCS into a number of loops make it possible to continue operating the reactor system on three or two loops at correspondingly reduced power in the event of non-availability of one or two reactor coolant pumps.
1.8.3.4 Reactor Coolant Pump (RCP) Set
The reactor coolant pumps serve to circulate the reactor coolant in the closed loops through the reactor pressure vessel (RPV), the reactor coolant piping and the steam generators (SG), thereby transferring the heat energy generated in the Reactor to the Steam Generator. A flywheel on the shaft above the motor provides additional inertia to give suitable coast-down characteristic.

Nuclear Power Corporation NPP “Kudankulam” Site Evaluation Report for KKNPP unit 3 to 6
DOCUMENT NO. DATE OF ISSUE REVISION NO. PAGE NO. I.02.KK.3-6.0.0. OO.RS.WD001 March 2011 1 99 of 113
1.8.3.5 Pressuriser
The Pressuriser serves to build up and maintain the necessary pressure in the reactor coolant system. The Pressuriser is the vertical vessel with electric heaters located in the vessel bottom part; it is designed for building up of pressure in the primary circuit during the reactor plant heat-up and restriction of pressure deviations during the reactor power operation. The Pressuriser casing is made of low alloy steel with corrosion resistant coating of internal surfaces by the fused austenitic layer. RCS pressure is controlled by the use of the Pressuriser, where water and steam are maintained in dynamic equilibrium by operation of electrical heaters and water sprays. Pressuriser is fitted with three pulse safety devices (PSDs) to protect the primary system from overpressure.
1.8.3.6 Steam Generators
The steam generators serve to produce steam at conditions required for the operation of turbine by transferring heat from primary coolant to secondary side feed water. The VVER-1000 steam generators are shell and tube type horizontal heat exchanger with built in moisture separators. The horizontal steam generators have large evaporation surface, and hence the advantages of low steam velocities, leading to effective moisture separation from steam using simpler moisture separator design. The steam generator layout is designed to cool the reactor by natural circulation when main coolant pumps are not operating. The pressure boundary of steam side of steam generator is made of forged shell and dished ends welded together and accommodate heat transfer surface and other internals. Primary side of steam generator comprises of inlet and outlet manifolds called primary collectors. Heat transfer surfaces in the form of U-shaped stainless steel tubes emanate from the inlet primary collector (hot header) and terminate at outlet primary collector (cold header). Steam generator shell also accommodates feed water distribution system.
1.8.3.7 Reactor Control and Protection System
Reactor control and protection is achieved through Control and Protection System Absorber Rods (CPSAR). Reactor protection i.e. fast termination of nuclear reaction in the reactor core is achieved by dropping all CPSAR into the reactor by gravity. Long-term reactivity changes are accomplished by varying the boron concentration of the primary coolant water.
Nuclear Power Corporation NPP “Kudankulam” Site Evaluation Report for KKNPP unit 3 to 6
DOCUMENT NO. DATE OF ISSUE REVISION NO. PAGE NO. I.02.KK.3-6.0.0. OO.RS.WD001 March 2011 1 100 of 113
Absorber rod drive mechanism for movement of the CPSAR is mounted on the reactor cover. CPSAR movement for control of reactor power is done in pre-determined stepped sequence with the help of electro-magnetic step drive units. In case of occurrence of reactor protection signal or loss of power supply, these electro-magnetic coils are de-energized and absorber rods fall freely into the reactor core under gravity, thereby bringing the Reactor to a safe shutdown state.
1.8.4 Special Features of KKNPP 3 to 6
1.8.4.1 Inherent Safety Features
Reactivity coefficients characterizing the reactor core reactivity change in response to variations in parameters of the fuel, coolant and boron concentration are negative under normal operation, anticipated operational occurrence and design basis accidents. Thus, any fast changes in power are self-terminating.
1.8.4.2 Engineered Safety Features
The engineered safety features are provided to mitigate and limit the consequences of abnormal conditions including an accident condition. The task is accomplished by quickly shutting down the reactor and making it sub-critical, fast cooling and maintaining level in core, continued heat removal from core to limit rise of fuel temperature, containing radioactivity release from the core and safeguarding various systems from over pressure. KKNPP incorporates most advanced engineered safety features, which are as follows.
1.8.4.2.1 Emergency Core Cooling System The emergency core cooling system provides core cooling under a wide range of postulated accidents involving leaks of primary system. In the case of loss of coolant accident, borated cooling water is injected into the reactor core to remove the decay heat and to preserve fuel integrity so as to limit the release of fission products from the fuel. There are active and passive systems provided for emergency core cooling. This is accomplished with following systems: High-pressure boron injection. ECCS Hydro-accumulators 1st stage. Low-pressure boron injection and long term cooling. ECCS Hydro accumulators 2nd stage. The required amount of borated water is stored in the additional space available in the spent fuel storage pool and in first and second stage accumulators.
Nuclear Power Corporation NPP “Kudankulam” Site Evaluation Report for KKNPP unit 3 to 6
DOCUMENT NO. DATE OF ISSUE REVISION NO. PAGE NO. I.02.KK.3-6.0.0. OO.RS.WD001 March 2011 1 101 of 113
1.8.4.2.2 Steam Generator Blow Down and Emergency Cooling System
The steam generator blow down and emergency cool down system is provided to cool the reactor in the case of loss of onsite and offsite power supply. System operates in a closed circuit, to condense and cool the steam, generated in the SGs, thereby removing the decay heat from the core. Pumps and other equipments of the system are supplied from the emergency power supply system.
1.8.4.2.3 Passive Heat Removal System
The passive heat removal system (PHRS) removes the core decay heat in the event of non-availability of the normal heat removal system on account of complete loss of normal and emergency power supply (station black out condition). System operates in a closed circuit, to condense and cool the steam, generated in the SGs, by using natural air thereby removing the decay heat from the core.
1.8.4.2.4 Reactor Containment System Double Containment philosophy has been followed for KKNPP reactor. The containment system consists of an inner (Primary) containment enveloped by an outer (Secondary) containment. The primary containment is a cylindrical structure made of pre stressed reinforced concrete with dome top. The containment is lined with 6 mm carbon steel plate in the containment portion and 8 mm carbon steel plate on the floor (+5.4 m elevation slab). This sealed enclosure houses main equipment of the primary system and is kept at negative pressure during power operation. The primary containment is designed for internal pressure and temperature effects during accidents. The containment performs the following functions. It acts as a barrier against release of radioactive fission products in the
event of an accident
Acts as biological shielding and protects site personnel against radiation under normal and accidental conditions
The secondary containment is made of RCC and negative pressure is maintained in the space between primary and secondary containment to prevent any leakage to the environment and withstanding external impacts, such as external air shock waves, Airplane crash etc. Both the shells are designed to withstand seismic events.
Nuclear Power Corporation NPP “Kudankulam” Site Evaluation Report for KKNPP unit 3 to 6
DOCUMENT NO. DATE OF ISSUE REVISION NO. PAGE NO. I.02.KK.3-6.0.0. OO.RS.WD001 March 2011 1 102 of 113
1.8.4.2.5 Containment Isolation System
The containment isolation system ensures containment leak tightness in the case of an accident that is likely to cause a release of radioactivity fission products from the reactor core. Isolation valves are provided on the normal operating system piping and ducts, which penetrate the containment wall. These valves close automatically on appropriate isolation signals.
1.8.4.2.6 Containment Spray System (Sprinkler System) The containment spray system removes the heat released into the reactor containment in case of LOCA inside the containment and limits the temperature and pressure peaks. It also performs binding of iodine contained in containment atmosphere, after an accident
1.8.4.2.7 Passive Venting of the Annulus This system has been provided to prevent unmonitored ground level release of radioactivity during station black out. Thermal energy of the heated air from the PHRS is utilized to create and maintain vacuum in the annulus and discharge of the steam gas mixture from the annulus to the atmosphere through the filters.
1.8.4.2.8 High Pressure Emergency Boron Injection System and Quick Boron Injection System (QBIS)
Both these systems are intended to bring the reactor to a safe shut down stage by injection of highly concentrated boric acid solution in the event of Anticipated Transient Without A Scram (ATWAS). High-pressure boron injection system uses positive displacement pumps. QBIS works on pressure differential across Reactor Coolant pump (RCP) and also during coasting down of RCP.
1.8.4.2.9 Molten Core Catcher System This system has been provided to confine the molten core and reactor fragments within the boundaries of the containment during a hypothetical accident with melting of the reactor core and subsequent damage of the reactor pressure vessel bottom. This system has the capability to maintain sub critical state and cool the molten core passively.
1.8.4.2.10 Nuclear Component Cooling Water System The nuclear component cooling water system operates in a closed loop and removes heat from various safety related reactor plant system, and transfers it to the ultimate heat sink. The closed loop design provides a barrier between radioactive fluid and environment. System equipments are powered from emergency power supply system
Nuclear Power Corporation NPP “Kudankulam” Site Evaluation Report for KKNPP unit 3 to 6
DOCUMENT NO. DATE OF ISSUE REVISION NO. PAGE NO. I.02.KK.3-6.0.0. OO.RS.WD001 March 2011 1 103 of 113
1.8.5 Reactor Auxiliary System
The reactor auxiliary systems support reactor coolant system. The main auxiliary systems are as follows. a) Reactor Volume and Chemical Control System b) Residual Heat Removal System c) Reactor Building Ventilation System
1.8.5.1 Reactor Volume and Chemical Control System Primary function of reactor volume and chemical control system is to regulate boric acid concentration in primary coolant to control long term reactivity changes resulting from The change in reactor coolant temperature between cold shut down state
to hot full power operation. Burn up of fuel and burnable poisons. Build up of fission products in fuel and xenon transients. This system is also used for maintaining the primary coolant inventory and purifying the primary coolant.
1.8.5.2 Residual Heat Removal System (RHRS) The residual heat removal system functions as the long term heat sink for the reactor and it is achieved in two stages. In first stage, residual heat is removed by way of steam release from steam generator to turbine condenser. In 2nd stage the residual heat is removed by emergency and planned cooling down of primary circuit and fuel pool cooling system.
1.8.5.3 Reactor Building Ventilation System The purpose of reactor building ventilation system is to: Maintain radioactive contamination level of air within acceptable limits
inside reactor building Maintain optimal environmental condition (temperature, humidity) for
process equipment for proper operation To provide acceptable air environmental conditions for maintenance
operating personnel working in the zone Maintaining the required vacuum in the reactor building and the annulus Post accident clean up of the containment
1.8.6 Secondary Circuit The secondary circuit is designed to remove heat energy from the reactor coolant in four steam generators and convert it to electrical energy via the turbine generator.

Nuclear Power Corporation NPP “Kudankulam” Site Evaluation Report for KKNPP unit 3 to 6
DOCUMENT NO. DATE OF ISSUE REVISION NO. PAGE NO. I.02.KK.3-6.0.0. OO.RS.WD001 March 2011 1 104 of 113
Steam generated in steam generator passes through a media operated Main Steam Isolating Valve (MSIV) and a motor operated Main Steam Isolating Valve (MOV) before entering a symmetric double-flow High-pressure cylinder (HPC). After the HPC the steam goes through four steam lines (two lines per each exhaust from the HPC) to the moisture separator- reheater (MSR) for separation and reheating in single stage. After MSR the steam goes, through the LP valve units, to three numbers of double-flow Low-pressure cylinders (LPC). From the LPC the steam is discharged into three condensers.
1.8.7 Cooling Water Supply Systems Sea water cooling systems are meant for following purpose: Main condenser cooling water system Seawater cooling system for essential services Seawater cooling system for non-essential loads All seawater-cooling systems are once-through systems. The cooling water source and the ultimate heat sink is the Gulf of Mannar in the Indian Ocean. Seawater from the Gulf of Mannar is fed to the unit pump stations through an intake structure. Pumps supply water to consumers from which the water goes back to the Gulf of Mannar via the discharge line. At the pump station, the water supplied to all systems is purified of mechanical impurities and treated with sodium hypochlorite to prevent biological fouling of water supply system. Fish barriers are installed in front of the cooling service water pumps stations.
1.8.7.1 Main Cooling Water System The system is intended for heat removal from the turbine condensers and is part of a non-safety related normal operation system. The system performs its functions during and after an operation-basis earthquake.
1.8.7.2 Sea Water Cooling System for Essential services This system is intended to remove heat from intermediate cooling circuit for essential services in reactor building and Standby Diesel Power Station (SDPS). The system functions during and after SSE and during aircraft crash.
1.8.7.3 Sea Water Cooling System for Non-Essential Loads The system is intended for removal of heat from intermediate circuits of non-essential loads and belongs to a non-safety related normal operation system. Seawater is supplied to the heat exchangers of intermediate circuits by pumps installed in main pump house via pipelines. Water goes back to the Gulf of Mannar through the discharge line.
1.8.8 Fire Protection System A dedicated fire protection system meets the following objectives:

Nuclear Power Corporation NPP “Kudankulam” Site Evaluation Report for KKNPP unit 3 to 6
DOCUMENT NO. DATE OF ISSUE REVISION NO. PAGE NO. I.02.KK.3-6.0.0. OO.RS.WD001 March 2011 1 105 of 113
1. Provides appropriate fire prevention, fire detection, and fire fighting systems, based on fire loads, in the plant design.
2. Ensures that capability for performing safe shut down and decay heat removal functions is not impaired in case of fire.
3. Ensures that mitigation means are available for all safety related equipments as required including Safe Shutdown Earthquake (SSE).
4. Following methods have been adopted for fire prevention:
a) Physical barriers b) Non-combustible finishing and structural materials. c) Separation of redundant systems with fire barriers. d) Use of Fire Resistant Cables for safety systems and halogen free
cables with low smoke and gas formation for the rest of the cables. e) Water instead of organic oil in the RCP lubrication systems and
non-combustible oil for RCP motors. f) Early detection
Active fire protection stipulates application of fire-fighting of different classes and principles in which efficient fire extinguishing means are compatible with combustible substance and materials. The start up of the fire fighting facilities is automatic (in response to signals from fire detectors) which is backed by remote control from the MCR and on site where stop valves are located. The reactor structural constructions are designed with regard for the ability of enduring impact of fires and serve as fire protection barrier for protection of equipment located therein. The fire retardant valves utilized with fire detectors whose actuation closes fire retardant valves throughout the system and disconnect the combined input and exhaust ventilation system. The smoke removal valve in the room of fire is automatically opened and smoke removal system is actuated from the MCR’s fire panel. The absence of smoke on staircase landings and elevator shafts is ensured by anti smoke supply and exhaust ventilation system to the staircase landings and elevator locks in basement rooms.
1.8.8.1 Automatic fire-fighting system for safety system
Fire–hazardous rooms and equipment situated in different channels of safety system are protected by automatic fire-fighting (AFF) facilities during normal operation. The water to each AFF facility is supplied from a fire hydrant source incorporating a store of water necessary to fight a fire. It is powered from a reliable power source, have separate cables for fire detection, separate cables for control & monitoring the fire protection.
1.8.8.2 High pressure fire fighting water pipe line
To ensure internal and external fire-fighting in buildings and structures as well as operation of AFF facilities for protection of rooms and non-safety related equipment, a separate high pressure fire-fighting water pipeline is implemented at the NPP.
Nuclear Power Corporation NPP “Kudankulam” Site Evaluation Report for KKNPP unit 3 to 6
DOCUMENT NO. DATE OF ISSUE REVISION NO. PAGE NO. I.02.KK.3-6.0.0. OO.RS.WD001 March 2011 1 106 of 113
1.8.8.3 Gas fire-fighting system
There are gas fighting facilities both for a whole volume (the entire space to be protected) and local action (space of one cabinet or group of cabinets) for fire protection of rooms with electronics and electrical equipment.
1.8.9 Instrumentation and Control (I&C) The Instrumentation & Control (I&C) systems in KKNPP include a variety of equipment intended to perform display, monitoring, control, protection & safety functions. General guidelines followed are: 1. Electrical transmission of signals is preferred to pneumatic, because of
better amenability to further processing in addition to inherent fast response etc.
2. Equipment free from ageing, wear and not needing routine and preventive maintenance are preferred. Microprocessor-based systems, solid-state semi-conductor devices are preferred over mechanical systems having moving parts.
3. Principles of redundancy, diversity, fail-safe, testability and maintainability are extensively employed to maximize availability while ensuring safety. Physical separation of redundant channels is provided.
4. For all safety systems Triplicate sensors and logic based on majority coincidence (2 out of 3) principles is used. On line testing facility for protection channel is provided.
5. Independence between control & data communication is maintained for safety systems.
6. The sensors and associated electronics for each channel are physically separate and follow diversified cable routing.
7. The overall I&C design is such that all the safety functions are normally achievable can be carried out from Back–up Control room (BCR) and back–up control points.
8. A high degree of automation is aimed at to eliminate human error affecting availability/reliability.
9. Simplicity in design, operator acceptance, obsolescence, current trend in technology are given due consideration
Main & Supplementary Control Rooms
The control of KKNPP power plant is based on the philosophy of a centralized control room sufficiently instrumented to provide adequate information to the operator regarding the status of the plant and to enable safe and efficient control of the plant. Main Control Room (MCR) is located in the Main Plant Building. Supplementary Control Room (SCR) is provided in shielded control building, so that some of the essential functions of the MCR relating to monitoring of the important parameters, controls relating to reactor safe shutdown can be carried out in the event the main control room becomes inhabitable. Separate

Nuclear Power Corporation NPP “Kudankulam” Site Evaluation Report for KKNPP unit 3 to 6
DOCUMENT NO. DATE OF ISSUE REVISION NO. PAGE NO. I.02.KK.3-6.0.0. OO.RS.WD001 March 2011 1 107 of 113
sensors, power supplies & cables are provided for most of the supplementary room indications.
1.8.10 Electrical System The electrical systems of KKNPP consists of power output system and auxiliary power supply system
1.8.10.1 Power Output System
The electrical power, generated at the 24KV level from the turbo-generator, is stepped up through 24/400KV generator transformer and evacuated by six 400KV transmission lines. For reserve source of power supply, KKNPP is connected to two 230 KV substations. Three 230Kv lines are provided as the reserve source of power supply to NPP auxiliaries. The generators are connected to generator transformers through isolated phase bus duct (IPBD) along with generator circuit breaker (GCB) connected between generator and generator transformer. For starting up, station auxiliary power supply is drawn from the 400KV network, through generator transformer and unit auxiliary transformers with the generator circuit breaker open. Reliable reserve supply to the NPP for restarting the NPP in the event of 400KV grid collapse. Operation of the house load is possible in case of loss of synchronization, by isolating the NPP from the grid.
1.8.10.2 Station Auxiliary Power Supply System
The station auxiliary power supply system consists of the following Normal auxiliary power supply system including common station auxiliary
supply system. Reliable auxiliary power supply system of normal operation Emergency auxiliary power supply system for safety operation The main function of the power supply system is to ensure the availability of sufficient power during all modes of operation, so that established allowable design limits and design conditions for cooling the reactor core and maintaining the containment integrity and other necessary functions during the postulated accidents are not exceeded. The power supplies are classified into three groups based on reliability. Group-1 D.C. power supplies feeding the plant auxiliaries without any
interruption and A.C power supplies feeding the auxiliaries with interruption of not more than 20 msecs under any condition of plant operation, plant shutdown, safety/emergency conditions including the condition of loss of supply from all alternate current sources.

Nuclear Power Corporation NPP “Kudankulam” Site Evaluation Report for KKNPP unit 3 to 6
DOCUMENT NO. DATE OF ISSUE REVISION NO. PAGE NO. I.02.KK.3-6.0.0. OO.RS.WD001 March 2011 1 108 of 113
Group-2 A.C. power supplies feeding the auxiliaries with the interruption of 20-60sec. under any condition of plant operation, plant shutdown, safety/emergency conditions including the condition of loss of supply from all off-site sources.
Group-3 A.C power supplies to the plant auxiliary loads normally required under all modes (operation, shutdown, safety / emergency condition etc) of plant but which can tolerate prolonged interruption in the power supply without affecting safety of plant.
1.8.11 Fuel Handling System Refueling Machines is provided to carry out off-power refueling i.e. after shutting down the reactor. Fresh fuel assemblies are placed in the reactor and the spent fuel assemblies are removed from the reactor and kept in fuel pool. All the operation is carried out in under water. The fuel pool is lined with stainless steel to provide a leak tight barrier. Spent fuel assemblies are kept in the racks. The storage bay has capacity to store spent fuel discharged for about 7 reactor years of operation in addition to provision for unloading of one full core load in case of emergency. Provision also exists to ship spent assemblies to away from reactor facility which is located in the plant premises.
1.8.12 Plant Auxiliaries 1.8.12.1 Ventilation System
Ventilation of the NPP is designed based on technical approaches aimed at raising the reliability of ventilation systems operation, electrical power consumption, improving working environment and equipment operation condition. The rooms of NPP’s main and plant buildings and structures are divided into Controlled access area where the effect of radiation on personnel is
probable. Free access area where the effect of radiation on personnel is not
anticipated and permanently occupied by personnel. The reactor building containment ventilation system is designed to maintain a negative pressure within the containment to have no ground level radioactivity release. The ventilation exhaust is adequately filtered and monitored before sending to the stack.
1.8.13 Contamination Control To control the radiation exposure and to prevent the spread of radioactive contamination, the plant premises are divided into free access areas and controlled access areas. Free access areas do not contain any sources of radiation and is accessible to all without any radiological control measures. All radioactive systems are

Nuclear Power Corporation NPP “Kudankulam” Site Evaluation Report for KKNPP unit 3 to 6
DOCUMENT NO. DATE OF ISSUE REVISION NO. PAGE NO. I.02.KK.3-6.0.0. OO.RS.WD001 March 2011 1 109 of 113
housed in controlled access areas, where radiological control measures are strictly enforced. Controlled access area is further divided into Attended areas, Periodically Attended Areas and non-attended areas based on their potential for radiation exposure and contamination spread. In attended areas continuous stay of radiation workers is permitted as
prevailing radiological conditions are very low. In periodically attended areas personnel occupancy is controlled based on
the existing radiological conditions. In un-attended areas personnel entry is not permitted during reactor
operation as these areas encloses equipment and systems of relatively high radioactivity.
Engineering and administrative measures are enforced in order to prevent spread of contamination beyond controlled access areas.
1.8.14 Radioactive Waste Treatment System The project envisages collection and processing of liquid and gaseous radioactive wastes and also collection, processing and storage of solid radioactive wastes generated during operation of NPP.
1.8.14.1 Liquid Radioactive Wastes Following are the different types of liquid wastes generated during the reactor operation: Borated active water, exchanged from the primary circuit with pure water
during boron concentration changes i.e. during startup, power rise, etc., collected in tanks of coolant grade storage system
Wastewater after decontamination of the equipment, pipelines, rooms, drains from active laboratory, reclaimed water from special purification system, technological drainage of equipments, pipelines, etc.
Spent ion exchange resins and sorbents of purification system filters Salt concentrate residue of the evaporator Sludge drained from tank bottoms Borated active water from primary circuit is processed in the primary coolant treatment system and pure condensate and boric acid concentrate are separated by evaporation and are reused for make-up in the primary system. Decontaminants, leakage and drainage from equipment, pipes and rooms are collected in tanks in the reactor auxiliary building. They are then processed by evaporation in wastewater processing system and condensate and salt
Nuclear Power Corporation NPP “Kudankulam” Site Evaluation Report for KKNPP unit 3 to 6
DOCUMENT NO. DATE OF ISSUE REVISION NO. PAGE NO. I.02.KK.3-6.0.0. OO.RS.WD001 March 2011 1 110 of 113
concentrate are generated. Condensate is reused in the process system and part quantity which cannot be reused is discharged after radiation and chemical monitoring. Salt concentrate is sent to intermediate liquid radioactive media storage system. Salt concentrate residue, spent ion exchange resins and sorbents of filters, sludge from tank bottoms are received in tanks in intermediate liquid radioactive media storage system. They are stored here for sufficient time to allow for decay of short-lived isotopes, and then further concentration of them is taken up using evaporation technique. Highly concentrated residue is then solidified through cementation and sent for interim storage in solid waste storage compartments. Monitoring and control of the liquid waste treatment facility is done through AERMS (Automated Environmental Radiation Monitoring System). Liquid waste disposal system is equipped with radiation monitoring.
1.8.14.2 Gaseous Wastes The sources of gaseous radioactive waste produced during the operation of the reactor are as follows: Degassing of the primary coolant in the deaerator of volume control
system blow offs from the equipment containing radioactive noble gases like
Bubbler tank, sumps for collection of uncontrolled leak, nuclear sampling equipment, and equipments (tanks) located in reactor auxiliary building
Radioactive gas treatment facility has two systems; System for burning hydrogen from process blow offs Radioactive gas purification system Radioactive gas purification system is designed to reduce the activity of process blow offs coming from hydrogen burning system and from other tanks containing radioactive media to admissible levels. After purifying through absorbing filters the gases are discharged in to the atmosphere through 100 m tall ventilation stack.
1.8.14.3 Solid Radioactive Waste System Solid radioactive waste system is intended for solid radioactive waste reprocessing and for temporary storage of solid radioactive waste and solidified liquid radioactive media. Solid Radioactive Wastes (SRW) are generated both during normal operation, maintenance and accidents of NPP. Treatment system for solid radioactive wastes includes reprocessing and storage of solid radioactive wastes. Solid radioactive wastes are reprocessed to reduce their volume. The following types of reprocessing methods are used within the project: Incineration
Nuclear Power Corporation NPP “Kudankulam” Site Evaluation Report for KKNPP unit 3 to 6
DOCUMENT NO. DATE OF ISSUE REVISION NO. PAGE NO. I.02.KK.3-6.0.0. OO.RS.WD001 March 2011 1 111 of 113
Compacting Fragmentation Solid radioactive wastes are collected in special protective containers at the place of their formation. Gradation according to the levels of activity and the methods of further reprocessing is made at the place of their collection when they are located in the containers. After reprocessing, the finished product is placed in standard barrels (200 liters capacity) / capsules and is stored in the solid waste stores at solid waste management building. The SRW storage will be located in the special reinforced surface building. The thickness of walls and floors of storage sections ensures mechanical strength and biological protection.
1.8.14.4 Dose apportionment: Background
During normal operation, the radiation exposure due to radioactivity released to the environment from all the nuclear facilities at the site should not exceed the effective dose of 1 mSv/yr (100 mRem/yr) to the members of the Public as stipulated by AERB.
1.8.15 Environmental Monitoring
Environmental survey Laboratory is established in the site. The Laboratory carries out pre-operational radiation survey and collection and analysis of samples in the environment matrix. Subsequent to unit operation with the continued analysis of these samples the laboratory looks for any build up of radioactivity or radiation dose in the environment. The typical samples collected are air, water, milk, cereal, grass, fish etc.
1.8.16 Ultimate Heat Sink (UHS)
Both sea water body and atmosphere are used as ultimate heat sink for residual heat absorbing during normal operation, anticipated operational occurrences or accident condition. For Design Basis Events (DBE) sea acts as ultimate heat sink for absorbing residual heat from the reactor core and spent fuel pond. As regards to Beyond Design Basis Events (BDBE) namely station black out event, atmosphere acts as UHS for residual heat removal from reactor core and spent fuel pond. System involved in residual heat removal process

Nuclear Power Corporation NPP “Kudankulam” Site Evaluation Report for KKNPP unit 3 to 6
DOCUMENT NO. DATE OF ISSUE REVISION NO. PAGE NO. I.02.KK.3-6.0.0. OO.RS.WD001 March 2011 1 112 of 113
Sea water as UHS
1. Emergency and planned cooling down primary and fuel pool cooling
system. The closed loop system has four-channel structure with 100% capacity of each channel and connected to primary circuit.
2. SG emergency cool down and blow down system. The closed loop system has four channels structure with 100% capacity of each channel and is connected to secondary circuit.
3. Component cooling system of Reactor Building. The system has four channel structure with 100% capacity of each and is connected with emergency and planned cooling & SG emergency cool down and blow down systems with heat exchangers.
4. Sea water (Service water) systems for Reactor and Diesel buildings. The open loop system has four channel structure with 100% capacity of each channel removing residual heat through component cooling system of Reactor building heat exchangers
Atmosphere as UHS Passive heat removal system, the closed loop system has 4 x 33% capacity channel connected to secondary cycle.
1.8.17 Offsite Power supplies
NPCIL has initiated the discussions with CEA/ PGCIL to initiate the studies for the finalization of the Power evacuation scheme for the power generated from KKNPP3-6. The construction power supply required for the KKNPP3-6 is planned to be taken from the 11 kV system from the TNEB sub station near the vicinity of the existing plant premises.
1.8.18 Emergency plan
Plant, Site and Offsite Emergency Preparedness Plans for KK 1&2 are finalized. A separate volume for Emergency preparedness plan for KKNPP 3 to 6 ( EMERGENCY PREPAREDNESS MANUAL for Kudankulam Nuclear Power Project- 3 to 6 (During Construction Phase) for radiological Emergencies at KK - 1 & 2 ) considering the construction man power of KKNPP 3 to 6 in view of radiation emergency at KKNPP 1&2 have been submitted and reviewed by WG - 3

Nuclear Power Corporation NPP “Kudankulam” Site Evaluation Report for KKNPP unit 3 to 6
DOCUMENT NO. DATE OF ISSUE REVISION NO. PAGE NO. I.02.KK.3-6.0.0. OO.RS.WD001 March 2011 1 113 of 113
1.9 Nuclear security
Document for Physical protection system for KKNPP 1&2 has been finalized which will be suitably modified if required for KKNPP 3-6. The design approach adopted for the above document is based on guide lines given in IAEA’s Information circular INFCIRC/225 Rev 4 and TECDOC-967 Rev 1. Guidance and consideration for implementation of INFCIRC/225 and AERB”s security manual are followed for the selection and location of different subsystems of physical protection system (PPS) in the various areas of the plant. The various subsystems of PPS are so deployed that entry to the operating island and vital areas are monitored by the sub systems.
A coastal police station under Tamil Nadu home department is already established at Kudankulam for looking after the coastal areas including site coastal area.
The site specific characteristics such as terrain, climatic conditions, proximity to sea etc and the local inputs will be considered while designing the security system for the NPP. In addition as already two Units are existing, thought will be given to the layout of the main plant boundary, labour camps and segregation plan between the existing operating plant and the new construction site while developing the security system.