Kuan lin chen-week5_demo
34
BikeAlert A real time bike sharing station monitor system Kuan-Lin Chen
-
Upload
chen-kuan-lin -
Category
Data & Analytics
-
view
66 -
download
0
Transcript of Kuan lin chen-week5_demo
BikeAlert A real time bike sharing station monitor system
Kuan-Lin Chen
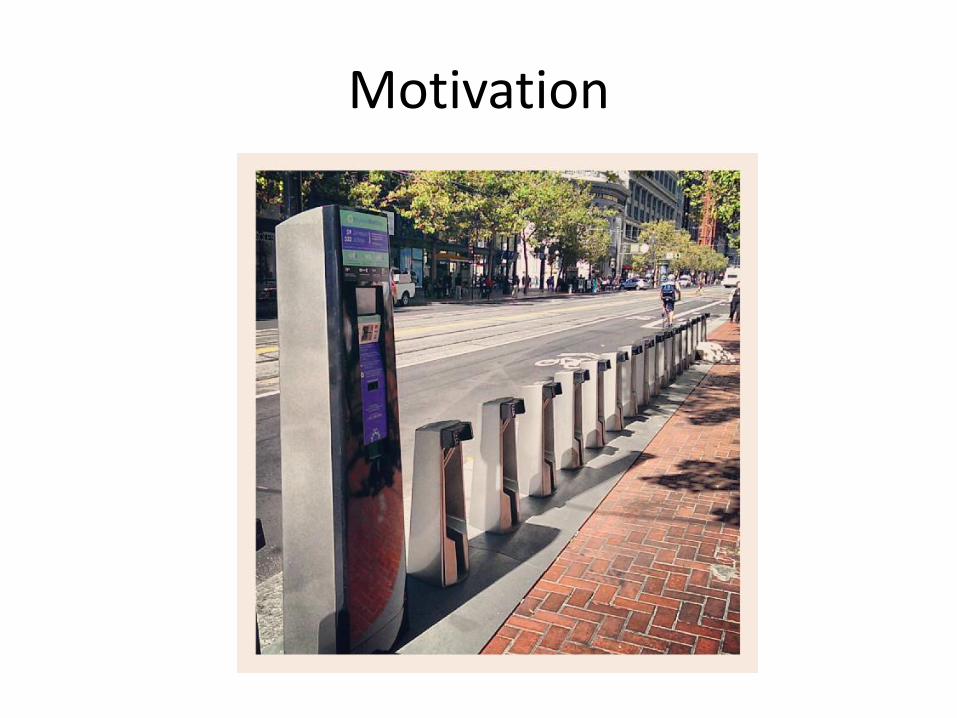
Motivation
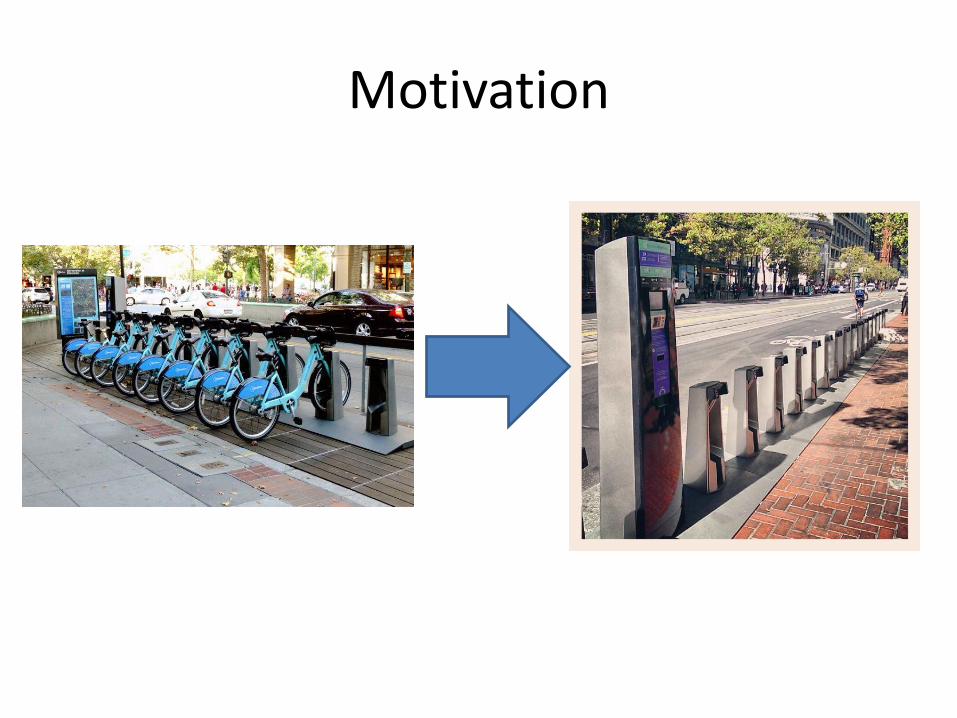
Motivation
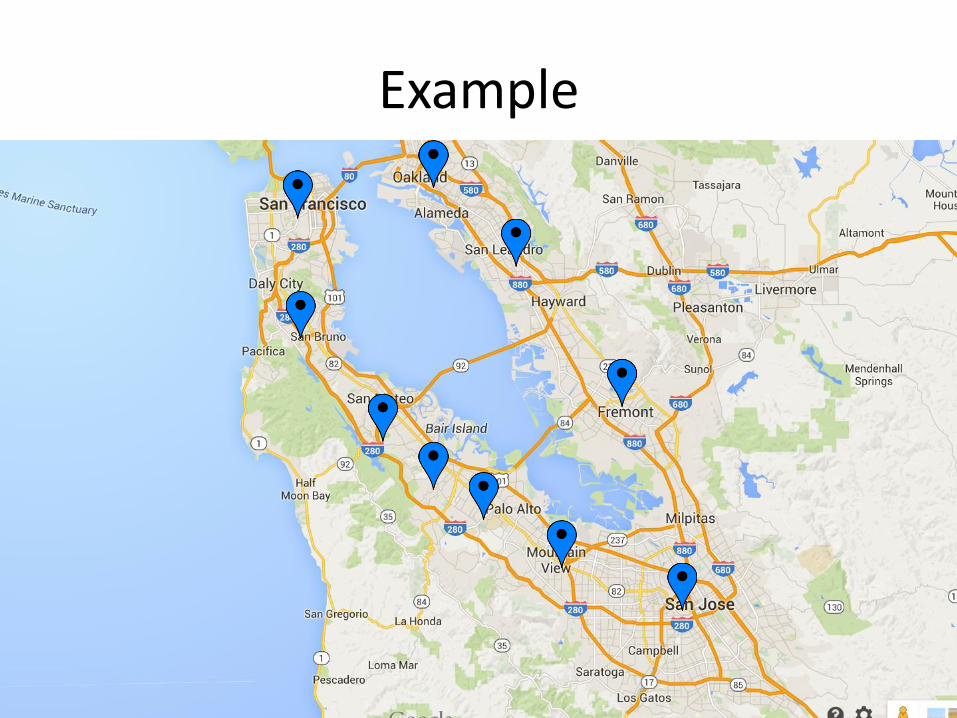
Example
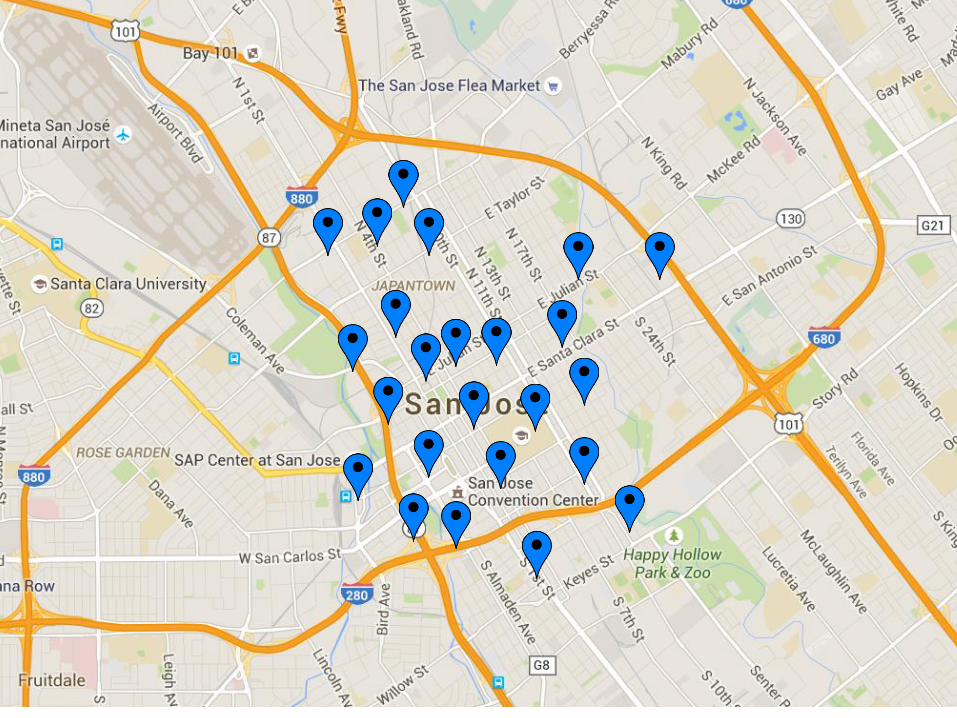
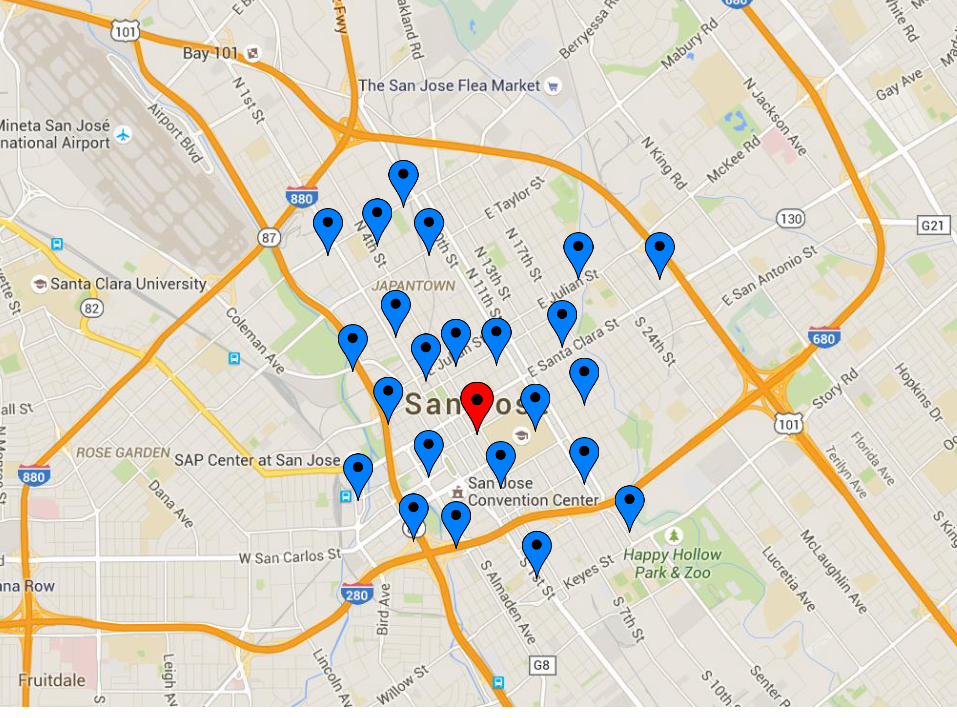
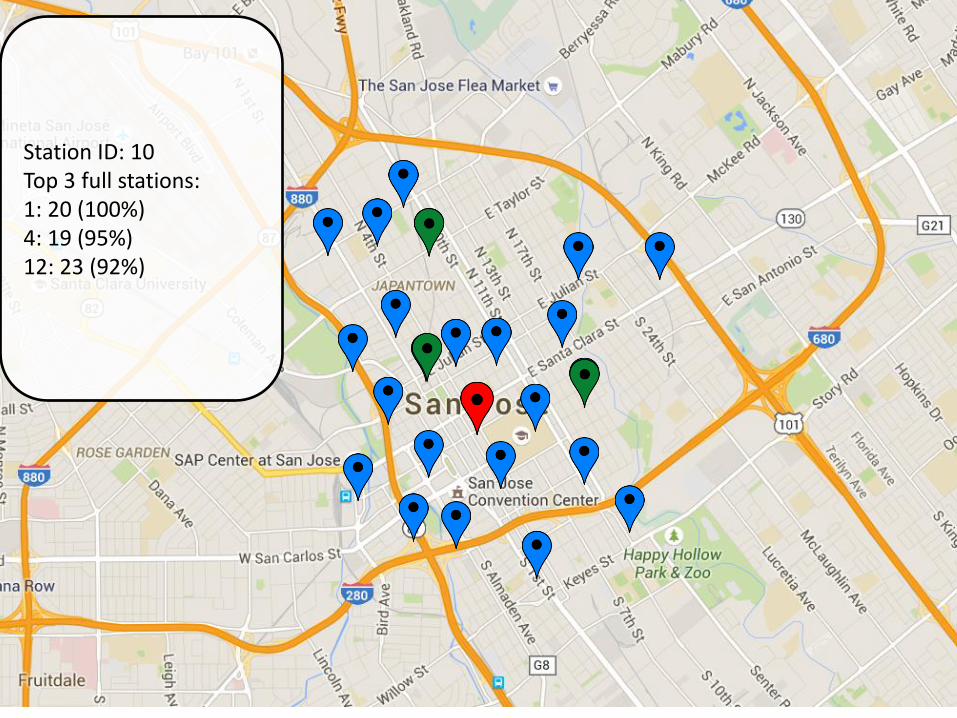
Station ID: 10 Top 3 full stations: 1: 20 (100%) 4: 19 (95%) 12: 23 (92%)

How to solve it?

How to solve it?
• Need to know the number of the bike at each station.

How to solve it?
• Need to know the number of the bike at each station.
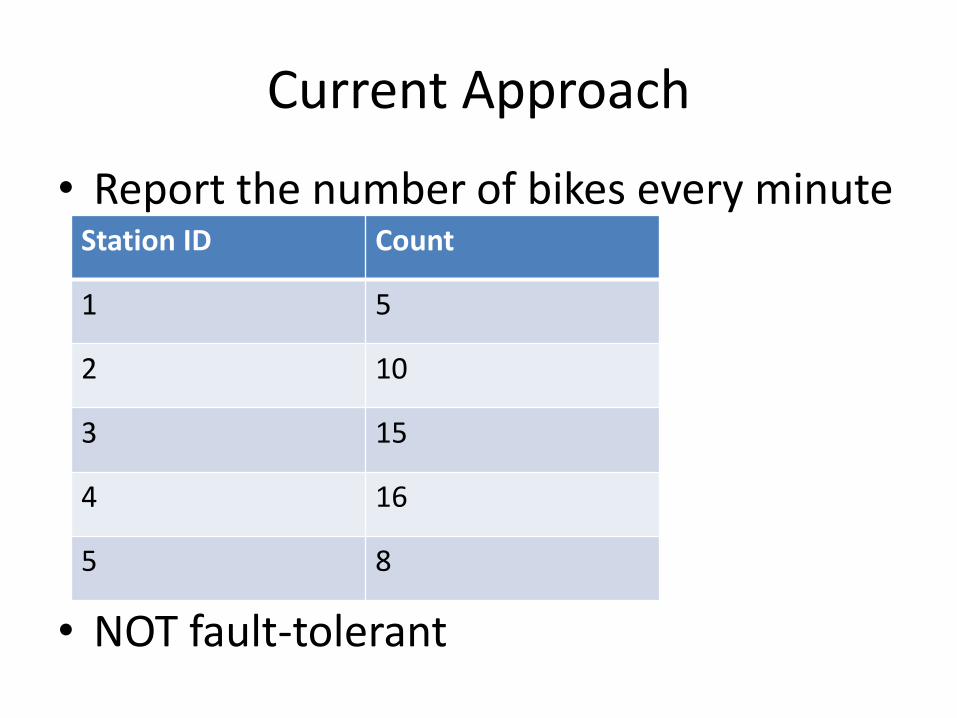
• First attempt: report the number of bikes every minute
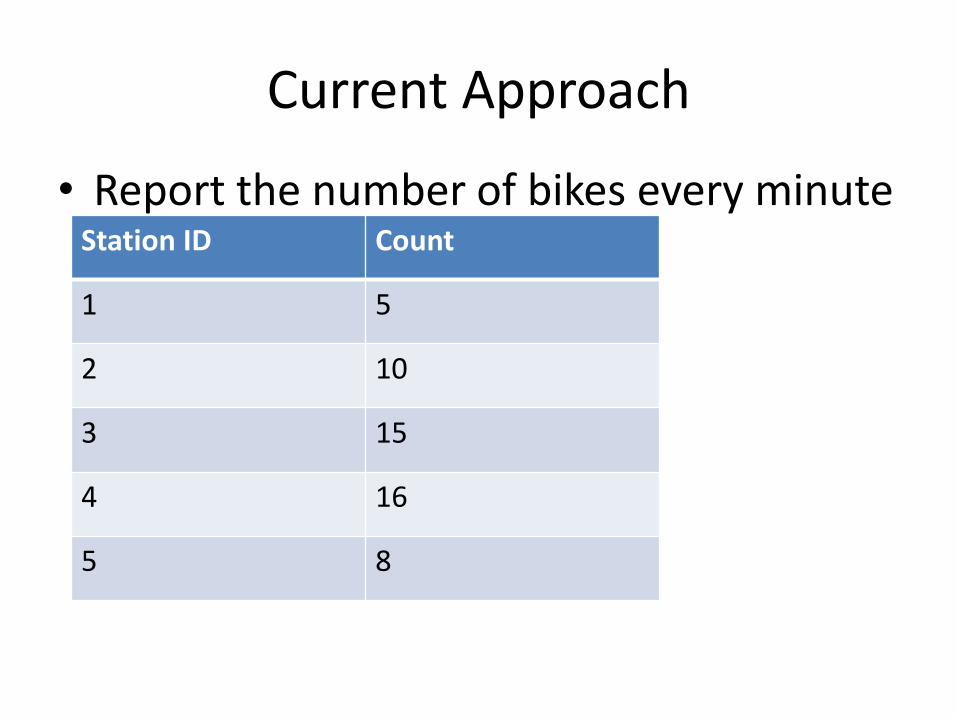
Current Approach
• Report the number of bikes every minute
Station ID Count
1 5
2 10
3 15
4 16
5 8
Current Approach
• Report the number of bikes every minute
• NOT fault-tolerant
Station ID Count
1 5
2 10
3 15
4 16
5 8

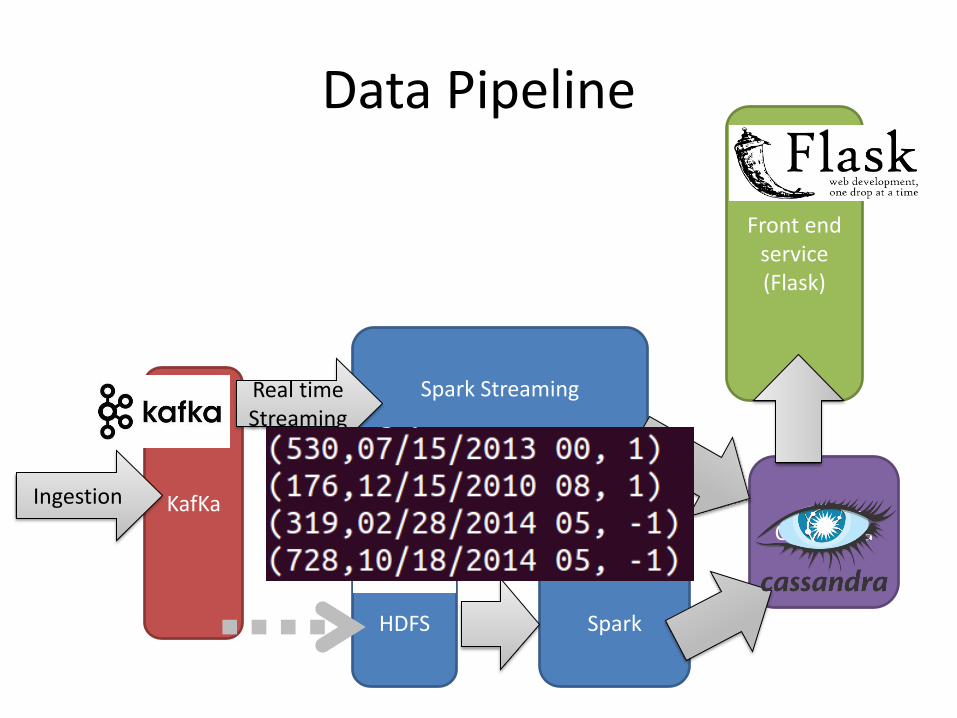
My Approach
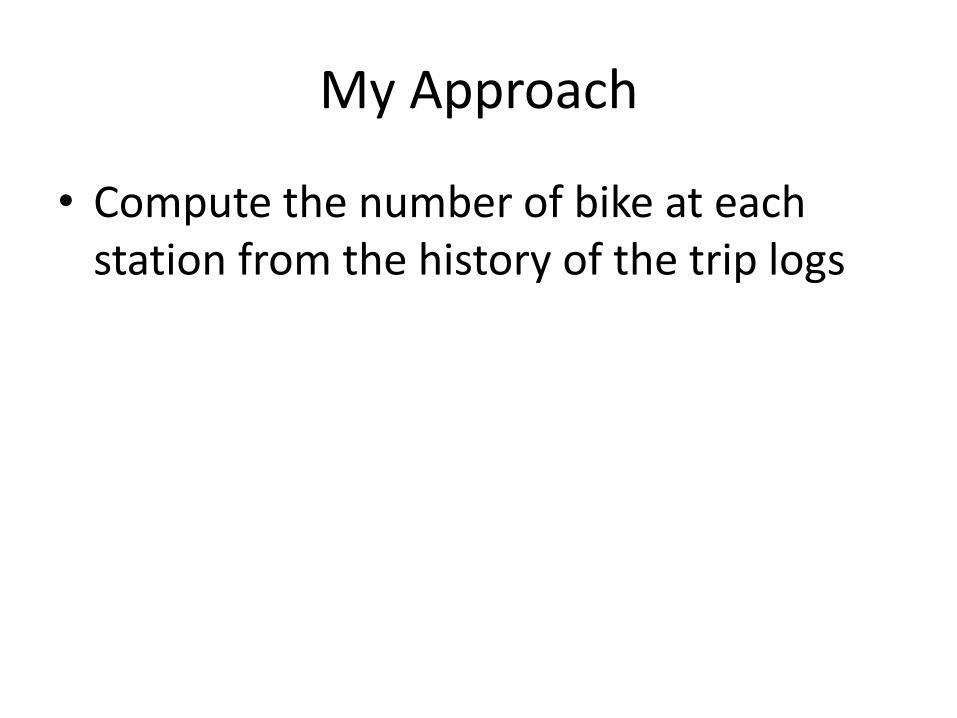
My Approach
• Compute the number of bike at each station from the history of the trip logs
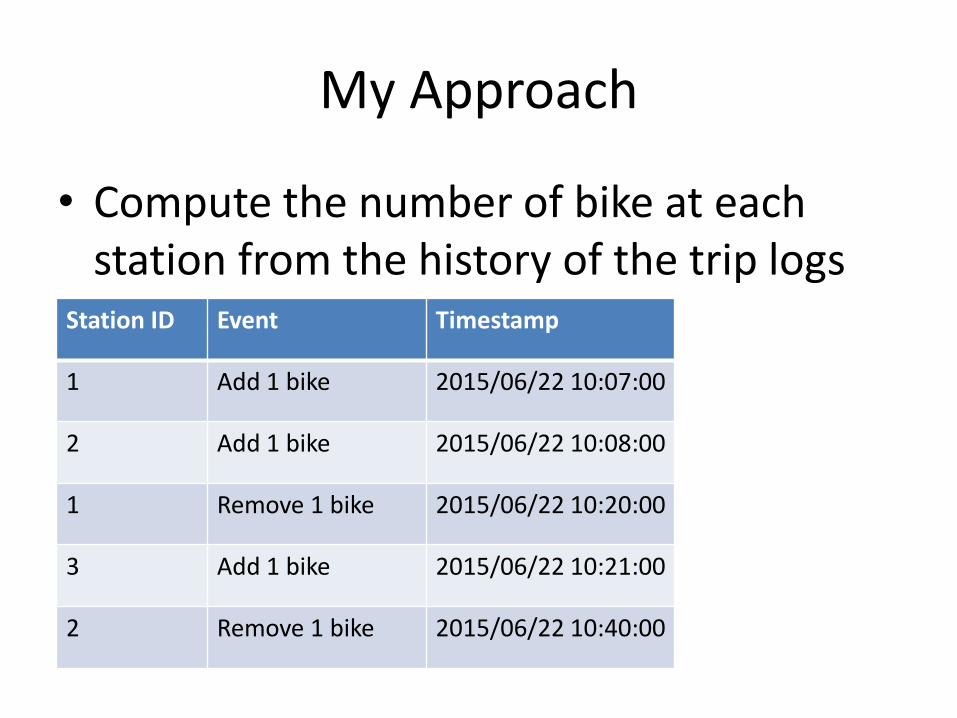
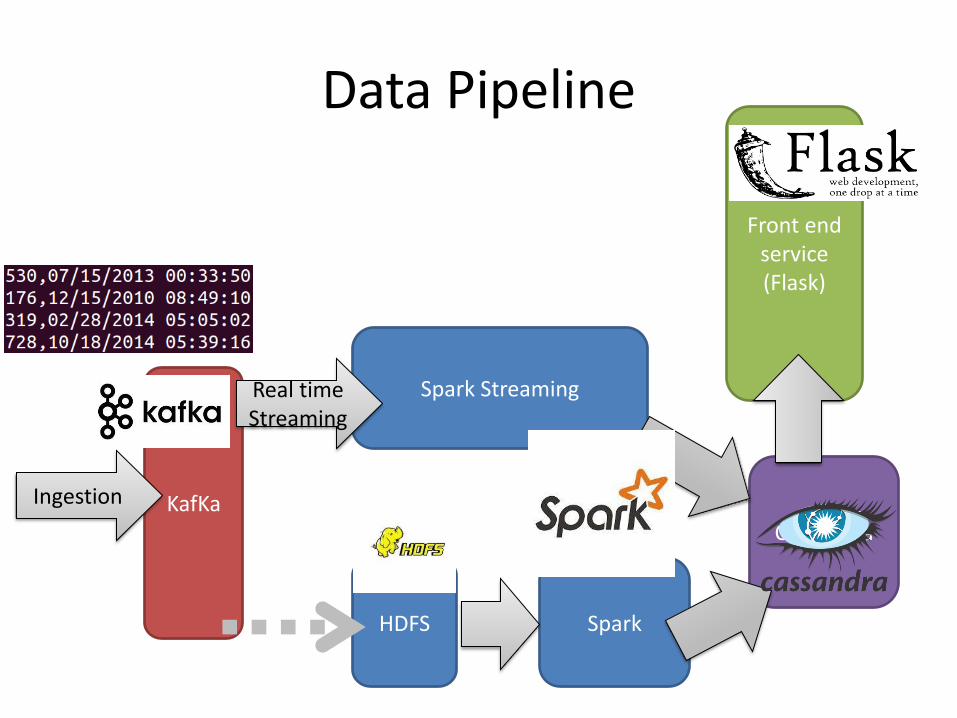
Station ID Event Timestamp
1 Add 1 bike 2015/06/22 10:07:00
2 Add 1 bike 2015/06/22 10:08:00
1 Remove 1 bike 2015/06/22 10:20:00
3 Add 1 bike 2015/06/22 10:21:00
2 Remove 1 bike 2015/06/22 10:40:00
My Approach
• Compute the number of bike at each station from the history of the trip logs

Station ID Event Timestamp
1 Add 1 bike 2015/06/22 10:07:00
2 Add 1 bike 2015/06/22 10:08:00
1 Remove 1 bike 2015/06/22 10:20:00
3 Add 1 bike 2015/06/22 10:21:00
2 Remove 1 bike 2015/06/22 10:40:00
My Approach
• Compute the number of bike at each station from the history of the trip logs
• Raw

Station ID Event Timestamp
1 Add 1 bike 2015/06/22 10:07:00
2 Add 1 bike 2015/06/22 10:08:00
1 Remove 1 bike 2015/06/22 10:20:00
3 Add 1 bike 2015/06/22 10:21:00
2 Remove 1 bike 2015/06/22 10:40:00
My Approach
• Compute the number of bike at each station from the history of the trip logs
• Raw • Immutable
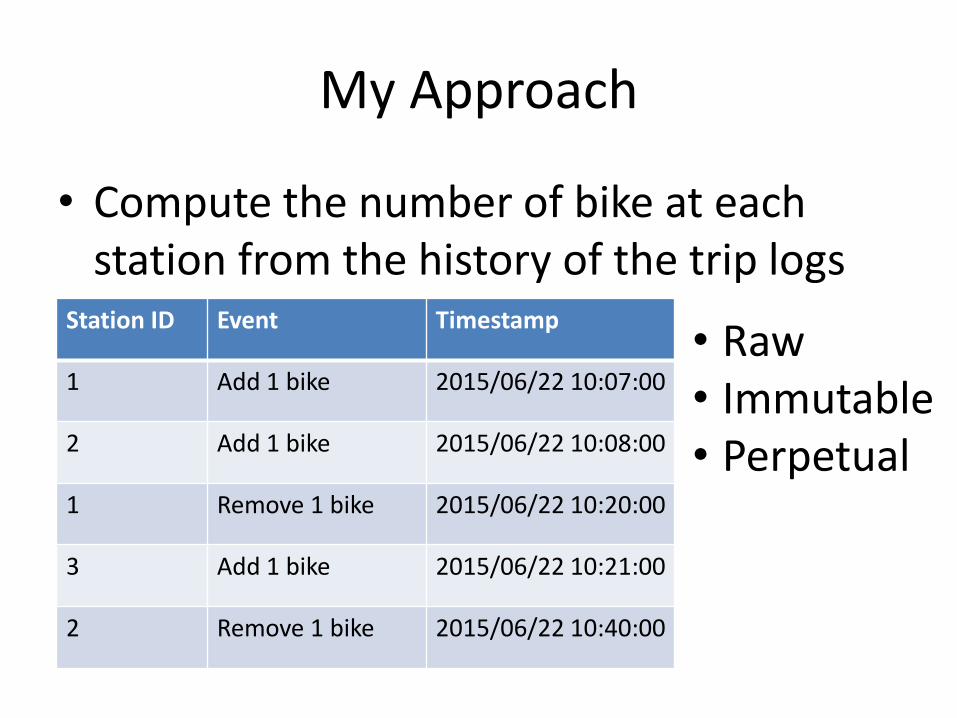
Station ID Event Timestamp
1 Add 1 bike 2015/06/22 10:07:00
2 Add 1 bike 2015/06/22 10:08:00
1 Remove 1 bike 2015/06/22 10:20:00
3 Add 1 bike 2015/06/22 10:21:00
2 Remove 1 bike 2015/06/22 10:40:00
My Approach
• Compute the number of bike at each station from the history of the trip logs
• Raw • Immutable • Perpetual
Data
Data
• The actual log data from Bay Area Bike Share have many fields
Data
• The actual log data from Bay Area Bike Share have many fields – Trip ID,Duration,Start Date,Start Station,Start
Terminal,End Date,End Station,End Terminal,Bike #,Subscription Type,Zip Code
Data
• The actual log data from Bay Area Bike Share have many fields – Trip ID,Duration,Start Date,Start Station,Start
Terminal,End Date,End Station,End Terminal,Bike #,Subscription Type,Zip Code
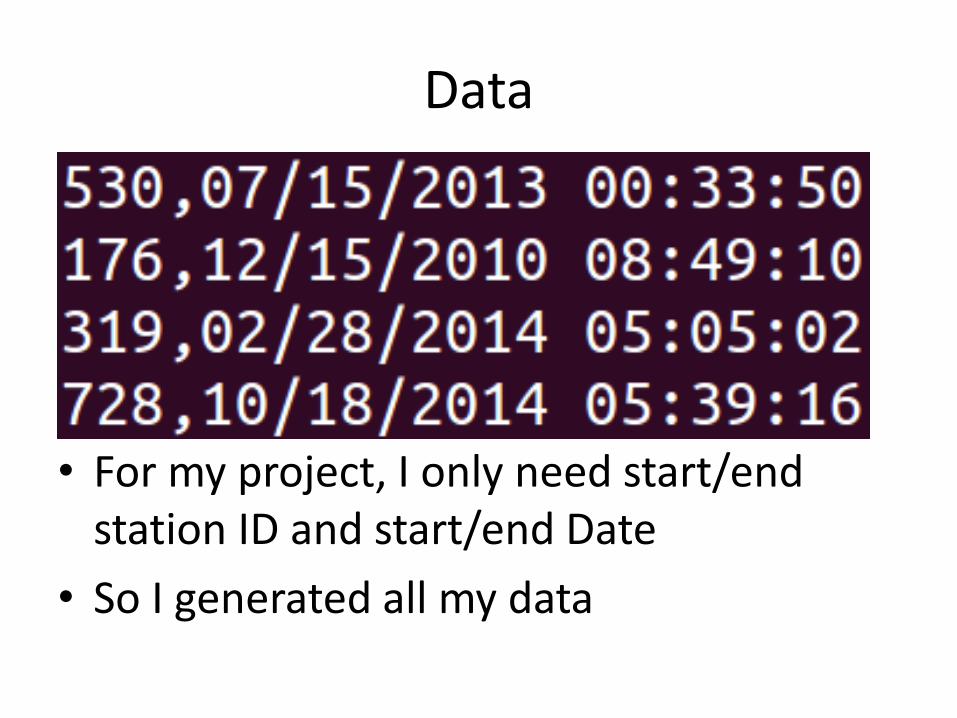
• For my project, I only need start/end station ID and start/end Date

Data
• The actual log data from Bay Area Bike Share have many fields – Trip ID,Duration,Start Date,Start Station,Start
Terminal,End Date,End Station,End Terminal,Bike #,Subscription Type,Zip Code
• For my project, I only need start/end station ID and start/end Date
Data
• The actual log data from Bay Area Bike Share have many fields – Trip ID,Duration,Start Date,Start Station,Start
Terminal,End Date,End Station,End Terminal,Bike #,Subscription Type,Zip Code
• For my project, I only need start/end station ID and start/end Date
• So I generated all my data
Data
• The actual log data from Bay Area Bike Share has many fields – Trip ID,Duration,Start Date,Start Station,Start
Terminal,End Date,End Station,End Terminal,Bike #,Subscription Type,Zip Code
• For my project, I only need start/end station ID and start/end Date
• So I generated all my data
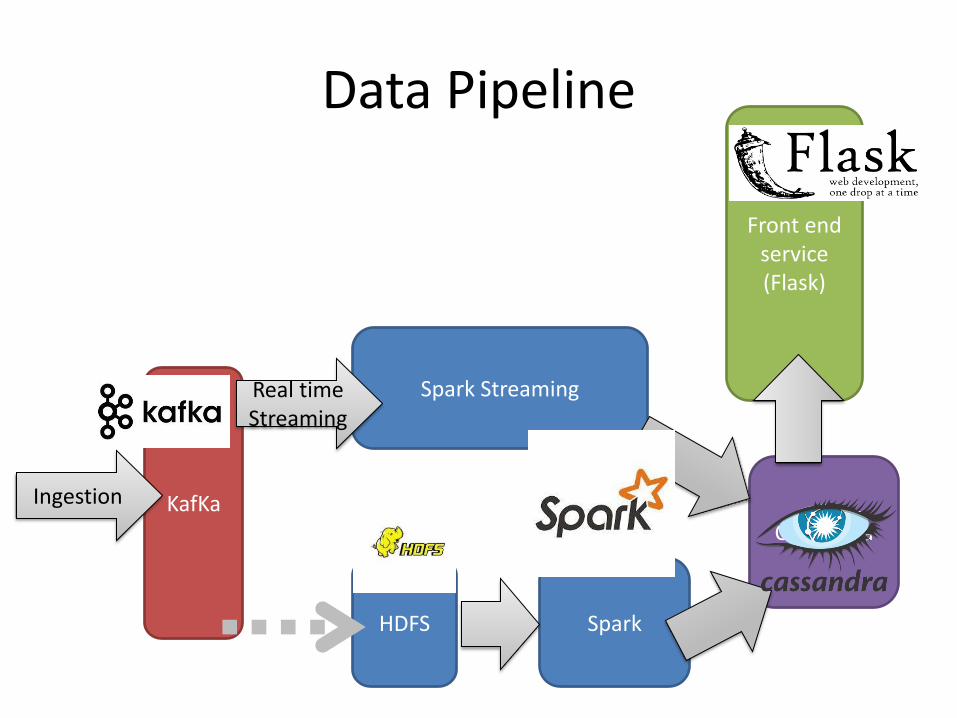
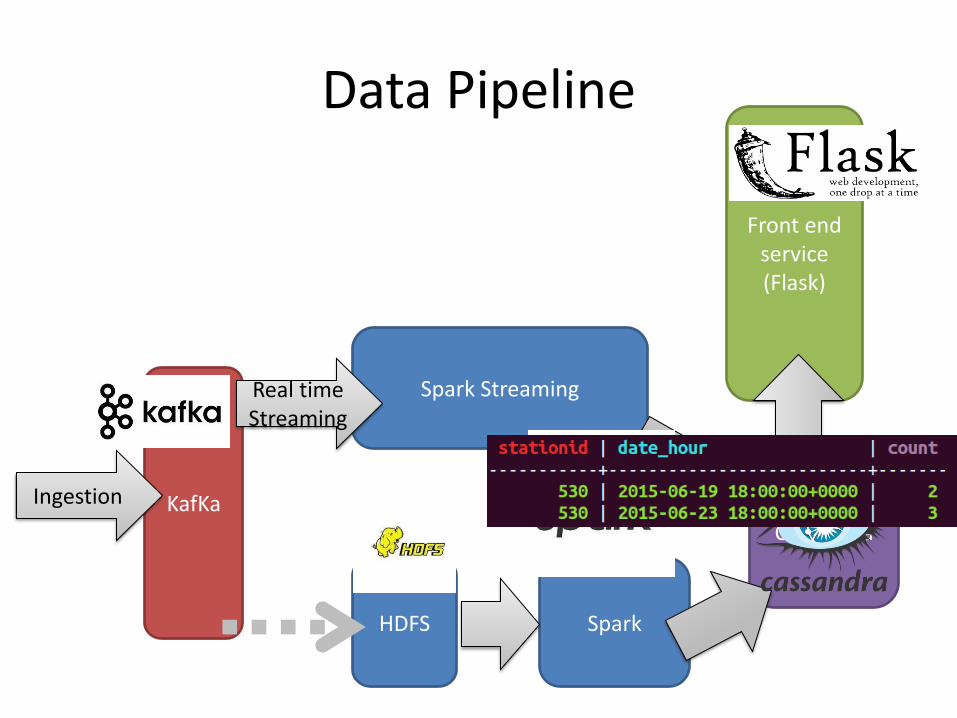
Data Pipeline
KafKa
Spark Streaming
HDFS Spark
Front end service (Flask)
Cassandra
Ingestion
Real time Streaming
Data Pipeline
KafKa
Spark Streaming
HDFS Spark
Front end service (Flask)
Cassandra
Ingestion
Real time Streaming
Data Pipeline
KafKa
Spark Streaming
HDFS Spark
Front end service (Flask)
Cassandra
Ingestion
Real time Streaming
Data Pipeline
KafKa
Spark Streaming
HDFS Spark
Front end service (Flask)
Cassandra
Ingestion
Real time Streaming
Demo
• insight-bikealert.com

About me • Kuan-Lin Chen
• Master of Engineering in Computer Science, Cornell University, class of 2015
• Bachelor of Science in Computer Science & Math, University of Wisconsin-Madison, class of 2013

About me • Kuan-Lin Chen
• Master of Engineering in Computer Science, Cornell University, class of 2015
• Bachelor of Science in Computer Science & Math, University of Wisconsin-Madison, class of 2013
• I was a military police during 2013-2014.
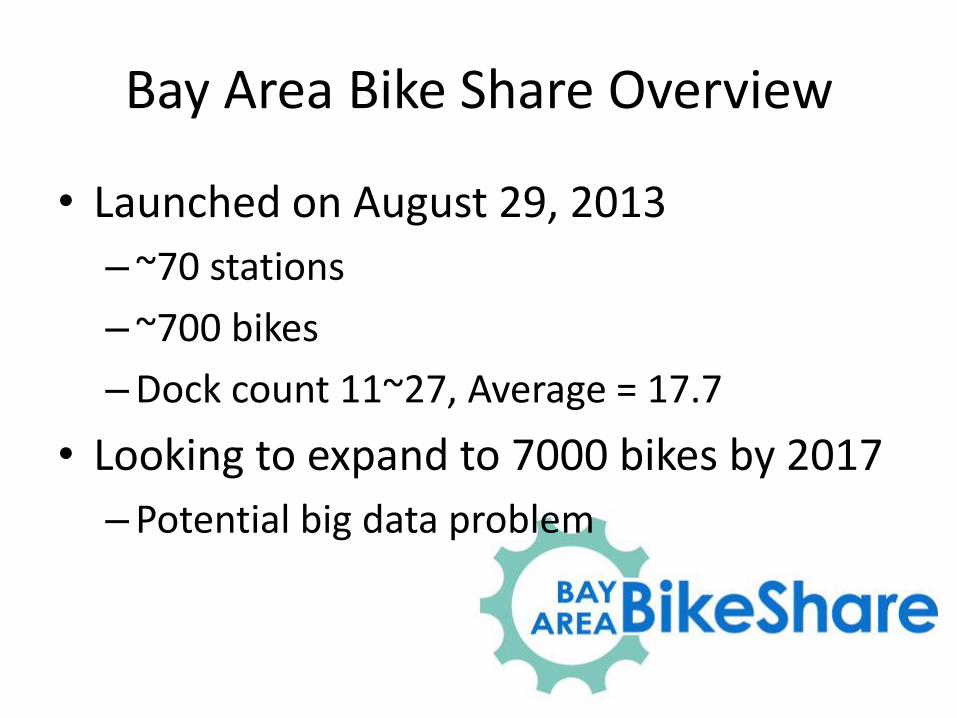
Bay Area Bike Share Overview
• Launched on August 29, 2013
–~70 stations
–~700 bikes
–Dock count 11~27, Average = 17.7
• Looking to expand to 7000 bikes by 2017
–Potential big data problem
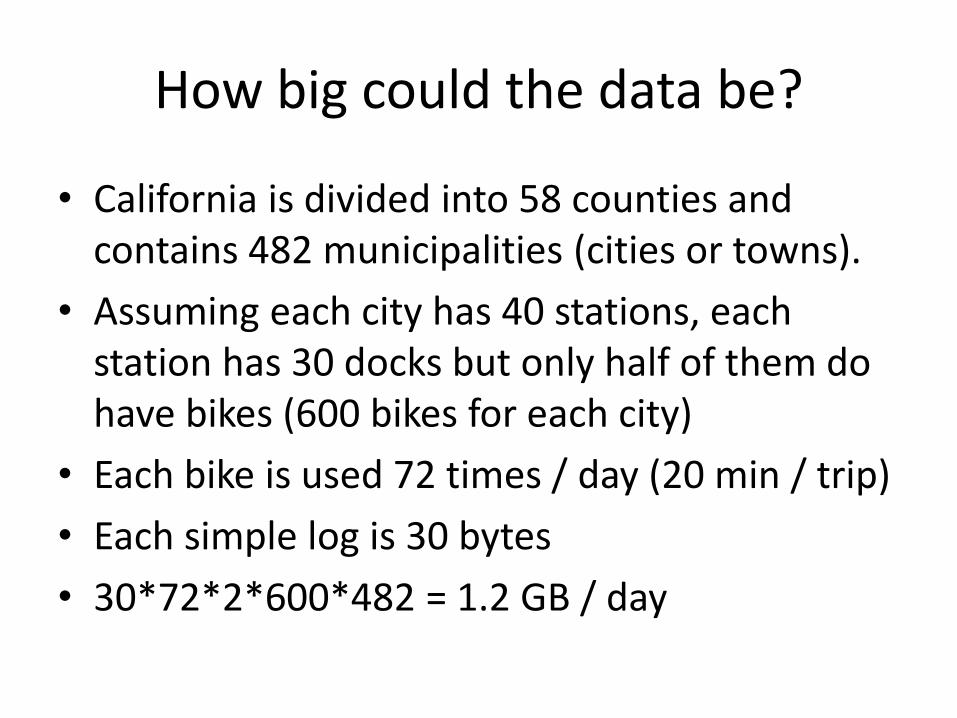
How big could the data be?
• California is divided into 58 counties and contains 482 municipalities (cities or towns).
• Assuming each city has 40 stations, each station has 30 docks but only half of them do have bikes (600 bikes for each city)
• Each bike is used 72 times / day (20 min / trip)
• Each simple log is 30 bytes
• 30*72*2*600*482 = 1.2 GB / day