Krause Fund Research Fall 2017 Caterpillar Inc. · Caterpillar, Inc. is the leading global...
33
1 Caterpillar Inc. (NYSE: CAT) Krause Fund Research Fall 2017 Heavy Machinery Recommendation: BUY Analysts Nick Magnini [email protected] Sam Goldsberry [email protected] Ryan Brennan [email protected] Company Overview Caterpillar, Inc. is the leading global manufacturer of construction, transportation, and energy equipment. Caterpillar also offers financing plans such as operating leases and loans to customers for the use of equipment. Products include diesel and natural gas engines, gas turbines, and diesel-electric locomotives. Caterpillar is divided into three main segments: Construction Industries, Resource Industries, and Energy & Transportation. Caterpillar also provides financing through its Financial Products division. For the third quarter of 2017, Caterpillar revenues increased 23.9% to $11.4 billion, compared to $9.2 billion in the third quarter of 2016. Stock Performance Highlights 52 week High $140.44 52 week Low $89.36 Beta Value 1.32 Average Daily Volume 3.44 m Share Highlights Market Capitalization $81.68 b Shares Outstanding 0.59b EPS (2016) $(0.11) P/E Ratio 26.71 Dividend Payout Ratio 48.80% Company Performance Highlights ROA -0.09% ROE -0.50% Sales $38.54 b Financial Ratios Current Ratio 1.22 Debt to Equity 278.38% November 8, 2017 Current Price $137.29 Target Price $173-176 CAT Claws to Strong Earnings • Population growth Caterpillar will capitalize on global population growth, which is expected to grow 12% by 2030, as well as urbanization rates, which are expected to grow 66% by 2050. • Restructuring & Improved Operating Margins In 2016, Caterpillar experienced a $67 million loss due to weak demand and restructuring charges, which totaled $1.019 billion. CAT will lower costs and increase profits over the long-term due to restructuring efforts and increasing end-user demand across the globe. • Management’s focus on increasing growth and value CEO Jim Umpleby has implemented a new business strategy focused on allocating resources efficiently to increase ROIC and profitable growth, rather than pursuing short-term profits. • Increase in Global Construction Output From 2016 to 2020, the global construction output in advanced economies is expected to increase by 2.5%, and the output in emerging markets is expected to increase by 4.2%. • Higher commodity prices will stimulate demand Commodity prices have rebounded, which will increase sales in Caterpillar’s Resources Industries and Energy & Transportation segments. Since the beginning of 2017, oil prices rose 26.79%, natural gas increased 11.24%, and copper increased 33.5% 1 One Year Stock Performance (Source: Google Finance 2 )
Transcript of Krause Fund Research Fall 2017 Caterpillar Inc. · Caterpillar, Inc. is the leading global...

1
Caterpillar Inc. (NYSE: CAT)
Krause Fund Research Fall 2017 Heavy Machinery Recommendation: BUY Analysts Nick Magnini [email protected]
Sam Goldsberry [email protected]
Ryan Brennan [email protected]
Company Overview Caterpillar, Inc. is the leading global manufacturer of construction, transportation, and energy equipment. Caterpillar also offers financing plans such as operating leases and loans to customers for the use of equipment. Products include diesel and natural gas engines, gas turbines, and diesel-electric locomotives. Caterpillar is divided into three main segments: Construction Industries, Resource Industries, and Energy & Transportation. Caterpillar also provides financing through its Financial Products division. For the third quarter of 2017, Caterpillar revenues increased 23.9% to $11.4 billion, compared to $9.2 billion in the third quarter of 2016. Stock Performance Highlights 52 week High $140.44 52 week Low $89.36 Beta Value 1.32 Average Daily Volume 3.44 m Share Highlights Market Capitalization $81.68 b Shares Outstanding 0.59b EPS (2016) $(0.11) P/E Ratio 26.71 Dividend Payout Ratio 48.80% Company Performance Highlights ROA -0.09% ROE -0.50% Sales $38.54 b Financial Ratios Current Ratio 1.22 Debt to Equity 278.38%
November 8, 2017
Current Price $137.29
Target Price $173-176 CAT Claws to Strong Earnings
• Population growth Caterpillar will capitalize on global population growth, which is expected to grow 12% by 2030, as well as urbanization rates, which are expected to grow 66% by 2050. • Restructuring & Improved Operating Margins In 2016, Caterpillar experienced a $67 million loss due to weak demand and restructuring charges, which totaled $1.019 billion. CAT will lower costs and increase profits over the long-term due to restructuring efforts and increasing end-user demand across the globe. • Management’s focus on increasing growth and value CEO Jim Umpleby has implemented a new business strategy focused on allocating resources efficiently to increase ROIC and profitable growth, rather than pursuing short-term profits. • Increase in Global Construction Output From 2016 to 2020, the global construction output in advanced economies is expected to increase by 2.5%, and the output in emerging markets is expected to increase by 4.2%. • Higher commodity prices will stimulate demand Commodity prices have rebounded, which will increase sales in Caterpillar’s Resources Industries and Energy & Transportation segments. Since the beginning of 2017, oil prices rose 26.79%, natural gas increased 11.24%, and copper increased 33.5%1
One Year Stock Performance
(Source: Google Finance2)
2
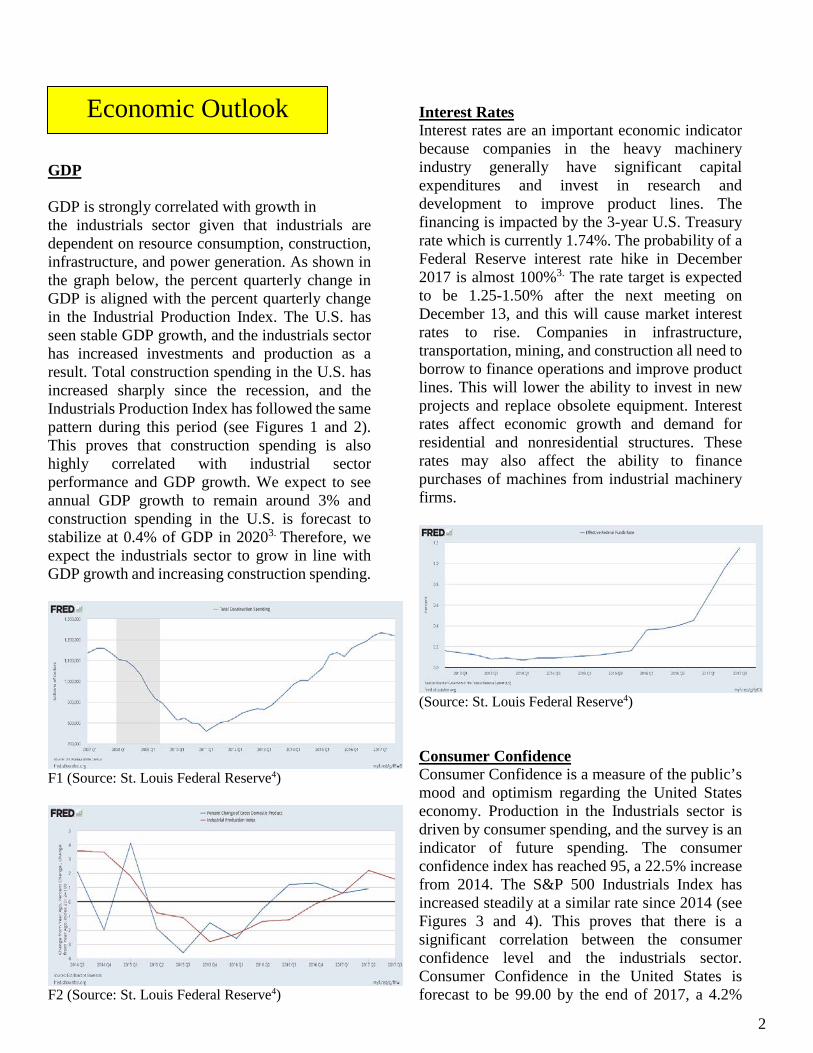
Economic Outlook GDP GDP is strongly correlated with growth in the industrials sector given that industrials are dependent on resource consumption, construction, infrastructure, and power generation. As shown in the graph below, the percent quarterly change in GDP is aligned with the percent quarterly change in the Industrial Production Index. The U.S. has seen stable GDP growth, and the industrials sector has increased investments and production as a result. Total construction spending in the U.S. has increased sharply since the recession, and the Industrials Production Index has followed the same pattern during this period (see Figures 1 and 2). This proves that construction spending is also highly correlated with industrial sector performance and GDP growth. We expect to see annual GDP growth to remain around 3% and construction spending in the U.S. is forecast to stabilize at 0.4% of GDP in 20203. Therefore, we expect the industrials sector to grow in line with GDP growth and increasing construction spending.
F1 (Source: St. Louis Federal Reserve4)
F2 (Source: St. Louis Federal Reserve4)
Interest Rates Interest rates are an important economic indicator because companies in the heavy machinery industry generally have significant capital expenditures and invest in research and development to improve product lines. The financing is impacted by the 3-year U.S. Treasury rate which is currently 1.74%. The probability of a Federal Reserve interest rate hike in December 2017 is almost 100%3. The rate target is expected to be 1.25-1.50% after the next meeting on December 13, and this will cause market interest rates to rise. Companies in infrastructure, transportation, mining, and construction all need to borrow to finance operations and improve product lines. This will lower the ability to invest in new projects and replace obsolete equipment. Interest rates affect economic growth and demand for residential and nonresidential structures. These rates may also affect the ability to finance purchases of machines from industrial machinery firms.
(Source: St. Louis Federal Reserve4)
Consumer Confidence Consumer Confidence is a measure of the public’s mood and optimism regarding the United States economy. Production in the Industrials sector is driven by consumer spending, and the survey is an indicator of future spending. The consumer confidence index has reached 95, a 22.5% increase from 2014. The S&P 500 Industrials Index has increased steadily at a similar rate since 2014 (see Figures 3 and 4). This proves that there is a significant correlation between the consumer confidence level and the industrials sector. Consumer Confidence in the United States is forecast to be 99.00 by the end of 2017, a 4.2%

3
increase from August 20174. Looking forward, we expect the industrials sector to gradually increase over the next 12 months.
F3 (Source: St. Louis Federal Reserve4) S&P 500 Industrials Index
F4 (Source: Google Finance2) Commodity Prices Commodity prices have a significant impact on manufacturers who use commodities like steel, copper, and plastics. The Energy, Transportation, and Mining industries are impacted heavily by commodity prices, and demand for machinery/equipment from manufacturers like Caterpillar and Deere & Co. depend on these prices. If oil prices are too low, manufacturers of mining equipment will have low demand from end-users. Commodity prices in these industries are typically volatile and unpredictable, and natural disasters like Hurricane Harvey and Hurricane Irma can cause long-term effects on prices. Crude Oil Crude oil prices are up 27.08% YTD and this improves margins for companies in the Energy, Mining, and Machinery industries. Brent Crude Oil is expected to increase to $55.61/b by 20185, and this will increase profits for companies in the
Energy and Mining industries, which in turn should increase demand for related machinery and equipment. Crude Oil Prices FY 2017:
(Source: CNN Money1)
Natural gas Natural gas prices are up 19.68% YTD and this improves margins for companies in the Energy, Mining, and Machinery industries. Natural gas is expected to increase to $4.30 per thousand cubic feet by 20185, and this will increase profits for mining and energy companies with exposure to natural gas. Manufacturers of natural gas mining equipment will also experience high demand as a direct result of price increases. Natural Gas Prices FY 2017:
(Source: CNN Money1)
Copper Copper prices are up 29.93% YTD and this improves margins for companies in the Energy and Mining industries. The price of copper is expected to increase to $7,000 per metric ton by 2030, a 49% increase from 20166. However, this can hurt profits for heavy machinery manufacturers as cost of raw materials will drastically increase since they use steel to make their products.

4
Industry Outlook
Copper Prices FY 2017:
(Source: CNN Money1)
Capacity Utilization Capacity utilization measures the proportion of potential economic output that is actually realized for manufacturing companies. A high capacity utilization (close to 100%) reflects an economy that is operating efficiently and is experiencing stable growth. This rate also indicates the industry’s ability to sustain higher levels of production in the current U.S. economy. In Q3 2017, capacity utilization was 75.6%, and the rate is expected to reach 76.7% in Q3 2018, a 1.5% increase (see graph below)4. Therefore, we believe there is potential for growth and increased production for companies in the industrials sector.
(Source: St. Louis Federal Reserve4) Capital Markets Outlook Given the current economic data and forecasted macroeconomic changes, we expect to see improved conditions for the industrials sector. Stable GDP growth, increased consumer confidence, and favorable commodity prices will stimulate growth in the heavy machinery industry. We believe these positive factors will outweigh the negative economic impact of rising interest rates. All of these factors, coupled with an expectation of
higher capacity utilization, create a positive outlook for manufacturing companies in the industrials sector. We believe companies in the heavy machinery industry stand to gain from the growth potential provided by these macroeconomic trends. Overview Caterpillar Incorporated operates within the Heavy Machinery Sector and more specifically the Construction Industry, the Resource Industry, and the Energy and Transportation Industry. The Heavy Machinery Sector derives its revenue from sales to dealers that sell to firms in many other manufacturing and service industries. The Heavy Machinery Sector bottomed out in 3Q 2016, but has seen a rapid increase in sales since. A driver for this growth has been the Construction Industry, which has seen healthy increases in infrastructure projects and machinery replacement demands. Industry Trends Heavy machinery dealers are now in their fourth quarter of growth for inventory levels after 4 consecutive years of declining demand. The Machinery Sector had peak sales back in 2010 and 2011 and has since declined up until 3Q16. Replacement costs for heavy machines is one driver for heavy machinery growth. Construction and mining company’s excavators, wheel loaders, and other heavy equipment that have estimated useful lives of 5-10 years are stimulating demand again as customers are looking to replace old machinery9. Real estate demand is often highly correlated with construction and other heavy machinery sales. Real estate development has been relatively weak post 2011 and is not expected to see huge increases anytime soon giving limited support to the construction industry; however, new contracts for infrastructure improvement projects outweigh the negatives of a flat real estate development market.

5
(Source: Thomsonone9) Shown above is the correlation between new construction contracts and the sales volume for excavator and wheel loaders. New contracts for major constructors is driving growth in the sector. New contracts for global constructors is expected to grow 23% in 2017 after growth of 18% in 20169. We believe the infrastructure investments will support the growth in sales for the Heavy Machinery Industry for the foreseeable future as many of these projects will take multiple years to complete. Construction machinery like excavators, wheel loaders and road rollers are likely to see the greatest benefits. Weak commodity prices have led to lower sales in recent years for heavy mining machinery. This has led to a decline in mining machinery investment for 2014, 2015, and 2016 of -11%, -14%, and -24%, respectively9. Commodity prices started to rebound in 2016 and eventually started to put mining machines back to work. This has already led to an increase in machine part sales, and total investment in mining machinery is projected to increase by 10% in each of the next three years.
(Source: World Bank10) Caterpillar also operates in the Energy and Transportation Machinery Sector. Energy prices like metals prices have seen steady decline until the turn around in 2016. Energy prices were up 2% in the third quarter of 2017, which was led by a 17% increase in coal due to China’s environmental friendly government policies restricting the amount of coal production driving down supply. While at first glance this increase in coal price appears to benefit the mining manufacturing industry, it could actually spell danger as coal mining machines are being less utilized in certain countries. Low oil prices in 2016 directly impacted CAT and its competitors due to weak demand from oil drilling customers. The increase in crude oil prices of 27.08% YTD1 have been driving demand from end-users of oil production equipment. The growth in compressed natural gas is also driving growth for companies in the industry and is expected to account for 24% of all global energy demand by 2040. This is an increase from the current 17%12. Competitive Environment Caterpillar operates across a variety of industries, but has proven to be a global leader across many of them. Caterpillar has been the global leader in the Construction Machinery Manufacturing Industry for 15 consecutive years. In 2016 Caterpillar had a global market share of 16%, slightly ahead of Komatsu, which sits at 11%11. There is a significant drop off after Caterpillar and Komatsu with all other companies

6
having 5% or less of total market share.
(Source: Statista11) Key ratios for this industry are ROA, ROE, and operating income margin. Caterpillar blows away the competition in all three of these financial measures. The Heavy Machinery and Vehicles Industry average for ROA is right around 3%. We are forecasting CAT’s 2017 ROA to be over 2 percentage points higher than the industry average at 5.00% in 2017, whereas Komatsu and Hitachi are projected at 3.64%17 and 2.39%16, respectively. The strong ROA can be attributed to excellent management tactics and cost cutting initiatives like the lean production system implemented by Caterpillar. We are projecting Caterpillar to have an operating income margin of 13.74% in 2017 compared to the industry average at 6%. Komatsu and Hitachi are operating at 7.30%17 and 5.19%16, respectively. In a historically low margin industry, cutting costs is crucial to long term success because small incremental gains can mean huge profits. Caterpillar cut total variable manufacturing costs by $6757 million dollars in 2016, and the continuation of these cost cutting initiatives is driving their success in 2017 as they have released a strong earnings report in each of the first three quarters raising guidance each time. The Mining Equipment Industry has an estimated worth of $74.5 billion12. Caterpillar is a global leader in mining, oil, and gas machinery. They currently rank second in United States sales just slightly behind National Oilwell Varco.
(Source: IBISWorld12) While National Oilwell Varco and Baker Hughes have a strong presence in the United States for mining equipment, Caterpillar is much more globally focused. They compete with Komatsu and Hitachi in the Mining Machinery Industry as well because some of the construction equipment serves a dual purpose in the mining industry. The developing world has been the fastest growing market in demand for mining equipment due to increases in manufacturing output18. More industrialized countries like the United States and various European countries are showing slowed growth. Coal consumption has continued to decrease due to regulatory measures forcing use of alternative energy. Less industrialized countries is where the market share growth will be available in the future. India is projected to continue to be the fastest growing national market as its mining equipment sales have already doubled from 2009 to 2014. The Asian-Pacific Market as a whole is expected to continue to show rapid growth through 2019 due to large increases in mining output18.
Caterpillar16%
Komatsu11%
Hitachi5%
All others68%
Construction Equipment Manufacturing Global Market Share 2016
Caterpillar Komatsu Hitachi All others
National Oilwell Varco12%
Caterpillar11%
Baker Hughes
9%All others
68%
U.S. Market Share for Mining, Oil, and Gas Machinery Manufacturing 2016
National Oilwell Varco Caterpillar
Baker Hughes All others

7
(Source: Statista15) Caterpillar had Resource Industry revenues of $1.5 billion in the Asia and Pacific region for 2016. This represents over 25% of CAT’s total sales in the Resources Industry. National Oilwell Varco had revenues of $1.4 billion in the Asia and Pacific region, which accounts for just under 20% of their total revenue19. Both National Oilwell Varco and Caterpillar’s oil and mining sales are highly correlated with oil rigs actively drilling. Both CAT and NOV posted negative incomes for these segments in 2016 due to low crude oil prices affecting the amount of oil rigs actively drilling. Average worldwide rig activity decreased 32% in 2016, which can be attributed to oil prices falling 11%. Data taken in February of 2017 showed 1,093 actively drilling rigs in North America, which is a 43% increase from the average of 765 rigs in 4Q1619. We are forecasting these trends to continue due to increases in oil prices YTD, which will open up market share for companies like Baker Hughes, CAT, and NOV in the Mining and Oil Equipment industries. We are projecting CAT to take much of this new market share as it is coming from markets in which they historically excel in.
Porter’s 5 Forces Threat of New Entrants: Low There are high barriers to entry for large machinery manufacturing due to the large capital investment required and the brand recognition of companies like Caterpillar, John Deere, Volvo, and Komatsu. These companies are all vertically integrated and compete in global markets. High labor qualifications are another factor causing high barriers to entry. The technical
expertise required to manufacture large construction, mining, or agricultural machinery may prevent certain firms from breaking in.
Threat of Substitutes: Low The need for construction and energy is likely to go on for the foreseeable future. There have not been any signs that large machinery will ever go away, although the way companies are using large machinery is changing. Alternative Eco-friendly sources of energy are becoming increasingly popular; however large machinery is still required to generate these types of energy. While engineering and technological advances have bettered heavy construction machinery over the past few decades, the same basic concepts and manufacturers are still at the top.
Power of Suppliers: Low to Medium Because there are only a handful of large machinery manufacturers that dominate the market, the power that suppliers often possess is rather low. Caterpillar, for example, conducts surveys to prospective suppliers to see if their long-term goals coincide. Companies like Caterpillar get to choose the suppliers whose quality and prices best align; however large equipment manufacturers like to stick with trusted suppliers given the importance of each individual machine making the power of supplier’s medium at times.
Power of Buyers: Low The buyers of large industrial machinery are often dealers who have long-term contracts. Caterpillar, John Deere, other heavy machinery manufacturers usually have financing divisions that help to support the wholesaler. Dealers usually have little buying power because they typically have one to two large manufacturers who strategically help them with marketing and sales efforts.
Competitive Rivalry: Low Across the industry, rivals compete based on: performance, customer service, quality and price. Companies must have enough capital to invest in research and development to keep up with trends in the industry, otherwise they will lose out to larger competitors. Companies in the Construction Machinery industry must invest heavily into product promotion to receive brand recognition and develop
Global Demand for Mining Equipment

8
Company Analysis
direct relationships, which are necessary to gain a competitive advantage. Since products are fairly similar across the industry, customers desire products and equipment that will perform necessary tasks in the most cost-effective way.
Overview and Business Description Caterpillar is the global leader in the production of construction, transportation, mining, and energy machinery and equipment. Caterpillar has over 95,400 employees and operates through a dealer network that reaches 190 countries, 123 of which are located outside of the United States. Their products and financing solutions are demanded by end-users in the Construction, Transportation, Mining and Energy industries. Caterpillar is divided into the following segments: Construction Industries, Resource Industries, Energy & Transportation, and Financial Products. Financial Summary Caterpillar experienced a loss of $67 million in 2016, which is primarily due to weak end-user demand in the Construction, Oil and gas, Mining, and Rail industries. Weak commodity prices have driven demand down and the cyclical nature of the heavy machinery industry has hurt Caterpillar’s bottom line. Sales for 2016 were $38.5 billion, an 18% decrease from 20157. Re-measurement of pension plans and other postemployment benefits in 2016 led to losses of $985 million7. Restructuring plans began in 2015, which are expected to lower operating costs by $1.5 billion annually once complete7. Restructuring charges for 2016 totaled $1.02 billion and a significant goodwill impairment charge of $595 million was incurred7. Due to our macroeconomic analysis, industry trends, and new strategies implemented by Caterpillar, we believe Caterpillar will improve margins and create value over the long-term. Although Caterpillar posted disappointing results in 2016 and received low demand over the past year, the results for 3Q 2017 are quite promising.
In October, Caterpillar reported quarterly sales of $11.4 billion, which is up $2 billion from a year ago. They reported earnings per share of $1.95, which beat analysts’ expectations by $0.68 or 53.5% (Caterpillar.com). CEO Jim Umpleby expects full-year 2017 sales to reach $44 billion, a 14% increase year over year. Business Segments Construction Industries The Construction Industries segment offers loaders, tractors, pavers, excavators, and related products for customers in the Heavy Construction, Forestry, Infrastructure, and Mining industries. The Construction Industries segment of Caterpillar generated $15.7 billion in revenues for 2016. We project revenues in the Construction Industries segment to be $18.7 billion FFY 2017. This estimate, supported by increasing global population and urbanization is driving increasing global construction output, and new contracts (see SWOT Analysis). Resource Industries The Resources Industries segment offers large tractors, miners, drills, mining trucks, landfill compactors, continuous miners, and related products for users in the Energy and Mining industries. Demand for this industry is highly dependent on volatile commodity prices. Although commodity prices have been weak overall in recent years, they rebounded and are expected to increase consistently over the long-term (see “Commodity Prices” section above). The Resources Industries segment of Caterpillar generated $6 billion in revenues for 2016. We project revenues in the Resource Industries segment to be $7.4 billion FFY 2017. This estimate is supported by an increasing global population and high demand for energy, rising commodity prices, and new contracts (see SWOT Analysis). Energy & Transportation The Energy & Transportation segment offers engines, gas turbines, diesel-electric locomotives, and other related products and services. Demand for these products come from Oil and gas, Rail, Marine, and Power Generation industries. The Energy & Transportation segment of Caterpillar

9
generated $14.4 billion in revenues for 2016. We project revenues in the Energy & Transportation segment to be $15.9 billion FFY 2017. This estimate is supported by an increasing global population and high demand for energy, rising commodity prices, and new contracts (see SWOT Analysis). Financial Products The Financial Products segment offers retail and wholesale financing for the purchase and leasing of Caterpillar’s machinery. These services are offered through its subsidiaries: Caterpillar Financial Services, Caterpillar Insurance Company, Caterpillar Life Insurance Company, Caterpillar Insurance Co. Ltd, and Caterpillar Insurance Services Corporation. The Financial Products segment of Caterpillar generated $2.7 billion in revenues for 2016. We project revenues in the Financial Products segment to be $2.8 billion FFY 2017. This estimate is supported by an increase in demand for machinery and equipment in all three main business segments of Caterpillar. SWOT Analysis Strengths Production Network and Global Reach:
Caterpillar’s size and efficient production processes allow them to produce machinery and equipment in large quantities, which provides the opportunity to dominate the global market for heavy machinery. The company operates in 21 countries and has the largest dealer network in the heavy machinery industry8. This network reaches 190 countries, positioning Caterpillar at a distinct advantage over their competitors.
Strong Brand Name and R&D: With new management in place, Caterpillar is focusing on investing (R&D) to produce better and energy-efficient machinery and equipment. They spend over $2 billion per year in research and development to stay on top of market trends and meet the demands of key customers8. With over 10,000 engineers and 16,000 patents, the company continues to produce high-performance, profitable products. Caterpillar’s strong brand portfolio, which offers products
under 19 brands, has created a sustainable competitive advantage over competitors.
Weaknesses Debt & Solvency:
Caterpillar’s Debt to Equity ratio stood at 2.78 in 2016, while its competitor Atlas Copco had a Debt to Equity ratio of 0.478. Caterpillar’s capital structure is comprised of 31% debt against its competitor Cummins, which has 21% debt. The company’s debt level and solvency position may harm its ability to borrow money and pay affordable interest rates.
2016 Performance and Weak Demand Caterpillar’s results for 2016 are concerning and may indicate operating issues that are not transparent. For 2016, the company’s ROE was -0.5% and ROIC was 2.5%, which are well below their WACC of 6.87%. Operating at this level destroys shareholder value and exposes operating weaknesses that need to be fixed through the current restructuring plan.
Opportunities Increasing Global Construction Output
We believe Caterpillar will benefit from global growth in the construction market by creating improved products and meeting market demands. From 2016 to 2020, the global construction output in advanced economies is expected to increase by 2.5%, and the output in emerging markets is expected to increase by 4.2%8. The Asia-Pacific region is expected to hold the largest share of the global Construction Industry. Caterpillar owns and operates a dealership in Japan that reaches 85% of the Japanese heavy machinery market7.
Contracts

10
Valuation Analysis
In February 2017, Caterpillar agreed to partner with Continental provide tires for Off-highway trucks. In June 2016, they partnered with M2 Industries, LLC to rebuild landfill compactor wheels. In August 2017, Caterpillar won a $663 million contract with the U.S. Department of Defense for commercial construction equipment. This contract is for five years and is expected to end August 28, 202213.
Global Demand for Energy The global energy requirement is expected to increase by 30% from 2017 to 204014. $44 trillion is the expected amount required for global energy supply in addition to $23 trillion for energy efficiency improvements8. We believe these demands for energy across the world will lead to an increase in demand for Caterpillar products related to resources and mining markets.
Threats Labor Costs:
The increase in minimum wages and high levels of employment in the United States are increasing labor costs. The minimum wage in the U.S. has increased to $8.25 per hour, and some states plan to raise their minimum wage to as high as $15 per hour by 20208.
Regulations Since Caterpillar works with governments, they must comply with federal, state, and local regulations. The U.S. government has implemented a plan to reduce emissions by 30% by 2025 and safety standards may complicate the production process for machinery companies8. Failing to comply with regulations can result in penalties and lawsuits, which can be costly and time-intensive.
Catalysts for Growth We believe Caterpillar will capitalize on global population growth, which is expected to grow 12% by 2030, as well as urbanization rates, which are expected to grow 66% by 2050.This will increase global demand for infrastructure and construction, as well as demand
for energy. The global energy requirement is expected to increase by 30% to 2040, global construction output is projected to increase 6.7% by 20208, and Caterpillar has recently entered into several contracts that will grow revenue substantially over the next five years. Commodity prices have rebounded and are forecast to continue rising, which will increase sales for Caterpillar. Since the beginning of 2017, oil prices rose 26.79%, natural gas increased 11.24%, and copper increased 33.5%1. Rising commodity prices coupled with the increasing global energy requirement will stimulate demand from customers in their Resource Industries and Energy & Transportation segments. In 2015, Caterpillar announced significant restructuring plans that would extend to 2018, and implementing these plans has reduced short-term profits. These restructuring strategies will benefit Caterpillar in the long run and shift the company’s focus towards profitable long-term growth rather than short-term sales. We believe restructuring will reduce operating costs, increase efficiency, eliminate unnecessary jobs, ensure that the order-to-delivery process is aligned with customer demands, and reduce waste. Management expects to lower operating costs by $1.5 billion annually once restructuring plans are fully implemented7. Valuation Summary We arrived at a BUY rating for Caterpillar using a variety of valuation techniques, and concluded that Caterpillar’s intrinsic stock price is $174.53. This value was derived from our discounted cash flow and economic profit models, and our target price is 27% above the current market price of $137.29. Our valuation model forecasted future cash flows for 6 years, using the year 2022 as the CV year. We chose this time horizon to allow time for Caterpillar to realize the full benefits of restructuring and recent strong economic growth. We used the DCF and EP methods to select our target price due to the unpredictable nature of dividend payments and the inaccuracy of relative valuation. Our chosen methods have allowed us to

11
break down Caterpillar’s revenue sources, capital structure and WACC, and project out future discounted free cash flows. Forecasting Revenue Growth Caterpillar operates in four segments: Construction Industries, Resource Industries, Energy & Transportation, and Financial Products. To provide the most accurate projections and stay consistent with our research and annual reports released by Caterpillar, we forecasted revenues separately for each business segment. Construction Industries Sales in the Construction Industries segment have been down from 2014-2016, but impressive sales results from 3Q 2017 and higher construction spending levels justify our 20% YoY sales growth rate assumption from 2016 to 2017. In 2016, Caterpillar received low demand from end-users, commodity prices hurt sales, and restructuring and pension expenses were unusually high. We forecast sales in this segment to be $18.73 billion for the year 2017. We estimate a 6% YoY sales growth rate for FY2018 after recovering from 2016 and realizing benefits from the slow but steady growth in commodity prices and total construction spending. After 2018, we forecast sales to grow by 4.5% as Caterpillar matures and grows with the overall economy. Resource Industries Sales in the Resource Industries segment have been down from 2014-2016, but impressive sales results from 3Q 2017 and rising commodity prices justify our 30% YoY sales growth rate assumption from 2016-2017. For 3Q 2017, Caterpillar reported $1.87 billion in sales for Resource Industries, a 37% YoY increase7. We expect segment sales to be $7.44 billion for the year 2017. We forecast a 5% growth rate from 2017-2018 after recovering from 2016 and realizing benefits from the slow but steady growth in commodity prices and restructuring. After 2018, we estimate a 1% YoY segment sales growth rate to reflect the volatility in commodity prices and increasing government regulations on coal and emissions. Energy & Transportation
Sales in the Energy & Transportation segment have been down from 2014-2016, but impressive sales results from 3Q 2017, increasing global demand for energy, and population growth justify our 10% YoY sales growth rate assumption from 2016-2017. For 3Q 2017, Caterpillar reported $3.96 billion in sales for Energy & Transportation, a 12% YoY increase7. We expect segment sales to be $15.85 billion for the year 2017. After 2017, we estimate a 4.5% YoY segment sales growth rate to reflect the volatility in commodity prices and company maturity. Therefore, we believe Caterpillar’s long-term growth rate will be similar to that of GDP (adjusted for inflation). Forecasting Cost of Goods Sold We forecasted cost of goods sold (COGS) as an average percentage of sales over the last 4 years. Cost of goods sold have remained steady over the last 4 years and are directly tied to revenues across all business segments. We forecast the percentage of cost of goods sold to be a constant 62.5% into the indefinite future. Research & Development Expenses We forecasted research and development investments as an average percentage of sales over the last 4 years. R&D expenses have remained steady over the last 4 years as Caterpillar continues to research and develop high-quality, efficient products that meet consumer demands. We forecast research and development expenses to be a constant 5% into the indefinite future. SG&A Expenses We forecasted selling, general, and administrative expenses as an average percentage of sales over the last 4 years. SG&A expenses have remained steady over the last 4 years and are directly tied to revenues across all business segments. Our forecasted SG&A expenses for FY2017 and after are also lower than in past years, and this reflects the expected benefits from Caterpillar’s restructuring process. We forecast selling, general, and administrative expenses to be a constant 9% into the indefinite future. Weighted Average Cost of Capital (WACC) We calculated a WACC of 6.87% using a capital structure comprised of 31% debt and 69% equity. We anticipate that Caterpillar will maintain this capital structure into the foreseeable future. The WACC is

12
calculated using the cost of debt and the cost of equity, which are explained in detail below. Cost of Debt To calculate the cost of debt, we used the current yield of a corporate bond held by Caterpillar with a maturity year of 2044. This yield resulted in a 3.71% pre-tax cost of debt. With a marginal tax rate of 38.25%, we arrived at an after-tax cost of debt of 2.29%. Cost of Equity The cost of equity was calculated using the capital asset pricing model (CAPM). The risk-free rate of 2.80% was derived from the 30-year U.S. Treasury yield. The market risk premium of 4.64% was calculated using the geometric average risk premium from 1928-2016. A beta (raw) of 1.32 was calculated on Bloomberg by taking an average of 2 year, 3 year, and 5 year weekly data. Inputting these values into the CAPM equation, we estimated Caterpillar’s cost of equity to be 8.92%. Valuation Models Discounted Cash Flow and Economic Profit We believe that our discounted cash flow and economic profit models give the most accurate representation of the intrinsic value of Caterpillar stock. These methods take into account the entire operations of the company, include pertinent items not included on the financial statements, and value the company based on the present value of its cash flows. We assumed a terminal growth rate of 4.5%, which reflects current GDP growth plus 1.5-2% of annual inflation. We project NOPLAT to reach $6.15 billion and EP to reach $2.86 billion by the continuing value year of 2022. We project Caterpillar to have stable cash flows over the next 5 years, and the present value of our terminal year free cash flows equals $121.59 billion. Using our assumptions and calculations, we arrived at an intrinsic stock value of $174.53. Dividend Discount Model (DDM) We do not believe the dividend discount model is an accurate representation of the value of Caterpillar’s stock. Although Caterpillar has a high dividend payout ratio of 48.8%, we believe cash flows reflect the true
operating performance of the company. Using the dividend discount model, we arrived at a target price of $130.30. We believe this value is understated compared to our DCF and EP models since the DDM does not represent the entirety of Caterpillar’s operations and financial performance. The dividend discount model is also heavily dependent on future dividend payments, which is subject to management and may change due to restructuring plans and new corporate strategies focused on organic growth and value. Relative Valuation (P/E) We arrived at stock price of $152.82 using relative valuation, which compares Caterpillar’s metrics to its industry peers, such as Deere & Co., CNH Industrial, General Electric, Astec Industries, Boeing, and General Dynamics. Caterpillar’s P/E (2017) ratio of 20.7 falls slightly below the average of industry peers, which is 23. Using our estimated 2017 EPS of $6.64 and the average competitor P/E of 23, we arrived at a stock price of $152.82, which is undervalued compared to our DCF and EP models. We believe the relative valuation model is a rough proxy for the value of Caterpillar, but it is not accurate since it is dependent on other companies’ performance and valuations. Sensitivity Analysis Caterpillar is a mature company operating in a heavy machinery manufacturing industry where there are relatively low margins. Because of this, we conducted a sensitivity analysis to show how small changes in assumptions can impact the intrinsic value of the stock price we computed. Cost of Debt vs. Gross Margin We first tested how small incremental changes in the cost of debt and gross margin assumptions affected the overall stock price we forecasted. The cost of debt had a minimal impact, whereas 0.5% changes in the gross margin that CAT operated at produced significant changes in the intrinsic value of their stock.

13
Cost of Debt vs. Cost of Equity When testing the cost of debt with the cost of equity, the cost of equity turned out to have a much larger impact on the overall stock price. CAT has a much higher equity market value versus debt market value, which in turn leads to the cost of equity taking over as the controlling variable. Small incremental changes in the cost of equity have major impacts on the WACC, which drastically changes the discount factor for future free cash flows.
WACC vs. Tax Rate Testing the sensitivity of the WACC versus the tax rate produced substantial changes in the intrinsic value of CAT’s stock. Should tax policy reform by President Trump go through, our value for Caterpillar would see large increases in price. WACC produces even larger changes in the stock price. Changing the WACC by only 0.2% has a drastic impact on the value of Caterpillar.
SG&A% of Revenue vs. Gross Margin
We chose to look at how the selling, general and administrative expenses and gross margin would affect the intrinsic value of Caterpillar stock. We used a percentage of sales to forecast SG&A. We wanted to see how small changes in SG&A would affect the stock value we calculated because CAT has been focused on cost cutting as of recent through restructuring, especially in corporate SG&A. Out of all the variables tested in our sensitivity analysis, SG&A has one of the largest impacts on the stock price. Due to the significant effect of SG&A expenses on Caterpillar’s stock price, keeping these costs low is crucial to maintain our current valuation.
Cost of Debt174.53$ 3.4% 3.5% 3.6% 3.7% 3.8% 3.9% 4.0%
35.0% 121.77$ 120.20$ 118.64$ 117.04$ 115.61$ 114.13$ 112.68$ 36.0% 145.35$ 143.58$ 141.83$ 140.03$ 138.43$ 136.77$ 135.14$ 37.0% 168.92$ 166.96$ 165.03$ 163.03$ 161.25$ 159.41$ 157.60$ 37.5% 180.71$ 178.65$ 176.62$ 174.53$ 172.66$ 170.73$ 168.83$ 38.0% 192.50$ 190.34$ 188.22$ 186.02$ 184.07$ 182.05$ 180.06$ 39.0% 216.07$ 213.72$ 211.41$ 209.02$ 206.89$ 204.69$ 202.52$ 40.0% 239.64$ 237.10$ 234.60$ 232.01$ 229.71$ 227.33$ 224.98$
Gross Margin
Cost of Debt174.53$ 3.4% 3.5% 3.6% 3.7% 3.8% 3.9% 4.0%
8.6% 206.92$ 204.41$ 201.94$ 199.39$ 197.13$ 194.79$ 192.49$ 8.7% 198.20$ 195.84$ 193.53$ 191.14$ 189.01$ 186.81$ 184.65$ 8.8% 190.02$ 187.80$ 185.62$ 183.37$ 181.37$ 179.30$ 177.26$ 8.9% 180.71$ 178.65$ 176.62$ 174.53$ 172.66$ 170.73$ 168.83$ 9.0% 175.08$ 173.11$ 171.17$ 169.17$ 167.38$ 165.54$ 163.71$ 9.1% 168.24$ 166.38$ 164.54$ 162.65$ 160.96$ 159.21$ 157.49$ 9.2% 161.77$ 160.01$ 158.27$ 156.48$ 154.88$ 153.22$ 151.58$
Cost of Equity
WACC174.53$ 6.2% 6.4% 6.6% 6.8% 7.0% 7.2% 7.4%
29.0% 281.73$ 246.64$ 218.61$ 191.23$ 176.84$ 160.93$ 147.41$ 30.0% 273.78$ 239.53$ 212.18$ 185.47$ 171.43$ 155.93$ 142.75$ 31.0% 265.83$ 232.41$ 205.74$ 179.71$ 166.03$ 150.93$ 138.10$ 31.5% 261.85$ 228.86$ 202.52$ 176.83$ 163.33$ 148.43$ 135.77$ 32.0% 257.88$ 225.30$ 199.31$ 173.94$ 160.63$ 145.93$ 133.44$ 33.0% 249.92$ 218.19$ 192.87$ 168.18$ 155.22$ 140.92$ 128.78$ 34.0% 241.97$ 211.07$ 186.43$ 162.42$ 149.82$ 135.92$ 124.13$
Tax Rate
SGA % of Revenue174.53$ 6.0% 7.0% 8.0% 9.0% 10.0% 11.0% 12.0%
35.0% 186.02$ 163.03$ 140.03$ 117.04$ 94.04$ 71.05$ 48.05$ 36.0% 209.02$ 186.02$ 163.03$ 140.03$ 117.04$ 94.04$ 71.05$ 37.0% 232.01$ 209.02$ 186.02$ 163.03$ 140.03$ 117.04$ 94.04$ 37.5% 243.51$ 220.52$ 197.52$ 174.53$ 151.53$ 128.54$ 105.54$ 38.0% 255.01$ 232.01$ 209.02$ 186.02$ 163.03$ 140.03$ 117.04$ 39.0% 278.00$ 255.01$ 232.01$ 209.02$ 186.02$ 163.03$ 140.03$ 40.0% 301.00$ 278.00$ 255.01$ 232.01$ 209.02$ 186.02$ 163.03$
Gross Margin

14
Sources:
1. “Commodities.” CNNMoney, Cable News Network, money.cnn.com/data/commodities/. 2. “Caterpillar Inc.” Google Finance, Google, finance.google.com/finance?q=NYSE%3ACAT. 3. “Trading Economics.” Trading Economics, tradingeconomics.com/. 4. “Federal Reserve Economic Data | FRED | St. Louis Fed.” FRED, Federal Reserve Bank of St. Louis, fred.stlouisfed.org/. 5. “Analysis & Projections.” Analysis & Projections - U.S. Energy Information Administration (EIA), U.S. Department of Energy, 2017, www.eia.gov/analysis/. 6. “Copper Prices Forecast: Long Term 2017 to 2030.” Knoema.com, Knoema, 2017, knoema.com/prujshc/copper-prices-forecast-long-term-2017-to-2030-data-and-charts. 7. “Investor Information.” Caterpillar, www.caterpillar.com/en/investors.html. 8. GLOBALDATA. Caterpillar Inc (CAT) - Financial and Strategic SWOT Analysis Review. GLOBALDATA, 2017, Caterpillar Inc (CAT) - Financial and Strategic SWOT Analysis Review, www.thomsonone.com/Workspace/Main.aspx?View=Action%3dOpen&BrandName=www.thomsonone.com&IsSsoLogin=True. 9. Sun, Fei, et al. Construction Machinery Market Research. Deutsche Bank, Construction Machinery Market Research, amr.thomsonone.com/Download.ashx. 10. “Commodity Markets Outlook.” World Bank, World Bank, 1 Oct. 2017, pubdocs.worldbank.org/en/743431507927822505/CMO-October-2017-Full-Report.pdf.
11. “Construction Equipment Manufacturers Worldwide: Market Share 2016 | Statistic.”Statista, Statista, www.statista.com/statistics/258589/leading-construction-equipment-manufacturers-based-on-market-share/. 12. “Oil, Gas, and Minning Machinery Manufacturing.” IBISWorld, IBIS, Feb. 2017. 13. Luciano, Phil. “Caterpillar Lands $663 Million Pentagon Contract.”Http://Www.pjstar.com/News/20170830/Caterpillar-Lands-663-Million-Pentagon-Contract, Journal Star, 2017, www.pjstar.com/news/20170830/caterpillar-lands-663-million-pentagon-contract. 14. World Energy Outlook. OECD/IEA, 2017, www.iea.org/weo/. 15. “Global Mining Equipment Demand in 2007 to 2017.” Statista, www.statista.com/statistics/539468/global-mining-equipment-demand-by-region/. 16. “Operating and Financial Review.” Hitachi, Hitachi, Ltd., 1 Apr. 2017, www.hitachi.com/IR-e/library/integrated/2017/ar2017e_26.pdf. 17. “Komatsu Annual Report.” Komatsu, Komatsu, Feb. 2017, home.komatsu/en/ir/annual/html/2017/. 18. World Mining Equipment Freedonia- Industry Market Research, Market Share, Market Size, Sales, Demand Forecast, Market Leaders, Company Profiles, Industry Trends and Companies including Caterpillar, Komatsu, and Sandvik 19. “Investor Information.” National Oilwell Varco Inc, http://investors.nov.com/phoenix.zhtml?c=97690&p=irol-reportsannual

15
Important Disclaimer This report was created by students enrolled in the Security Analysis (6F:112) class at the University of Iowa. The report was originally created to offer an internal investment recommendation for the University of Iowa Krause Fund and its advisory board. The report also provides potential employers and other interested parties an example of the students’ skills, knowledge and abilities. Members of the Krause Fund are not registered investment advisors, brokers or officially licensed financial professionals. The investment advice contained in this report does not represent an offer or solicitation to buy or sell any of the securities mentioned. Unless otherwise noted, facts and figures included in this report are from publicly available sources. This report is not a complete compilation of data, and its accuracy is not guaranteed. From time to time, the University of Iowa, its faculty, staff, students, or the Krause Fund may hold a financial interest in the companies mentioned in this report.

Caterpillar Inc.Key Assumptions of Valuation Model
Ticker Symbol CATCurrent Share Price $137.29Current Model Date 11/8/2017FY End (month/day) Dec. 31Shares Outstanding 594,930,000
Pretax Cost of Debt 3.71%Beta 1.32Risk-Free Rate 2.80%Equity Risk Premium 4.64%Cost of Equity 8.92%WACC 6.85%CV Growth of NOPLAT 4.50%Marginal Tax Rate 31.50%Effective Tax Rate 36.40%CV ROIC 12.83%DCF Price 164.90$ EP Price 164.90$ Gross Margin 37.50%
Adjusted Price (November 8, 2017) 174.53$

Caterpillar Inc.Revenue Decomposition
Fiscal Years Ending Dec. 31 2014 2015 2016 2017E 2018E 2019E 2020E 2021E 2022EConstruction IndustrySales 20,590 17,797 15,612 18,734 19,858 20,752 21,686 22,662 23,682 Y/Y Growth 11.63% -13.56% -12.28% 20.00% 6.00% 4.50% 4.50% 4.50% 4.50%Resource IndustriesSales 9,134 7,739 5,726 7,444 7,816 7,894 7,973 8,053 8,133 Y/Y Growth -31.17% -15.27% -26.01% 30.00% 5.00% 1.00% 1.00% 1.00% 1.00%Energy & TransportationSales 22306 18519 14411 15,852 16,565 17,311 18,090 18,904 19,755 Y/Y Growth 10.67% -16.98% -22.18% 10.00% 4.50% 4.50% 4.50% 4.50% 4.50%All Other SegmentsSales 112 92 24 25 26 28 29 31 32 Y/Y Growth -86.41% -17.86% -73.91% 5.00% 5.00% 5.00% 5.00% 5.00% 5.00%Financial ProductsSales 3,042 2,864 2,764 2,819 2,876 2,933 2,992 3,052 3,113 Y/Y Growth 2.70% -5.85% -3.49% 2.00% 2.00% 2.00% 2.00% 2.00% 2.00%
Total Revenue 55,184 47,011 38,537 44,875 47,142 48,918 50,770 52,701 54,714 Y/Y Growth -0.85% -14.81% -18.03% 16.45% 5.05% 3.77% 3.79% 3.80% 3.82%

Caterpillar Inc.Income Statement (in millions)
Fiscal Years Ending Dec. 31 2013 2014 2015 2016 2017E 2018E 2019E 2020E 2021E 2022ESales and Revenues:Sales of machinery & energy & transportation 52,694 52,142 44,147 35,773 42,056 44,266 45,985 47,778 49,649 51,602 Revenues of financial products 2,962 3,042 2,864 2,764 2,819 2,876 2,933 2,992 3,052 3,113 Total sales & revenues 55,656 55,184 47,011 38,537 44,875 47,142 48,918 50,770 52,701 54,714
Operating Costs:Cost of goods sold 38,785 38,795 31,677 26,443 28,047 29,464 30,574 31,731 32,938 34,197 Depreciation 2,710 2,795 2,705 2,707 2,578 2,522 2,494 2,486 2,495 2,518 Amortization 371 365 337 327 313 308 303 292 275 275 Selling, general & administrative expenses 5,547 6,529 4,951 4,686 4,039 4,243 4,403 4,569 4,743 4,924 Research & development expenses 2,046 2,380 2,119 1,951 2,244 2,357 2,446 2,538 2,635 2,736 Interest expense of financial products 727 624 587 596 795 764 784 800 816 833 Goodwill impairment charge - - - 595 - - - - - - Other operating expenses (Income) (74) 448 915 808 692 727 755 783 813 844 Interest Income (Expense) 84 66 65 74 74 74 74 74 74 74 Total operating costs 50,028 51,870 43,226 38,039 38,707 40,385 41,758 43,200 44,715 46,327
Operating profit 5,628 3,314 3,785 498 6,168 6,758 7,160 7,570 7,986 8,388
Interest expense excluding financial products 465 484 507 505 647 657 674 687 703 720 Other income (expense) (35) 322 161 146 146 146 146 146 146 146
Consolidated profit (loss) before taxes 5,128 3,152 3,439 139 5,666 6,247 6,632 7,029 7,429 7,814
Provision (credit) for income taxes 1,319 692 916 192 1,785 1,968 2,089 2,214 2,340 2,461 Profit (loss) of consolidated companies 3,809 2,460 2,523 (53) 3,881 4,279 4,543 4,815 5,089 5,352
Equity in profit (loss) of unconsol affiliated companies (6) 8 - (6) 0 0 0 0 0 0
Profit (loss) of consolidated & affiliated companies 3,803 2,468 2,523 (59) 3,881 4,279 4,543 4,815 5,089 5,352
Less: profit (loss) attributable to noncontrolling interests 14 16 11 8 0 0 0 0 0 0
Profit (loss) 3,789 2,452 2,512 (67) 3,881 4,279 4,543 4,815 5,089 5,352
Basic EPS 5.87$ 3.97$ 4.23$ (0.11)$ 6.64 7.40 7.93 8.49 9.07 9.63
Dividend/Share 2.32$ 2.70$ 3.01$ 3.08$ 3.22$ 3.36$ 3.51$ 3.67$ 3.84$ 4.01$
Total Shares Outstanding:Basic 645.2 617.2 594.3 584.3 584.3 578.5 572.7 566.9 561.3 555.7
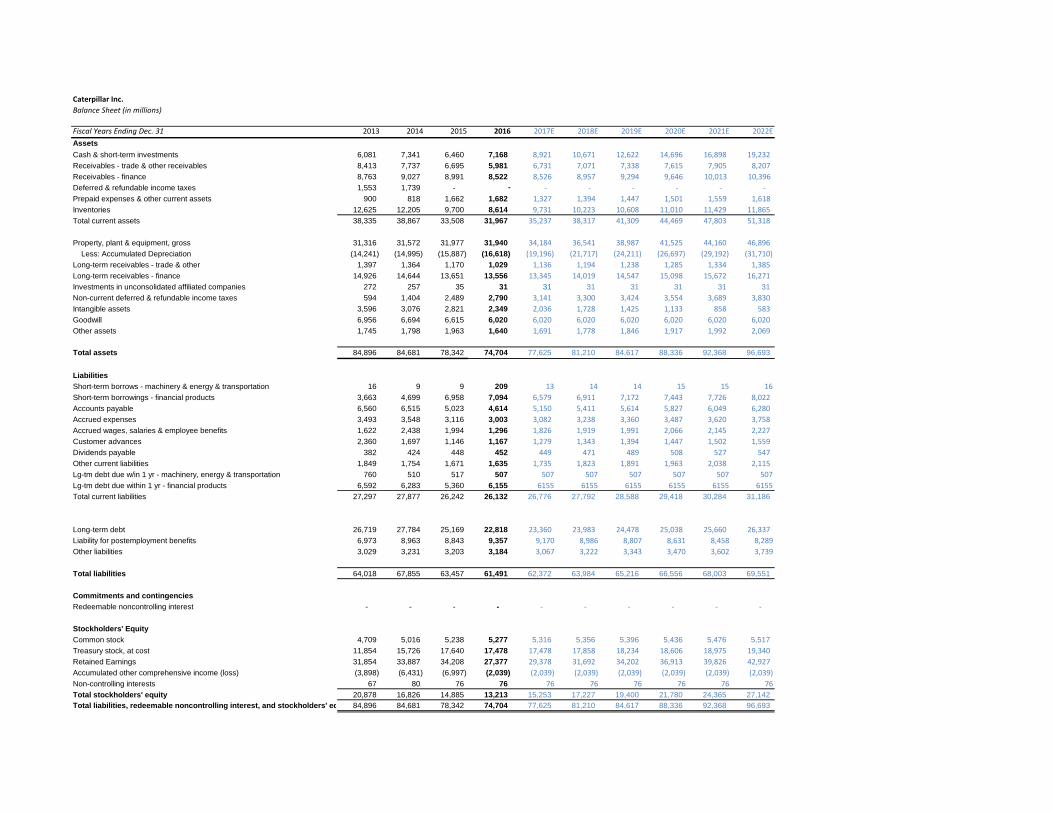
Caterpillar Inc.Balance Sheet (in millions)
Fiscal Years Ending Dec. 31 2013 2014 2015 2016 2017E 2018E 2019E 2020E 2021E 2022EAssets Cash & short-term investments 6,081 7,341 6,460 7,168 8,921 10,671 12,622 14,696 16,898 19,232 Receivables - trade & other receivables 8,413 7,737 6,695 5,981 6,731 7,071 7,338 7,615 7,905 8,207 Receivables - finance 8,763 9,027 8,991 8,522 8,526 8,957 9,294 9,646 10,013 10,396 Deferred & refundable income taxes 1,553 1,739 - - - - - - - - Prepaid expenses & other current assets 900 818 1,662 1,682 1,327 1,394 1,447 1,501 1,559 1,618 Inventories 12,625 12,205 9,700 8,614 9,731 10,223 10,608 11,010 11,429 11,865 Total current assets 38,335 38,867 33,508 31,967 35,237 38,317 41,309 44,469 47,803 51,318
Property, plant & equipment, gross 31,316 31,572 31,977 31,940 34,184 36,541 38,987 41,525 44,160 46,896 Less: Accumulated Depreciation (14,241) (14,995) (15,887) (16,618) (19,196) (21,717) (24,211) (26,697) (29,192) (31,710) Long-term receivables - trade & other 1,397 1,364 1,170 1,029 1,136 1,194 1,238 1,285 1,334 1,385 Long-term receivables - finance 14,926 14,644 13,651 13,556 13,345 14,019 14,547 15,098 15,672 16,271 Investments in unconsolidated affiliated companies 272 257 35 31 31 31 31 31 31 31 Non-current deferred & refundable income taxes 594 1,404 2,489 2,790 3,141 3,300 3,424 3,554 3,689 3,830 Intangible assets 3,596 3,076 2,821 2,349 2,036 1,728 1,425 1,133 858 583 Goodwill 6,956 6,694 6,615 6,020 6,020 6,020 6,020 6,020 6,020 6,020 Other assets 1,745 1,798 1,963 1,640 1,691 1,778 1,846 1,917 1,992 2,069
Total assets 84,896 84,681 78,342 74,704 77,625 81,210 84,617 88,336 92,368 96,693
Liabilities Short-term borrows - machinery & energy & transportation 16 9 9 209 13 14 14 15 15 16Short-term borrowings - financial products 3,663 4,699 6,958 7,094 6,579 6,911 7,172 7,443 7,726 8,022 Accounts payable 6,560 6,515 5,023 4,614 5,150 5,411 5,614 5,827 6,049 6,280 Accrued expenses 3,493 3,548 3,116 3,003 3,082 3,238 3,360 3,487 3,620 3,758 Accrued wages, salaries & employee benefits 1,622 2,438 1,994 1,296 1,826 1,919 1,991 2,066 2,145 2,227 Customer advances 2,360 1,697 1,146 1,167 1,279 1,343 1,394 1,447 1,502 1,559 Dividends payable 382 424 448 452 449 471 489 508 527 547 Other current liabilities 1,849 1,754 1,671 1,635 1,735 1,823 1,891 1,963 2,038 2,115 Lg-tm debt due w/in 1 yr - machinery, energy & transportation 760 510 517 507 507 507 507 507 507 507Lg-tm debt due within 1 yr - financial products 6,592 6,283 5,360 6,155 6155 6155 6155 6155 6155 6155Total current liabilities 27,297 27,877 26,242 26,132 26,776 27,792 28,588 29,418 30,284 31,186
Long-term debt 26,719 27,784 25,169 22,818 23,360 23,983 24,478 25,038 25,660 26,337 Liability for postemployment benefits 6,973 8,963 8,843 9,357 9,170 8,986 8,807 8,631 8,458 8,289 Other liabilities 3,029 3,231 3,203 3,184 3,067 3,222 3,343 3,470 3,602 3,739
Total liabilities 64,018 67,855 63,457 61,491 62,372 63,984 65,216 66,556 68,003 69,551
Commitments and contingenciesRedeemable noncontrolling interest - - - - - - - - - -
Stockholders' EquityCommon stock 4,709 5,016 5,238 5,277 5,316 5,356 5,396 5,436 5,476 5,517 Treasury stock, at cost 11,854 15,726 17,640 17,478 17,478 17,858 18,234 18,606 18,975 19,340 Retained Earnings 31,854 33,887 34,208 27,377 29,378 31,692 34,202 36,913 39,826 42,927 Accumulated other comprehensive income (loss) (3,898) (6,431) (6,997) (2,039) (2,039) (2,039) (2,039) (2,039) (2,039) (2,039)Non-controlling interests 67 80 76 76 76 76 76 76 76 76 Total stockholders' equity 20,878 16,826 14,885 13,213 15,253 17,227 19,400 21,780 24,365 27,142 Total liabilities, redeemable noncontrolling interest, and stockholders' eq 84,896 84,681 78,342 74,704 77,625 81,210 84,617 88,336 92,368 96,693

Caterpillar Inc.Cash Flow Statement
Fiscal Years Ending Dec. 31 2007 2008 2009 2010 2011 2012 2013 2014 2015 2016Profit (loss) of consolidated & affiliated companies 3,541 3,557 827 2,758 4,981 5,722 3,803 3,711 2,113 (59)Depreciation & amortization 1,797 1,980 2,336 2,296 2,527 2,813 3,087 3,163 3,046 3,034Actuarial loss (gain) on pension & postretirement benefits - - - - - - - - - 985Provision (benefit) for deferred income taxes - - - - - - - - - (431)Goodwill impairment charge - - - - - 580 - - - 595Other adjustments for noncash items 199 383 137 469 457 439 550 549 508 856Financial Products' dividend in excess of profitsReceivables - trade & other 899 (545) 4,014 (2,320) (1,345) (173) 835 163 764 829Inventories (745) (833) 2,501 (2,667) (2,927) (1,149) 2,658 101 2,274 1,109Accounts payable & accrued expenses 618 656 - - - - - - - -Accounts payable - - (1,878) 2,570 1,555 (1,868) 134 222 (1,165) (200)Accrued expenses - - (505) 117 308 183 (108) (10) (199) (201)Accrued wages, salaries & employee benefits - - (534) 847 619 (490) (279) 901 (389) (708)Customer advances 576 286 (646) 604 173 241 (301) (593) (501) (37)Other assets, net 66 (470) 235 358 (91) 252 (49) (300) (220) 224Other liabilities, net 984 (227) 12 (23) 753 (679) (71) 146 444 (388)Net cash flows from operating activities 7,935 4,787 6,499 5,009 7,010 5,241 10,191 8,057 6,675 5,608
Capital Expenditures (3,040) (3,266) (2,668) (2,711) (3,109) (3,426) (3,624) (3,540) (3,573) (3,519)Proc from disposal of property, plant & equip 408 982 1,242 1,469 - - - - - -Proceeds from disposal of leased assets & property, plant & equipment - - - - 1,354 1,117 844 904 760 899Additions to finance receivables (13,946) (14,031) (7,107) (8,498) (10,001) (12,010) (11,422) (11,278) (9,929) (9,339)Collections of finance receivables 10,985 9,717 9,288 8,987 8,874 8,995 9,567 9,841 9,247 9,369Net intercompany purchased receivables - - -Proceeds from sale of finance receivables 866 949 100 16 207 132 220 177 136 127Investments & acquisitions, net of cash acquired (229) (117) (19) (1,126) (8,184) (618) (195) (30) (400) (191)Proceeds from release of security deposit 290 - - - - - - - - -Proceeds from sale of business & investments (net of cash sold) - - - - 376 1,199 365 199 178 -Proceeds from sale of securities 282 357 291 228 247 306 449 810 351 694Investments in securities (485) (339) (349) (217) (336) (402) (402) (825) (485) (391)Other investing activities - net 461 197 (128) 132 (40) 167 (26) (46) (114) -Net cash flows from investing activities (4,408) (5,551) 650 (1,595) (11,427) (6,190) (5,046) (3,788) (3,829) (2,351)
Dividends paid (845) (953) (1,029) (1,084) (1,159) (1,617) (1,111) (1,620) (1,757) (1,799)Distributions to noncontroliing interests - - (10) - (3) (6) (13) (7) (7) (8)Contribution from noncontrolling interests - - - - - - - 4 - -Common stock issued, including treasury shares reissued 328 135 89 296 123 52 128 239 33 (23)Payment for stock repurchase derivative contracts (56) (38)Treasury shares repurchased (2,405) (1,800) - - - - (2,000) (4,238) (2,025) -Excess tax benefit from stock-based compensation 155 56 21 153 189 192 96 182 24 28Acquisitions of noncontrolling interests (6) (132) (8)Net intercompany borrowings - -Proceeds from debt issued - machinery, energy & transportation 224 1,673 458 216 4,587 2,209 195 1,994 3 6Proceeds from debt issued - financial products 10,815 16,257 11,833 8,108 10,873 13,806 9,133 8,655 5,129 5,109Payments on debt - machinery, energy & transportation (598) (296) (918) (1,298) (2,269) (1,107) (1,769) (785) (517) (533)Payments on debt - financial products (10,290) (14,143) (11,769) (11,163) (8,324) (9,992) (9,101) (8,463) (7,775) (6,032)Short-term borrowings, net (297) 2,074 (3,884) 291 (43) 461 (69) 1,043 3,022 140Net cash flows from financing activities (2,969) 2,965 (5,215) (4,613) 3,966 3,549 (4,511) (2,996) (3,870) (3,112)Effect of exchange rate changes on cash 34 158 1 (76) (84) (167) (43) (174) (169) (28)Increase (decrease) in cash & short-term investments 592 2,359 1,935 (1,275) (535) 2,433 591 1,260 (1,193) 117Cash & short-term investments at beginning of period 530 1,122 2,736 4,867 3,592 3,057 5,490 6,081 7,341 6,460Cash & short-term investments at end of period 1,122 3,481 4,671 3,592 3,057 5,490 6,081 7,341 6,148 6,577
Caterpillar Inc.Cash Flow Statement
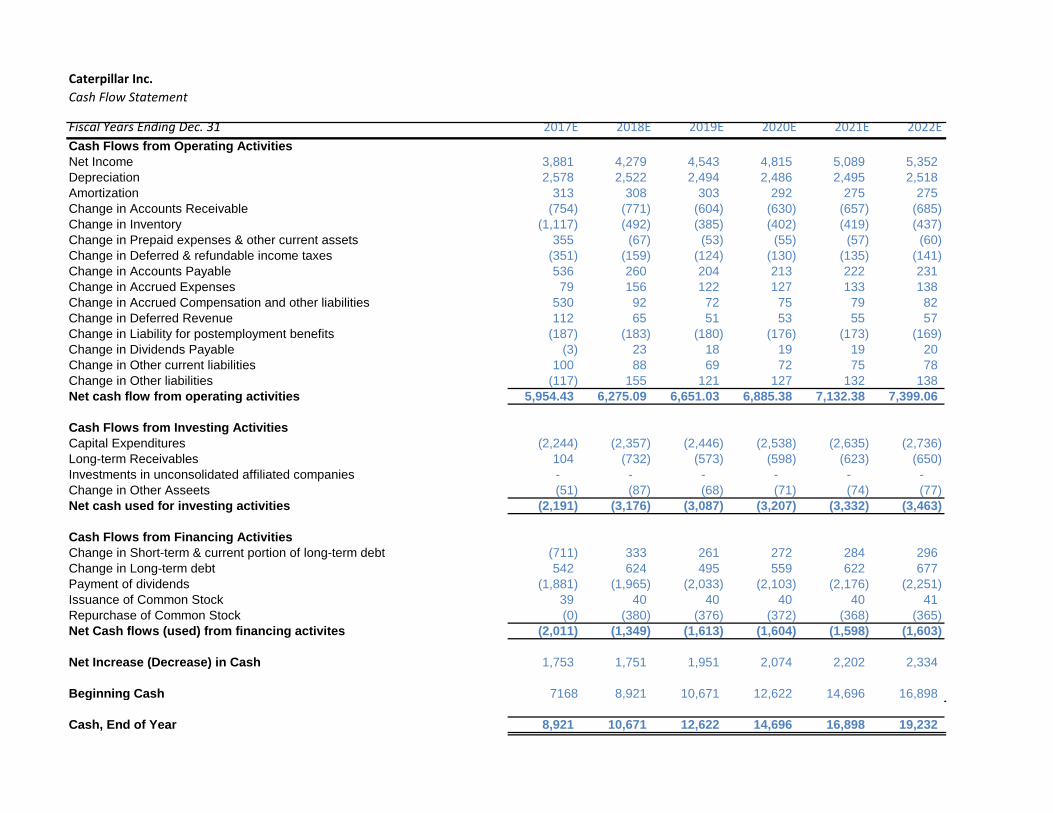
Fiscal Years Ending Dec. 31 2017E 2018E 2019E 2020E 2021E 2022E2Cash Flows from Operating ActivitiesNet Income 3,881 4,279 4,543 4,815 5,089 5,352 Depreciation 2,578 2,522 2,494 2,486 2,495 2,518 Amortization 313 308 303 292 275 275 Change in Accounts Receivable (754) (771) (604) (630) (657) (685) Change in Inventory (1,117) (492) (385) (402) (419) (437) Change in Prepaid expenses & other current assets 355 (67) (53) (55) (57) (60) Change in Deferred & refundable income taxes (351) (159) (124) (130) (135) (141) Change in Accounts Payable 536 260 204 213 222 231 Change in Accrued Expenses 79 156 122 127 133 138 Change in Accrued Compensation and other liabilities 530 92 72 75 79 82 Change in Deferred Revenue 112 65 51 53 55 57 Change in Liability for postemployment benefits (187) (183) (180) (176) (173) (169) Change in Dividends Payable (3) 23 18 19 19 20 Change in Other current liabilities 100 88 69 72 75 78 Change in Other liabilities (117) 155 121 127 132 138 Net cash flow from operating activities 5,954.43 6,275.09 6,651.03 6,885.38 7,132.38 7,399.06
Cash Flows from Investing ActivitiesCapital Expenditures (2,244) (2,357) (2,446) (2,538) (2,635) (2,736) Long-term Receivables 104 (732) (573) (598) (623) (650) Investments in unconsolidated affiliated companies - - - - - - Change in Other Asseets (51) (87) (68) (71) (74) (77) Net cash used for investing activities (2,191) (3,176) (3,087) (3,207) (3,332) (3,463)
Cash Flows from Financing ActivitiesChange in Short-term & current portion of long-term debt (711) 333 261 272 284 296 Change in Long-term debt 542 624 495 559 622 677 Payment of dividends (1,881) (1,965) (2,033) (2,103) (2,176) (2,251) Issuance of Common Stock 39 40 40 40 40 41 Repurchase of Common Stock (0) (380) (376) (372) (368) (365) Net Cash flows (used) from financing activites (2,011) (1,349) (1,613) (1,604) (1,598) (1,603)
Net Increase (Decrease) in Cash 1,753 1,751 1,951 2,074 2,202 2,334
Beginning Cash 7168 8,921 10,671 12,622 14,696 16,898
Cash, End of Year 8,921 10,671 12,622 14,696 16,898 19,232

Caterpillar Inc.Common Size Income Statement
Fiscal Years Ending Dec. 31 2013 2014 2015 2016 2017E 2018E 2019E 2020E 2021E 2022ESales and Revenues:Sales of machinery & energy & transportation 94.68% 94.49% 93.91% 92.83% 93.72% 93.90% 94.00% 94.11% 94.21% 94.31%Revenues of financial products 5.32% 5.51% 6.09% 7.17% 6.28% 6.10% 6.00% 5.89% 5.79% 5.69%Total sales & revenues 100.00% 100.00% 100.00% 100.00% 100.00% 100.00% 100.00% 100.00% 100.00% 100.00%
Operating Costs:Cost of goods sold 67.38% 68.62% 62.50% 62.50% 62.50% 62.50% 62.50% 62.50% 62.50% 62.50%Selling, general & administrative expenses 9.97% 11.83% 10.53% 12.16% 9.00% 9.00% 9.00% 9.00% 9.00% 9.00%Research & development expenses 3.68% 4.31% 4.51% 5.06% 5.00% 5.00% 5.00% 5.00% 5.00% 5.00%Interest expense of financial products 1.31% 1.13% 1.25% 1.55% 1.77% 1.62% 1.60% 1.57% 1.55% 1.52%Goodwill impairment charge 0.00% 0.00% 0.00% 1.54% 0.00% 0.00% 0.00% 0.00% 0.00% 0.00%Other operating expenses (income) -0.13% 0.81% 1.95% 2.10% 1.54% 1.54% 1.54% 1.54% 1.54% 1.54%Total operating costs 89.89% 93.99% 91.95% 98.71% 86.26% 85.67% 85.36% 85.09% 84.85% 84.67%
Operating profit 10.11% 6.01% 8.05% 1.29% 13.74% 14.33% 14.64% 14.91% 15.15% 15.33%
Interest expense excluding financial products 0.84% 0.88% 1.08% 1.31% 1.44% 1.39% 1.38% 1.35% 1.33% 1.32%Other income (expense) -0.06% 0.58% 0.34% 0.38% 0.33% 0.31% 0.30% 0.29% 0.28% 0.27%
Consolidated profit (loss) before taxes 9.21% 5.71% 7.32% 0.36% 12.63% 13.25% 13.56% 13.84% 14.10% 14.28%
Provision (credit) for income taxes 2.37% 1.25% 1.95% 0.50% 3.98% 4.17% 4.27% 4.36% 4.44% 4.50%Profit (loss) of consolidated companies 6.84% 4.46% 5.37% -0.14% 8.65% 9.08% 9.29% 9.48% 9.66% 9.78%
Equity in profit (loss) of unconsol affiliated companies -0.01% 0.01% 0.00% -0.02% 0.00% 0.00% 0.00% 0.00% 0.00% 0.00%
Profit (loss) of consolidated & affiliated companies 6.83% 4.47% 5.37% -0.15% 8.65% 9.08% 9.29% 9.48% 9.66% 9.78%
Less: profit (loss) attributable to noncontrolling interests 0.03% 0.03% 0.02% 0.02% 0.00% 0.00% 0.00% 0.00% 0.00% 0.00%
Profit (loss) 6.81% 4.44% 5.34% -0.17% 8.65% 9.08% 9.29% 9.48% 9.66% 9.78%

Caterpillar Inc.Common Size Balance Sheet
Fiscal Years Ending Dec. 31 2013 2014 2015 2016 2017E 2018E 2019E 2020E 2021E 2022E 2023E 2024E 2024E 2025EAssets Cash & short-term investments 10.93% 13.30% 13.74% 18.60% 19.88% 22.64% 25.80% 28.95% 32.06% 35.15% 41.31% 47.06% 52.61% 55.32%Receivables - trade & other receivables 15.12% 14.02% 14.24% 15.52% 15.00% 15.00% 15.00% 15.00% 15.00% 15.00% 15.00% 15.00% 15.00% 15.00%Receivables - finance 15.74% 16.36% 19.13% 22.11% 19.00% 19.00% 19.00% 19.00% 19.00% 19.00% 19.00% 19.00% 19.00% 19.00%Deferred & refundable income taxes 2.79% 3.15% 0.00% 0.00% 7.00% 7.00% 7.00% 7.00% 7.00% 7.00% 7.00% 7.00% 7.00% 7.00%Prepaid expenses & other current assets 1.62% 1.48% 3.54% 4.36% 2.96% 2.96% 2.96% 2.96% 2.96% 2.96% 2.96% 2.96% 2.96% 2.96%Inventories 22.68% 22.12% 20.63% 22.35% 21.69% 21.69% 21.69% 21.69% 21.69% 21.69% 21.69% 21.69% 21.69% 21.69%Total current assets 68.88% 70.43% 71.28% 82.95% 78.52% 81.28% 84.45% 87.59% 90.71% 93.79% 99.96% 105.71% 111.26% 113.96%
Property, plant & equipment, net 30.68% 30.04% 34.23% 39.76% 33.40% 31.44% 30.20% 29.21% 28.40% 27.75% 24.61% 22.08% 19.80% 21.80%Long-term receivables - trade & other 2.51% 2.47% 2.49% 2.67% 2.53% 2.53% 2.53% 2.53% 2.53% 2.53% 2.53% 2.53% 2.53% 2.53%Long-term receivables - finance 26.82% 26.54% 29.04% 35.18% 29.74% 29.74% 29.74% 29.74% 29.74% 29.74% 29.74% 29.74% 29.74% 29.74%Investments in unconsolidated affiliated companies 0.49% 0.47% 0.00% 0.00% 0.07% 0.07% 0.06% 0.06% 0.06% 0.06% 0.05% 0.05% 0.05% 0.05%Non-current deferred & refundable income taxes 1.07% 2.54% 5.29% 7.24% 7.00% 7.00% 7.00% 7.00% 7.00% 7.00% 7.00% 7.00% 7.00% 7.00%Intangible assets 6.46% 5.57% 6.00% 6.10% 4.54% 3.67% 2.91% 2.23% 1.63% 1.07% 0.54% 0.06% -0.39% -0.81%Goodwill 12.50% 12.13% 14.07% 15.62% 13.42% 12.77% 12.31% 11.86% 11.42% 11.00% 10.60% 10.20% 9.82% 9.45%Other assets 3.14% 3.26% 4.25% 4.34% 3.77% 3.77% 3.77% 3.78% 3.78% 3.78% 3.78% 3.79% 3.79% 3.79%
Total assets 152.54% 153.45% 166.65% 193.85% 172.98% 172.27% 172.98% 173.99% 175.27% 176.72% 178.81% 181.15% 183.60% 187.51%
Liabilities Short-term borrows - machinery & energy & transportation 0.03% 0.02% 0.02% 0.54% 0.03% 0.03% 0.03% 0.03% 0.03% 0.03% 0.03% 0.03% 0.03% 0.03%Short-term borrowings - financial products 6.58% 8.52% 14.80% 18.41% 14.66% 14.66% 14.66% 14.66% 14.66% 14.66% 14.66% 14.66% 14.66% 14.66%Accounts payable 11.79% 11.81% 10.68% 11.97% 11.48% 11.48% 11.48% 11.48% 11.48% 11.48% 11.48% 11.48% 11.48% 11.48%Accrued expenses 6.28% 6.43% 6.63% 7.79% 6.87% 6.87% 6.87% 6.87% 6.87% 6.87% 6.87% 6.87% 6.87% 6.87%Accrued wages, salaries & employee benefits 2.91% 4.42% 4.24% 3.36% 4.07% 4.07% 4.07% 4.07% 4.07% 4.07% 4.07% 4.07% 4.07% 4.07%Customer advances 4.24% 3.08% 2.44% 3.03% 2.85% 2.85% 2.85% 2.85% 2.85% 2.85% 2.85% 2.85% 2.85% 2.85%Dividends payable 0.69% 0.77% 0.95% 1.17% 1.00% 1.00% 1.00% 1.00% 1.00% 1.00% 1.00% 1.00% 1.00% 1.00%Other current liabilities 3.32% 3.18% 3.55% 4.24% 3.87% 3.87% 3.87% 3.87% 3.87% 3.87% 3.87% 3.87% 3.87% 3.87%Lg-tm debt due w/in 1 yr - machinery, energy & transportation 1.37% 0.92% 1.10% 1.32% 1.13% 1.08% 1.04% 1.00% 0.96% 0.93% 0.89% 0.86% 0.83% 0.80%Lg-tm debt due within 1 yr - financial products 11.84% 11.39% 11.40% 15.97% 13.72% 13.06% 12.58% 12.12% 11.68% 11.25% 10.83% 10.43% 10.04% 9.67%Total current liabilities 49.05% 50.52% 55.82% 67.81% 59.67% 58.95% 58.44% 57.94% 57.46% 57.00% 56.55% 56.11% 55.69% 55.29%
Long-term debt 48.01% 50.35% 53.54% 59.21% 52.05% 50.87% 50.04% 49.32% 48.69% 48.14% 46.75% 45.59% 44.53% 44.95%Liability for postemployment benefits 12.53% 16.24% 18.81% 24.28% 20.43% 19.06% 18.00% 17.00% 16.05% 15.15% 14.30% 13.49% 12.73% 12.01%Other liabilities 5.44% 5.85% 6.81% 8.26% 6.83% 6.83% 6.83% 6.83% 6.83% 6.83% 6.83% 6.83% 6.83% 6.83%
Total liabilities 115.02% 122.96% 134.98% 159.56% 138.99% 135.73% 133.32% 131.09% 129.04% 127.12% 124.43% 122.03% 119.79% 119.07%
Stockholders' EquityCommon stock 8.46% 9.09% 11.14% 13.69% 11.85% 11.36% 11.03% 10.71% 10.39% 10.08% 9.78% 9.49% 9.20% 8.93%Treasury stock, at cost 21.30% 28.50% 37.52% 45.35% 38.95% 37.88% 37.27% 36.65% 36.00% 35.35% 34.68% 33.99% 33.31% 32.61%Profit employed in the business 57.23% 61.41% 72.77% 71.04% 65.47% 67.23% 69.92% 72.71% 75.57% 78.46% 82.73% 86.95% 91.11% 95.20%Accumulated other comprehensive income (loss) -7.00% -11.65% -14.88% -5.29% -4.54% -4.33% -4.17% -4.02% -3.87% -3.73% -3.59% -3.46% -3.33% -3.20%Non-controlling interests 0.12% 0.14% 0.16% 0.20% 0.17% 0.16% 0.16% 0.15% 0.14% 0.14% 0.13% 0.13% 0.12% 0.12%Total stockholders' equity 37.51% 30.49% 31.66% 34.29% 33.99% 36.54% 39.66% 42.90% 46.23% 49.61% 54.38% 59.12% 63.81% 68.44%Total liabilities, redeemable noncontrolling interest, and stoc 152.54% 153.45% 166.65% 193.85% 172.98% 172.27% 172.98% 173.99% 175.27% 176.72% 178.81% 181.15% 183.60% 187.51%
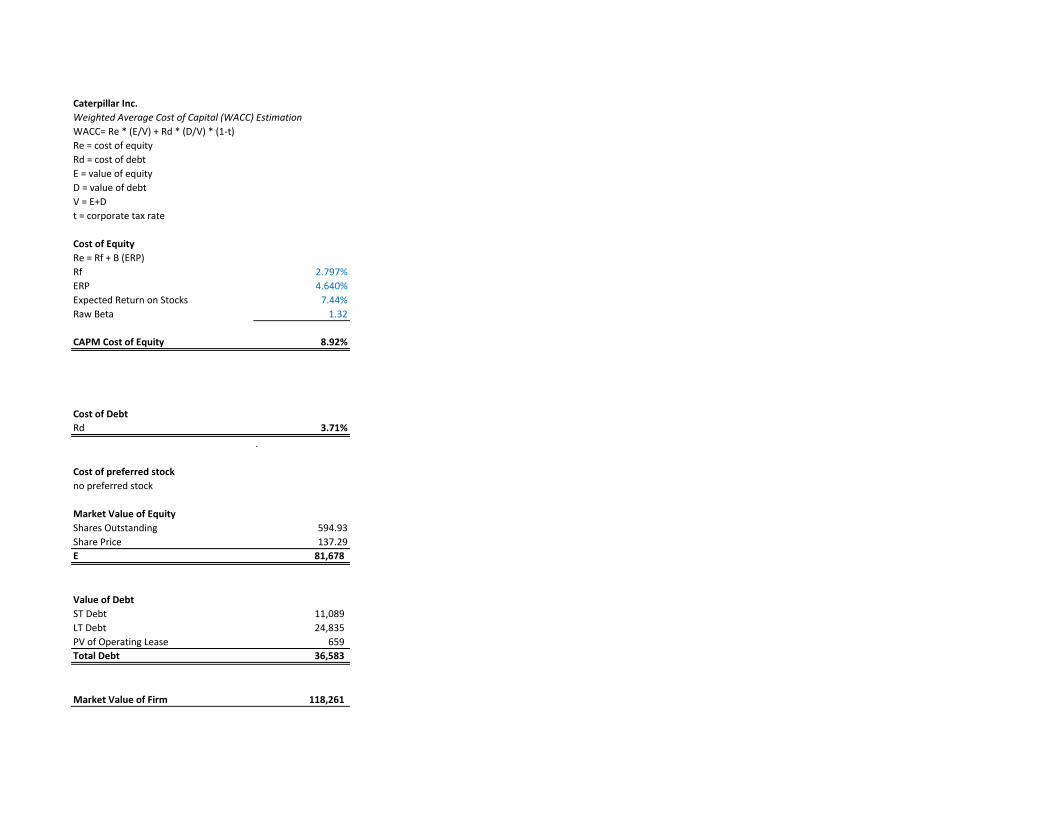
Caterpillar Inc.Weighted Average Cost of Capital (WACC) EstimationWACC= Re * (E/V) + Rd * (D/V) * (1-t)Re = cost of equityRd = cost of debtE = value of equityD = value of debtV = E+Dt = corporate tax rate
Cost of Equity Re = Rf + B (ERP)Rf 2.797%ERP 4.640%Expected Return on Stocks 7.44%Raw Beta 1.32
CAPM Cost of Equity 8.92%
Cost of DebtRd 3.71%
.
Cost of preferred stockno preferred stock
Market Value of EquityShares Outstanding 594.93Share Price 137.29E 81,678
Value of DebtST Debt 11,089 LT Debt 24,835 PV of Operating Lease 659 Total Debt 36,583
Market Value of Firm 118,261

Caterpillar Inc. AssumptionsMarginal Tax Rate 38.25% (Note 12)Value Driver Estimation WACC 6.87% (PLUG)
Normal Cash (% of Sales) 2.00% (PLUG)Cost of Debt 3.71% (PLUG)
Fiscal Years Ending Dec. 31 2013 2014 2015 2016 2017E 2018E 2019E 2020E 2021E 2022E 2023E 2024E 2024E 2025E
EBITA:Operating Revenues 55,656 55,184 47,011 38,537 44,875 47,142 48,918 50,770 52,701 54,714 56,814 59,004 61,288 63,670 COGS 38,785 38,795 31,677 26,443 28,047 29,464 30,574 31,731 32,938 34,197 35,509 36,878 38,305 39,794 SG&A 5,547 6,529 4,951 4,686 4,039 4,243 4,403 4,569 4,743 4,924 5,113 5,310 5,516 5,730 R&D Expense 2,046 2,380 2,119 1,951 2,244 2,357 2,446 2,538 2,635 2,736 2,841 2,950 3,064 3,184 Other Operating Expenses (74) 448 915 808 692 727 755 783 813 844 876 910 945 982 Depreciation and Amortization 3,081 3,160 3,042 3,034 2,891 2,830 2,797 2,778 2,770 2,793 1,682 1,688 1,702 1,718 Implied Interest on Operating Leases 47 47 43 46 40 39 39 39 39 40 37 34 - - EBITA 6,224 3,825 4,264 1,569 6,923 7,482 7,905 8,331 8,763 9,180 10,756 11,233 11,756 12,263
Less: Adjusted Taxes:Provision for Income Taxes 1,319 692 916 192 1,785 1,968 2,089 2,214 2,340 2,461 2,945 3,087 3,232 3,382 + Tax Shield on Implied Lease Interest 15 15 14 14 12 12 12 12 12 13 12 11 - - + Tax Shield on Interest Expense of Financial Products 229 197 185 188 250 241 247 252 257 262 268 274 280 286 + Tax Shield on Goodwill Impairment - - - 228 - - - - - - - - - - + Tax Shield on Interest Expense listed under Operating - - - - - (23) (23) (23) (23) (23) (23) (23) (23) (23) - Tax on Interest Income listed under Operating (26) (21) (20) (23) (23) - - - - - - - - - + Tax Shield on Interest Expense Excluding Financial Products 146 152 160 159 204 207 212 217 221 227 233 235 238 241 + Tax Shield on Other Expense 13 - - - - - - - - - - - - - - Tax on Other Other Income - (123) (62) (56) (56) (56) (56) (56) (56) (56) (56) (56) (56) (56) Adjusted Taxes 1,696 912 1,192 702 2,172 2,348 2,482 2,616 2,752 2,884 3,378 3,527 3,670 3,830
Plus: Change in Net Deferred Tax (DT) LiabilitesDTL t - DTA t 2,147 3,143 2,489 2,790 (3,141) (3,300) (3,424) (3,554) (3,689) (3,830) (3,977) (4,130) (4,290) (4,457) - DTL t-1 - DTA t-1 3,558 2,147 3,143 2,489 (2,790) (3,141) (3,300) (3,424) (3,554) (3,689) (3,830) (3,977) (4,130) (4,290) Change in Deferred Taxes (1,411) 996 (654) 301 (351) (159) (124) (130) (135) (141) (147) (153) (160) (167)
NOPLAT 3,116 3,909 2,417 1,168 4,399 4,975 5,299 5,586 5,875 6,156 7,231 7,553 7,926 8,266
Invested Capital Computation
Operating Current Assets:Normal Cash (lesser of actual or %) 1,113 1,104 940 771 897 943 978 1,015 1,054 1,094 1,136 1,180 1,226 1,273 Receivables- trade & other receivables 8,413 7,737 6,695 5,981 6,731 7,071 7,338 7,615 7,905 8,207 8,522 8,851 9,193 9,551 Receivables- finance 8,763 9,027 8,991 8,522 8,526 8,957 9,294 9,646 10,013 10,396 10,795 11,211 11,645 12,097 Inventory 12,625 12,205 9,700 8,614 9,731 10,223 10,608 11,010 11,429 11,865 12,321 12,796 13,291 13,808 PPD Expenses 900 818 1,662 1,682 1,327 1,394 1,447 1,501 1,559 1,618 1,680 1,745 1,813 1,883
Operating Current Assets 30,701 29,787 27,048 24,799 27,214 28,588 29,666 30,789 31,960 33,181 34,454 35,782 37,167 38,612
Operating Current Liabilities:Accounts Payable 6,560 6,515 5,023 4,614 5,150 5,411 5,614 5,827 6,049 6,280 6,521 6,772 7,034 7,308 Accrued Expenses 3,493 3,548 3,116 3,003 3,082 3,238 3,360 3,487 3,620 3,758 3,903 4,053 4,210 4,374 Accrued wages, salaries & employee benefits 1,622 2,438 1,994 1,296 1,826 1,919 1,991 2,066 2,145 2,227 2,312 2,402 2,495 2,591 Dividends Payable 382 424 448 452 449 471 489 508 527 547 568 590 613 637 Customer Advances 2,360 1,697 1,146 1,167 1,279 1,343 1,394 1,447 1,502 1,559 1,619 1,681 1,746 1,814 Other Current Liabilities 1,849 1,754 1,671 1,635 1,735 1,823 1,891 1,963 2,038 2,115 2,197 2,281 2,370 2,462
Operating Current Liabilities 16,266 16,376 13,398 12,167 13,522 14,205 14,740 15,298 15,880 16,487 17,119 17,779 18,467 19,185
Net Operating Working Capital 14,435 13,411 13,650 12,632 13,692 14,384 14,925 15,491 16,080 16,694 17,335 18,003 18,700 19,427
Plus: Net PPE 17,075 16,577 16,090 15,322 14,988 14,823 14,775 14,828 14,968 15,186 13,983 13,026 12,138 13,879
Plus: PV of Operating Leases 788 788 723 765 659 651 649 652 658 667 614 572 - -
Other Long-term Operating AssetsOther Assets 1,745 1,798 1,963 1,640 1,691 1,778 1,846 1,917 1,992 2,069 2,149 2,233 2,321 2,413 Long-term trade & other receivables 1,397 1,364 1,170 1,029 1,136 1,194 1,238 1,285 1,334 1,385 1,438 1,494 1,552 1,612 Long-term receivables - finance 14,926 14,644 13,651 13,556 13,345 14,019 14,547 15,098 15,672 16,271 16,895 17,547 18,226 18,934 Intangible Assets, net 3,596 3,076 2,821 2,349 2,036 1,728 1,425 1,133 858 583 308 33 (242) (517) Plus: Total Other Long-term Opering Assets: 21,664 20,882 19,605 18,574 18,208 18,719 19,057 19,434 19,856 20,308 20,791 21,307 21,857 22,442
Less: Other Operating Liabilities 3,029 3,231 3,203 3,184 3,067 3,222 3,343 3,470 3,602 3,739 3,883 4,033 4,189 4,351
Invested Capital: 50,933 48,427 46,865 44,109 44,480 45,355 46,064 46,934 47,960 49,116 48,841 48,876 48,506 51,396
ROIC 5.24% 7.67% 4.99% 2.49% 9.97% 11.19% 11.68% 12.13% 12.52% 12.83% 14.72% 15.46% 16.22% 17.04%EP (969.15) 409.86 (909.39) (2,051.10) 1,369.16 1,919.72 2,183.63 2,421.05 2,651.26 2,860.93 3,856.82 4,197.91 4,568.27 4,934.04 FCF 11,656.43 6,414.77 3,978.74 3,924.95 4,028.47 4,099.58 4,590.70 4,715.42 4,849.57 4,999.87 7,505.98 7,518.36 8,295.67 5,376.30

Caterpillar Inc.Discounted Cash Flow (DCF) and Economic Profit (EP) Valuation Models
Key Inputs: CV Growth 4.50% CV ROIC 12.83% WACC 6.87% Cost of Equity 8.92%Average Beta 1.32Fiscal Years Ending Dec. 31 2017E 2018E 2019E 2020E 2021E 2022ENOPLAT 4,399 4,975 5,299 5,586 5,875 6,156 Invested Capital 44,480 45,355 46,064 46,934 47,960 49,116 ROIC 9.97% 11.19% 11.68% 12.13% 12.52% 12.83%
DCF ModelPeriod 1 2 3 4 5 6 NOPLAT 4,399 4,975 5,299 5,586 5,875 6,156 Less Change in Invested Capital 371 876 709 870 1,026 1,156 Free Cash Flow (FCF) 4,028 4,100 4,591 4,715 4,850 5,000 CV 168,692
Periods to Discount 1 2 3 4 5 5PV of FCF 3,770 3,589 3,761 3,615 3,479 121,010
Value of Operating Assets 139,224
Non-Operating Assets Model Date 11/8/2017Excess Cash 6,397 Next FYE 12/31/2017Marketable securities 31 Last FYE 12/31/2016Derivates and Hedging 95 Days in FY 365 Total Non-Operating Assets 6,523 Days to FYE 312
Elapsed Fraction 0.855Non-Operating Liabilities Adjusted Stock Price 174.53$ PV of leases 765Employee stock options 1,608PV of Pension Obligations 8,494Total Debt 36,783Non-Controlling Interests 76Total Non-Operating Liabilities 47,726
Equity Value 98,022Shares Outstanding 595Intrinsic Value 164.76$
EP ModelPeriod 1 2 3 4 5 6NOPLAT 4,399 4,975 5,299 5,586 5,875 6,156Beg Invested Capital 44,109 44,480 45,355 46,064 46,934 47,960ROIC 9.97% 11.19% 11.68% 12.13% 12.52% 12.83%WACC 6.87% 6.87% 6.87% 6.87% 6.87% 6.87%Economic Profit 1,369 1,920 2,184 2,421 2,651 2,861CV 120,732
Periods to Discount 1 2 3 4 5 5PV of EP 1,281 1,681 1,789 1,856 1,902 86,606
Value of Economic Profit 95,115Add: Beginning Invested Capital 44,109Value of Operating Assets 139,224
Non-Operating AssetsExcess Cash 6,397Marketable securities 31Derivates and Hedging 95Total Non-Operating Assets 6,523
Non-Operating LiabilitiesPV of leases 765Employee stock options 1,608PV of Pension Obligations 8,494Total Debt 36,783Non-Controlling Interests 76Total Non-Operating Liabilities 47,726
Equity Value 98,022Shares Outstanding 595Intrinsic Value 164.76$

Caterpillar Inc.Dividend Discount Model (DDM) or Fundamental P/E Valuation Model
Fiscal Years Ending Dec. 31 2017E 2018E 2019E 2020E 2021E 2022E
EPS 6.64$ 7.40$ 7.93$ 8.49$ 9.07$ 9.63$
Key Assumptions CV growth 4.50% CV ROE 21.97% Cost of Equity 8.92%
Future Cash Flows P/E Multiple (CV Year) 17.98 EPS (CV Year) 9.63$ Dividends Per Share 3.22$ 3.36$ 3.51$ 3.67$ 3.84$ Future Stock Price 173.21$
Discount Periods 1 2 3 4 5 5 Discounted Cash Flows 2.95$ 2.84$ 2.72$ 2.61$ 2.50$ 112.98$
Intrinsic Value 12/31/16 123.65$

Caterpillar Inc.Relative Valuation Models
EPS EPSTicker Company Price 2017E 2018E P/E 17 P/E 18DE Deere & Co $129.15 $6.52 $7.10 19.80 18.19 CNHI CNH Industrial $12.38 $0.46 $0.57 26.91 21.72 GE General Electric Compan $21.89 $1.20 $1.27 18.24 17.24 ASTE Astec Industries Inc. $50.17 $2.01 $3.02 24.96 16.61 BA Boeing $266.00 $10.04 $10.84 26.49 24.54 GD General Dynamics $212.08 $9.81 $10.54 21.62 20.12
Average 23.00 19.74
CAT Caterpillar Inc. $137.29 6.64 7.40 20.7 18.6
Implied Relative Value: P/E (EPS17) $ 152.82 P/E (EPS18) 146.00$

Caterpillar Inc.Key Management Ratios
Fiscal Years Ending Dec. 31 2013 2014 2015 2016 2017E 2018E 2019E 2020E 2021E 2022E
Liquidity Ratios CalculationCurrent Ratio (Current Assets / Current Liabilities) 1.40 1.39 1.28 1.22 1.32 1.38 1.44 1.51 1.58 1.65 Quick Ratio ((Current Assets - Inventories)/ Current Liabilitie 0.94 0.96 0.91 0.89 0.95 1.01 1.07 1.14 1.20 1.27 Cash Ratio (Cash / Current Liabilities) 0.22 0.26 0.25 0.27 0.33 0.38 0.44 0.50 0.56 0.62
Activity or Asset-Management RatiosTotal Asset Turnover (Sales / Total Assets) 0.66 0.65 0.60 0.52 0.58 0.58 0.58 0.57 0.57 0.57Inventory Turnover (COGS / Avgerage Inventories) 2.75 3.12 2.89 2.89 3.06 2.95 2.94 2.94 2.94 2.94Receivables Turnover (Sales / Average AR 3.08 3.25 2.90 2.55 3.02 3.01 3.00 3.00 3.00 3.00
Financial Leverage RatiosDebt to Equity (Total Debt / Total Equity) 180.81% 233.48% 255.38% 278.38% 240.04% 218.10% 197.55% 179.79% 164.43% 151.19%Debt Ratio ((Total Debt + PV of Oper. Leases) / Total Assets) 45.39% 47.32% 49.45% 50.26% 48.02% 47.07% 46.06% 45.07% 44.09% 43.13%Times Interest Earned (EBIT / Interest Expense) 12.10 6.85 7.47 0.99 9.53 10.29 10.63 11.01 11.36 11.65
Profitability RatiosReturn on Assets (Net Income / Avg. Total Assets) 4.35% 2.89% 3.08% -0.09% 5.10% 5.39% 5.48% 5.57% 5.63% 5.66%Return on Equity (Net Income / Avg. Stockholder's Equity) 19.70% 13.01% 15.84% -0.48% 27.27% 26.35% 24.81% 23.38% 22.06% 20.78%Profit Margin Ratio (Net Income / Total Revenue) 6.81% 4.44% 5.34% -0.17% 8.65% 9.08% 9.29% 9.48% 9.66% 9.78%Gross Margin Ratio ((Revenue - COGS) / Revenue) 30.31% 29.70% 32.62% 31.38% 37.50% 37.50% 37.50% 37.50% 37.50% 37.50%Operating Margin (Operating Income / Total Revenue) 10.11% 6.01% 8.05% 1.29% 13.74% 14.33% 14.64% 14.91% 15.15% 15.33%
Payout Policy RatiosDividend Payout Ratio (Dividends / EPS) 39.51% 67.96% 71.21% -2686.04% 48.45% 45.47% 44.30% 43.25% 42.33% 41.64%Retention Ratio (1 - Payout Ratio) 60.49% 32.04% 28.79% 2786.04% 51.55% 54.53% 55.70% 56.75% 57.67% 58.36%

Present Value of Operating Lease Obligations (2016) Present Value of Operating Lease Obligations (2015) Present Value of Operating Lease Obligations (2014) Present Value of Operating Lease Obligations (2013)
Operating Operating Operating OperatingFiscal Years Ending Dec. 31 Leases Fiscal Years Ending Leases Fiscal Years Ending Leases Fiscal Years Ending Leases2017 211 2016 237 2015 229 2014 2442018 160 2017 183 2016 174 2015 1802019 107 2018 140 2017 125 2016 1332020 81 2019 93 2018 92 2017 992021 61 2020 68 2019 65 2018 74Thereafter 176 Thereafter 205 Thereafter 189 Thereafter 229Total Minimum Payments 796 Total Minimum Payments 926 Total Minimum Payments 874 Total Minimum Payments 959Less: Interest 137 Less: Interest 161 Less: Interest 151 Less: Interest 171PV of Minimum Payments 659 PV of Minimum Payments 765 PV of Minimum Payments 723 PV of Minimum Payments 788
Capitalization of Operating Leases Capitalization of Operating Leases Capitalization of Operating Leases Capitalization of Operating Leases
Pre-Tax Cost of Debt 6.00% Pre-Tax Cost of Debt 6.00% Pre-Tax Cost of Debt 6.00% Pre-Tax Cost of Debt 6.00%Number Years Implied by Year 6 Payment 2.9 Number Years Implied by Year 6 Payment 3.0 Number Years Implied by Year 6 Payment 2.9 Number Years Implied by Year 6 Payment 3.1
Lease PV Lease Lease PV Lease Lease PV Lease Lease PV LeaseYear Commitment Payment Year Commitment Payment Year Commitment Payment Year Commitment Payment1 211 199.1 1 237 223.6 1 229 216.0 1 244 230.22 160 142.4 2 183 162.9 2 174 154.9 2 180 160.23 107 89.8 3 140 117.5 3 125 105.0 3 133 111.74 81 64.2 4 93 73.7 4 92 72.9 4 99 78.45 61 45.6 5 68 50.8 5 65 48.6 5 74 55.36 & beyond 61 117.6 6 & beyond 68 136.4 6 & beyond 65 126.2 6 & beyond 74 152.1PV of Minimum Payments 658.6 PV of Minimum Payments 764.9 PV of Minimum Payments 723.5 PV of Minimum Payments 787.8
2013 2014 2015 2016 2017 2018 2019 2020 2021 2022 2023Op Lease PV 788 723 765 659 651 649 652 658 667 614 572

Effects of ESOP Exercise and Share Repurchases on Common Stock Balance Sheet Account and Number of Shares Outstanding
Number of Options Outstanding (shares): 32Average Time to Maturity (years): 6.05Expected Annual Number of Options Exercised: 5
Current Average Strike Price: 82.14$ Cost of Equity: 9.00%Current Stock Price: $137.29
2017E 2018E 2019E 2020E 2021E 2022EIncrease in Shares Outstanding: 5 5 5 5 5 5Average Strike Price: 82.14$ 82.14$ 82.14$ 82.14$ 82.14$ 82.14$ Increase in Common Stock Account: 435 435 435 435 435 435
Change in Treasury Stock 195 379,795 375,960 372,255 368,485 364,845Expected Price of Repurchased Shares: 137.29$ 149.65$ 163.11$ 177.79$ 193.80$ 211.24$ Number of Shares Repurchased: 1 2,538 2,305 2,094 1,901 1,727
Shares Outstanding (beginning of the year) 584,300,000 584,297,000 578,454,000 572,670,000 566,943,000 561,274,000Plus: Shares Issued Through ESOP 5 5 5 5 5 5Less: Shares Repurchased in Treasury 1 2,538 2,305 2,094 1,901 1,727 Shares Outstanding (end of the year) 584,300,004 584,294,467 578,451,700 572,667,912 566,941,104 561,272,278
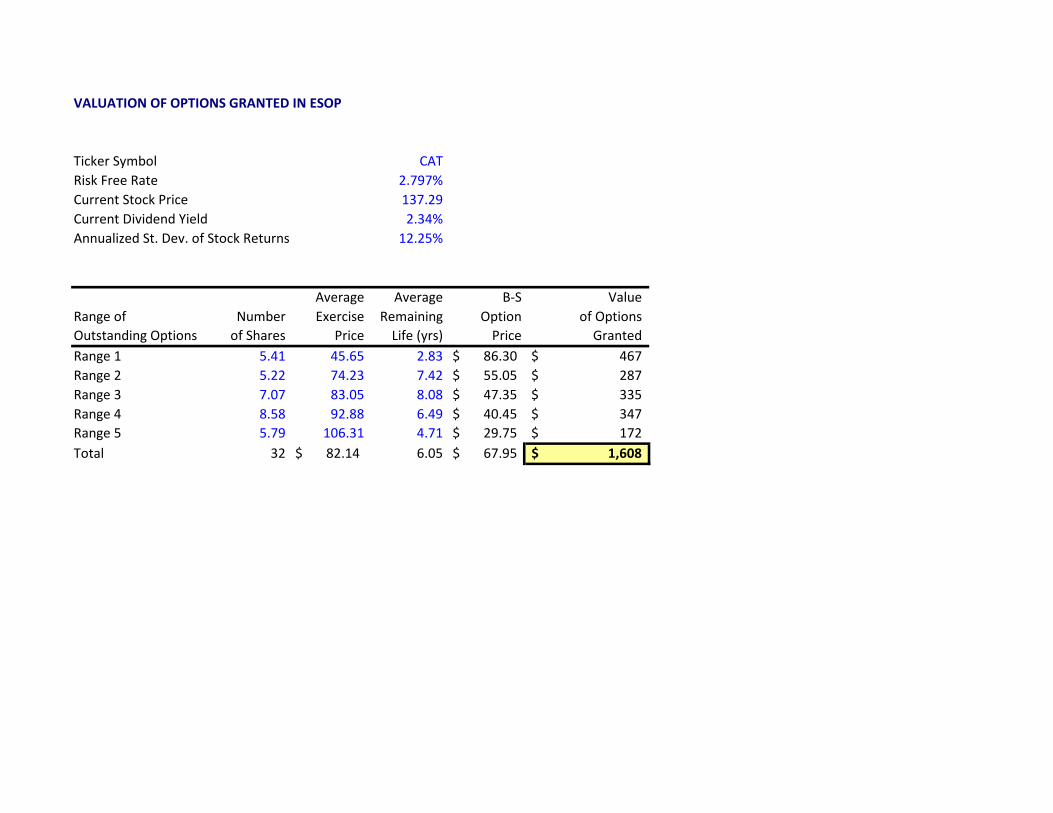
VALUATION OF OPTIONS GRANTED IN ESOP
Ticker Symbol CATRisk Free Rate 2.797%Current Stock Price 137.29Current Dividend Yield 2.34%Annualized St. Dev. of Stock Returns 12.25%
Average Average B-S ValueRange of Number Exercise Remaining Option of OptionsOutstanding Options of Shares Price Life (yrs) Price GrantedRange 1 5.41 45.65 2.83 86.30$ 467$ Range 2 5.22 74.23 7.42 55.05$ 287$ Range 3 7.07 83.05 8.08 47.35$ 335$ Range 4 8.58 92.88 6.49 40.45$ 347$ Range 5 5.79 106.31 4.71 29.75$ 172$ Total 32 82.14$ 6.05 67.95$ 1,608$

Cost of Debt174.53$ 3.4% 3.5% 3.6% 3.7% 3.8% 3.9% 4.0%
35.0% 121.77$ 120.20$ 118.64$ 117.04$ 115.61$ 114.13$ 112.68$ 36.0% 145.35$ 143.58$ 141.83$ 140.03$ 138.43$ 136.77$ 135.14$ 37.0% 168.92$ 166.96$ 165.03$ 163.03$ 161.25$ 159.41$ 157.60$ 37.5% 180.71$ 178.65$ 176.62$ 174.53$ 172.66$ 170.73$ 168.83$ 38.0% 192.50$ 190.34$ 188.22$ 186.02$ 184.07$ 182.05$ 180.06$ 39.0% 216.07$ 213.72$ 211.41$ 209.02$ 206.89$ 204.69$ 202.52$ 40.0% 239.64$ 237.10$ 234.60$ 232.01$ 229.71$ 227.33$ 224.98$
Cost of Debt174.53$ 3.4% 3.5% 3.6% 3.7% 3.8% 3.9% 4.0%
8.6% 206.92$ 204.41$ 201.94$ 199.39$ 197.13$ 194.79$ 192.49$ 8.7% 198.20$ 195.84$ 193.53$ 191.14$ 189.01$ 186.81$ 184.65$ 8.8% 190.02$ 187.80$ 185.62$ 183.37$ 181.37$ 179.30$ 177.26$ 8.9% 180.71$ 178.65$ 176.62$ 174.53$ 172.66$ 170.73$ 168.83$ 9.0% 175.08$ 173.11$ 171.17$ 169.17$ 167.38$ 165.54$ 163.71$ 9.1% 168.24$ 166.38$ 164.54$ 162.65$ 160.96$ 159.21$ 157.49$ 9.2% 161.77$ 160.01$ 158.27$ 156.48$ 154.88$ 153.22$ 151.58$
WACC174.53$ 6.2% 6.4% 6.6% 6.8% 7.0% 7.2% 7.4%
29.0% 281.73$ 246.64$ 218.61$ 191.23$ 176.84$ 160.93$ 147.41$ 30.0% 273.78$ 239.53$ 212.18$ 185.47$ 171.43$ 155.93$ 142.75$ 31.0% 265.83$ 232.41$ 205.74$ 179.71$ 166.03$ 150.93$ 138.10$ 31.5% 261.85$ 228.86$ 202.52$ 176.83$ 163.33$ 148.43$ 135.77$ 32.0% 257.88$ 225.30$ 199.31$ 173.94$ 160.63$ 145.93$ 133.44$ 33.0% 249.92$ 218.19$ 192.87$ 168.18$ 155.22$ 140.92$ 128.78$ 34.0% 241.97$ 211.07$ 186.43$ 162.42$ 149.82$ 135.92$ 124.13$
SGA % of Revenue174.53$ 6.0% 7.0% 8.0% 9.0% 10.0% 11.0% 12.0%
35.0% 186.02$ 163.03$ 140.03$ 117.04$ 94.04$ 71.05$ 48.05$ 36.0% 209.02$ 186.02$ 163.03$ 140.03$ 117.04$ 94.04$ 71.05$ 37.0% 232.01$ 209.02$ 186.02$ 163.03$ 140.03$ 117.04$ 94.04$ 37.5% 243.51$ 220.52$ 197.52$ 174.53$ 151.53$ 128.54$ 105.54$ 38.0% 255.01$ 232.01$ 209.02$ 186.02$ 163.03$ 140.03$ 117.04$ 39.0% 278.00$ 255.01$ 232.01$ 209.02$ 186.02$ 163.03$ 140.03$ 40.0% 301.00$ 278.00$ 255.01$ 232.01$ 209.02$ 186.02$ 163.03$
Gross Margin
Cost of Equity
Tax Rate
Gross Margin