KPN Investor Day: Mobile International · exhaustively) in the 2008 Annual Report. Challenger...
109
KPN Investor Day: Mobile International Doing things differently Paris, 12 June 2009
Transcript of KPN Investor Day: Mobile International · exhaustively) in the 2008 Annual Report. Challenger...
KPN Investor Day: Mobile InternationalDoing things differently
Paris, 12 June 2009

2Challenger strategy: delivering profitable growth
Safe harborNon-GAAP measures and management estimatesThis presentation contains a number of non-GAAP figures, such as EBITDA and free cash flow. These non-GAAP figures should not be viewed as a substitute for KPN’s GAAP figures. KPN defines EBITDA as operating result before depreciation and impairments of PP&E and amortization and impairments of intangible assets. Note that KPN’s definition of EBITDA deviates from the literal definition of earnings before interest, taxes, depreciation and amortization and should not be considered in isolation or as a substitute for analyses of the results as reported under IFRS. All market share information in this presentation is based on management estimates based on externally available information, unless indicated otherwise.
Forward looking statementsCertain statements contained in this presentation constitute forward-looking statements. These statements may include, without limitation, statements concerning future results of operations, the impact of regulatory initiatives on KPN’s operations, its and its joint ventures' share of new and existing markets, general industry and macro-economic trends and KPN’s performance relative thereto, and statements preceded by, followed by or including the words “believes”, “expects”, “anticipates” or similar expressions.These forward-looking statements rely on a number of assumptions concerning future events and are subject to uncertainties and other factors, many of which are outside KPN’s control that could cause actual results to differ materially from such statements. A number of these factors are described (not exhaustively) in the 2008 Annual Report.

3Challenger strategy: delivering profitable growth
Programme
Eric HagemanInternational wholesale11.30 - 11.45
Break10.45 - 11.00
Stan MillerStrategy Mobile International09.30 - 10.00
Vivienne van AstenOpening09.00 - 09.10
Marc van AsbroeckRegulation10.00 - 10.20
Stan MillerConcluding remarks11.45 - 11.50
Ad ScheepbouwerIntroduction09.10 - 09.30
Thorsten DirksE-Plus11.00 - 11.30
SpeakerTopicTime
Eric HagemanFinance
Libor Voncina, replaced by Erik HovingKPN Group Belgium10.20 - 10.45
Q&A11.50 - 12.15
Lunch12.30 - 14.00
4Challenger strategy: delivering profitable growth
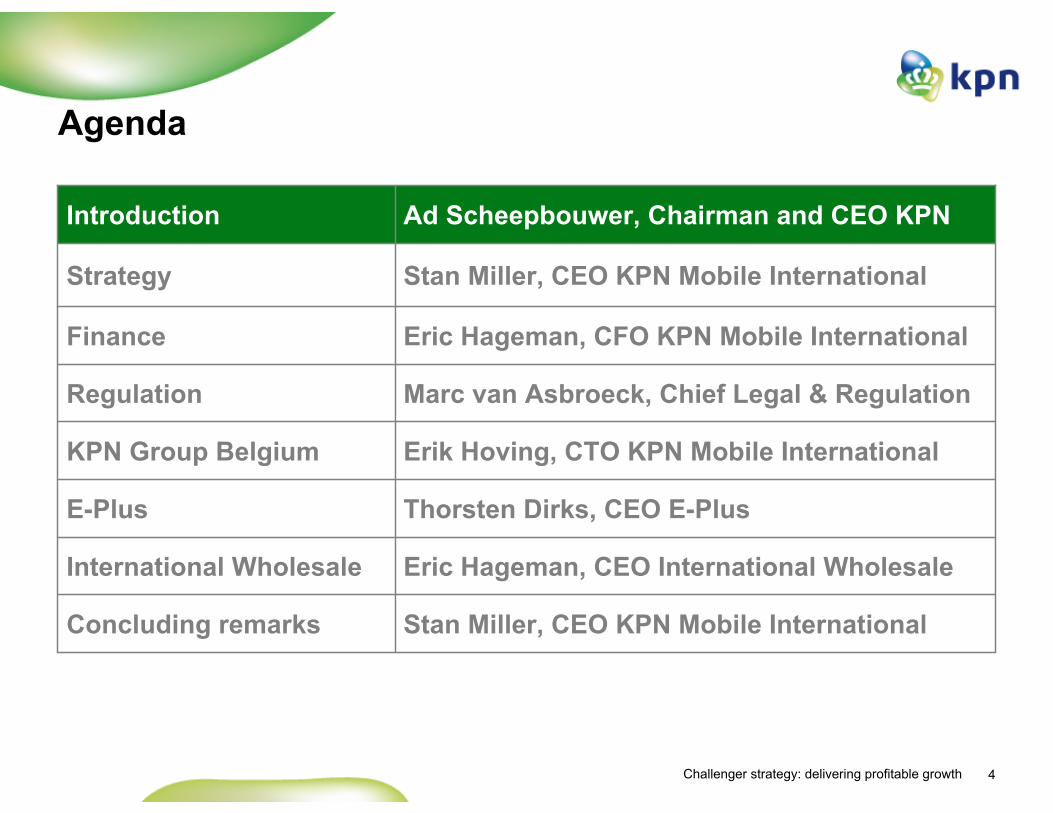
Agenda
Eric Hageman, CEO International WholesaleInternational Wholesale
Stan Miller, CEO KPN Mobile InternationalConcluding remarks
Thorsten Dirks, CEO E-PlusE-Plus
Erik Hoving, CTO KPN Mobile International KPN Group Belgium
Eric Hageman, CFO KPN Mobile InternationalFinance
Stan Miller, CEO KPN Mobile InternationalStrategy
Marc van Asbroeck, Chief Legal & RegulationRegulation
Ad Scheepbouwer, Chairman and CEO KPNIntroduction

5Challenger strategy: delivering profitable growth
Historic perspective: KPN end of 20011
The Netherlands main contributor, activities all over the world
€ 10.6 bn€ 3.1 bn€ 0.9 bn
Revenues EBITDACash flow2
The Netherlands & other
€ 12.9 bn€ 3.4 bn€ 0.4 bn
Gross debtFTE
€ 23.0 bn45.7k
Revenues EBITDA Cash flow2
KPN Group
1 Pro forma figures, based on Dutch GAAP2 Cash flow defined as EBITDA -/- Capex
Footprint 2001
€ 2.3 bn€ 0.3 bn
-/-€ 0.5 bn
Revenues EBITDACash flow2
Mobile International

6Challenger strategy: delivering profitable growth
KPN strategies 2002-2010Clear strategies and execution have paved the way for growth opportunities
Time
Valu
e
‘Turnaround’2002-2004
• Turnaround BASE Belgium• ‘Line in the sand’ at KPN Mobile the Netherlands• Sale of non-core assets
• Ahead of the curve with All-IP strategy• Challenger strategy at E-Plus• Strategic M&A: Telfort, Getronics
• The Netherlands reaching inflection• Continued growth Mobile International• Additional growth from recent acquisitions
‘Attack-Defend-Exploit’
2005-2007
‘Back to growth’2008-2010

7Challenger strategy: delivering profitable growth
2002-2004: Turnaround strategyTough actions taken with focus on core activities
• Created internal sense of urgency by change of management
• Forced lay-offs through social plan for more than 5,000 FTE
• Management focus on operational excellence and customers
• Harsh refinancing actions taken to defer financial distress
• € 2.5 bn credit facility, consortium of 8 international banks in September 2001
• € 4.8 bn rights issue in December 2001, 85% dilution of outstanding shares
• Focus on core markets – The Netherlands; market leader in Fixed and Mobile
– Germany; # 3 mobile operator
– Belgium; # 3 mobile operator
• Disposal of non-core assets, total proceeds of ~€ 4.4 bn– Ireland, Indonesia, Hungary, Czech Republic: ~€ 3.0 bn
– Other non-core assets, totalling ~€ 1.4 bn
• Focus on cash flow instead of revenue growth
Focused strategy
Refinancing
Operational excellence

8Challenger strategy: delivering profitable growth
2005-2007: Attack-Defend-Exploit strategyTransforming our business model
• Proactive migration of traditional services to IP-based services, e.g. VoIP
• New IP and broadband services, extended with value-added services
• Maximize position in traditional services prior to migration to IP-based services and phase-out
• Open access model based on IP
• Unbundlers as resellers on KPN infrastructure
• Broadband access network: VDSL, HSDPA
• Rationalization of systems and processes
The NetherlandsAttack-Defend-Exploit strategy
• Handpick segments with tailored offerings
• Turn core services into great value
• Redesign pull & its economics
• Focus regionally, maximize impact of pull actions
• Launch offensive to throw rivals off-balance
• Maximize margin
Mobile InternationalChallenger Strategy
Attack
Defend
Exploit
Customer targeting
Proposition
Channels
Deployment
Regulatory
Financial model
9Challenger strategy: delivering profitable growth
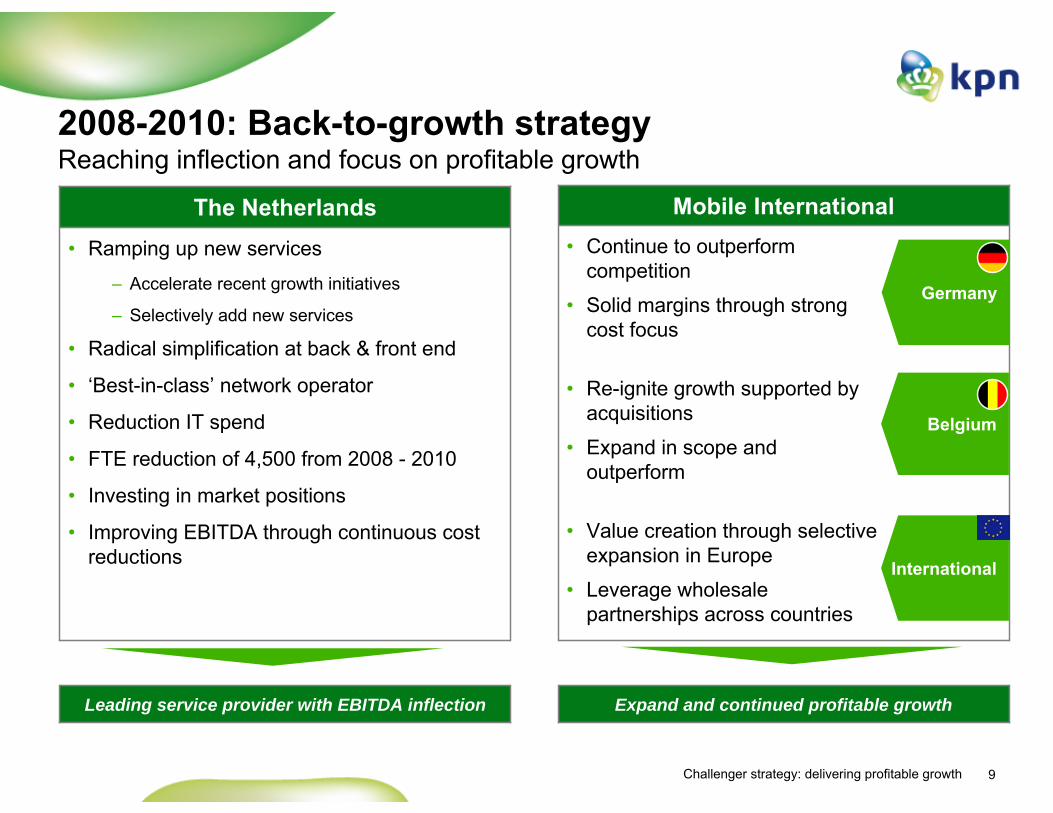
2008-2010: Back-to-growth strategyReaching inflection and focus on profitable growth
Leading service provider with EBITDA inflection
• Ramping up new services
– Accelerate recent growth initiatives
– Selectively add new services
• Radical simplification at back & front end
• ‘Best-in-class’ network operator
• Reduction IT spend
• FTE reduction of 4,500 from 2008 - 2010
• Investing in market positions
• Improving EBITDA through continuous cost reductions
The Netherlands
Expand and continued profitable growth
• Continue to outperform competition
• Solid margins through strong cost focus
• Re-ignite growth supported by acquisitions
• Expand in scope and outperform
• Value creation through selective expansion in Europe
• Leverage wholesale partnerships across countries
Mobile International
Germany
Belgium
International

10Challenger strategy: delivering profitable growth
KPN share price outperformance(1)
KPN strategies focus on value creationKPN clearly outperforming the Telco sector
0
2
4
6
8
10
12
14
1 Performances based on prices of 10 September ’01 (appointment of Ad Scheepbouwer) until 5 June ’09
+284%‘Turnaround’2002-2004
‘Attack-Defend-Exploit’2005-2007
‘Back to growth’2008-2010
€
-24%
KPN DJ Telco Index
Jun 2009Sep 2001 20042003 2005 2006 2007 2008
+193% +47% +17%
x% KPN performance vs. DJ Telco Index

11Challenger strategy: delivering profitable growth
KPN today1
Market leader in the Netherlands, mobile Challenger abroadGross debt € 13.6 bnFTE 35.6k
Revenues € 14.6 bnEBITDA € 5.1 bnCash flow2 € 3.1 bn
KPN Group
€ 10.5 bn€ 3.6 bn€ 2.3 bn
Revenues EBITDACash flow2
The Netherlands
1~50%
1>50%
144%
• Integrated market leader in telecoms• Leading business ICT service provider• Own brands and partners
WirelessPositionMarket share
WirelinePositionMarket share
Broadband PositionMarket share
Leading MVNOCustomers ~0.2m
Launched in Jan ’09
+
€ 4.1 bn
€ 1.5 bn
€ 0.8 bn
Revenues EBITDACash flow2
Mobile International
315.4%18.0m
3>16%3.5m
• ‘Challenger’ in Belgium and Germany• Leading MVNO in Spain and France• Own brands and partners
Position Market share Customers
PositionMarket shareCustomers
1 Revenues, Cash flow and EBITDA are FY 2008, other figures relate to Q1 ’092 Cash flow defined as EBITDA -/- Capex
Current footprint
+€ 0.1 bn+€ 0.5 bn+€ 1.4 bn
+€ 1.8 bn+€ 1.2 bn+€ 1.3 bn
xx Delta versus 2001
France
España

12Challenger strategy: delivering profitable growth
Agenda
Eric Hageman, CEO International WholesaleInternational Wholesale
Stan Miller, CEO KPN Mobile InternationalConcluding remarks
Thorsten Dirks, CEO E-PlusE-Plus
Erik Hoving, CTO KPN Mobile International KPN Group Belgium
Eric Hageman, CFO KPN Mobile InternationalFinance
Stan Miller, CEO KPN Mobile InternationalStrategy
Marc van Asbroeck, Chief Legal & RegulationRegulation
Ad Scheepbouwer, Chairman and CEO KPNIntroduction

13Challenger strategy: delivering profitable growth
Key messages
• We have delivered on our promises
• Challenger strategy works
• Confident that our strategy will continue to work in the future
• Management team with strong and proven track record in managing challenges
• Continue to deliver shareholder value

14Challenger strategy: delivering profitable growth
Mobile International boardExperienced team responsible for allocation of resources
KPN Mobile International
CEOStan Miller
KPN Mobile International
CFO Eric Hageman
KPN Mobile International
CHRO Bruce Humphreys
KPN Mobile International
CLOMarc van Asbroeck
E-Plus
CEOThorsten Dirks
KPN Group Belgium
CEOLibor Vončina
International Wholesale
CEOEric Hageman
Network & Operations
CEOErik Hoving

15Challenger strategy: delivering profitable growth
Strategic cornerstonesCommitted to four key pillars that deliver profitable growth
• Use choices about what segments to target to guide offers and organization
• Turn low spend customers into value
• Use MVNOs to address non-target segments
• De-average the offer
Position around customers
• Design segment-specific, highly differentiated offers that will be irresistible for finely-targeted customers
• Introduce low cost alternative channels
Create customer pull
• Break with vertical integration
• De-average by matching customer spend to SLA and cost to serve
• Manage cross-segment overlaps
Establish partnerships Introduce profit-maximizing value chains
Strategic cornerstones• Structure organization
around segment-specific end-to-end value chains
• Explore outsourcing and partnership opportunities to reduce costs & share risks

16Challenger strategy: delivering profitable growth
Strategy introduced in 2005New strategy turns weaknesses into strengths
From
To
Push
Pull
Pull
Push
Market segments
Do it in-house
Business PartnerTailor offers to
individual segmentsLeverage business partners
One market
Strategic Initiatives– Create brand preference and customer pull– Invest in network– Customer segmentation– Outsourcing partnerships– Regulatory offensive
Objectives– Attractive customer propositions– Make indoor coverage a USP– Establish multibrand strategy– Simplify operations– Rebalance playing field
Customer service & support
MarketingBack
office, billing and IT
Sales
Sales
Sales
Network ownership
and operation
Customer service & support
MarketingBack
office, billing and IT
Network ownership
and operation
Sales
Strategy update 2005

17Challenger strategy: delivering profitable growth 17
Belgian mobile market situation in 2003
Market structure • Proximus and Mobistar controlled 91% of mobile market revenues• Both had roughly three times KPN Group Belgium’s EBITDA margin
Market characteristics
• Very low usage, fourth lowest of all EU-14 countries• 35% of the market is Post Paid• Proximus and Mobistar had close to 95% business value market share
Distribution • KPN Group Belgium had 43 exclusive shops versus more than triple that number for competition
Network • KPN Group Belgium had several hundreds fewer base stations than top two players
Business model • KPN Group Belgium was a sub-scale business with high investments, leading to negative cash flow

18Challenger strategy: delivering profitable growth
German mobile market situation in 2005
• E-Plus model demanded high investment in acquiring customersBusiness model
• E-Plus had more 2G base stations than O2 but thousands less than top two playersNetwork
• E-Plus had 179 exclusive shops versus more than 500 for competitionDistribution
• Very low usage, second lowest of all EU-25 countries• 50% of the market was Post Paid• T-Mobile and Vodafone had close to 80% business market share
Market characteristics
• T-Mobile and Vodafone controlled 75% of mobile market revenues• Both had roughly two times E-Plus’ EBITDA marginMarket structure
Strategy update 2005
19Challenger strategy: delivering profitable growth
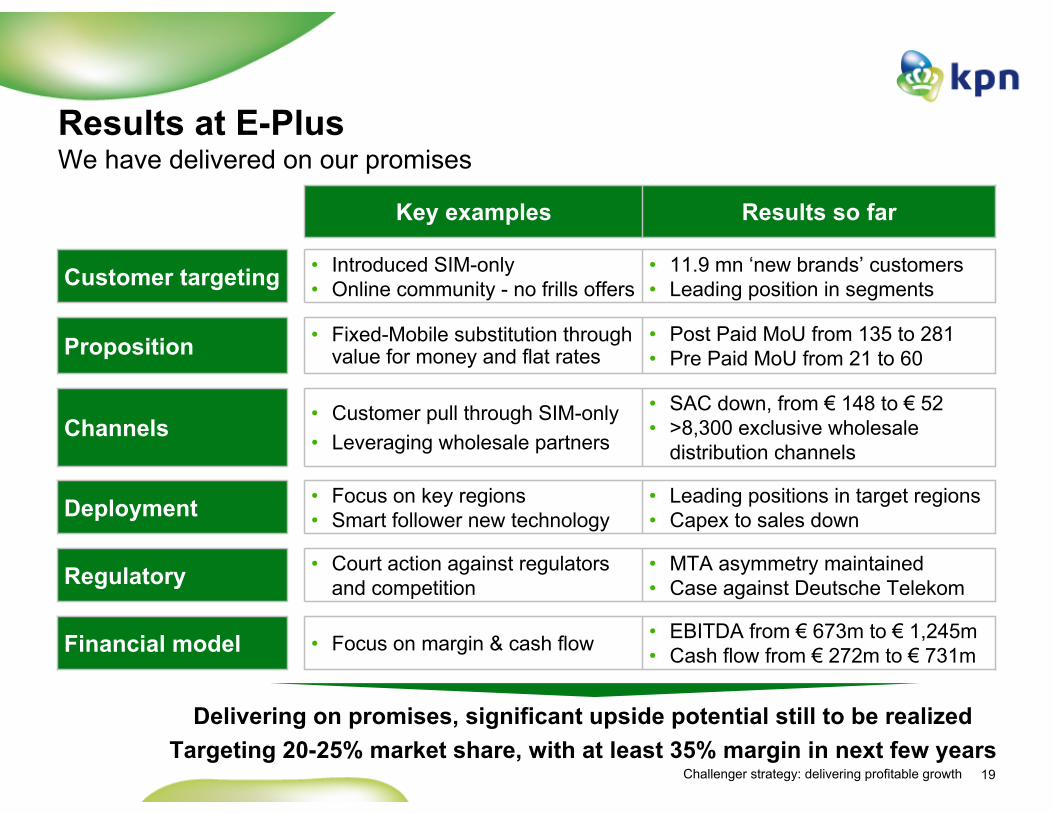
Results at E-PlusWe have delivered on our promises
• MTA asymmetry maintained• Case against Deutsche Telekom
• Court action against regulators and competitionRegulatory
• EBITDA from € 673m to € 1,245m• Cash flow from € 272m to € 731m• Focus on margin & cash flowFinancial model
• Leading positions in target regions• Capex to sales down
• Focus on key regions• Smart follower new technologyDeployment
• SAC down, from € 148 to € 52• >8,300 exclusive wholesale
distribution channels
• Customer pull through SIM-only• Leveraging wholesale partnersChannels
• Post Paid MoU from 135 to 281• Pre Paid MoU from 21 to 60
• Fixed-Mobile substitution through value for money and flat ratesProposition
• 11.9 mn ‘new brands’ customers• Leading position in segments
• Introduced SIM-only• Online community - no frills offersCustomer targeting
Results so farKey examples
Delivering on promises, significant upside potential still to be realizedTargeting 20-25% market share, with at least 35% margin in next few years

20Challenger strategy: delivering profitable growth
Mobile premiums decrease which increase mobile share of voice
Mobile market development‘Challengers’ will continue to take market share as FMS continues
New players intensify competition
Mobile share of total voice minutes
MVNOsat least20% of market
2005 >2010M
obile
pre
miu
m1
Germany ’05/’08
Belgium ’05/’08
Low HighLo
wH
igh
Increasing pressure on incumbents Germany lagging Fixed-Mobile Substitution
Finland
Denmark
Spain ’05/’08
France ’05/’08
Norway
Austria
ItalyNetherlands
Switzerland
Sweden
Greece
UK
1 Mobile cost per minute divided by fixed cost per minute Source: Equity research
Mar
ket s
hare
100%
Traditionalmobile networkoperators
No-frillsMVNOs
‘New’MVNOs
Mobile Service Providers
Today
+
-/-

21Challenger strategy: delivering profitable growth
Substitution challengers“In between”Converged services
• Ease-of-use, attractive prices• Scale and profitability• Smart follower• Partner to fixed-only players
• Customer share-of-wallet• Technology innovator
• All-in-one, quadruple play• Retention, access protection• Technology innovator
Doing things differentlyCompetitors are moving to converged services; we remain focused on mobile
Focus on converged offers
Expanding DSL footprint
Arcor integration• Competitor focus on ‘converged’ services• Untapped potential for clear FMS challenger
Fixed-Mobile organizational integration
Fixed-Mobile organizational integration
Fixed-Mobile strategies
We were the first and are market leaderWe have “carved out” segments
• Competition is copying our strategy – Low cost brands launched– More open to wholesale
General

22Challenger strategy: delivering profitable growth
Challenger strategyTactics for delivering profitable growth
Sample of some of the tactics
• Maximize return on existing assets
• Selective, low risk investments in new technology
• Expand voice target regions based on proven concept
• Monetize leading position in voice to build data position
• Leverage proven business models to new markets
• Build partnerships & business models with new entrants
• Mobile share of voice still low, significant untapped potential
• Voice remains dominant over data for the next years
Smart technology
follower
Regionalization
Wholesale & Partnerships
Fixed-Mobile Substitution
A
B
C
D
Position around
customers
Create customer pull
Establish partnerships
Introduce profit-
maximizing value chains
Strategic cornerstones

23Challenger strategy: delivering profitable growth
26%
54% 57% 52%15%
42% 38%44%
2008 2005
AFixed-Mobile SubstitutionContinued growth potential from FMS
Mobile share of voice traffic Ø 54%1
Non-voice as % of service revenues
1 Non-weighted average (2008) of Austria, Belgium, Denmark, Finland, France, Germany, Greece, Italy, Netherlands, Norway, Spain, Sweden, Switzerland, UKSource: Equity research
• Significant changes 2005-2008
− Avg. mobile voice share +16% to 54%
− Price ratio Mobile/Fixed down 25%
• Significant untapped FMS potential
− Mobile share of voice for EU top 3 >65%
• Major spread ARPM vs. MTA tariff
• Voice remains dominant part of service revenue for the next years
– Data predominantly consists of SMS at the moment
Mobile ARPM & MTA€ ct.
10.2
13.815.8
13.4
6.6 6.6 7.8 6.5
Germany FranceARPM MTA
Belgium
26%23%
17%21%20%
15% 14% 15%
Germany France4Q08 1Q06
Belgium Spain
Spain

24Challenger strategy: delivering profitable growth
WholesaleLeverage proven business models into new markets & move up the value chain
no frills / price fixed-net / utilities value / applications
Market leader
Leading
Complementary Open business model
Evolution
I
II
Wholesale growth matrix
• Expand proven business models to new markets– Footprint expanded to Spain & France: doubling addressable market– Leverage own brands & international partners
• Build partnerships & business models with new entrants – Cable / DSL, utilities – Media– Applications e.g. e-health, e-security, e-finance
I
II
B
Mar
kets
25Challenger strategy: delivering profitable growth
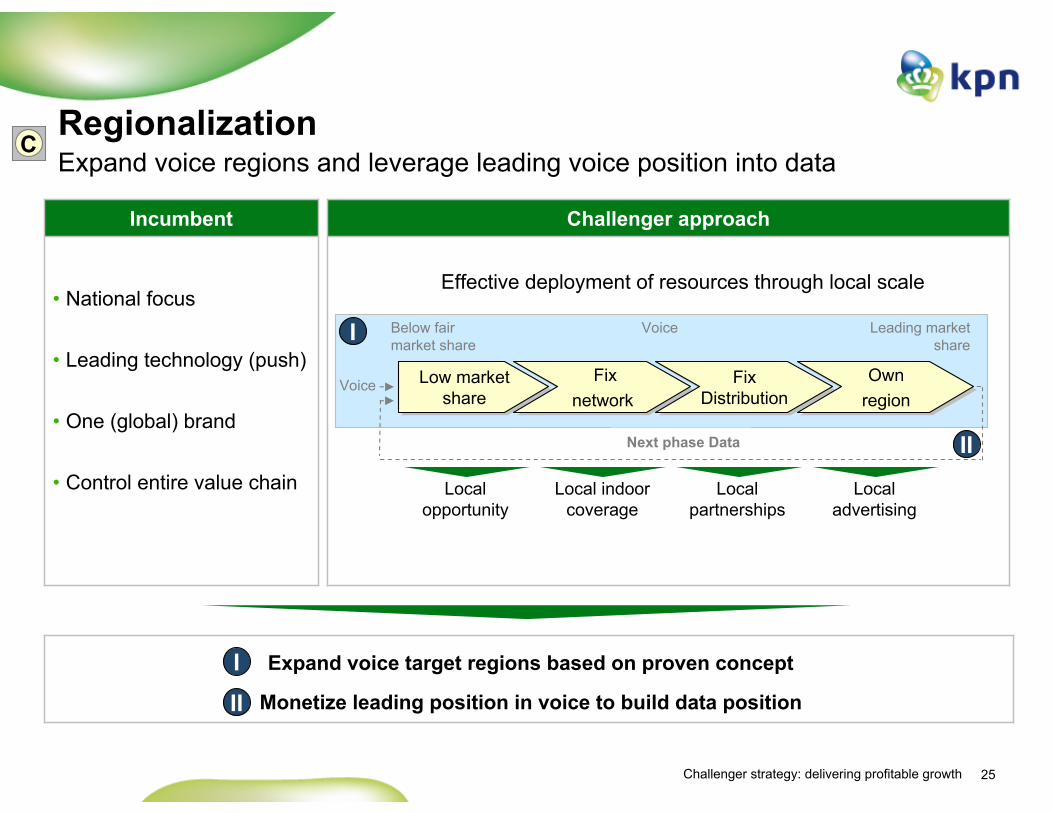
Challenger approach
RegionalizationExpand voice regions and leverage leading voice position into data
• National focus
• Leading technology (push)
• One (global) brand
• Control entire value chain
Incumbent
Voice
Next phase Data
Low market share
Low market share
Fix network
Fix network
Fix Distribution
Fix Distribution
Own regionOwn
region
Local opportunity
Local indoor coverage
Local partnerships
Local advertising
Effective deployment of resources through local scale
Below fair market share
Leading market share
Expand voice target regions based on proven concept
Monetize leading position in voice to build data position
C
I
II
I
II
Voice
26Challenger strategy: delivering profitable growth
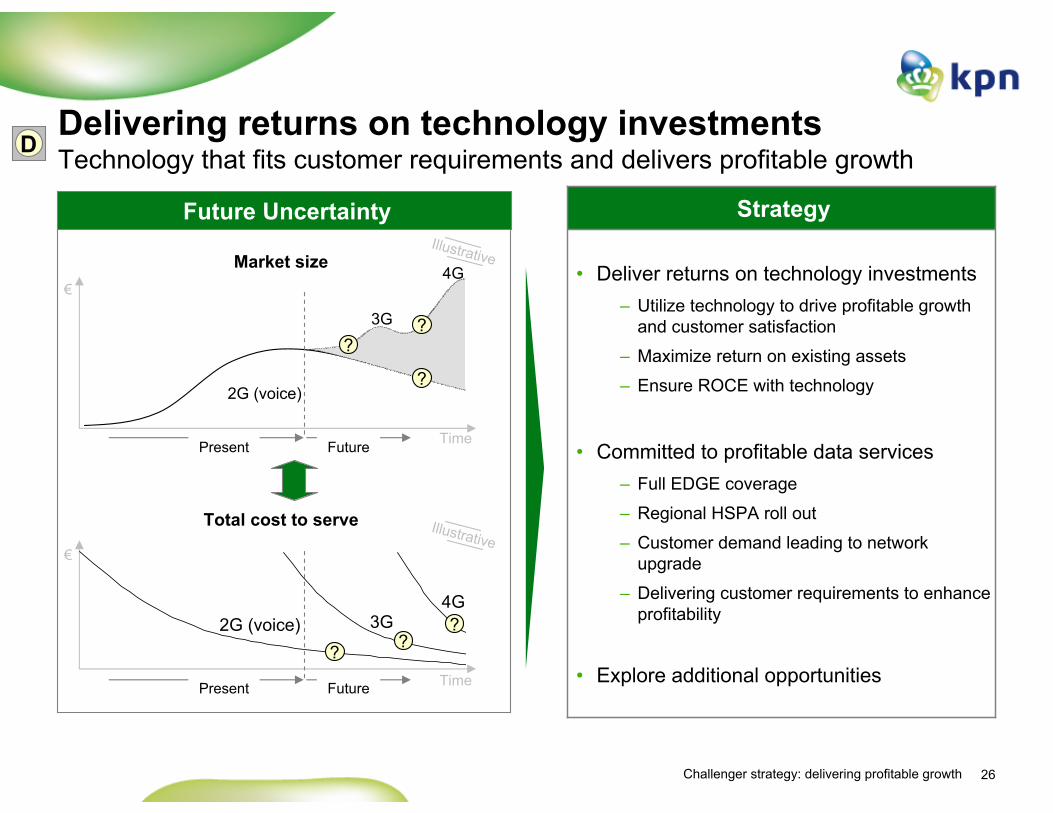
Delivering returns on technology investments Technology that fits customer requirements and delivers profitable growth
Future Uncertainty Illustrative
Total cost to serve
€
Present Future Time
Illustrative
2G (voice) 3G4G?
??
Market size€
Time
2G (voice)
4G
3G
Present Future
?
?
?
D
• Deliver returns on technology investments– Utilize technology to drive profitable growth
and customer satisfaction
– Maximize return on existing assets
– Ensure ROCE with technology
• Committed to profitable data services– Full EDGE coverage
– Regional HSPA roll out
– Customer demand leading to network upgrade
– Delivering customer requirements to enhance profitability
• Explore additional opportunities
Strategy

27Challenger strategy: delivering profitable growth
Addressable market
Enhanced segmentationCreeping up the value chain by selectively targeting SME / SoHo
• Mobile International currently playing for value for money segment of the market
• Selectively expanding addressable market through focused targeting
– Targeted offers on a selective regional basis– Seizing opportunity of increased price sensitivity
of customers due to economic slowdown– High quality voice/data (selective technologies)
• No interest in Corporate segment– Systems and processes prohibitively expensive
for Challenger– Margin / profitability for Challenger uncertain– Challenging and costly to enter
• Propositions and partners in place
Segmentation
Cus
tom
er ty
pes
Market
1
2
3
4
5
1: Pre Paid / MVNO2: Low Post Paid / MVNO3: High Post Paid
4: SME / SoHo5: Corporate
100%0%Currently addressedTarget segments/ regions
Illustrative

28Challenger strategy: delivering profitable growth
PortfolioSelectively exploring value enhancing opportunities
• Selectively exploring
• Will only do value creating investments
• No value enhancing opportunities identified
‘Asset heavy’expansion
Going forwardAchievements
• Management focus on core operations (Germany / Belgium)
• Further expansion from position of strength in Spain and France
• Exploring selective value enhancing opportunities
• Distribution strengthened– E.g. SMS Michel, Allo Telecom
• MVNO with segment focus– E.g. Ortel, blau
Core markets‘Fill-in’
acquisitions
• Successfully launched in Spain
• Successfully launched in France‘Asset light’expansion1
1 Expansion on network of foreign MNOs

29Challenger strategy: delivering profitable growth
Horizontalization
HorizontalizationLeverage successful brands, wholesale and infrastructure across markets
• International brands rolled-out across footprint based on proven business model
• Wholesale as vital intermediate to align international market trends and needs with infrastructure deployment. Long term relationship building with own brands and strategic partners
• Infrastructure (Network/IT) managed across markets to increase long term return on capital employed through optimizing scale via own brands and partners
International Wholesale
Network/IT
Current footprint
Mobile market size(€ bn)
2520224

30Challenger strategy: delivering profitable growth
Our achievements1
+68%
+124%
+ 9%-pts
+ 78%
+ 28%
Change
23.4 mn13.9 mnCustomers
€ 942 mn€ 420 mnCash flow2
36%27%EBITDA margin
€ 1.6 bn€ 0.9 bnEBITDA
€ 4.1 bn€ 3.2 bnService revenues
20082005
1 Based on old management structure, including Wholesale NL and Sympac for ’07-’082 Cash Flow defined as EBITDA minus Capex

31Challenger strategy: delivering profitable growth
Concluding remarks
• We have delivered on our promises
• Challenger strategy works
• Confident that our strategy will continue to work in the future
• Strong and proven track record in managing challenges
• Continue to deliver shareholder value

32Challenger strategy: delivering profitable growth
Agenda
Eric Hageman, CEO International WholesaleInternational Wholesale
Stan Miller, CEO KPN Mobile InternationalConcluding remarks
Thorsten Dirks, CEO E-PlusE-Plus
Erik Hoving, CTO KPN Mobile International KPN Group Belgium
Eric Hageman, CFO KPN Mobile InternationalFinance
Stan Miller, CEO KPN Mobile InternationalStrategy
Marc van Asbroeck, Chief Legal & RegulationRegulation
Ad Scheepbouwer, Chairman and CEO KPNIntroduction

33Challenger strategy: delivering profitable growth
Mobile International Key FY 2008 financials per country1
Rest of WorldGermany Belgium
Revenue € 3.2 bnEBITDA € 1.2 bnEBITDA margin 38.7%Market share2 15.4%Customers 18 mn
Revenue € 0.8 bnEBITDA € 0.3 bnEBITDA margin 32.5%Market share2 >16%Customers 3.5 mn
1 Based on the new reporting structure as per Q1’092 Market share based on wireless service revenues
Revenue € 73 mnEBITDA -/-€ 23 mnEBITDA margin -/-31.5%Leading MVNOCustomers 0.2 mn

34Challenger strategy: delivering profitable growth
Business turnaroundSignificant value creation, amongst most profitable # 3 operators
BASE E-Plus
2002
• Market underperformance• Liability instead of asset• EBITDA: € 10 mn• EBITDA margin: 3.2%• Cash flow1: -/- € 134 mn
• Market underperformance• Value of < € 5 bn• EBITDA: € 673 mn• EBITDA margin: 23.8%• Cash flow1: € 272 mn
• Market outperformance• EBITDA: € 240 mn (+€ 230 mn)• EBITDA margin: 37.1% (+34%-pts)• Cash flow1: € 131 mn (+€ 265 mn)
• Market outperformance• EBITDA: € 1,245 mn (+€ 572 mn)• EBITDA margin: 38.7% (+15%-pts)• Cash flow1: € 731 mn (+€ 459 mn)
2008 2008
Robust business model, amongst most profitable # 3 operators
2005
1 Cash flow defined as EBITDA minus Capex
Challenger strategyChallenger strategy

35Challenger strategy: delivering profitable growth
Financial performance1
Continued profitable growth with strong cash flow through Challenger model
EBIT
DA
(m
argi
n)Se
rvic
e re
venu
es
1,5981,4541,276946
27%33% 37% 36%
2005 2006 2007 2008
EBITDA margin / CF Conversion
4,1403,7863,6093,199
2005 2006 2007 2008
5%9%
19%
9%
Cas
h Fl
ow2
1 Based on old management structure, including Wholesale NL and Sympac for ’07-’082 Cash Flow defined as EBITDA minus Capex
13%
942877661
420
44%52%
60% 59%
2005 2006 2007 2008
33% 7%57%
Y-o-Y growth
31%
• Continued market outperformance
– Strong service revenue growth at 9% CAGR
• Focus on profitable growth
– Leading EBITDA growth of 19% CAGR
• Smart follower investments
– 31% average annual growth in cash flow
CAGR ’05 – ’08
14% 10%35%

36Challenger strategy: delivering profitable growth
Share price evolution1
2
4
6
8
10
12
14
Value creation Challenger model with clear focus on value creation
Challenger strategy
Jun 20092003 2005
€• Attractive customer propositions• Established multi-brand strategy and MVNOs• Distribution from push to pull• Simplified operations, outsourced where possible
BASE2003
• Differentiated offer with multi-brands• Focus on customer segments and wholesale growth• Efficient distribution e.g. SIM-only, outsourcing• Efficiency through smart follower for new technology
E-Plus2005
• First-mover to tap attractive market segment• Leveraged wholesale partners across footprint• Prepared International MVNO roll-out
Wholesale2007
KPN Dow Jones Telco Index
1 Dow Jones Telco rebased to KPN share price of € 6.08 at 1 January 2003
37Challenger strategy: delivering profitable growth
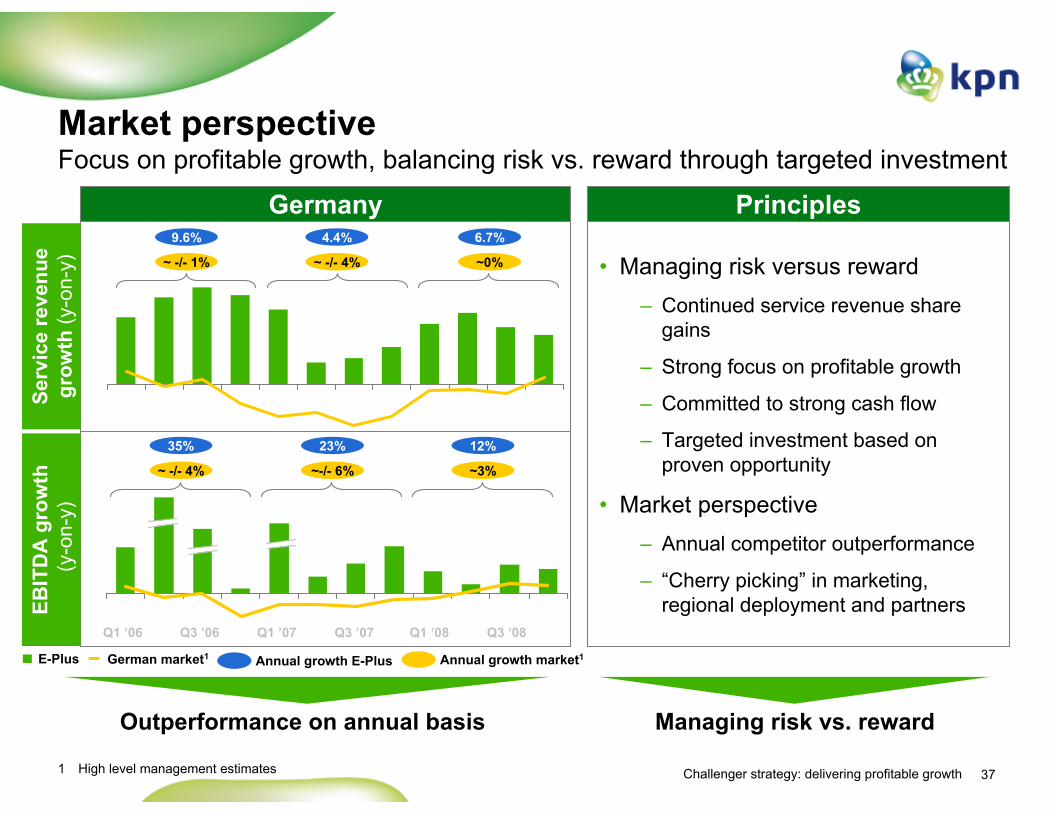
Market perspectiveFocus on profitable growth, balancing risk vs. reward through targeted investment
Germany Principles
• Managing risk versus reward– Continued service revenue share
gains
– Strong focus on profitable growth
– Committed to strong cash flow
– Targeted investment based on proven opportunity
• Market perspective– Annual competitor outperformance
– “Cherry picking” in marketing, regional deployment and partners
E-Plus German market1
Serv
ice
reve
nue
grow
th (y
-on-
y)
Q1 ’06 Q3 ’06 Q1 ’07 Q3 ’07 Q1 ’08 Q3 ’08
Managing risk vs. reward
1 High level management estimates
EBIT
DA
gro
wth
(y-o
n-y)
Outperformance on annual basis
6.7%9.6% 4.4%
12%35% 23%
Annual growth E-Plus Annual growth market1
~ -/- 4% ~-/- 6% ~3%
~ -/- 1% ~ -/- 4% ~0%

38Challenger strategy: delivering profitable growth
Macro-economic environment Various initiatives to proactively address changing economic environment
GDP % growth
Unemployment %
Source: International Monetary Fund
• Economic impact mainly on corporate market
– Little exposure for Int’l, no corporate presence
• Early signs of downturn in consumer market
– Less roaming due to less international travelling
– Customers optimizing within bundle
Limited impact
Proactive actions
• Strong positioning of value for money brands
• Propositions for ‘low income’ and unemployed
• Contingency plans for (MVNO) partnerships
• Selective marketing, low cost communication5%
10%
15%
20%
2005 2006 2007 2008 2009E 2010E
Germany Belgium Spain France
-6%
-4%
-2%
0%
2%
4%
2005 2006 2007 2008 2009E 2010EGermany Belgium Spain France

39Challenger strategy: delivering profitable growth
PrioritiesEffective execution to manage risks and maximize opportunities
• Optimizing international portfolio, focus on core assets & key strengths– Asset lifecycle management e.g. Sympac, Wholesale NL– Entry into new markets Spain and France with low cost MVNO model
• Selective “add-on” acquisitions to strengthen business profile– Strengthen distribution e.g. Allo Telecom, SMS Michel– Strengthen position in specific segments, e.g. Ortel, blau
• Clear governance structure with defined roles and responsibilities• Strengthen governance new entities, integration within Mobile International
– Right balance between entrepreneurial spirit vs. part of international organization
• Clear country focus with Germany, Belgium and Rest of the World• Ensure continuous insight available on key business metrics & aspects
• Ensure the right people are in the right place (people allocation)• Allocate investments to the right projects (capital allocation)
Portfolio
Governance
‘Reporting’
M&A
Allocation
• Manage risk versus reward– Continued service revenue share gains, with strong focus on profitability & cash flow– Targeted investment based on proven opportunity
Principles

40Challenger strategy: delivering profitable growth
Concluding remarks
• Leading Challenger & amongst most profitable # 3 operators
• Significant value created through Challenger model
• Committed to continued outperformance through profitable growth
• Proactively addressing / exploiting changing economic environment
• Effective execution to manage risks and maximize opportunities

41Challenger strategy: delivering profitable growth
Agenda
Eric Hageman, CEO International WholesaleInternational Wholesale
Stan Miller, CEO KPN Mobile InternationalConcluding remarks
Thorsten Dirks, CEO E-PlusE-Plus
Erik Hoving, CTO KPN Mobile International KPN Group Belgium
Eric Hageman, CFO KPN Mobile InternationalFinance
Stan Miller, CEO KPN Mobile InternationalStrategy
Marc van Asbroeck, Chief Legal & RegulationRegulation
Ad Scheepbouwer, Chairman and CEO KPNIntroduction

42Challenger strategy: delivering profitable growth
Key messages
• We use regulation competitively to improve our strategic position
• We strive for change because we have the flexibility and capability to use it for our good
• Regulation determines or restricts the telecoms sector, but as a Challenger we have used it to our benefit

43Challenger strategy: delivering profitable growth 43
Regulatory playing field in 2003European Challengers disadvantaged on all issues
• Abuse of dominance: not all parts of the market accessibleOverall
Regulatory strategy implemented to create level playing field
• Competitive issue at the wholesale level (alliances)Roaming
• Discrimination of 900 vs. 1800 MHzSpectrum
• Push towards symmetrical rates at high level (beneficial for incumbent)MTA
• Structural imbalance between first entrants and later entrants
• Political unwillingness to create regulatory level playing field
• Challengers have no weight in policy discussions
Regulatory playing field
Issues 2003
-/-
-/-
-/-
-/-
-/-
-/-
-/-
-/-
-/-
-/-
-/-
-/-
-/-
-/-

44Challenger strategy: delivering profitable growth 44
Market dynamics before Challenger strategyFailed implementation of the regulatory framework reinforced status quo
Market imbalance No market dynamics
• Special & exclusive rights enjoyed by first entrants
• Discrimination on frequencies
• Abuse of dominant position by first entrants
• Challengers’ aim to changing the regulatory playing field not heard
3%10% 13% 13% 13%
97%90% 87% 87% 87%
0%
20%
40%
60%
80%
100%
1999 2000 2001 2002 2003
9% 10% 12% 12% 12%
91% 90% 88% 88% 88%
0%
20%
40%
60%
80%
100%
2000 2001 2002 2003 2004M
arke
t rev
enue
shar
eM
arke
t rev
enue
shar
e
KPN Group BelgiumOther players
E-PlusOther players
Germany
Belgium
45Challenger strategy: delivering profitable growth
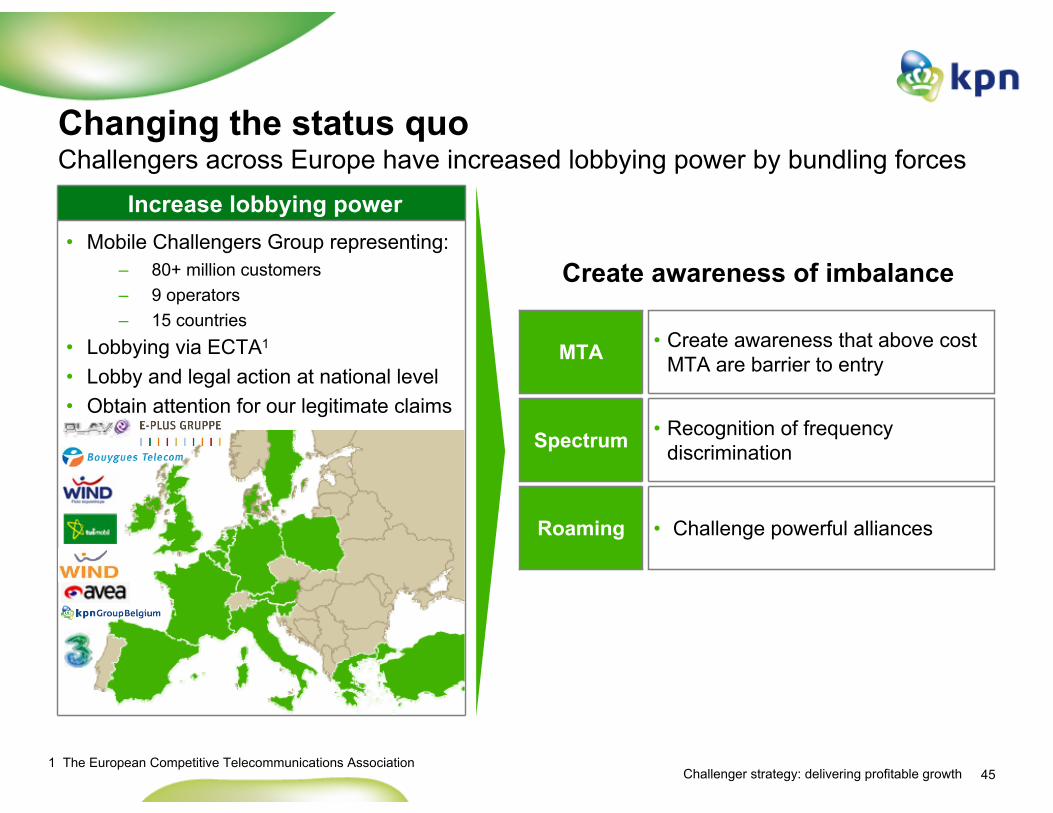
Changing the status quoChallengers across Europe have increased lobbying power by bundling forces
Increase lobbying power• Mobile Challengers Group representing:
– 80+ million customers– 9 operators – 15 countries
• Lobbying via ECTA1
• Lobby and legal action at national level• Obtain attention for our legitimate claims
1 The European Competitive Telecommunications Association
• Challenge powerful alliancesRoaming
• Recognition of frequency discriminationSpectrum
• Create awareness that above cost MTA are barrier to entryMTA
Create awareness of imbalance

46Challenger strategy: delivering profitable growth 46
MTA discussionChallengers demand asymmetry as logical outcome of scale differences
• Recognition that above cost MTAs are barriers for Challengers• Germany: some asymmetry has been maintained, while BNetZa wanted to abolish
it already in 2007• Belgium: suspension / annulment BIPT decision imposing symmetric rates
– Asymmetry increased in 2008
Status
• Asymmetrical glide path through minimizing the incumbent MTA– Removing the on-net effect– Removing the possibility of a price squeeze between MTA and (corporate) retail prices– Taking away excessive profits of large operators which they use against Challengers in
retail• Create level playing field
Goal
• Symmetry at high level as objective• Challengers not heard• German self-regulation is effectively a pseudo cartel
Issue
Commissioner Kroes on MTR recommendation: ‘The competition distortions are very real in the current situation. Smaller operators are at particular risk of being unfairly squeezed out of the market.’…. ‘The incumbents are using the termination market as a ‘cash cow’.’

47Challenger strategy: delivering profitable growth
• Enforce national asymmetric decrease during next years (via courts, incl. EU)
• Enforce Fixed-to-Mobile regulation to avoid competitive distortion
• Accepted arguments:– MTA is anti-competitive– Incumbents abuse MTA– Brussels court decision
on BIPT MTA
• New arguments:– Methodology is wrong– Discrimination– EU case law– Fixed-to-Mobile
Historic developments & going forwardProposal
0.05
0.10
0.15
0.20
0.25
47
MTA development & proposalEnforce immediate further decrease of first entrants’ MTA
0.05
0.10
0.15
0.20
BASEMobistarProximus
O2 & E-PlusT-Mobile & Vodafone€
€
Germany
Belgium2004 2010
2004 2009
Illustrative
2010
ChallengerIncumbentChallenger proposal

48Challenger strategy: delivering profitable growth
SpectrumMarket imbalance from discrimination being repaired
• Lobby for re-distribution in Germany, Belgium equal distribution of frequencies
Belgium:• 900-1800 MHz discrimination
recognized by regulator– Feb 2009: additional 900 MHz
frequencies awarded to KPN Group Belgium on a conditional basis
– Draft Royal Decree provides for more extensive frequency refarming as of 2011 or 2013
• Spectrum allocation now fairly balanced (although BASE still has fewer 900 MHz frequencies)
Germany: • 900 MHz frequencies received in 2006
– However still disadvantaged position in 900 MHz frequency band (5 MHz versus 12.5 MHz allocated to T-Mob and VOD)
• Re-distribution of 900 MHz spectrum prior to refarming of 900 MHz band
or• E-Plus and O2 get more frequencies in
800 MHz band than competitors
• Review of the GSM Directive, managed to get resolution on competitive aspects of frequency refarming (Reding)
• 900-1800 MHz discrimination between incumbents and Challengers
EU
Status
Issue
Goal
49Challenger strategy: delivering profitable growth
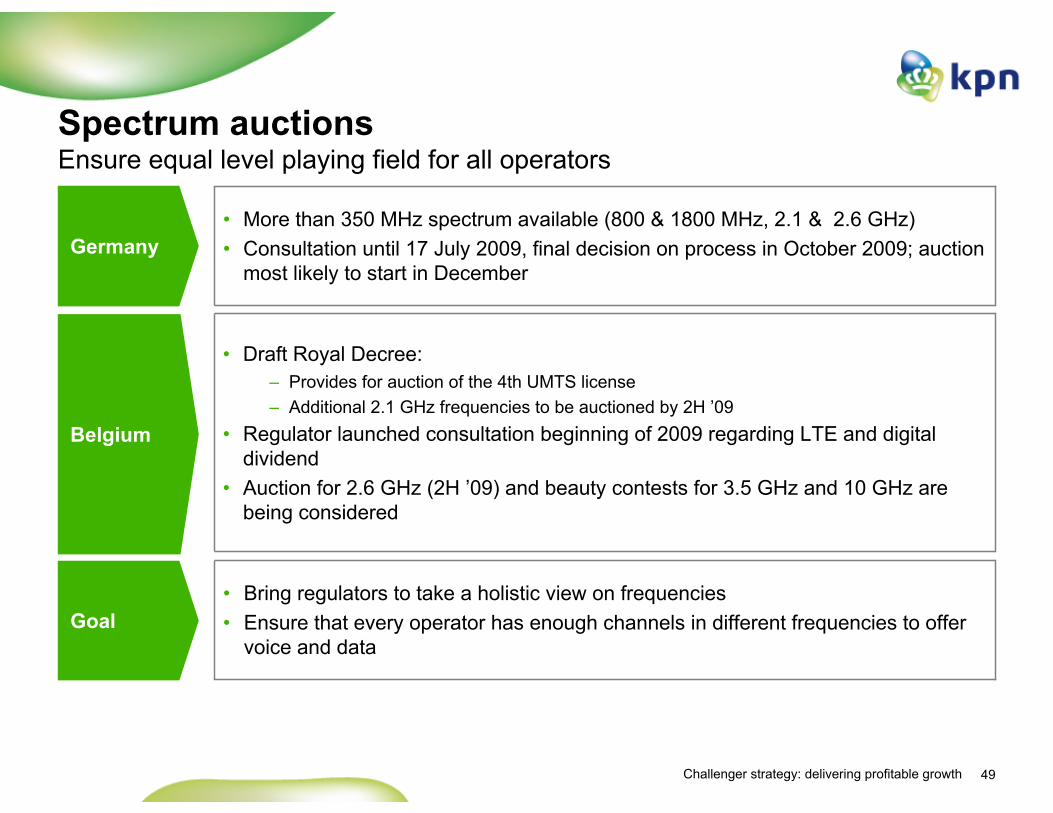
Spectrum auctionsEnsure equal level playing field for all operators
• Bring regulators to take a holistic view on frequencies • Ensure that every operator has enough channels in different frequencies to offer
voice and data
• Draft Royal Decree: – Provides for auction of the 4th UMTS license– Additional 2.1 GHz frequencies to be auctioned by 2H ’09
• Regulator launched consultation beginning of 2009 regarding LTE and digital dividend
• Auction for 2.6 GHz (2H ’09) and beauty contests for 3.5 GHz and 10 GHz are being considered
• More than 350 MHz spectrum available (800 & 1800 MHz, 2.1 & 2.6 GHz)• Consultation until 17 July 2009, final decision on process in October 2009; auction
most likely to start in DecemberGermany
Belgium
Goal

50Challenger strategy: delivering profitable growth
Roaming Different approach from incumbent operators
Roaming price caps in EU countries (€ ct / min or SMS, without VAT)
5080100n.a.n.a.Data roaming / MB
11n.a.n.a.Outgoing SMS
4n.a.n.a.SMS wholesale
1115192224Incoming calls
3539434649Outgoing calls
1822262830Wholesale rates
1 July 20111 July 20101 July 200930 August 200830 August 2007Effective as from
• Roaming alliances between large incumbents unfavourable for Challengers• KPN group companies squeezed in (corporate) retail market due to high
roaming wholesale rates • KPN not in favour of retail regulation• Ongoing lobby on the wholesale issue

51Challenger strategy: delivering profitable growth 51
Legal casesPending cases in support for Challengers
• Two complaints filed with BNetzA (no action)• Relevant market deregulated by BNetzA• Further action will be taken by E-Plus
Deutsche Telekom
F2M
• Court order against Belgacom to pass on MTA reduction• € 3 mn fine imposed by BIPT• Market still regulated with approval of Commission
BelgacomF2M
• Complaint with Commission – Bundeskartellamt• Collusion and abuse of joint dominance (on-net)• Case being investigated
T-Mobile &
Vodafone
• Price squeeze in corporate market (retail vs. MTA)• Dawn raid – prosecutor’s report: 5 indictments• € 66.3 mn fine imposed by Belgian Competition Authorities
Proximuscorporate
• € 1 bn claim for abuse of on-net• Provisional judgment (on-net & price squeeze)• Experts appointed – report expected September 2009
Proximuson-net Support for our
overall positioning as Challengers
Support for MTA case
Support for business (access to new markets)
Possible damages

52Challenger strategy: delivering profitable growth 52
Half-time score regulatory playing field in 2009European Challengers have achieved movement in the regulatory field
• Abuse of dominance: not all parts of the market accessible Overall
Regulatory strategy has started to pay-off, more is in the pipeline
• Competitive issue at the wholesale level (alliances)Roaming
• Discrimination 900 vs. 1800 MHZSpectrum
• Push towards symmetrical rates at high level (beneficial for incumbent)MTA
• Structural imbalance between first entrants and later entrants
• Political unwillingness to create regulatory level playing field
• Challengers have no weight in policy discussions
Regulatory playing field
Issues 2003+
+ +
+
+ +
+
+ +
+ +
+
+
+
+
+
+ +
+
53Challenger strategy: delivering profitable growth
Agenda
Eric Hageman, CEO International WholesaleInternational Wholesale
Stan Miller, CEO KPN Mobile InternationalConcluding remarks
Thorsten Dirks, CEO E-PlusE-Plus
Erik Hoving, CTO KPN Mobile InternationalKPN Group Belgium
Eric Hageman, CFO KPN Mobile InternationalFinance
Stan Miller, CEO KPN Mobile InternationalStrategy
Marc van Asbroeck, Chief Legal & RegulationRegulation
Ad Scheepbouwer, Chairman and CEO KPNIntroduction

54Challenger strategy: delivering profitable growth
Introduction
• KPN Group Belgium is a success story
• Delivering profitable growth ahead of the market since 2003 by doing things differently
• Values underpinning Challenger strategy are transparency, simplicity and honesty
• Confident in continued outperformance whilst delivering profitable growth
54
55Challenger strategy: delivering profitable growth 55
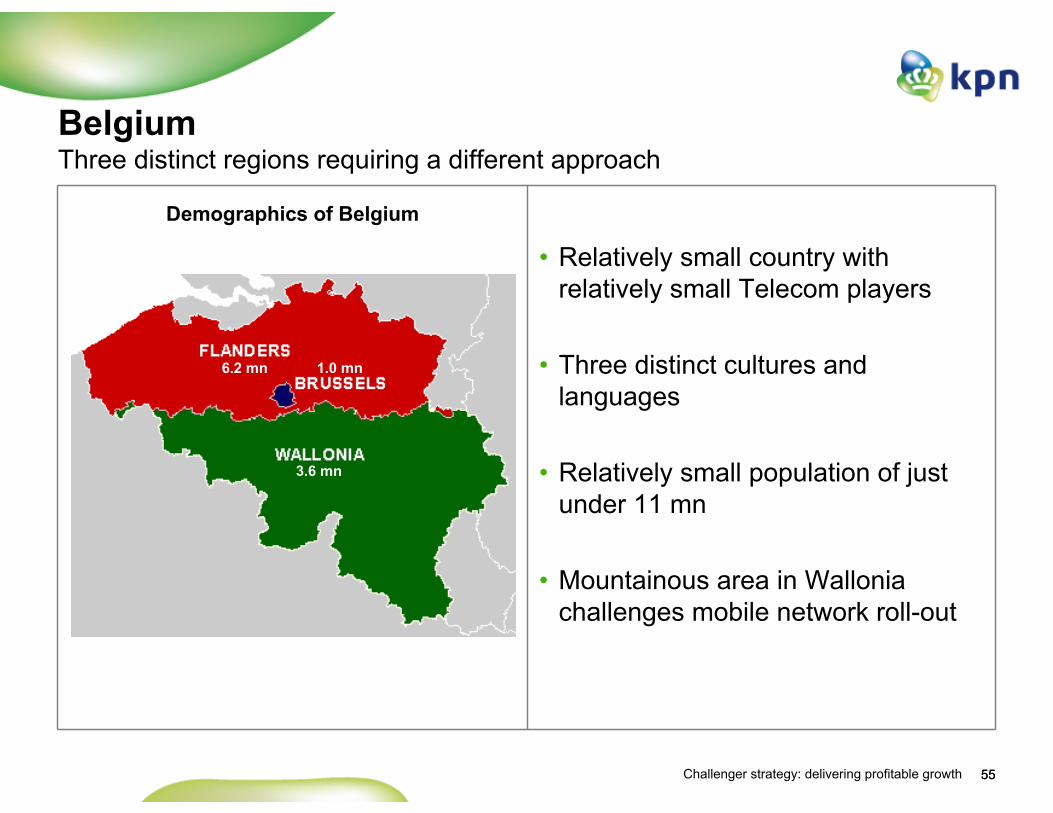
• Relatively small country with relatively small Telecom players
• Three distinct cultures and languages
• Relatively small population of just under 11 mn
• Mountainous area in Wallonia challenges mobile network roll-out
Demographics of Belgium
6.2 mn 1.0 mn
3.6 mn
BelgiumThree distinct regions requiring a different approach

56Challenger strategy: delivering profitable growth 56
Historic market trends in BelgiumRevenues stabilizing, continued growth in subscribers and minutes
• Belgium average price level is € 0.05 above European average
• Average usage at European average
• Continued growth in number of customers and minutes
– Driven by introduction of flat fees and aggressive promotions
– Increase in usage offset by regulation
Mobile Service revenues
Subscribers
€ bn
mn
3.32 3.74 3.99 4.04 3.89 3.83
2003 2004 2005 2006 2007 2008
+13%
8.2 8.8 9.2 9.8 11.0 12.1
2003 2004 2005 2006 2007 2008
Source: Equity research
MoU Belgium
147 151 153 155 157 160
2003 2004 2005 2006 2007 2008
+7% +1% -4% -2%
+7% +5% +7% +12% +10%
+3% +1% +1% +1% +2%

57Challenger strategy: delivering profitable growth
• Continued market outperformance with profitable growth
• Re-ignited growth in 2008 with positive impact of acquisitions
• Focus on Consumers, not Corporates
11.0%
33.7%29.7%
4.4% 6.5%
-2.3%
12.6%
-2% -1%
6%5%
7%
1%-4%
2003 2004 2005 2006 2007 2008 Q1 '09
KPN Group Belgium
14%
28%
37%42%
38% 37%
57
Performance KPN Group BelgiumContinued market outperformance on all key metrics
Customer growth
EBITDA and margin
mnService revenue growth (y-on-y)
204 240230264
11948
2003 2004 2005 2006 2007 2008EBITDA marginEBITDA
Belgian market
1.31.6
2.0
2.9
3.4
2.4
2003 2004 2005 2006 2007 2008
Source: Equity research and Company results
€ mn

58Challenger strategy: delivering profitable growth
Market shares 2003 Market shares 2008
58
Targeting 20-25% service revenue market share in next few yearsEBITDA margin of at least 35%
KPN Group Belgium going forwardConfident in continued outperformance in Belgium
+11%+7%+9%
KPN Group Belgium market share growth
70%60%
53%
27%31%
32%
3%9%15%
Customers Servicerevenues
EBITDA
51%49%45%
35%35%31%
14%16%24%
Customers Servicerevenues
EBITDA

59Challenger strategy: delivering profitable growth
Challenger strategyTactics for delivering profitable growth
Sample of some of the tactics
• Maximize return on existing assets
• Selective, low risk investments in new technology
• Expand voice target regions based on proven concept
• Monetize leading position in voice to build data position
• Leverage proven business models to new markets
• Build partnerships with new entrants
• Mobile share of voice on EU average, further upside
• Voice remains dominant over data for the next years
Smart technology
follower
Regionalization
Wholesale & Partnerships
Fixed-Mobile Substitution
A
B
C
D
Position around
customers
Create customer pull
Establish partnerships
Introduce profit-
maximizing value chains
Strategic cornerstones

60Challenger strategy: delivering profitable growth 60
Building BASE brand by transparent, simple and honest positioning
• BASE brand launched in 2002
• Maximizing brand awareness at lowest marketing costs
• Re-launch in April ’09 going back to values and with simplified tariff plans
• Sales force re-educated for simplification− Four simple questions to determine best
tariff plan for customer
• BASE positioning around customer− Best prices− Simple and easy comparison− Flexible options
Used mobile video booth to film ‘real’people and select new BASE faces
BASE re-launch campaign on partner TV and radio channels, using testimonials of real customers
A

61Challenger strategy: delivering profitable growth
DistributionStrong position in distribution via own channels in addition to wholesale partners
61
• Partner brands distributed via over 1,000 retail outlets in Belgium• Carrefour, Medion MobilePartners
Channels Comments
Shops• Number of shops up from 44 in 2005 to 54
shops in Q1 ’09 on AAA locations• Extending BASE experience• Focus on up-selling and servicing
• Acquisition of 63 shops on AA locations• Low-end acquisition allowing for
Pre Paid to Post Paid migration
• ~80% of shops in Wallonia• Increasing shop presence in ‘second
tier’ cities in Wallonia• Best deal / good handset prices
Chains • ThePhoneHouse / BelCompany • High-end acquisition with customers attracted by fanciest handsets
Dealers• Independent and small chains such as
local Telco or tobacco shops • Local network, cultural focus
Online• Currently only recharges• Talk plans under development
• Customers sensitive to price and convenience
A
62Challenger strategy: delivering profitable growth 62
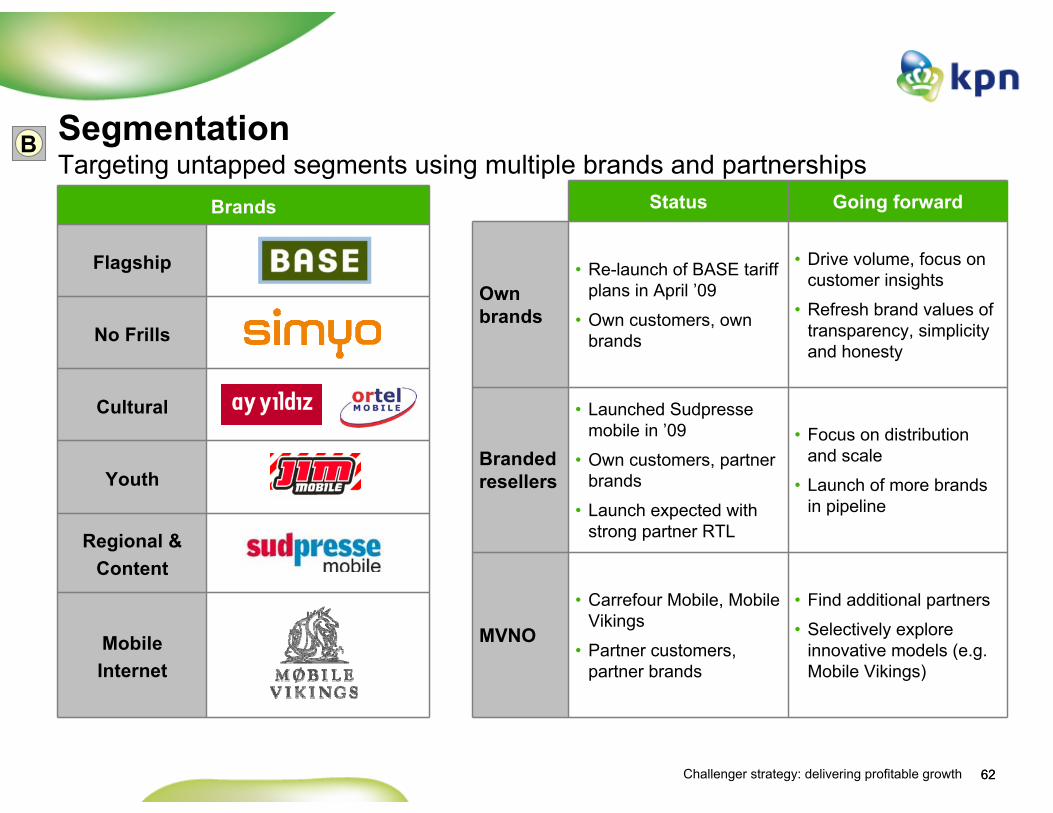
Segmentation Targeting untapped segments using multiple brands and partnerships
Status Going forward
Own brands
• Re-launch of BASE tariff plans in April ’09
• Own customers, own brands
• Drive volume, focus on customer insights
• Refresh brand values of transparency, simplicity and honesty
Branded resellers
• Launched Sudpressemobile in ’09
• Own customers, partner brands
• Launch expected with strong partner RTL
• Focus on distribution and scale
• Launch of more brands in pipeline
MVNO
• Carrefour Mobile, Mobile Vikings
• Partner customers, partner brands
• Find additional partners
• Selectively explore innovative models (e.g. Mobile Vikings)
Brands
Flagship
No Frills
Cultural
Youth
Regional & Content
Mobile Internet
B

63Challenger strategy: delivering profitable growth 63
Partnerships examples Targeting specific groups with brands familiar to the customer
• Partnership with VMMA since 2003
• Cheap SMS attracts young people, even in French (non-targeted) speaking part of country
• Solid growth: >500k customers; owned by KPN Group Belgium
• Centralised around ‘Joeri’ personality, created for brand recognition
• Leveraging on-net communities, e.g. high schools
Call for free during ‘party hours’ at weekends
• Partnership with RTL Belgium since March ’09, brand launch expected in mid 2009
• Strong partner in targeting Wallonia with trusted brand and competitive offer
• Access to mobile content of RTL TVI and Bel RTL
• Offer centered around ‘The world of RTL’
• Clear visibility of brand in own shops
B
64Challenger strategy: delivering profitable growth
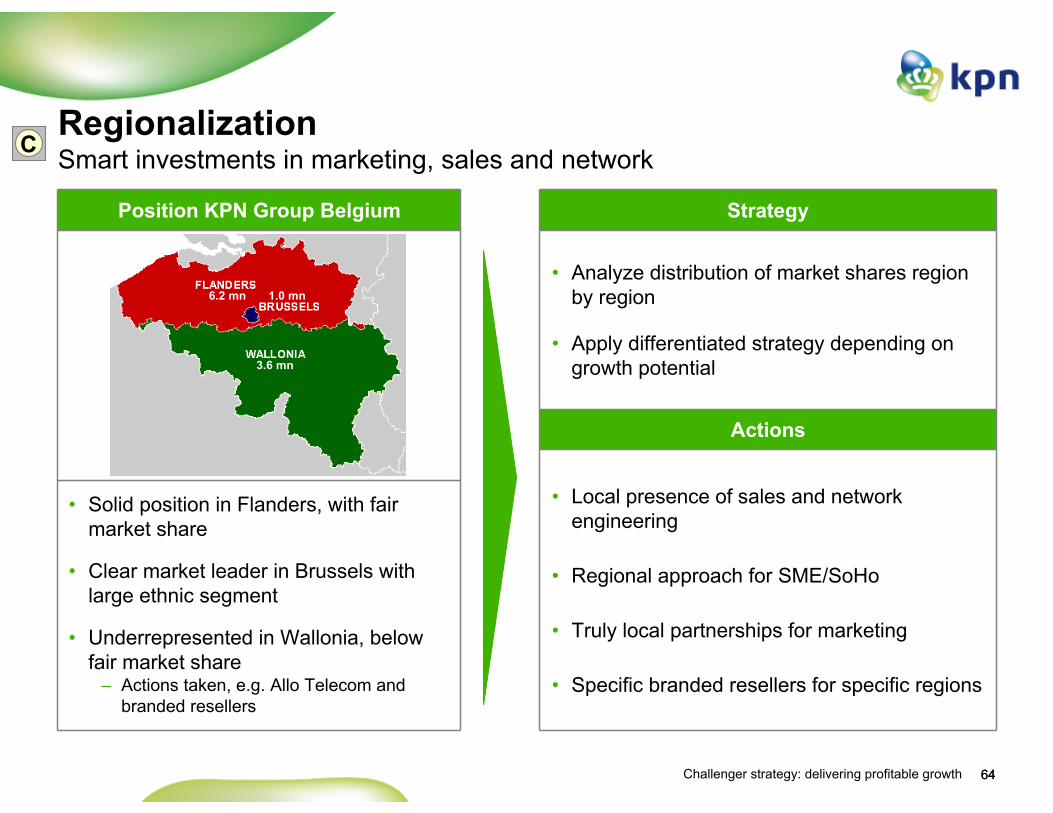
Position KPN Group Belgium
Regionalization Smart investments in marketing, sales and networkC
6.2 mn 1.0 mn
• Solid position in Flanders, with fair market share
• Clear market leader in Brussels with large ethnic segment
• Underrepresented in Wallonia, below fair market share
– Actions taken, e.g. Allo Telecom and branded resellers
3.6 mn
64
Strategy
• Analyze distribution of market shares region by region
• Apply differentiated strategy depending on growth potential
Actions
• Local presence of sales and network engineering
• Regional approach for SME/SoHo
• Truly local partnerships for marketing
• Specific branded resellers for specific regions

65Challenger strategy: delivering profitable growth
• Non-SMS data in Belgium lagging behind due to absence of handset subsidies resulting in slow uptake of expensive smart-phones
• EDGE covers large majority of consumer data need
• Network deployment EDGE / HSPA following expected handset uptake
Data development in BelgiumDelay in non-SMS data uptake and in 3G handset adaptation compared to EU
Non-SMS data as % of total market size
20082005
< 1% 6%
Handset development
0
25
50
75
100
2007 08 09 10 11 12 13
% h
ands
ets
(inst
alle
d ba
se)
HSPA
57%35%12%3G or better
UMTS
EDGE
GPRS
GSMonly
65
D
94%99%
43%65%88%EDGE or less
13E12E11E10E09E0807
Source: Industry research

66Challenger strategy: delivering profitable growth
Bandwidth needed for good mobile user experiences Comments
• Email, instant messaging, social networking account for 40 - 60% of data usage
• 10 - 20% of usage for Web-browsing, increasing due to improved devices
• KPN Group Belgium focuses on Consumers, not Corporates
66
64
256
32
512
128
512
512
2,048
3,072
E-mail (150KB attachment)
E-mail (2MB attachment)
Instant messaging
Web-browsing
Gaming
Audio streaming
Music download (track / CD)
Video clip download
Video streaming (SD / HD)
Compressed DVD download
256
1,024
8,192
EDGE UMTS HSPA LTE
Mobile data applicationsEDGE currently sufficient for majority of applications used by consumersD
Source: Industry research
EDGE bandwidth currently sufficient for majority of consumer applications
(kB)

67Challenger strategy: delivering profitable growth
Selective roll-out of data network Network roll-out based on those services that consumers want
Strategy Technology Approach
• Smart follower in wireless data– KPN Group Belgium targeting consumer and SME /
SoHo segments with value offers– Combination of EDGE and targeted HSPA sufficient
to meet demand of mass market
• Phased data network roll-out in Belgium– National EDGE coverage meets current data demand– Efficiently deploy UMTS to meet license requirements– HSPA in hot-spots with strong demand
• Regulatory development– Potential regulation on signal strength delayed– Spectrum increased with additional frequencies by
government
EDGE
• National GPRS / EDGE coverage in place
• Best coverage in 3 out of 5 regions
HSPA• Roll-out where demand
exists• Leading coverage in focus
cities and key hotspots
67
D
Smart technology follower
68Challenger strategy: delivering profitable growth
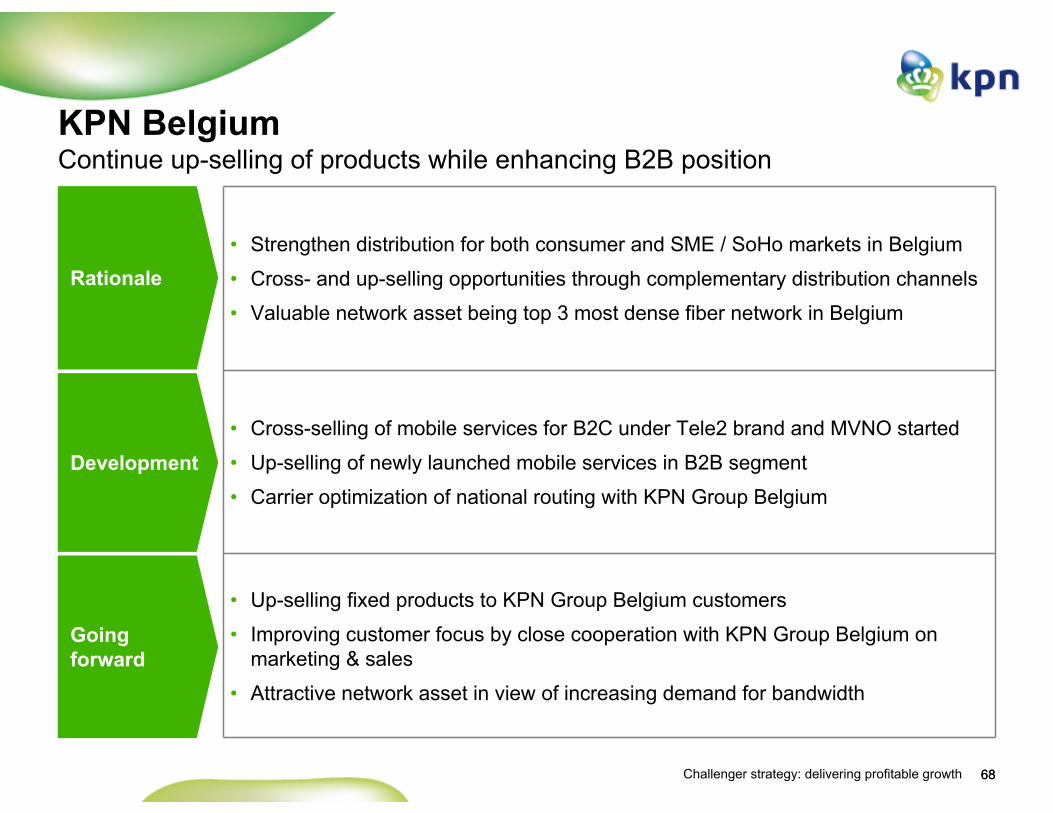
• Strengthen distribution for both consumer and SME / SoHo markets in Belgium
• Cross- and up-selling opportunities through complementary distribution channels
• Valuable network asset being top 3 most dense fiber network in Belgium
• Cross-selling of mobile services for B2C under Tele2 brand and MVNO started
• Up-selling of newly launched mobile services in B2B segment
• Carrier optimization of national routing with KPN Group Belgium
• Up-selling fixed products to KPN Group Belgium customers
• Improving customer focus by close cooperation with KPN Group Belgium on marketing & sales
• Attractive network asset in view of increasing demand for bandwidth
Rationale
Development
Going forward
KPN BelgiumContinue up-selling of products while enhancing B2B position
68

69Challenger strategy: delivering profitable growth
Concluding remarks
• Delivering profitable growth ahead of the market since 2003
• Continue to focus BASE brand on transparency, simplicity and honesty
• Targeting untapped segments using multiple brands and wholesale partnerships
• Strong position in distribution via own channels in addition to wholesale partners
• Smart technology follower, HSPA network roll-out where demand exists
• Confident in continued outperformance, clear focus on EBITDA and cash flow– Targeting 20-25% service revenue market share in next few years– EBITDA margin of at least 35%
69
70Challenger strategy: delivering profitable growth
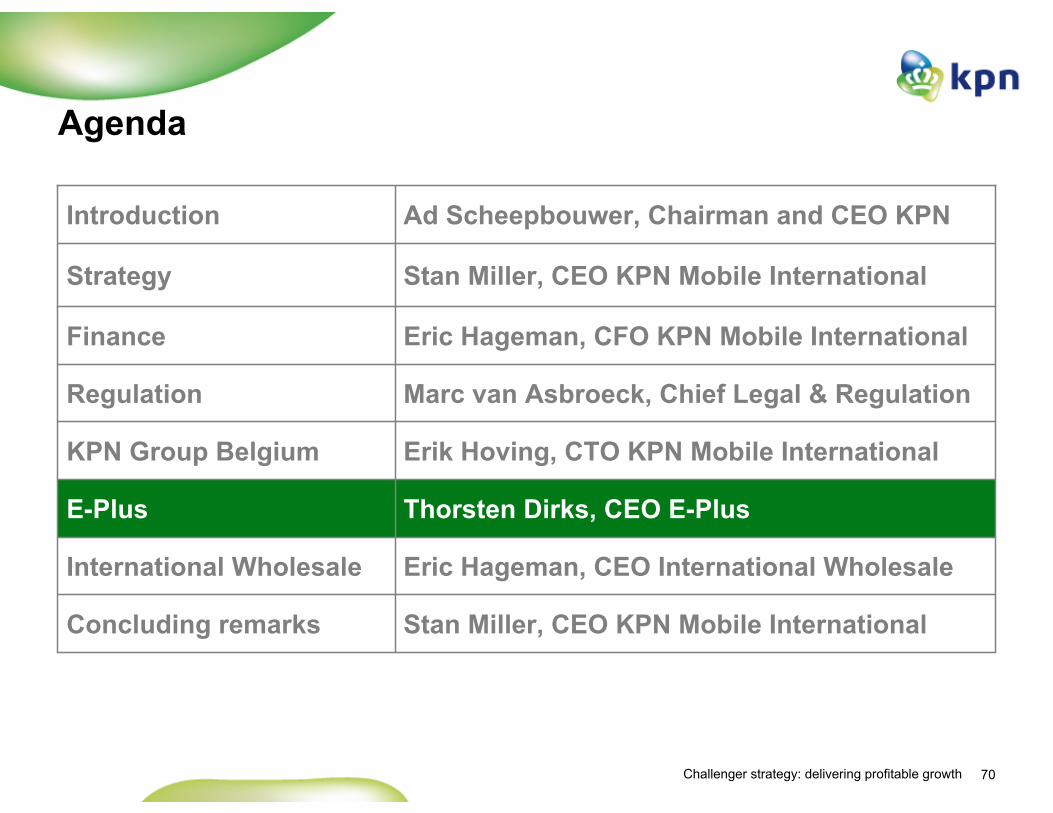
Agenda
Eric Hageman, CEO International WholesaleInternational Wholesale
Stan Miller, CEO KPN Mobile InternationalConcluding remarks
Thorsten Dirks, CEO E-PlusE-Plus
Erik Hoving, CTO KPN Mobile International KPN Group Belgium
Eric Hageman, CFO KPN Mobile InternationalFinance
Stan Miller, CEO KPN Mobile InternationalStrategy
Marc van Asbroeck, Chief Legal & RegulationRegulation
Ad Scheepbouwer, Chairman and CEO KPNIntroduction

71Challenger strategy: delivering profitable growth
Key messages
• Delivering profitable growth ahead of the market since 2005
• Further upside potential for proven Challenger strategy
• Strong position in both wholesale and retail segments
• Leveraging potential of regional approach
• Best value-for-money proposition for mobile data

72Challenger strategy: delivering profitable growth
Historic market trends in GermanyMarket growth almost flat, continued growth in subscribers
• Continued growth in number of customers and minutes
– Driven by Fixed-Mobile substitution– Usage still below European average
• Historic market growth in Germany mid-single digit decline to flat
– Increase in usage offset by regulation
Revenues mobile telecommunications services
Total minutes
Subscribers
€ bn bn
mn
23.1 22.6 22.1 22.1
2006 2007 2008 2009
-2% -2% flat
86 97 107 110
2006 2007 2008 2009
13%10% 3%
5776 84 90
2006 2007 2008 2009
33%11%
7%
1 Management estimates for 2009
1
1
1

73Challenger strategy: delivering profitable growth
Performance E-PlusContinued market outperformance on all key metrics
SAC / SRCEBITDA and margin€ mn €
Service revenue growth
4.1%6.7%
4.4%
9.6%
4.3%
-1%-4%
0% 0%
4%
2005 2006 2007 2008 Q1 '09German market1E-Plus
1 Management estimates
18.017.814.8
12.710.7
2005 2006 2007 2008 Q1 '09
Customer basemn
Average18% growth/yr
322
1,2451,113905
673
31.3%37.6% 38.7% 41.6%
23.8%
2005 2006 2007 2008 Q1 '09
525276
90
148
2005 2006 2007 2008 Q1 '09
Down 65% since 2005
74Challenger strategy: delivering profitable growth
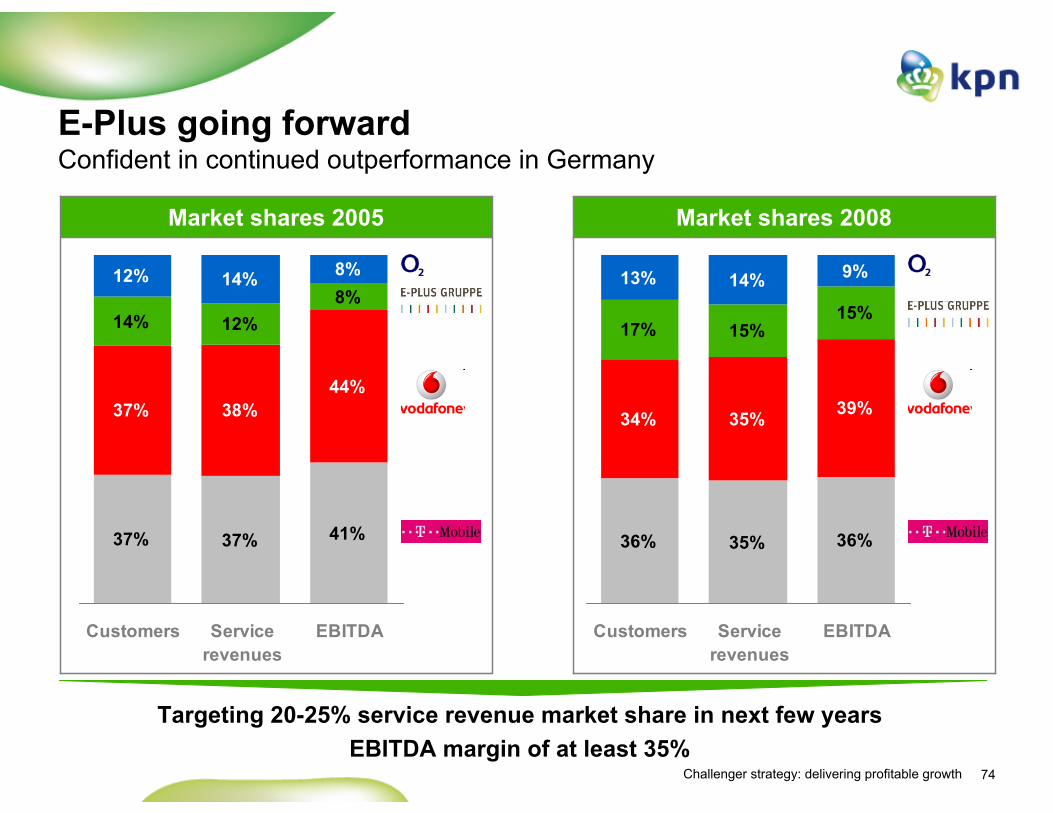
Market shares 2008Market shares 2005
E-Plus going forwardConfident in continued outperformance in Germany
37% 37% 41%
37% 38%44%
14% 12%8%
12% 14% 8%
Customers Servicerevenues
EBITDA
36% 35% 36%
34% 35% 39%
17% 15%15%
13% 14% 9%
Customers Servicerevenues
EBITDA
Targeting 20-25% service revenue market share in next few yearsEBITDA margin of at least 35%
75Challenger strategy: delivering profitable growth
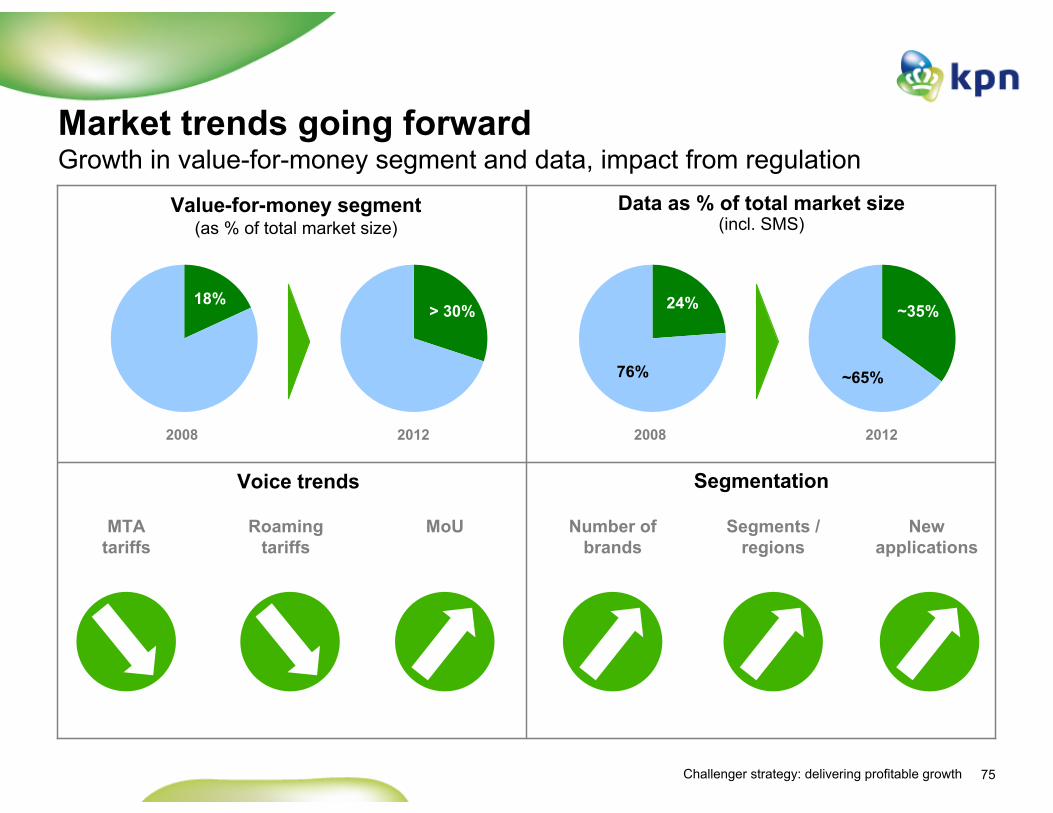
Market trends going forwardGrowth in value-for-money segment and data, impact from regulation
Data as % of total market size(incl. SMS)
Value-for-money segment(as % of total market size)
SegmentationVoice trends
2012
MTAtariffs
Roaming tariffs
MoU Number of brands
Segments / regions
New applications
2008
18%> 30%
20122008
24% ~35%
76% ~65%

76Challenger strategy: delivering profitable growth
Challenger strategyTactics for delivering profitable growth
Sample of some of the tactics
• Maximize return on existing assets
• Selective, low risk investments in new technology
• Expand voice target regions based on proven concept
• Monetize leading position in voice to build data position
• Leverage proven business models to new markets
• Build partnerships with new entrants
• Mobile share of voice still low, significant untapped potential
• Voice remains dominant over data for the next years
Smart technology
follower
Regionalization
Wholesale & Partnerships
Fixed-Mobile Substitution
A
B
C
D
Position around
customers
Create customer pull
Establish partnerships
Introduce profit-
maximizing value chains
Strategic cornerstones

77Challenger strategy: delivering profitable growth
• Rapid growth in data traffic, on top of continued growth in SMS per user
• Stimulated by flat rate offers for ‘light’data
Data
• Usage growth driven by attractive pricing and Fixed-Mobile substitution
• No-frills offers and on-net offersPre Paid
• Usage above market average• Flat rate offers, no-frills offers and on-
net offersPost Paid
Fixed-Mobile substitution Usage above market average, driven by Fixed-Mobile substitution
135 192 252 281 281
2005 2006 2007 2008 Q1 '09
Minutes of Usemin
Minutes of Usemin
Data traffic (excl. SMS)data volume
2005 2006 2007 2008 2009
+70%
+260%1100%
A
21 32 45 55 60
2005 2006 2007 2008 Q1 '09
78Challenger strategy: delivering profitable growth
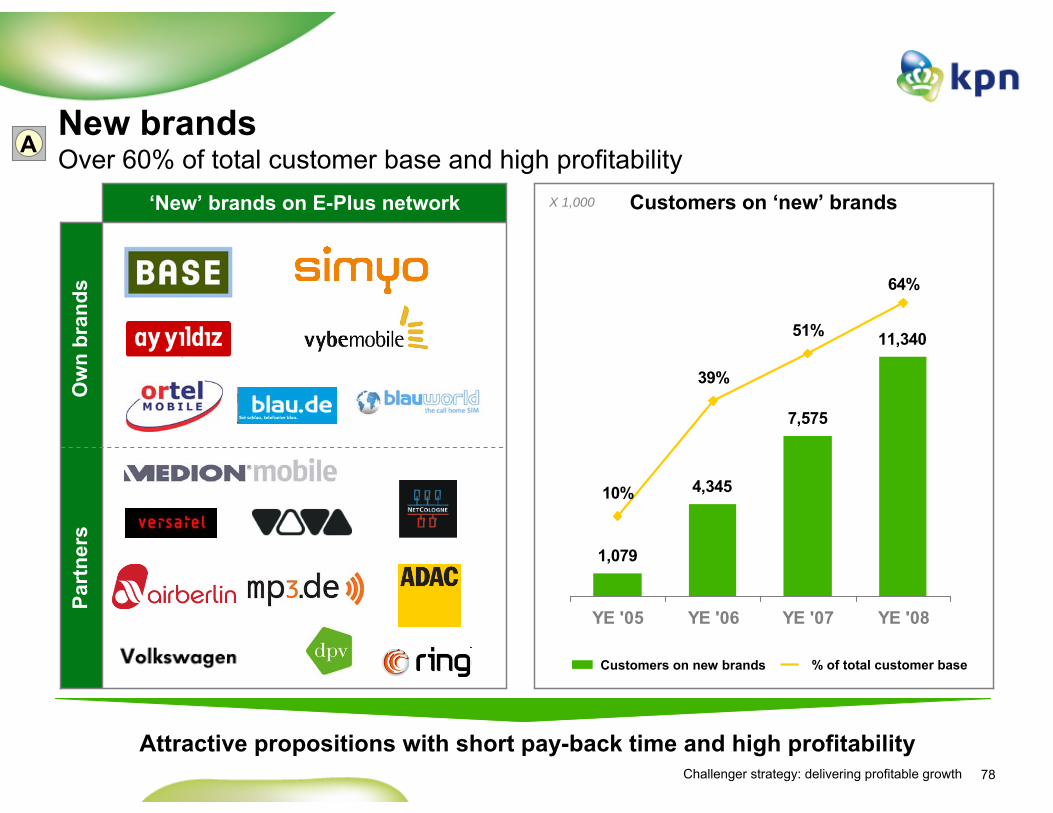
‘New’ brands on E-Plus network
New brandsOver 60% of total customer base and high profitability
Customers on ‘new’ brandsX 1,000
11,340
7,575
4,345
1,079
10%
39%
51%
64%
YE '05 YE '06 YE '07 YE '08
% of total customer baseCustomers on new brands
Attractive propositions with short pay-back time and high profitability
Ow
n br
ands
Part
ners
A
79Challenger strategy: delivering profitable growth
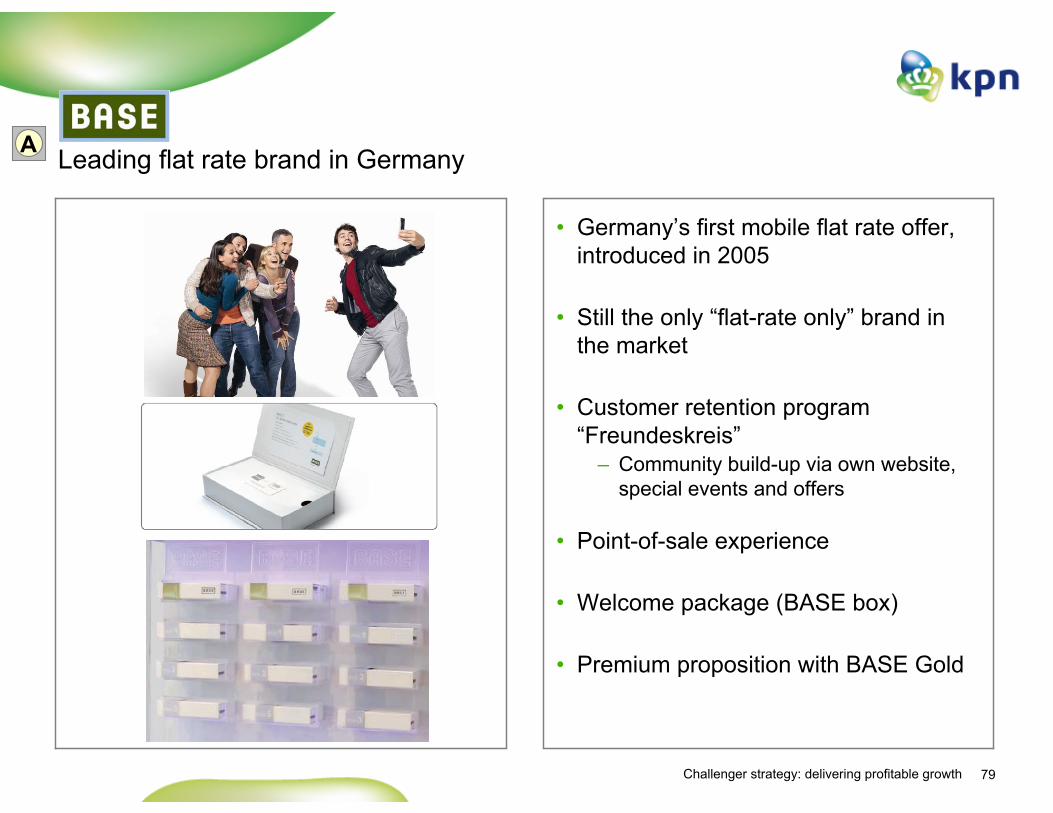
Leading flat rate brand in Germany
• Germany’s first mobile flat rate offer, introduced in 2005
• Still the only “flat-rate only” brand in the market
• Customer retention program “Freundeskreis”
– Community build-up via own website, special events and offers
• Point-of-sale experience
• Welcome package (BASE box)
• Premium proposition with BASE Gold
A
80Challenger strategy: delivering profitable growth
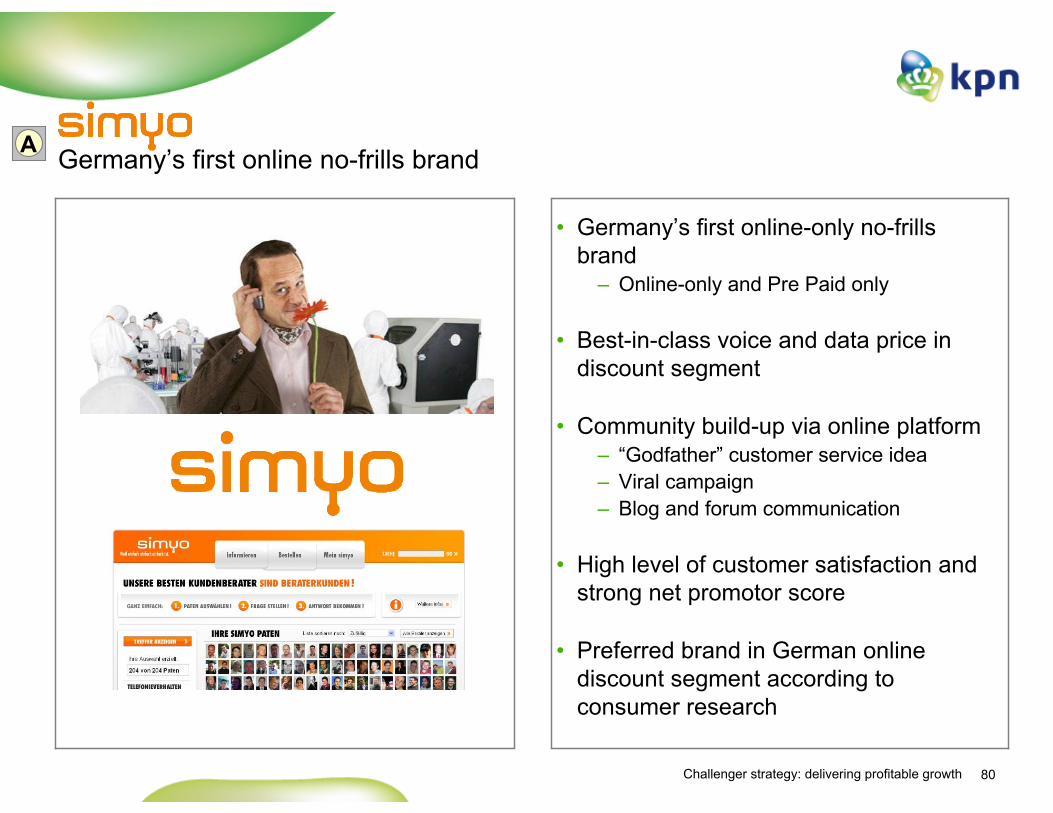
Germany’s first online no-frills brand
• Germany’s first online-only no-frills brand
– Online-only and Pre Paid only
• Best-in-class voice and data price in discount segment
• Community build-up via online platform– “Godfather” customer service idea– Viral campaign– Blog and forum communication
• High level of customer satisfaction and strong net promotor score
• Preferred brand in German online discount segment according to consumer research
A

81Challenger strategy: delivering profitable growth
• Net Promotor Score (NPS) for E-Plus brands substantially higher than competitor brands
– Customers that would recommend product to others
– Relatively few customers not satisfied with service
• Result of E-Plus offering tariffs and services that meet customer needs
• High customer satisfaction supporting community build-up
Customer satisfactionCustomer satisfaction substantially above market average A
Customer satisfaction(Net promotor score, NPS)
very satisfied not satisfied
Best Competitor
Source: E-Plus Gruppe, 2008
5460
51
44
64 3
5
82Challenger strategy: delivering profitable growth
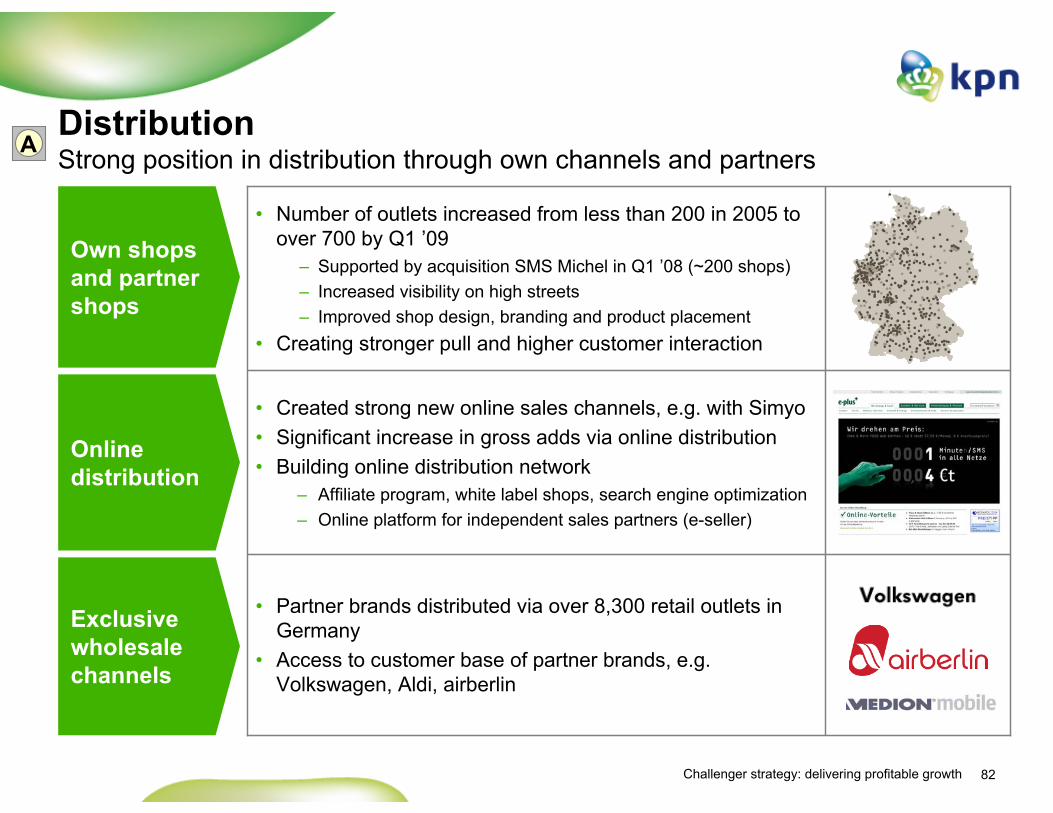
DistributionStrong position in distribution through own channels and partners
Own shops and partner shops
Online distribution
Exclusive wholesale channels
• Partner brands distributed via over 8,300 retail outlets in Germany
• Access to customer base of partner brands, e.g. Volkswagen, Aldi, airberlin
• Created strong new online sales channels, e.g. with Simyo• Significant increase in gross adds via online distribution• Building online distribution network
– Affiliate program, white label shops, search engine optimization– Online platform for independent sales partners (e-seller)
• Number of outlets increased from less than 200 in 2005 to over 700 by Q1 ’09
– Supported by acquisition SMS Michel in Q1 ’08 (~200 shops)– Increased visibility on high streets– Improved shop design, branding and product placement
• Creating stronger pull and higher customer interaction
A
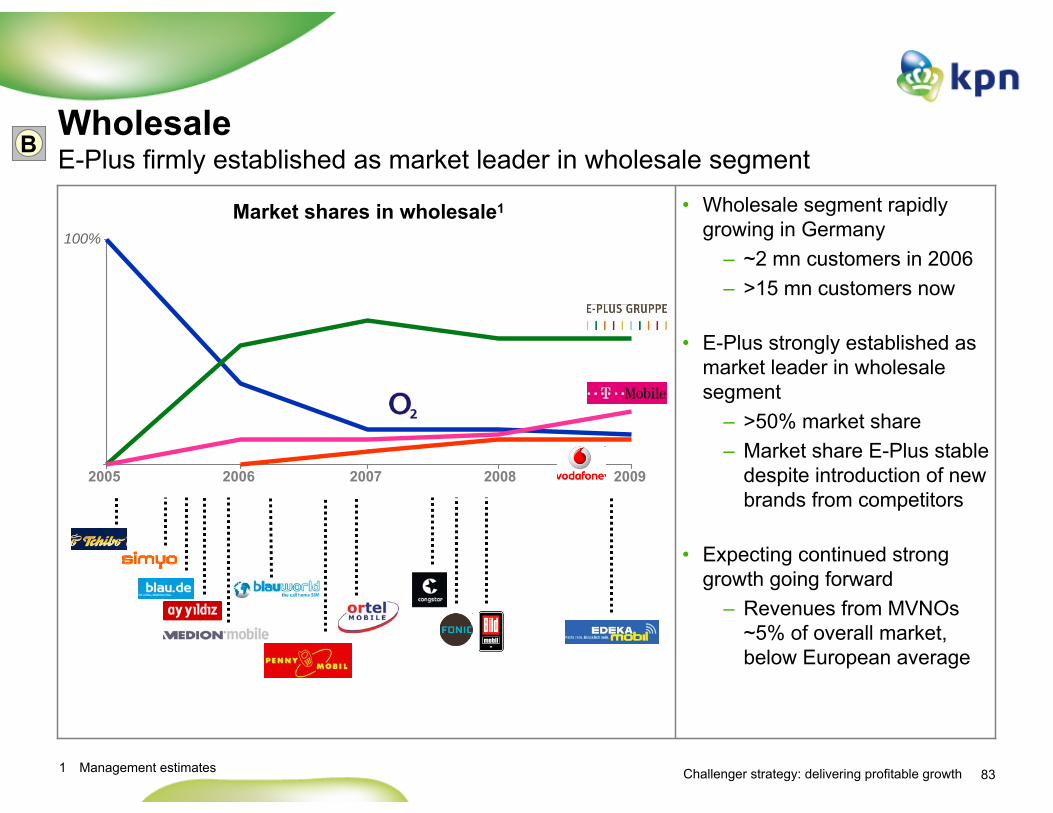
83Challenger strategy: delivering profitable growth
• Wholesale segment rapidly growing in Germany
– ~2 mn customers in 2006– >15 mn customers now
• E-Plus strongly established as market leader in wholesale segment
– >50% market share– Market share E-Plus stable
despite introduction of new brands from competitors
• Expecting continued strong growth going forward
– Revenues from MVNOs~5% of overall market, below European average
Wholesale E-Plus firmly established as market leader in wholesale segment
2005 2006 2007 2008 2009
Market shares in wholesale1
100%
1 Management estimates
B

84Challenger strategy: delivering profitable growth
Segmentation going forwardIntroducing new propositions and starting new partnerships
• Cooperation with WiFi provider FON• Access to WiFi connections shared with other users
– Over 25,000 FON WiFi hotspots in Germany
• Expanding into SME / SoHo segment• Introduction of Yes Telecom in Germany
– Value-for-money mobile services for SME / SoHo– Already successful in the Netherlands
• Partnerships with German sports clubs• Partnership with Disney targeting youth segments
• Introduction of data flat rates in new segments and new distribution channels
SME / SoHo
Data flat rates
Special interest
WiFi / Online offers
B
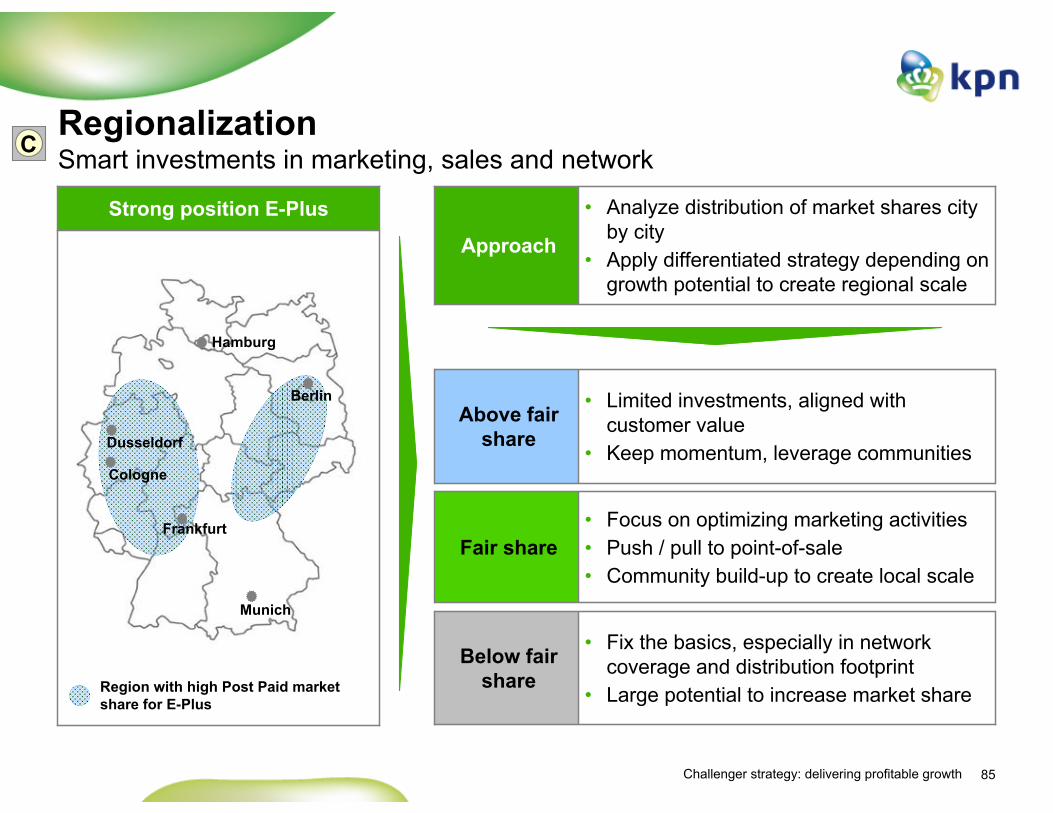
85Challenger strategy: delivering profitable growth
Strong position E-Plus
Regionalization Smart investments in marketing, sales and network
• Analyze distribution of market shares city by city
• Apply differentiated strategy depending on growth potential to create regional scale
Approach
• Fix the basics, especially in network coverage and distribution footprint
• Large potential to increase market share
Below fair share
• Focus on optimizing marketing activities• Push / pull to point-of-sale• Community build-up to create local scale
Fair share
• Limited investments, aligned with customer value
• Keep momentum, leverage communities
Above fair share
C
Munich
Berlin
Dusseldorf
Frankfurt
Hamburg
Cologne
Region with high Post Paid market share for E-Plus

86Challenger strategy: delivering profitable growth
• Consumers mainly use ‘light’ data applications on smartphones
• Consumers have a preference for flat fees
• Data tariffs E-Plus focus on mass market
– Flat rates and target group segmentation
– € 10 / month for wireless data on handsets
– € 1 / month for access to top-3 content
Wireless dataConsumers mainly use ‘light’ data and prefer flat rates
Preferred tariff plans
flat rate
time
uncertain
volume67%
Source: Consumer research
D
Drivers behind data usage (%)
55%
43%
36%
24%
17%
Communication
Information
Transactions
Social networks
Entertainment

87Challenger strategy: delivering profitable growth
Wireless data (cont’d)Consumers satisfied with services, data usage expected to take off
• Bandwidths offered sufficient for current ‘light’ data usage on handsets
• Different requirements and usage patterns for corporate markets
– Less relevant for E-Plus, as a result of focus on consumer and SME / SoHo segments
• Demand for wireless data taking off in German consumer market
– Substantial growth expected in near future
– Data no longer in early adopter phase, but becoming mass market proposition
Data usage patterns (% of users)
D
32%
2%
9%
8% 13%
14%
25%
10%MMS
Navigation
Internet / WAP
Today’s usage Usage near future
Satisfied
Slightly disappointed
Unsatisfied62%
*Phone users, no stationary laptop usage
Satisfaction bandwidths for handset use*
Source: Consumer research

88Challenger strategy: delivering profitable growth
Data network roll-outE-Plus network roll-out based on those services that consumers want
• Smart follower in wireless data– Investing in data networks now
demand is taking off– Benefiting from increased capabilities
for equipment and lower costs– Combination of EDGE and UMTS
sufficient to meet demand of mass market
• Phased data network roll-out in Germany
– National EDGE coverage meets current data demand
– Gradual UMTS roll-out with regionalization approach
– HSPA in regions with strong demand
Smart follower strategy ApproachTechnology
• Co-operation with provider FON for WiFi accessWiFi / WLAN
• Rolling out in focus cities and key hotspotsHSPA
• > 60% population coverage per Q1 ’09 UMTS
• EDGE roll-out in 2009 to 90% pop coverageEDGE
• National coverage in placeGPRS
D

89Challenger strategy: delivering profitable growth
Concluding remarks
• Delivering profitable growth ahead of the market since 2005
• Further upside potential for proven Challenger strategy
• Strong position in both wholesale and retail segments
• Leveraging potential of regional approach
• Best value-for-money proposition for mobile data
• Confident in continued outperformance, clear focus on EBITDA and cash flow– Targeting 20-25% service revenue market share in next few years– EBITDA margin of at least 35%

90Challenger strategy: delivering profitable growth
Agenda
Eric Hageman, CFO KPN Mobile InternationalFinance
Stan Miller, CEO KPN Mobile InternationalConcluding remarks
Eric Hageman, CEO International WholesaleInternational Wholesale
Thorsten Dirks, CEO E-PlusE-Plus
Marc van Asbroeck, Chief Legal & RegulationRegulation
Stan Miller, CEO KPN Mobile InternationalStrategy
Erik Hoving, CTO KPN Mobile International KPN Group Belgium
Ad Scheepbouwer, Chairman and CEO KPNIntroduction

91Challenger strategy: delivering profitable growth
Leverage own international brands (e.g. Simyo, Ortel, blau)
Overview Organization built across markets, leverage international partners and own brands
• Launched 2005• Leading wholesaler
Network
Own brands
Germany
Wholesale
• Launched 2003
• Leading wholesaler
Belgium
Network
Own brands
Wholesale
• Launched 2008• Leading MVNO
Spain
Wholesale
Own brands
• Launched 2009
France
Wholesale
Own brands
Netherlands
Network
Own brands
Wholesale
• Launched 2002• Leading wholesaler
Organization built across markets, international platform and know how
Leverage international wholesale partners

92Challenger strategy: delivering profitable growth
Lean operating
model
Wholesale / new
distribution
Multiple segment
marketing
Attractive propositions
Regulatory action
• Build leanest and most profitable operator in all our markets
• Wholesale, diversified distribution to drive scale at attractive economics
• Focus on value offerings with Fixed-Mobile Substitution approach
• Address individual segments directly or through wholesale partners
• Ensure level playing field between challengers and incumbents
Wholesale focus
Challenger strategy Wholesale capabilities
Financial model
Marketing
Technical complexity
Flexibility & speed
Many new entrants
• Minimize investment through Opex model, partnership, branded reselling
• Reducing commercial complexity through “single-point-of-contact”service for partners
• Quick & adequate response to new commercial / technical requirements
• Provide technological knowledge & scale through sharing platforms
• Minimize risk through synergies with own and partners’ brands
Announced
Sept ’06
Mobile wholesale strategy Wholesale as key pillar of Int’l Challenger strategy, strong wholesale capabilities

93Challenger strategy: delivering profitable growth
Redesigned business modelFlexible business model, successfully leveraged to new markets
Exis
ting
mar
kets
New
mar
kets
Network ownership & operation
Back office, billing & IT
Customer service & support
Marketing
Sales
Sales
Sales
Network ownership & operation
Back office, billing & IT
Customer service & support
Marketing
Sales
Sales
Sales
Leverage retail processesOwn brandsWholesale partners
Own brandsWholesale partners
Managed servicesHost outside footprint
Outsourced
Partner
Do it in-house
94Challenger strategy: delivering profitable growth
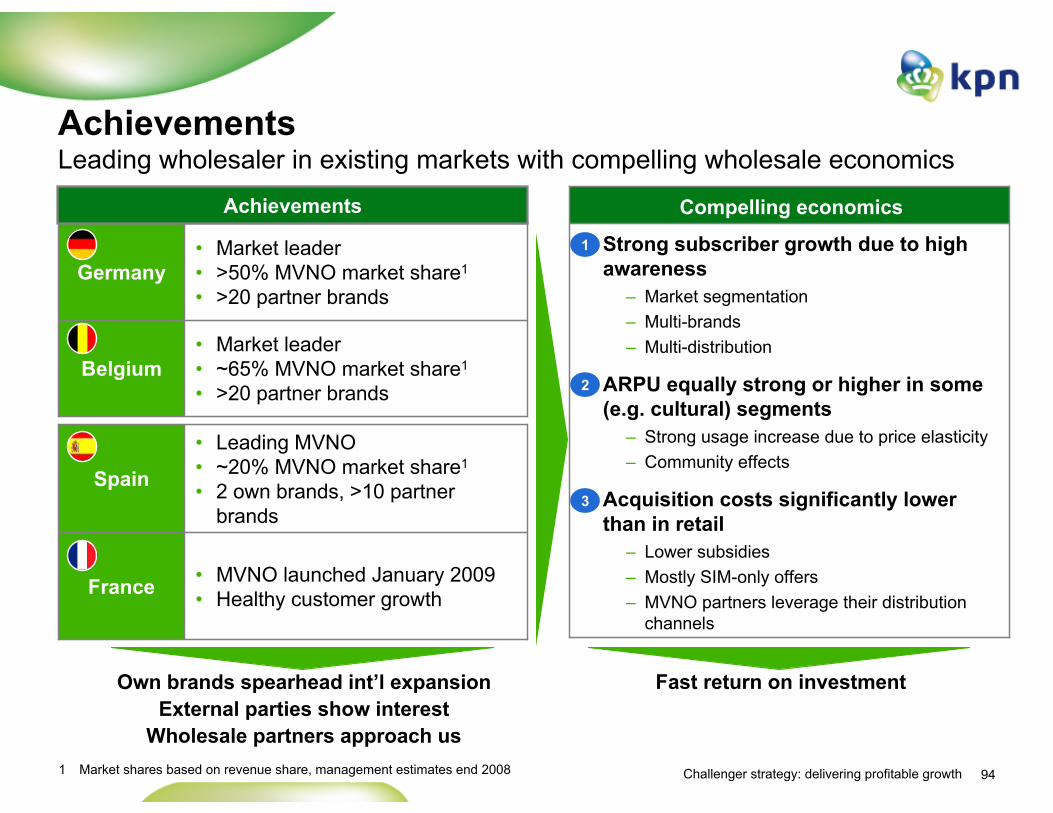
• Leading MVNO • ~20% MVNO market share1
• 2 own brands, >10 partner brands
Spain
• Market leader• ~65% MVNO market share1
• >20 partner brandsBelgium
• MVNO launched January 2009• Healthy customer growthFrance
• Market leader• >50% MVNO market share1
• >20 partner brandsGermany
AchievementsLeading wholesaler in existing markets with compelling wholesale economics
Achievements
Fast return on investment
1 Market shares based on revenue share, management estimates end 2008
Own brands spearhead int’l expansionExternal parties show interest
Wholesale partners approach us
Strong subscriber growth due to high awareness
– Market segmentation – Multi-brands– Multi-distribution
ARPU equally strong or higher in some (e.g. cultural) segments
– Strong usage increase due to price elasticity– Community effects
Acquisition costs significantly lower than in retail
– Lower subsidies– Mostly SIM-only offers– MVNO partners leverage their distribution
channels
Compelling economics
1
2
3
95Challenger strategy: delivering profitable growth
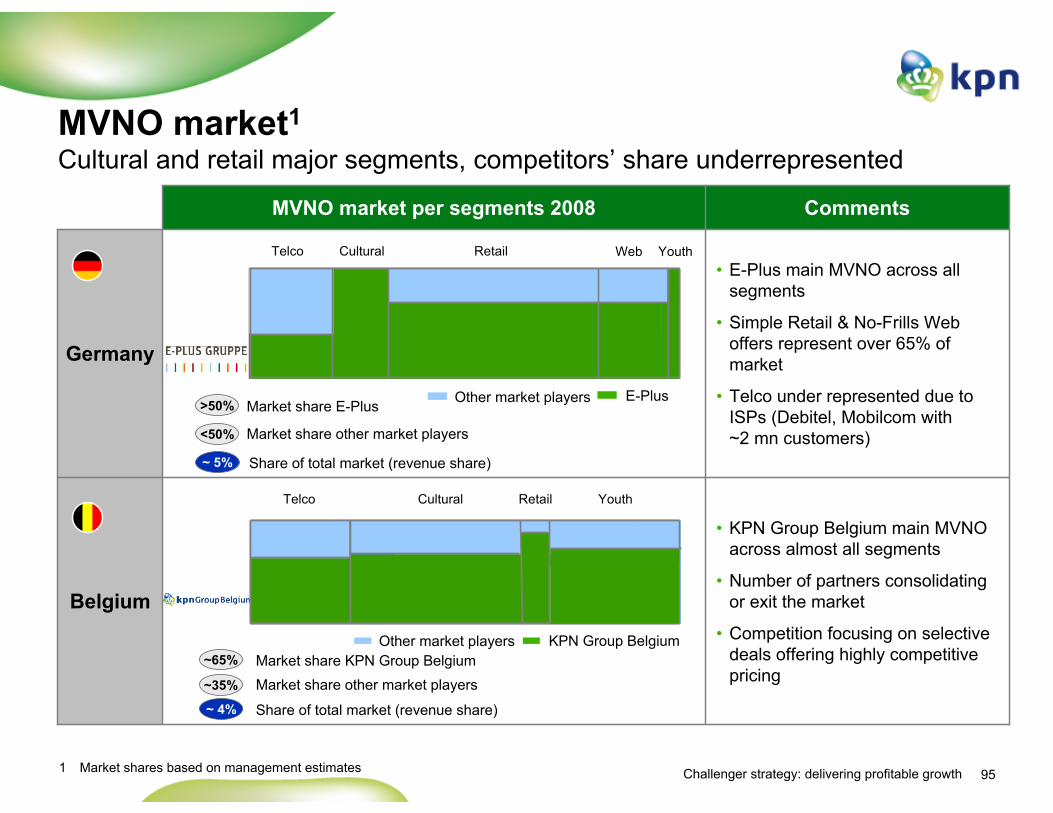
• KPN Group Belgium main MVNO across almost all segments
• Number of partners consolidating or exit the market
• Competition focusing on selective deals offering highly competitive pricing
Belgium
• E-Plus main MVNO across all segments
• Simple Retail & No-Frills Web offers represent over 65% of market
• Telco under represented due to ISPs (Debitel, Mobilcom with ~2 mn customers)
Germany
CommentsMVNO market per segments 2008
MVNO market1
Cultural and retail major segments, competitors’ share underrepresented
~ 5% Share of total market (revenue share)
>50%
<50%
Telco YouthWebRetailCultural
~35%
~65%
Market share other market players
Market share E-Plus
Market share other market playersMarket share KPN Group Belgium
Telco YouthRetailCultural
E-PlusOther market players
KPN Group BelgiumOther market players
~ 4% Share of total market (revenue share)
1 Market shares based on management estimates

96Challenger strategy: delivering profitable growth
International expansion Selective expansion to European markets through low cost business model
• Challenger strategy is very successful in home markets
– Belgium, Germany and the Netherlands
• Opportunity to expand strategy to new European markets
– Wholesale, segment-tailored propositions
– Multi-brand, no-frills
– High potential, limited risk, fast Return on Investment
Expansion rationale
• Market size: Large markets with major value creation potential
• State of competition: Relatively high price levels and limited number of MVNO / MVNEs
• Customer segments: Potential to target new and interesting segments (cultural, regional)
• Existing partners: Potential to leverage existing wholesale partners
• New partners: Potential attractive new partners with local knowledge and assets
• Regulation: Regulatory support for MVNO/MVNE
European scopeAnnounced
Sept ’06

97Challenger strategy: delivering profitable growth
• Many brands but few financially successful, lack of support and “right”conditions from MNOs
• High spread of 8 cents vs. EU average of 5.2 cents
• Continued FMS• High mobile usage close
to European average
• MVNO revenue market share only 1% of total
• Indicating growth potential, e.g. NL ~10%, Germany ~5%
Market share
Players &
segments
Pricing vs.
usage
200213
Spain EU
Spain: Market overviewAttractive MVNO landscape, showing clear upside potential
Spread
€ mn
€ cents
Source: Equity research
152
15,085MNO
MVNO
Revenue
MobileFixed
MoU
Δ 8.0
Only 4 players
> 25 players
Total minutes
Retail Telecom OtherCultural
Top 5 MVNO
Q4 '05 Q4 '08
61%
39%
44%
56%
7.8
15.8
MTA ARPM
98Challenger strategy: delivering profitable growth
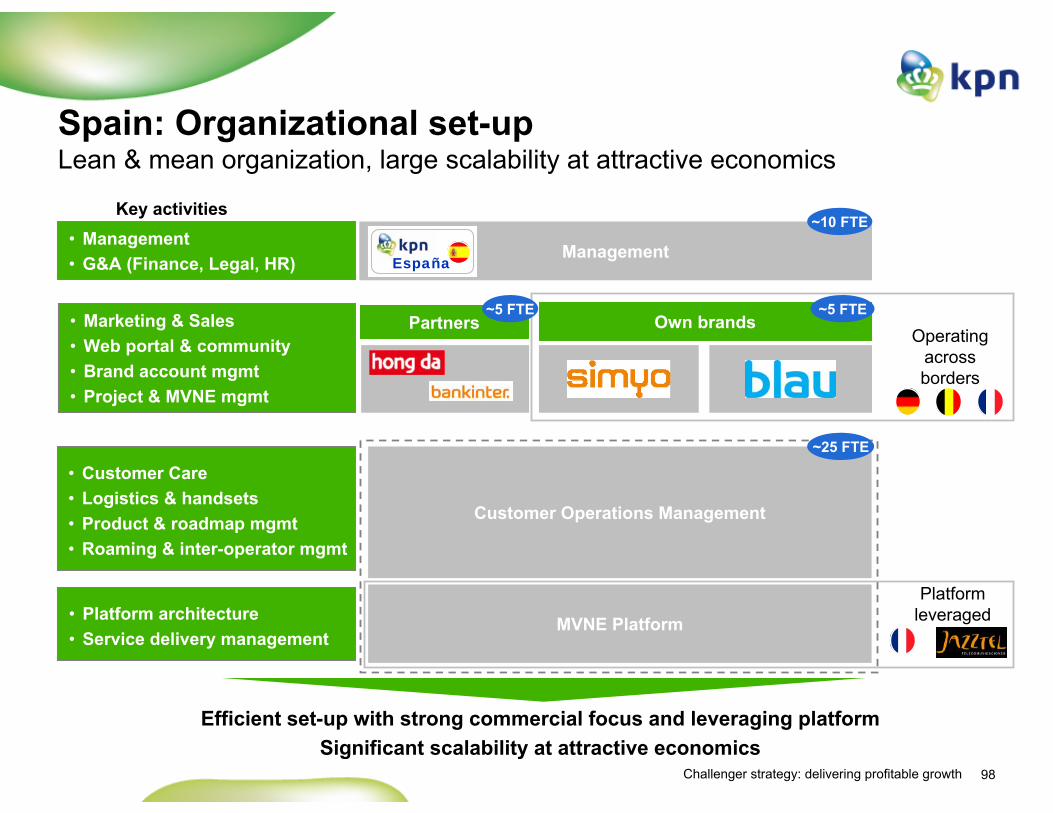
Own brands
Spain: Organizational set-upLean & mean organization, large scalability at attractive economics
Management
Customer Operations Management
MVNE Platform
Operating across borders
Key activities~10 FTE
~5 FTEPartners
~5 FTE• Marketing & Sales• Web portal & community• Brand account mgmt• Project & MVNE mgmt
• Management• G&A (Finance, Legal, HR)
• Customer Care • Logistics & handsets• Product & roadmap mgmt• Roaming & inter-operator mgmt
Efficient set-up with strong commercial focus and leveraging platform Significant scalability at attractive economics
• Platform architecture• Service delivery management
~25 FTE
Platform leveraged
España

99Challenger strategy: delivering profitable growth
Spain: AchievementsFirmly established as leading MVNO after 1 year with >200k customers
Status > 1 year
Part
ner
bran
ds
• Increase in scale and efficiency
• Same platform used in France
• Launched Simyo & blau
• High brand awareness
• Launched ~10 brands
• No frills & cultural target segments
• Operations implemented
• Enabling high quality services
Ow
n br
ands
Plat
form MVNE
• Target new (international) partners
• Focus on distribution and scale
• Drive volume, expand offer
• Exploit economic environment
Going forward
Fastest growing MVNO in Spain, firmly established with own brands and partners (>200k subs)Well received, competition closely monitoring and responding

100Challenger strategy: delivering profitable growth
Spain: MVNO & platform costStrong reductions in costs over time, downward trend expected to continue
Strong reduction over time Continued cost decrease expected
due to declining retail tariffs
Host cost (Orange) Platform cost per customer1
Strong reduction over time Attractive economics from upscaling
Illustrative
Index
-/- ~ 80%
€ per minute/ SMS
100%
67%
Opex per customer
# customers (’000)200
33%
Voice
SMS -/- ~ 15%
-/- ~ 20%
Time
1 Platform cost per customer based on index, starting point represents 100%
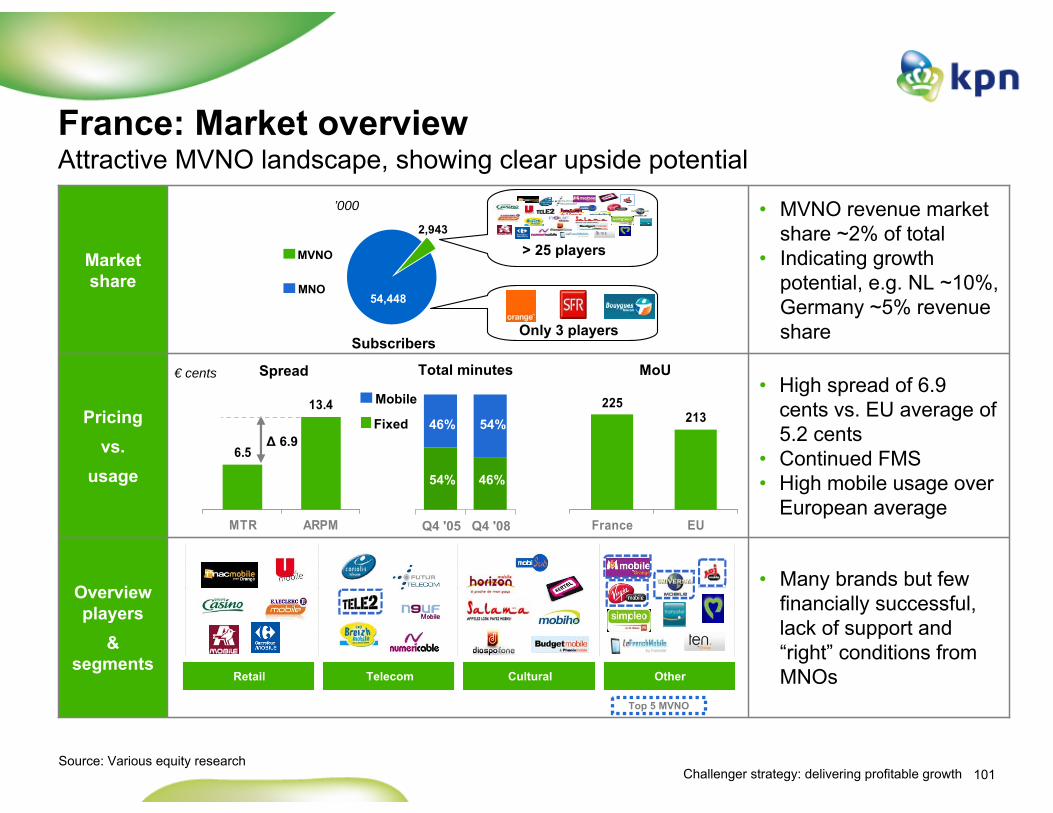
101Challenger strategy: delivering profitable growth
• Many brands but few financially successful, lack of support and “right” conditions from MNOs
• High spread of 6.9 cents vs. EU average of 5.2 cents
• Continued FMS• High mobile usage over
European average
• MVNO revenue market share ~2% of total
• Indicating growth potential, e.g. NL ~10%, Germany ~5% revenue share
Market share
Overview players
& segments
Pricing vs.
usage
France: Market overviewAttractive MVNO landscape, showing clear upside potential
6.5
13.4
MTR ARPM
Δ 6.9
Spread
Source: Various equity research
€ cents
Mobile
Fixed
’000
2,943
54,448MNO
MVNO
Subscribers
225213
France EU
MoUTotal minutes
Only 3 players
> 25 players
Retail Telecom OtherCultural
Top 5 MVNO
Q4 '05 Q4 '08
46% 54%
54% 46%

102Challenger strategy: delivering profitable growth
SimyoLeveraging our successful brand across markets
Simyo FranceSimyo SpainSimyo Germany
Launch Jan 2008
Launch mid 2005
Launch Jan 2009
• Strong DNA, implementation of Simyo in new markets according to this DNA
• Unique offer with simple & transparent cost structure and high quality & reliability
• Founders involvement in leveraging Simyo brand across markets, entrepreneurial skills

103Challenger strategy: delivering profitable growth
France: AchievementsSimyo successfully launched, building momentum in the French MVNO market
Achievements
Inte
rnat
iona
l pa
rtne
rs• Attract local niche partners
• Focus on retail & media segments
• Simyo launch in Jan ’09
• High brand awareness
• Steady growth without significant marketing efforts
• New campaign in May following alignment of processes
Ow
n br
ands
Loca
l pa
rtne
rs
• Leverage international partner brands
• Launch other own brands, founders involvement
Going forward
Simyo successfully launched, building momentum in the French MVNO market
Ow
n br
ands
Org
aniz
atio
nal
• Efficient platform implementation, in only 150 days
• Minimal Capex required due to leveraging Spanish platform
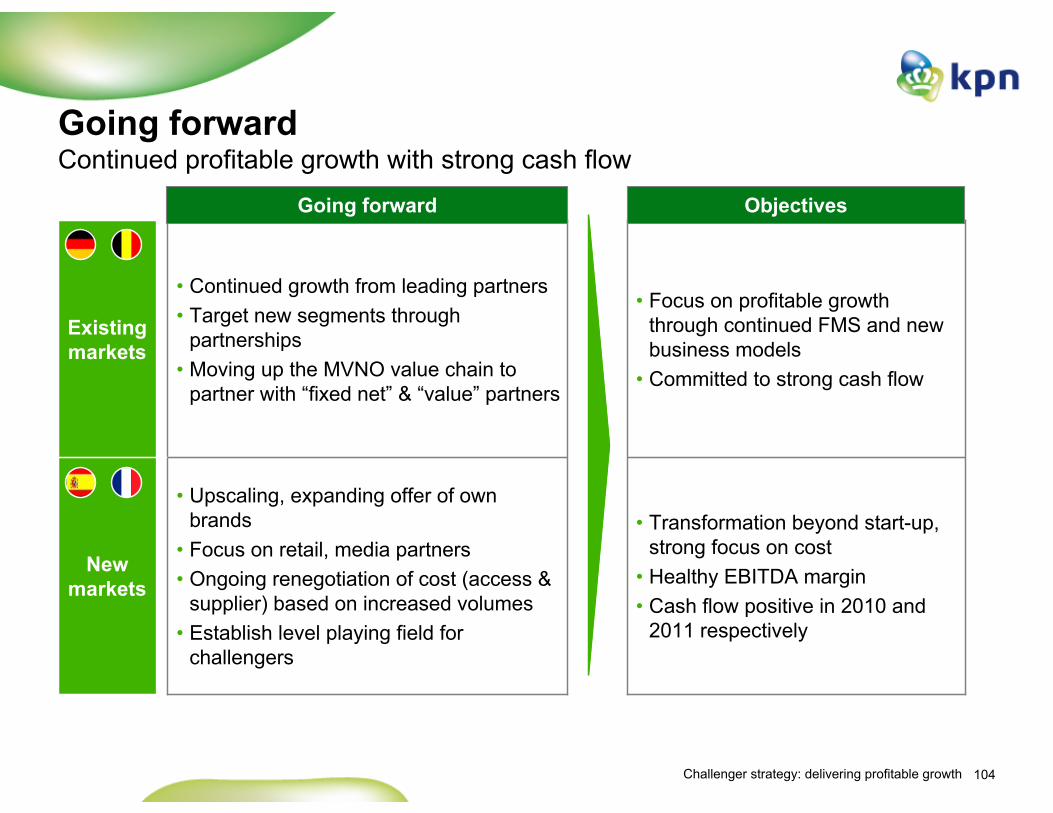
104Challenger strategy: delivering profitable growth
Going forward Continued profitable growth with strong cash flow
• Upscaling, expanding offer of own brands
• Focus on retail, media partners• Ongoing renegotiation of cost (access &
supplier) based on increased volumes• Establish level playing field for
challengers
New markets
• Continued growth from leading partners• Target new segments through
partnerships• Moving up the MVNO value chain to
partner with “fixed net” & “value” partners
Existing markets
• Transformation beyond start-up, strong focus on cost
• Healthy EBITDA margin • Cash flow positive in 2010 and
2011 respectively
• Focus on profitable growth through continued FMS and new business models
• Committed to strong cash flow
Going forward Objectives

105Challenger strategy: delivering profitable growth
Concluding remarks
• Wholesale as key pillar of Challenger strategy, strong wholesale capabilities
• Organization built across markets, leverage international partners & own brands
• Unique business model through redesign of value chain
• Leading wholesaler in existing markets with compelling wholesale economics
• Attractive MVNO landscape in new markets, showing clear upside potential
• Moving up the MVNO value chain to target new segments going forward
106Challenger strategy: delivering profitable growth
Agenda
Thorsten Dirks, CEO E-PlusE-Plus
Eric Hageman, CEO International WholesaleInternational Wholesale
Stan Miller, CEO KPN Mobile InternationalStrategy
Eric Hageman, CFO KPN Mobile InternationalFinance
Marc van Asbroeck, Chief Legal & RegulationRegulation
Erik Hoving, CTO KPN Mobile International KPN Group Belgium
Stan Miller, CEO KPN Mobile InternationalConcluding remarks
Ad Scheepbouwer, Chairman and CEO KPNIntroduction

107Challenger strategy: delivering profitable growth
Concluding remarks
• Challenger strategy delivered on its promises and achieved continued outperformance
• Significant potential from Challenger strategy still to be realized using our segmented, multi-branding approach
• Proven ability to think and do things differently will enable us to continue to deliver strong results going forward
• Confident to continue market outperformance with a clear focus on EBITDA and cash flow
• Ambition to reach 20-25% market share in Germany and Belgium with EBITDA margins of at least 35%
• Remain committed to delivering industry leading shareholder returns

Q & A

For further information please contactKPN Investor RelationsTel: +31 70 44 60986Fax: +31 70 44 [email protected]