
KOWLOON EAST – HONG KONG’S CBD 2 · 2026+ Reenue Tower, mmigration Tower and Wan Chai...
44
KOWLOON EAST – HONG KONG’S CBD 2.0 CBRE RESEARCH
Transcript of KOWLOON EAST – HONG KONG’S CBD 2 · 2026+ Reenue Tower, mmigration Tower and Wan Chai...

KOWLOON EAST – HONG KONG’S CBD 2.0
CBRE RESEARCH
CBRE Research
Kowloon East – Hong Kong’s CBD 2.02 |

© 2017 CBRE, Inc.
| 3Kowloon East – Hong Kong’s CBD 2.0
EXECUTIVE SUMMARY
Technology is transforming the way people work and corporates operate. It is also making it more feasible for companies to operate offices outside of city cores. Decentralisation is a popular occupier strategy in Hong Kong given high rents and tight space availability in the CBD. Ageing building stock in many core office submarkets is also weighing on corporates’ leasing decisions.
New decentralised office submarkets in Hong Kong are set to provide occupiers with cost effective options outside of Central, Wan Chai / Causeway Bay and Tsim Sha Tsui. These submarkets offer rents only a quarter of those in the CBD and are just a few MTR stops away from Central. Travelling distance to these locations will shorten further as infrastructure continues to improve. Buildings in these areas are significantly younger than those in core submarkets and are built to the highest standard.
Of these decentralised office submarkets, Kowloon East is best-equipped. The area has developed over several years and is already a popular location for large offices. Most large corporate offices in Kowloon East perform a head office role either for Hong Kong or Asia Pacific.
This report by CBRE Research profiles the Kowloon East CBD and explains the reasons why it is set to outperform other emerging office submarkets in the coming years and establish itself as a new CBD for Hong Kong.

CBRE Research
Kowloon East – Hong Kong’s CBD 2.04 |
INTRODUCTION
Hong Kong’s high office rents frequently generate global media headlines. CBRE Research’s Global Prime Office Occupancy Costs Report has ranked Hong Kong in the world’s most expensive office markets since 2012. The city’s high rents are primarily due to the limited supply of office space and the fact that just 0.4% of its land area is allocated for commercial use.
Occupiers must pay very high rents for space in Central CBD properties that are often several decades old, even though they are maintained and managed to a generally high standard. The specifications of some buildings are unsuitable for technologically advanced occupiers who increasingly require advanced designs and hi-tech features to support their business operations and justify high occupancy costs to global headquarters.
Non-core SubmarketsCore Submarkets
0
2
4
6
8
10
12
14
16
18
<5 years 6-10 years 11-15 years 16-20 years 21-25 years 26-30 years >31 years
Source: CBRE Research, Q3 2017
*Core submarkets include Central, Admiralty / Sheung Wan, Wan Chai / Causeway Bay, Tsim Sha Tsui
Figure 1: Core office submarkets gradually facing ageing issues
Grade A Office Building Stock (mil sq. ft. NFA)
Building Age
© 2017 CBRE, Inc.
| 5Kowloon East – Hong Kong’s CBD 2.0
7%
6%
5%
4%
3%
2%
1%
-1%
-2%
-3%
-4%
0%2007
2008 2009
2010 2011
2012 2013 2014
2015 2016 YTD 2017
35%
30%
25%
20%
15%
10%
5%
0%
-5%
-10%
-15%
-20%
Rental Growth (RHS)Vacancy (LHS)
Source: CBRE Research, Q3 2017
*Core submarkets include Central, Admiralty / Sheung Wan, Wan Chai / Causeway Bay, Tsim Sha Tsui
Grade A Office Vacancy in Core Submarkets (Year-end, weighted-average%)
Grade A Office Annual Rental Growth in Core Submarkets (Weighted-average%)
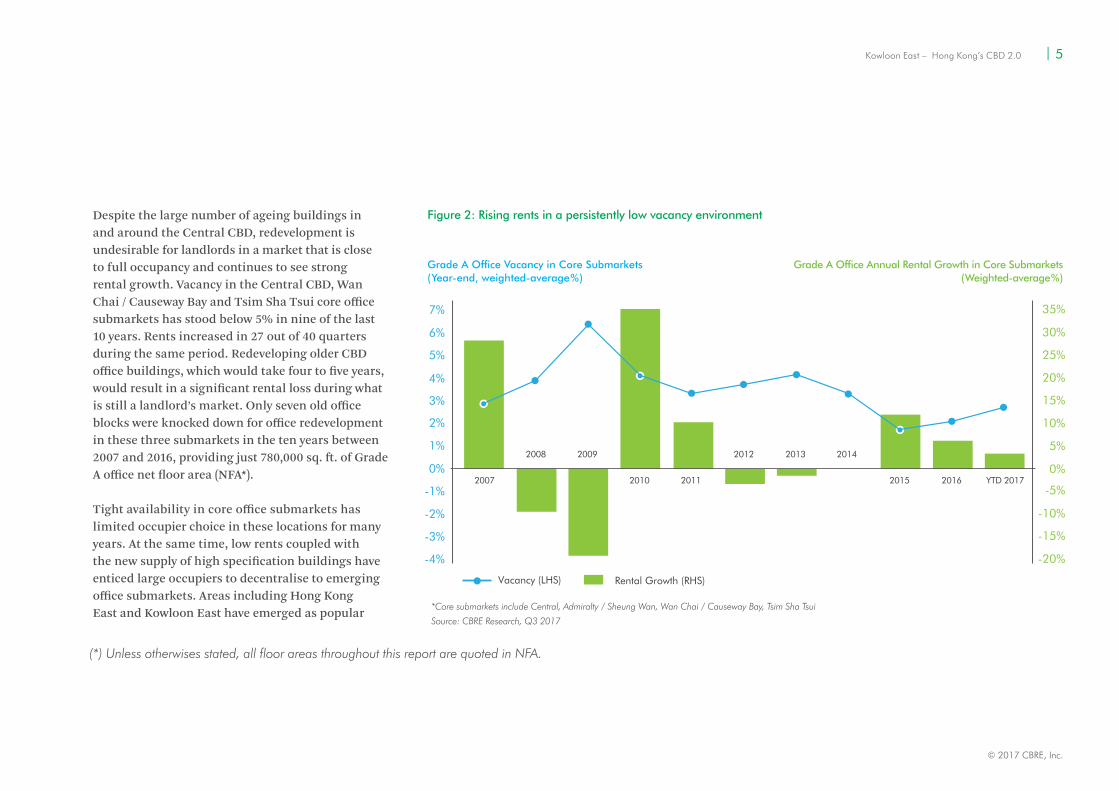
Despite the large number of ageing buildings in and around the Central CBD, redevelopment is undesirable for landlords in a market that is close to full occupancy and continues to see strong rental growth. Vacancy in the Central CBD, Wan Chai / Causeway Bay and Tsim Sha Tsui core office submarkets has stood below 5% in nine of the last 10 years. Rents increased in 27 out of 40 quarters during the same period. Redeveloping older CBD office buildings, which would take four to five years, would result in a significant rental loss during what is still a landlord’s market. Only seven old office blocks were knocked down for office redevelopment in these three submarkets in the ten years between 2007 and 2016, providing just 780,000 sq. ft. of Grade A office net floor area (NFA*).
Tight availability in core office submarkets has limited occupier choice in these locations for many years. At the same time, low rents coupled with the new supply of high specification buildings have enticed large occupiers to decentralise to emerging office submarkets. Areas including Hong Kong East and Kowloon East have emerged as popular
Figure 2: Rising rents in a persistently low vacancy environment
(*) Unless otherwises stated, all floor areas throughout this report are quoted in NFA.

CBRE Research
Kowloon East – Hong Kong’s CBD 2.06 |
Figure 3.1: New supply in core submarkets 2017 to 2026+
2017-2021 2022-2026 2026+
Short-to-medium Term Long Term
Greater Central Wan Chai / Causeway Bay Tsim Sha Tsui Non-core Submarkets
0
2
4
6
8
10
12
14
Grade A Office Supply (mil sq. ft. NFA)
Source: CBRE Research, Q3 2017
*Greater Central includes Central, Admiralty / Sheung Wan
destinations over the past two decades, with Wong Chuk Hang and West Kowloon attracting more occupiers in recent years. These emerging office submarkets command rents just a quarter of those in the CBD and are a few MTR stops or 30 minutes’ drive from Central. The travelling time to these areas will continue to shorten as infrastructure further improves.
Citywide vacancy is forecast to remain low amid limited future supply in core office submarkets. Although rents may temporarily decline as the current cycle ends, Central is expected to be the most resilient of all office submarkets. Portfolio vacancy is expected to remain low and will guard against a significant collapse in rents, giving landlords little incentive to redevelop older properties. Core office submarkets are unlikely to see major redevelopment work while new and high specification office buildings become available in emerging districts. The gap in building age and quality between the CBD and emerging submarkets will continue to expand.
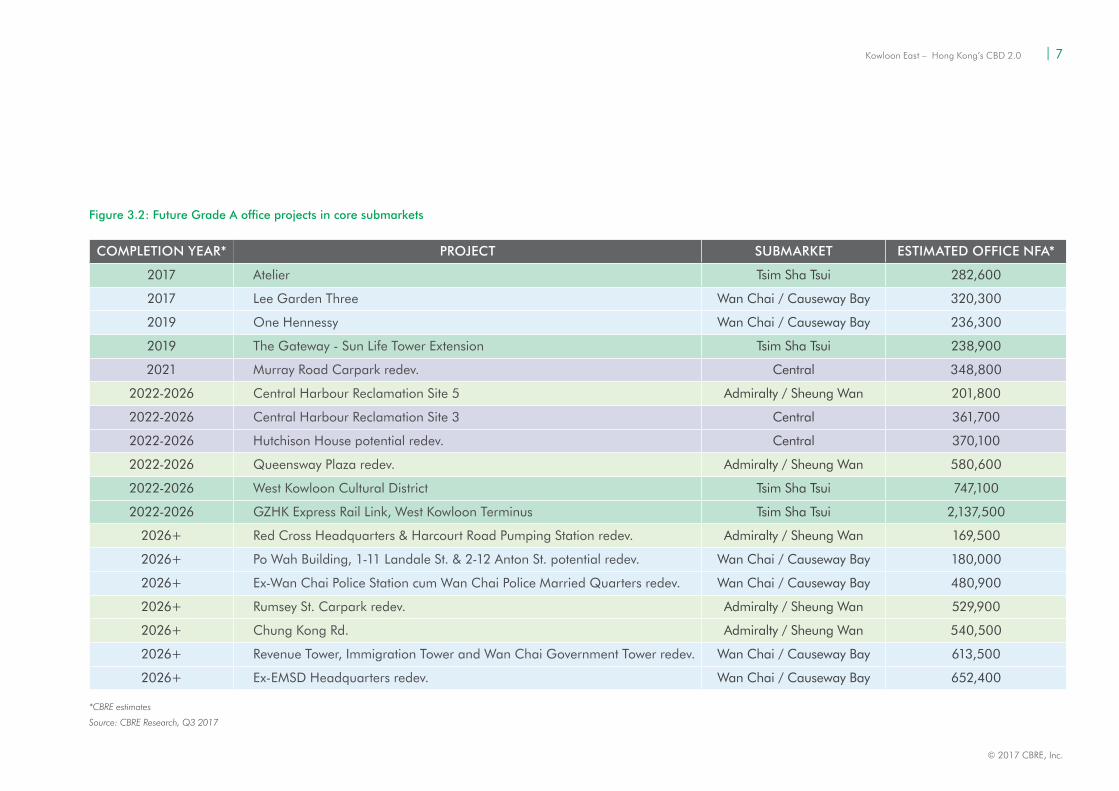
COMPLETION YEAR* PROJECT SUBMARKET ESTIMATED OFFICE NFA*
2017 Atelier Tsim Sha Tsui 282,600
2017 Lee Garden Three Wan Chai / Causeway Bay 320,300
2019 One Hennessy Wan Chai / Causeway Bay 236,300
2019 The Gateway - Sun Life Tower Extension Tsim Sha Tsui 238,900
2021 Murray Road Carpark redev. Central 348,800
2022-2026 Central Harbour Reclamation Site 5 Admiralty / Sheung Wan 201,800
2022-2026 Central Harbour Reclamation Site 3 Central 361,700
2022-2026 Hutchison House potential redev. Central 370,100
2022-2026 Queensway Plaza redev. Admiralty / Sheung Wan 580,600
2022-2026 West Kowloon Cultural District Tsim Sha Tsui 747,100
2022-2026 GZHK Express Rail Link, West Kowloon Terminus Tsim Sha Tsui 2,137,500
2026+ Red Cross Headquarters & Harcourt Road Pumping Station redev. Admiralty / Sheung Wan 169,500
2026+ Po Wah Building, 1-11 Landale St. & 2-12 Anton St. potential redev. Wan Chai / Causeway Bay 180,000
2026+ Ex-Wan Chai Police Station cum Wan Chai Police Married Quarters redev. Wan Chai / Causeway Bay 480,900
2026+ Rumsey St. Carpark redev. Admiralty / Sheung Wan 529,900
2026+ Chung Kong Rd. Admiralty / Sheung Wan 540,500
2026+ Revenue Tower, Immigration Tower and Wan Chai Government Tower redev. Wan Chai / Causeway Bay 613,500
2026+ Ex-EMSD Headquarters redev. Wan Chai / Causeway Bay 652,400
Figure 3.2: Future Grade A office projects in core submarkets
© 2017 CBRE, Inc.
| 7Kowloon East – Hong Kong’s CBD 2.0
Source: CBRE Research, Q3 2017
*CBRE estimates

CBRE Research
Kowloon East – Hong Kong’s CBD 2.08 |
NEW WORKPLACESTRATEGIES
Figure 4: Factors to drive office decentralisation
Source: CBRE Research, Q3 2017
BUILDINGQUALITY
SPACEAVAILABILITY
COSTSAVINGS
TECHNOLOGY
IMPROVEDCONNECTIVITY
In addition to flight-to-quality, the shift to split-office operations has seen companies turn more flexible towards selecting office locations in recent years. Global firms in Hong Kong are now far more willing to operate larger offices in decentralised locations while retaining smaller front offices in core areas.
Minimising overheads has been a key priority for multinationals since the Global Financial Crisis. At the same time, mobile working and millennials’ growing influence in the workforce are driving demand for modern and flexible workspace. Wireless technology is allowing staff to work and communicate from remote locations while satellite offices are enhancing the efficiency of staff who travel around the city for day-to-day business engagements.
Millennials account for 25% of the working population in Asia Pacific and 18% of the working population in Hong Kong. Research by CBRE has found that this generation places the greatest importance upon office design and flexible working when considering potential jobs. Millennials also prefer not to be segregated by job function and desire the flexibility to work from different locations according to their own needs. Companies are also promoting collaboration, with activity-based workplace strategy becoming increasingly
popular. Facilitating the flow of staff between different offices can enhance workplace efficiency.
Split-office operations also allow companies to reduce rental expenses. Rents in decentralised office locations are typically lower than the CBD. In Hong Kong, office
rents in areas such as Kowloon East, West Kowloon and Wong Chuk Hang are only a quarter of those in Central. Maintaining smaller front offices in the city core and allocating more human resources to cost-effective submarkets can therefore enable larger occupiers to reduce overheads.

© 2017 CBRE, Inc.
| 9Kowloon East – Hong Kong’s CBD 2.0
ATTRIBUTES OF LEADINGOFFICE SUBMARKETSNew office supply in Hong Kong has been limited for many years, even in decentralised areas. Only 5.5 million sq. ft. of new Grade A office space was completed outside of Central, Wan Chai / Causeway Bay and Tsim Sha Tsui in the five years to 2016, representing 87% of total new office supply across Hong Kong during the period. This situation will change in the coming years; of the 9.6 million sq. ft. of new Grade A office space scheduled for completion between 2017 and 2021, 8.1 million sq. ft. will be found outside of core submarkets, providing occupiers with plenty of options for decentralised office space.
Figure 5: Future Grade A office supply to be concentrated in non-core submarkets
Avg Annual Completion (2017F - 2021F)
0.0
0.5
1.0
1.5
2.0
2.5
3.0
3.5
Non-core submarketsCore submarkets
1995-2016 2012-2016 2017F 2019F 2020F 2021F 2022F+2018F
Historic Future
Avg Annual Completion
Avg Annual Completion
Avg Annual Completion
Source: CBRE Research, Q3 2017
Future Grade A Office Supply (mil sq. ft. NFA)
*Core submarkets include Central, Admiralty / Sheung Wan, Wan Chai / Causeway Bay, Tsim Sha Tsui

CBRE Research
Kowloon East – Hong Kong’s CBD 2.010 |
CBRE Research believes that not all decentralised office submarkets will emerge as popular locations for occupiers. Leading office submarkets in Hong Kong typically share the following attributes:
Good accessibility
Hong Kong is geographically small and people are accustomed to short travelling times. Buildings and submarkets with good accessibility are highly valued and landlords of properties in such areas face less challenges in terms of occupancy. Central is served by four MTR lines with 16 exits, over 230 bus routes, trams and minibuses. There are also 5,600 carparking space available to private car users.
Recently completed MTR lines have improved connectivity of some decentralised areas. In the first three quarters of 2017 Wong Chuk Hang and Hung Hom registered 300,000 sq. ft. and 109,000 sq. ft. of net absorption, respectively, reflecting strong occupier demand for easily reached decentralised submarkets. During the same period, rents in the two submarkets climbed 10% and 4%, respectively, the strongest rental growth amongst all office submarkets.
Office clusters and good amenities
Areas with clusters of office buildings are desirable for occupiers as corporates tend to want to be in the same location as their peer firms and service providers and vendors prefer to be close to their
clients. Central, as a world-famous CBD and the largest office sub-market in Hong Kong, has 22 million sq. ft. of Grade A office space (incl. those in Admiralty / Sheung Wan) and is home to around half of the city’s financial sector footprint. Professional services firms also have around 30% of their office
25
20
15
10
5
0
Greater Central Tsim Sha Tsui Wan Chai /Causeway Bay
Kowloon East Hong Kong East Kowloon Others New Territories Wong Chuk Hang
Non-core submarketsCore submarkets
Source: CBRE Research, Q3 2017
Figure 6: Kowloon East is building up the scale to join the Big Boys Club
Grade A Office Stock (mil sq. ft. NFA)
*Greater Central includes Central, Admiralty / Sheung Wan

10206
GREATER CENTRAL
1034
607
496
24
1085
6449
17592
5250
1111
TSIM SHA TSUI
KOWLOON EAST
HONG KONG EAST
MONG KOK
WONG CHUK HANG
WAN CHAI /CAUSEWAY BAY
1340
4296
1226
16211621
*Greater Central includes Central, Admiralty / Sheung Wan
No. of licensed restaurants
No. of licensed hotel rooms
© 2017 CBRE, Inc.
| 11Kowloon East – Hong Kong’s CBD 2.0
Source: Food and Environment Hygiene Department, Tourism Board, CBRE Research, Q3 2017
Figure 7: High concentration of eateries and hotels in mature office submarketsfootprint in Central. This submarkets’ proximity to courts and regulatory bodies also make it a preferred location for legal firms, although some groups have recently chosen to relocate to other submarkets on Hong Kong Island.
Central is connected by a planned system of covered walkways providing pedestrians with direct access to 28 of the 50 Grade A office buildings in the district along with MTR stations and public transport interchanges. These features provide workers in Central with almost direct access to most of Grade A buildings without having to navigate through traffic and weather.
Areas with a large cluster of office buildings also usually provide extensive amenities to support business activity. Large corporates, especially those with client-facing offices, prefer offices near luxury hotels, high-end restaurants, banks and shopping malls.

CBRE Research
Kowloon East – Hong Kong’s CBD 2.012 |
8mil sq.ft. 14mil sq.ft.
11mil sq.ft.28%
Market Share of the leading landlord(s)
15%
47%
65%
Market Share of the leading landlord(s)
Market Share of the leading landlord(s)
Market Share of the leading landlord(s)
Submarket Size
Submarket Size
Submarket Size
HONG KONGEAST
TSIM SHA TSUI
15mil sq.ft.
CENTRALSubmarket Size
KOWLOONEAST
16%
Market Share of the leading landlord(s)
7mil sq.ft.
SHEUNG WAN/ADMIRALITY
Submarket Size
10mil sq.ft.
29%
Market Share of the leading landlord(s)
WAN CHAI /CAUSEWAY BAYSubmarket Size
Figure 8: Mature office submarkets usually have at least one leading landlord holding a dominate share of spaceLeading landlords
Submarkets hosting properties operated by leading landlords can ensure better synergy across different buildings and facilitate a healthy office community. Commercial amenities are usually better planned and allocated. Landlords with sizable portfolios in a particular district also have more incentive to work with the government to improve the surrounding public environment and connectivity between buildings. Most major companies prefer to lease space in single-owned portfolio buildings which are usually better maintained and managed. Occupiers can also enjoy greater flexibility when planning in-house expansion should they lease space from a leading landlord operating multiple buildings located with a close distance. Established office submarkets in Hong Kong usually have one or more leading landlords. Examples include Hongkong Land in Central, Hysan in Causeway Bay, Swire Properties in Hong Kong East and Wharf in Tsim Sha Tsui.
Source: CBRE Research, Q3 2017

© 2017 CBRE, Inc.
| 13Kowloon East – Hong Kong’s CBD 2.0
Access to labour
According to a UBS survey(1), employees in Hong Kong have the longest working hours in the world. They therefore prefer a short commute to work. Firms with offices in distant and inaccessible locations therefore often find it challenging to attract talent and are more vulnerable to staff retention issues.
Leading office submarkets are typically surrounded by densely populated areas, ensuring sufficient supply of labour. They also have upmarket residential clusters such as the Peak, Island South, Mid-levels, Happy Valley, and Pok Fu Lam to cater to corporate executives working in Central and Wan Chai/ Causeway Bay. Luxury apartments in and around the Kowloon Station and Olympic Station areas are only a few minutes’ drive from Tsim Sha Tsui.
Source: CBRE Research, Q3 2017
Figure 9: Successful factors of mature office markets in Hong Kong
GOODACCESSIBILITY
HIGH QUANTITY& QUALITYOF STOCK
CLOSE PROXIMITY TO
LABOUR
PRESENCE OF LEADINGLANDLORDS
AMPLE SOCIALAMENITIES
(1)UBS Prices & Earnings 2015

CBRE Research
Kowloon East – Hong Kong’s CBD 2.014 |

© 2017 CBRE, Inc.
| 15Kowloon East – Hong Kong’s CBD 2.0

CBRE Research
Kowloon East – Hong Kong’s CBD 2.016 |
KOWLOON EAST – A FUTURE CBD FOR HONG KONGOffice submarkets in Hong Kong usually take one to two decades to mature, primarily because of the limited supply of new development land. Many new office towers are redeveloped from old buildings or on sites assembled from multiple older properties, making it difficult to form a scalable and sustainable cluster.
New office submarkets including Kowloon East, West Kowloon and Wong Chuk Hang are emerging across Hong Kong. These areas are expected to receive growing demand from occupiers decentralising from core submarkets in search of lower costs. The next five to ten years will see the bulk of office development, investment and leasing activity focused on these emerging submarkets. Of these, CBRE Research believes Kowloon East has the greatest potential to emerge into a premier office submarket.
Hong Kong’s soon-to-be largest office submarket
Kowloon East has long been one of Hong Kong’s major industrial areas and was once home to numerous factories situated in Kwun Tong, Ngau Tau Kok and Kowloon Bay. In the 1980s most of Hong Kong’s manufacturing activity moved inland to Mainland China and the city gradually transformed into a service economy. Manufacturing’s share of Hong Kong’s GDP fell from an average of 27% during the 1970s to 8% in the 1990s. As of 2017, it stands at just 1%.
Declining demand for industrial buildings prompted the government to reclassify land use in various industrial areas, including Kowloon East, to ‘Business’ use in 2001. This encouraged factory owners and property developers to pay
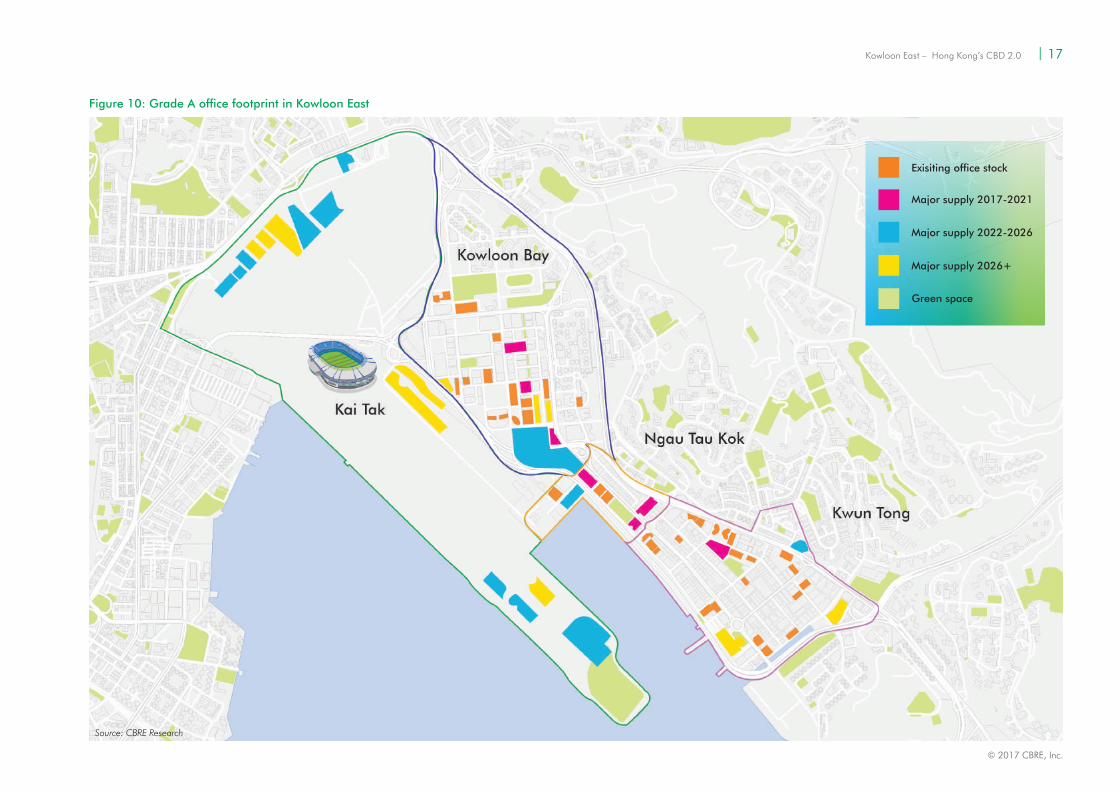
land premiums for commercial redevelopment. Then Chief Executive Donald Tsang subsequently announced in his 2011-2012 Policy Address a plan to transform Kowloon East into a second-generation CBD to sustain Hong Kong’s economic development. Since 2001, 10.7 million sq. ft. of Grade A office space has been built in Kowloon East, bringing total stock to the current 13.9 million sq. ft.. CBRE Research estimates that the Grade A office footprint in Kowloon East will reach 17.2 million sq. ft. and 29.0 million sq. ft. by 2021 and beyond 2026, respectively, meaning that the district will eventually displace Greater Central (incl. Central, Admiralty / Sheung Wan) as the largest office submarket in Hong Kong. Future office development in Kowloon East will be spread across four clusters – Kwun Tong, Ngau Tau Kok, Kowloon Bay and Kai Tak, with stock estimated to stand at 8.0 million sq. ft., 2.9 million sq. ft., 8.3 million sq. ft. and 3.7 million sq. ft., respectively, by 2026.
© 2017 CBRE, Inc.
| 17Kowloon East – Hong Kong’s CBD 2.0
Figure 10: Grade A office footprint in Kowloon East
Source: CBRE Research
Green space
Major supply 2026+
Major supply 2022-2026
Exisiting office stock
Major supply 2017-2021

CBRE Research
Kowloon East – Hong Kong’s CBD 2.018 |
Kwun Tong, Ngau Tau Kok and Kowloon Bay – an established decentralised office cluster
Existing office buildings in Kowloon East are scattered around Kwun Tong and Kowloon Bay. Mainstream commercial banks and insurance companies have retained a strong presence in these two locations for the past 10- 15 years. After Manulife and Citi forward purchased and later self-occupied two office towers at One Bay East in 2015, the area began to see a cluster of company headquarters emerge along Hoi Bun Road in Ngau Tau Kok. To consolidate its non-Central staff from various offices into one location, JP Morgan pre-leased 225,000 sq. ft. GFA in The Quayside, an office project scheduled for occupation in 2019. Companies find Hoi Bun Road attractive because of its waterfront location and panoramic sea views. Rooftop signage is highly valued by some companies and buildings along Hoi Bun Road generally have good visibility from the Kwun Tong Bypass and from Hong Kong Island.
Kai Tak – the future core of Kowloon East
Of the four clusters in Kowloon East, Kai Tak is best equipped to serve as the core of the future CBD. Spanning over 320 hectares, Kai Tak is one of Hong Kong’s largest urban development projects. In terms of land area, Kai Tak is 53 times the size of the ifc complex in Central and 25 times the footprint of Union Square at Kowloon Station. Unlike the evolution of Kwun Tong, Ngau Tau Kok and Kowloon Bay, which has mainly been driven by redevelopment, Kai Tak will be a self-sustained and planned community to be developed from scratch. It will be home to 31 million sq. ft. of residential GFA, 24 million sq. ft. of commercial GFA, a sports hub and a tourism node to house 134,000 residents and a 99,000-working population.
Office buildings in Kai Tak will mainly be clustered in the Commercial Belt along Prince Edward Road East. A total of 10 sites suitable for office development are planned to be made available in the Belt and will provide 8.1 million sq. ft. of commercial GFA. These include two sites sold
Existing office buildings in Kowloon Bay are scattered across the district with a slightly higher concentration near the Megabox area. The government also plans to develop a commercial hub around the existing Vehicle Examination Centre. Known as Kowloon Bay Action Area under thegovernment’s Energizing Kowloon East plan, the cluster will consist of 5.2 million sq. ft. of commercial GFA providing office, retail, hotel and exhibition space.
Office buildings in Kwun Tong have generally been developed on a piecemeal basis and involve the private-sector led redevelopment of old industrial blocks. Their dispersed location means these buildings lack synergy with each other. Sites in Kwun Tong are also typically smaller than government land plots available in Ngau Tau Kok and Kowloon Bay.
Several Grade A office buildings are currently under construction in Kwun Tong, Ngau Tau Kok and Kowloon Bay. By end-2017, the three clusters combined will have a total stock of 15.5 million sq. ft..
Kowloon East – Hong Kong’s CBD 2.018 |

© 2017 CBRE, Inc.
| 19Kowloon East – Hong Kong’s CBD 2.0
to Lifestyle International and Nan Fung in November 2016 and May 2017, respectively. Another five commercial sites will be made available next to the Kai Tak Cruise Terminal on the former airport runway and near Hoi Bun Road, and will provide a combined total of 6.0 million sq. ft. of commercial GFA.
CBRE Research foresees that Kai Tak will host the required size and type of office buildings to attract sizable occupiers. Of the 15 commercial sites planned for Kai Tak, eight are estimated to have a floorplate size of over 20,000 sq. ft. GFA. These sites are mostly rectangular, meaning that offices could potentially be of high efficiency design.
Kai Tak is also set to be connected to the future Shatin-to-Central Link and Central Kowloon Route. By 2021, Central will just be seven MTR stops away from Kai Tak, a similar distance to Quarry Bay. Some of the future offices alongside the Commercial Belt will have covered access to the future Kai Tak and To Kwa Wan MTR stations.
For workers preferring to live within a short walking distance to offices, Kai Tak will have 36,000 private flats and 14,000 public housing
Driving from Kowloon East to West Kowloon currently takes about 30 minutes during peak hours. Once the Central Kowloon Route is completed by 2026, this will be shortened to five minutes. By then, Kowloon East and Central will enjoy similar access to and from the future Express Rail Link Terminus and Hong Kong International Airport. The Central Kowloon Route will form part of Route 6 connecting West Kowloon with Tseung Kwan O via the Trunk Road T2 passing through Kowloon East. Route 6 will ease road traffic in many areas of Kowloon including Kowloon East. After the opening of Route 6 in 2025/ 2026, it will take only seven minutes to drive between Kowloon East and Tseung Kwan O, which is currently home to 420,000 residents.
units within its development area. Open space will account for 30% of land area in Kai Tak, ensuring a healthy built environment for residents and workers.
Easy access to other commercial, residential and transit nodes
In contrast to emerging office submarkets, Kowloon East is supported by significant government investment including HKD100 billion worth of infrastructure projects intended to enhance the district’s connectivity with Hong Kong’s key commercial and residential nodes.
Kowloon East can presently be accessed by the MTR Kwun Tong line along with 120 bus routes that pass through Kwun Tong, Ngau Tau Kok and Kowloon Bay. The future MTR Shatin-to-Central Link will connect Kai Tak with other commercial and residential nodes via the Hung Hom and Ho Man Tin stops, and will be ready in two phases in 2019 and 2021. Trains will take passengers to reach Kai Tak from Central in about 11 minutes.
| 19Kowloon East – Hong Kong’s CBD 2.0

2
13
4
5
6
KOWLOON EASTHONG KONG
INTERNATIONAL AIRPORT
SHENZHEN BAY
LOK MA CHAU
CENTRAL
EXPRESSRAIL LINK
TSIM SHA TSUI
CBRE Research
Kowloon East – Hong Kong’s CBD 2.020 |
Figure 11: Convenient access to key bearing pointsFROM DESTINATION
CURRENT TRAVEL TIME
(Mins)*
NEW INFRASTRUCTURE
FUTURE TRAVEL TIME
(Mins)*TIMING
KowloonEast
Tsim Sha Tsui 25 (Drive) Central Kowloon Route 8 (Drive) 2025/2016
Express Rail Link Terminus 25 (Drive) Central Kowloon Route 5 (Drive) 2025/2016
Central 29 (Railway) Shatin-to-Central Link 11 (Railway) 2021
Airport 45 (Drive) Central Kowloon Route 30 (Drive) 2025/2016
Shenzhen Bay (Border Gate)
40 (Drive) —
Lok Ma Chau(Border Gate)
60 (Railway) —
1
2
3
4
5
6
Source: CBRE Research, Q3 2017*CBRE estimates

*Greater Central includes Central, Admiralty / Sheung Wan
© 2017 CBRE, Inc.
| 21Kowloon East – Hong Kong’s CBD 2.0
0
5
10
15
20
25
30
35
Greater Central Wong Chuk HangKowloon OthersNew Territories
New supply - 2017-2021Stock as of end-2016 New Supply - 2022-2026 New Supply - 2026+
Hong Kong EastWan Chai /Causeway Bay
Tsim Sha TsuiKowloon East
Private car owners will find Kowloon East more convenient than many traditional core office sub-markets. There are currently around 7,600 car parking spaces in the district available for car drivers, equivalent to one parking space for every 1,900 sq. ft. of office NFA. This is compared with the ratio of one parking space for every 2,700 sq. ft. of Grade A office space in Greater Central.
A planned elevated monorail system will improve internal transportation between Kwun Tong, Kowloon Bay and Kai Tak. Tentatively known as the Environmentally Friendly Linkage System (EFLS), it is targeted to be built over the next decade. After eight years of completion, the system is capable of carrying 200,000 passengers daily.
Availability of new and high-specification office buildings
Kowloon East will provide office occupiers with a wide selection of new and high-quality Grade A office buildings. Currently, the median age of Grade A office buildings in Kowloon East is nine years. Only 13% of these buildings have been in the market for over 20 years. In contrast, 50% of Grade A buildings in Central have been on the market for the past 25 years. Other submarkets are also running
Source: CBRE Research, Q3 2017
Figure 12: Kowloon East will eventually become Hong Kong’s largest office submarket
One carparkingspace for every 1,900 sq. ft. of office space
Grade A Office Stock (mil sq. ft. NFA)
out of new stock; the median building age in the overall market is 20 years and half of the buildings were built over 20 years ago. With at least 19 office buildings scheduled to be developed over the next ten years, the median building age in Kowloon East is forecast to drop to five years old by 2026.
The relatively younger age of office buildings in Kowloon East also means they possess the specifications to meet occupiers’ requirements. Large occupiers who engaged with developers at an early stage may even have built-to-suit premises.
CBRE Research
Kowloon East – Hong Kong’s CBD 2.022 |
Kowloon East offers a wide range of office options for companies with different requirements and scale. Of the 38 Grade A office buildings in the area, 20 are single-owned for lease, 18 are stratified and therefore also provide owner-occupation opportunities for small-to-medium sized enterprises. The floorplate size of office buildings in Kowloon East is generally bigger than other submarkets given the larger government sites made available in recent years. Over 65% of the Grade A office stock in Kowloon East has a floorplate larger than 15,000 sq. ft. net, compared with less than 34% in Central. Around 21% of the Grade A office stock in Kowloon East has a floorplate sized over 25,000 sq. ft. net. Similar options are extremely limited in Central.
10 buildings with LEED certificate by end-2021, equivalent to1/5 stocks
A self-sustained community in an attractive environment
Kowloon East is home to a 680,000-resident population in Kwun Tong, Ngau Tau Kok, Kowloon Bay and Kai Tak. Slightly over half of the area’s residents are in the workforce. Including residents of nearby Tseung Kwan O, Wong Tai Sin and Kowloon City, companies in Kowloon East have access to 1.0 million workers within a 15-minute journey, a figure equivalent to 25% of the Hong Kong’s labour pool. By the end of 2026, 31% or 1.1 million of the city’s workforce will be living in and around Kowloon East. In terms of headcount, there are circa 382,000 people already employed in Kowloon East, with office workers accounting for 116,000. By end-2026, these figures will grow to reach 498,350 and 191,000, respectively and account for 12% of Hong Kong’s total employed population.
Rents far cheaper than the Central CBD
Many occupiers are now paying very high rents in Central for buildings that are at least two or three decades old. By shifting some of their operations to decentralised markets, occupiers can achieve significant rental savings. Despite Kowloon East’s high quality office stock and forthcoming infrastructure network, office rents in the area are just a fraction of those in core submarkets. Leading Grade A office buildings in Kowloon East command rents in the range of HKD33-46 per sq. ft. per month on a net effective basis, compared with HKD150-165 per sq. ft. for similar quality buildings in Central. Rents for top-tier buildings in Wan Chai / Causeway Bay and Tsim Sha Tsui are double those in Kowloon East (HKD68-100 per sq. ft. & HKD60-100 per sq. ft. respectively).

© 2017 CBRE, Inc.
| 23Kowloon East – Hong Kong’s CBD 2.0
160
140
120
100
80
60
40
20
00 5 10 15 20 25 30 35
Bubble size denotes stock size of corresponding submarket
Non-core Submarkets Core Submarkets
KowloonEast
New Territories
KowloonOthers
Hong KongEast
Tsim Sha Tsui
Wan Chai /Causeway Bay
Sheung Wan /Admirality
Central
Wong Chuk Hang
Source: CBRE Research, Q3 2017
Figure 13: Flight-to-quality as another reason behind office decentralisation
Net Effective Rent as of Q3 2017 (HKD/sq. ft./mth)
Median Building Age (Years)
Finding a place to live in near Kowloon East is not difficult. A total of 659,000 private and public residential flats are currently available in Kowloon East. This figure is forecast to climb to 754,000 by end-2026. Kowloon East has very limited adjacent upmarket residential clusters, the closest being Kowloon Tong and Sai Kung, which are 7km and 12km away, respectively. However, this will change as new apartments gradually become available in Kai Tak.
In addition, the government will soon release land at the ex-Anderson Quarry site, about 5km away; some plots of which are suitable for low-density residential development. Yau Tong is also set to have close to 10,000 residential units to be developed over the next decade.

*In terms of floor space
CBRE Research
Kowloon East – Hong Kong’s CBD 2.024 |
Source: CBRE Research, Q3 2017
Figure 14: High quality office stock in Kowloon East
Stratified
34%
Single-owned
66%
Breakdown of stock* by ownership nature
3.0-3.5m
8%
>4.0m
4%
3.5-4.0m
18%
<2.5m
2%
2.5-3.0m
68%
Breakdown of stock* by floor-to-ceiling height
5,001-10,000 sq. ft.
16%
20,001-25,000 sq. ft.
21%
15,001-20,000 sq. ft.
13%
0-5,000 sq. ft.
6%
10,001-15,000 sq. ft.
44%
Breakdown of stock* by floorplate size(Central)
5,001-10,000 sq. ft.
8%
20,001-25,000 sq. ft.
17%
>25,001 sq. ft.
21%
0-5,000 sq. ft.
10%
10,001-15,000 sq. ft.
16%
Breakdown of stock* by floorplate size(Kowloon East)
15,001-20,000 sq. ft.
28%
24 of 38 buildings in Kowloon East have dual riser
25 of 38 buildings in Kowloon East have raised floor

© 2017 CBRE, Inc.
| 25Kowloon East – Hong Kong’s CBD 2.0
Figure 15: Residential future supply in Kowloon East
Source: CBRE Research
Major future office stock
Exisiting office stock
Future residential supply
Green space
*Greater Central includes Central, Admiralty / Sheung Wan
CBRE Research
Kowloon East – Hong Kong’s CBD 2.026 |
Source: CBRE Research, Q3 2017
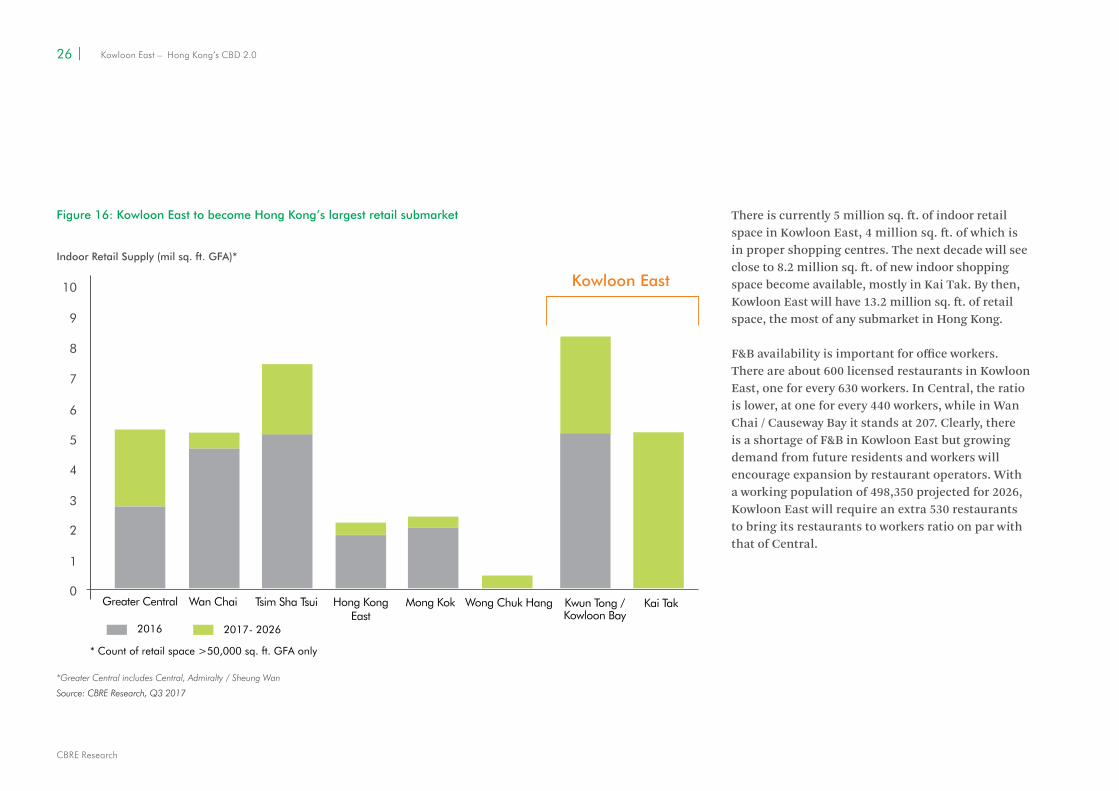
Figure 16: Kowloon East to become Hong Kong’s largest retail submarket
Kowloon East
0
1
2
3
4
5
6
7
9
8
10
Greater Central Wan Chai Tsim Sha Tsui Hong KongEast
Mong Kok Wong Chuk Hang Kwun Tong /Kowloon Bay
Kai Tak
2016
* Count of retail space >50,000 sq. ft. GFA only
2017- 2026
There is currently 5 million sq. ft. of indoor retail space in Kowloon East, 4 million sq. ft. of which is in proper shopping centres. The next decade will see close to 8.2 million sq. ft. of new indoor shopping space become available, mostly in Kai Tak. By then, Kowloon East will have 13.2 million sq. ft. of retail space, the most of any submarket in Hong Kong.
F&B availability is important for office workers. There are about 600 licensed restaurants in Kowloon East, one for every 630 workers. In Central, the ratio is lower, at one for every 440 workers, while in Wan Chai / Causeway Bay it stands at 207. Clearly, there is a shortage of F&B in Kowloon East but growing demand from future residents and workers will encourage expansion by restaurant operators. With a working population of 498,350 projected for 2026, Kowloon East will require an extra 530 restaurants to bring its restaurants to workers ratio on par with that of Central.
Indoor Retail Supply (mil sq. ft. GFA)*
© 2017 CBRE, Inc.
| 27Kowloon East – Hong Kong’s CBD 2.0
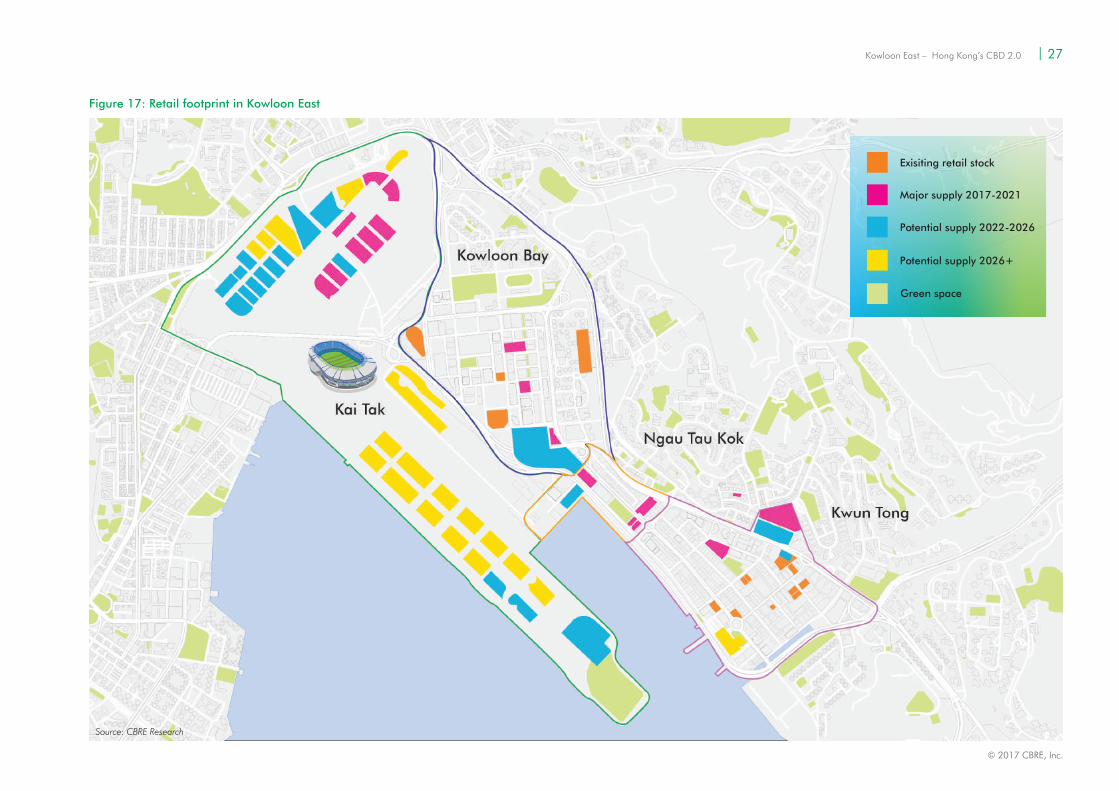
Figure 17: Retail footprint in Kowloon East
Source: CBRE Research
Green space
Potential supply 2026+
Potential supply 2022-2026
Exisiting retail stock
Major supply 2017-2021

CBRE Research
Kowloon East – Hong Kong’s CBD 2.028 |
630
207440
KOWLOON EAST
1 every 630 workers
1 every 207 workers1 every 440 workers
CENTRAL WAN CHAI /CAUSEWAY BAY
Kowloon East will also provide its population with more leisure and entertainment facilities compared to other business districts. Upon completion in 2022, the Kai Tak Sports Park that occupies 28 hectares of land will be Hong Kong’s largest sports hub. The park will be capable of hosting major international sports and entertainment events in a 50,000-seat Main Stadium, a 10,000-seat Indoor Sports Centre and a 5,000-seat Public Sports Ground. Except for the Main Stadium, all facilities in the Sports Park will be open to the public on non-event days. In addition, a 6-hectare Tourism Node where a water sports park and other entertainment and leisure facilities will be available at near the Kai Tak Cruise Terminal.
Source: Food and Environmental Hygiene Department, CBRE Research, Q3 2017
Figure 18: Plenty of room for restaurant operators to expand in Kowloon East

© 2017 CBRE, Inc.
| 29Kowloon East – Hong Kong’s CBD 2.0
Figure 19: Future helicopter view of Kowloon East
Source: CBRE Research
Kai Tak Sports Park GFA(sq. ft.)
Recreation, sports or culture 2,320,000
172,000
172,000
640,000
48,000
861,000
4,213,000
2022
Office
Hotel
Shop and services / Eating place
Entertainment
Carpark
Total
Completion year
Tourism Node GFA(sq. ft.)
988,000
1,358,000
123,000
2,469,000
2023+
Commercial (including retail, hotel, office and a public observation gallery)
Others
Entertainment and Leisure (including cinema complex)
Total
Completion year
Green space
Future office / retail / residential development
Exisiting office / retail stock
CBRE Research
Kowloon East – Hong Kong’s CBD 2.030 |
Bubble size denotes size of occupiers
GREATERCENTRAL
758K
KOWLOONEAST
634K
KOWLOONOTHERS
698K
HONG KONGEAST
70K
WONG CHUK HANG
122K156K
NEW TERRITORIES
Size of largest occupier(sq. ft. NFA) Avg. footprint of top-50 occupiers
(sq. ft. NFA)
151K 94K 54K 16K32K
218K
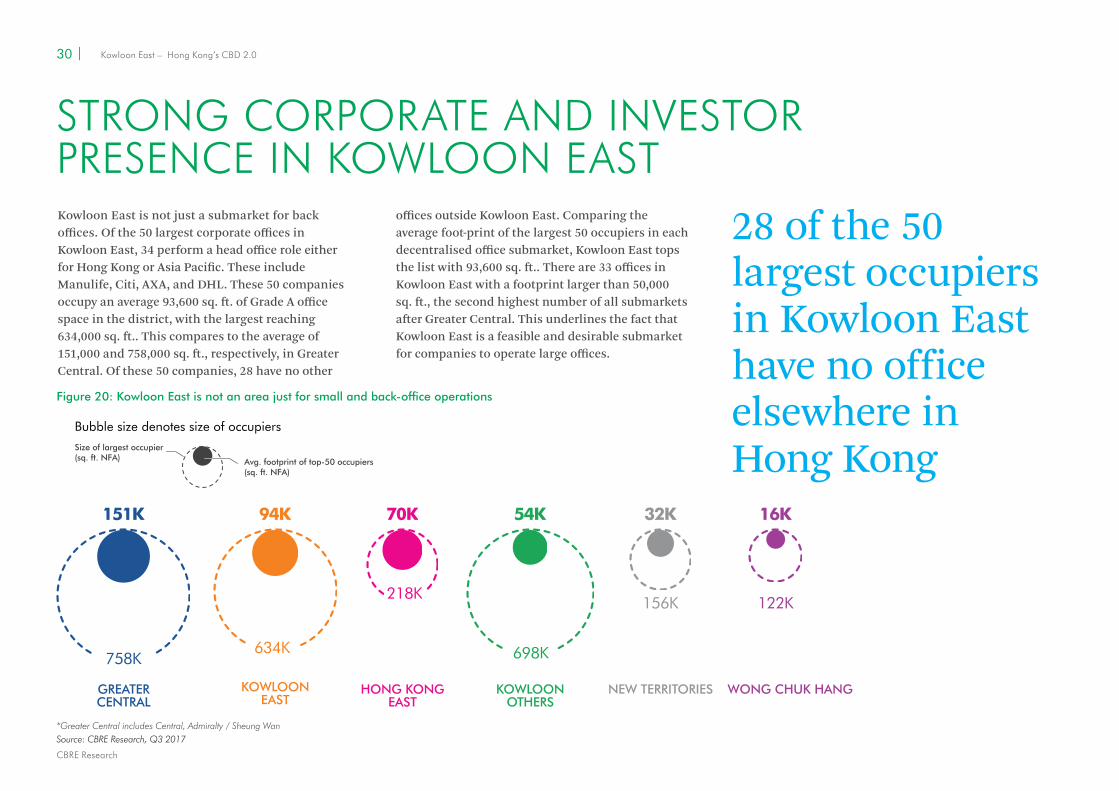
STRONG CORPORATE AND INVESTORPRESENCE IN KOWLOON EASTKowloon East is not just a submarket for back offices. Of the 50 largest corporate offices in Kowloon East, 34 perform a head office role either for Hong Kong or Asia Pacific. These include Manulife, Citi, AXA, and DHL. These 50 companies occupy an average 93,600 sq. ft. of Grade A office space in the district, with the largest reaching 634,000 sq. ft.. This compares to the average of 151,000 and 758,000 sq. ft., respectively, in Greater Central. Of these 50 companies, 28 have no other
Source: CBRE Research, Q3 2017
Figure 20: Kowloon East is not an area just for small and back-office operations
28 of the 50 largest occupiers in Kowloon East have no office elsewhere inHong Kong
offices outside Kowloon East. Comparing the average foot-print of the largest 50 occupiers in each decentralised office submarket, Kowloon East tops the list with 93,600 sq. ft.. There are 33 offices in Kowloon East with a footprint larger than 50,000 sq. ft., the second highest number of all submarkets after Greater Central. This underlines the fact that Kowloon East is a feasible and desirable submarket for companies to operate large offices.
*Greater Central includes Central, Admiralty / Sheung Wan

© 2017 CBRE, Inc.
| 31Kowloon East – Hong Kong’s CBD 2.0
Kowloon East also plays host to many smaller occupiers. Over 70% of the 1,300 Grade A office occupiers in Kowloon East have a footprint less than 5,000 sq. ft., highlighting the wide range of options available to office occupiers of different size.
The industry profile of occupiers in Kowloon East is more diverse than in the Central CBD. Around half of occupiers in Central are banking and financial sector related, but the top three sectors by foot-print (banking and finance, logistics and trading and manufacturing) in Kowloon East each have a very similar share (12% to 16%) of occupied space.
Figure 21: Big offices are found in Kowloon East
Wong Chuk HangKowloon Others
New TerritoriesHong KongEast
Wan Chai /Causeway Bay
Tsim Sha TsuiKowloonEast
0
20
10
30
40
50
60
GreaterCentral
No. of companies
53
3326
2013 12 2
20
Source: CBRE Research, Q3 2017
No. of Companies > 50,000 sq. ft.
*Greater Central includes Central, Admiralty / Sheung Wan

CBRE Research
Kowloon East – Hong Kong’s CBD 2.032 |
Firms in Kowloon East > 30,000 sq. ft. Footprint
Firms in Kowloon East< 30,000 sq. ft. Footprint
1,200
1,000
800
600
400
200
0-5k
Banking & Finance
Logistics & Trading
InsuranceIT, Tech & Telecommunications
Real Estate & Construction
Manufacturing Miscellaneous & Unidentified
Other Professional Services
Retail & Wholesale
5k-10k 10k-30k 30k-50k 50k-100k 100k-200k 200k-300k 300k-500k 500k+0
30
25
20
15
10
5
0
No. of firms No. of firms
Figure 22: A good mixture of industries in Kowloon East
Source: CBRE Research, Q3 2017
© 2017 CBRE, Inc.
| 33Kowloon East – Hong Kong’s CBD 2.0
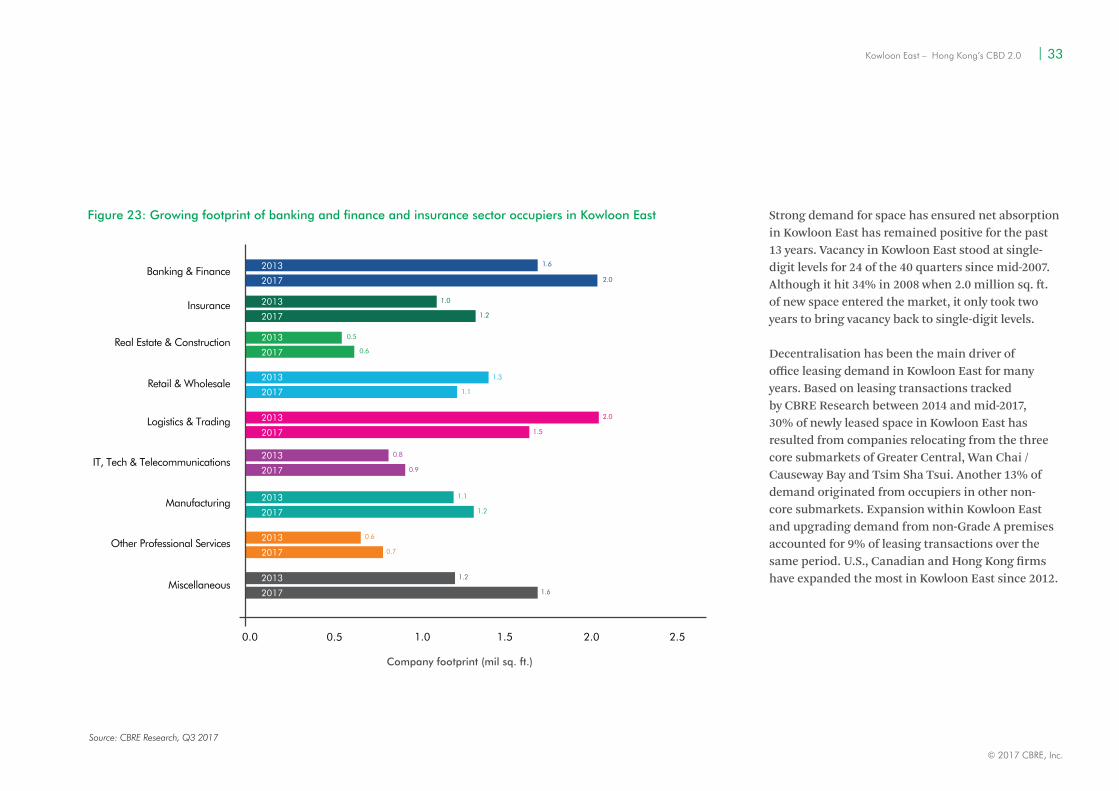
Strong demand for space has ensured net absorption in Kowloon East has remained positive for the past 13 years. Vacancy in Kowloon East stood at single-digit levels for 24 of the 40 quarters since mid-2007. Although it hit 34% in 2008 when 2.0 million sq. ft. of new space entered the market, it only took two years to bring vacancy back to single-digit levels.
Decentralisation has been the main driver of office leasing demand in Kowloon East for many years. Based on leasing transactions tracked by CBRE Research between 2014 and mid-2017, 30% of newly leased space in Kowloon East has resulted from companies relocating from the three core submarkets of Greater Central, Wan Chai / Causeway Bay and Tsim Sha Tsui. Another 13% of demand originated from occupiers in other non-core submarkets. Expansion within Kowloon East and upgrading demand from non-Grade A premises accounted for 9% of leasing transactions over the same period. U.S., Canadian and Hong Kong firms have expanded the most in Kowloon East since 2012.
0.0 1.00.5 1.5 2.0 2.5
Banking & Finance2.0
1.2
1.1
1.5
2.0
0.9
1.2
1.1
0.7
0.6
1.6
1.2
0.8
1.3
0.6
0.5
1.0
1.6
Logistics & Trading
Insurance
IT, Tech & Telecommunications
Real Estate & Construction
Manufacturing
Miscellaneous
Other Professional Services
Retail & Wholesale
2013
2017
2013
2017
2013
2017
2013
2017
2013
2017
2013
2017
2013
2017
2013
2017
2013
2017
Source: CBRE Research, Q3 2017
Figure 23: Growing footprint of banking and finance and insurance sector occupiers in Kowloon East
Company footprint (mil sq. ft.)

Kowloon East Grade A office vacancy (%)
CBRE Research
Kowloon East – Hong Kong’s CBD 2.034 |
Developers and long-term investors have also been active in purchasing assets in the future CBD. Over the past five years, a total of HKD84 billion worth of commercial real estate transactions have been recorded in Kowloon East, accounting for 36% of total commercial real estate transaction volume in Hong Kong during the same period. HKD35 billion involved deals for existing assets while the remaining HKD49 billion was for commercial development sites. Buyers have included developers, international property funds, local, Chinese and multinational end-users.
Corporates have been active in purchasing offices for self-use to hedge against rental volatility and secure permanent premises in Hong Kong’s prolonged low vacancy environment. With more new developments available for strata-title sale, Kowloon East is one of the most popular submarkets for office investment. Since 2012, over 100 Grade A office sales transactions were registered in the area, a level on par with Greater Central and also far exceeding other submarkets.
Commercial land value and office capital values in Kowloon East have risen, with average office prices climbing 18% since 2012. While accommodation values of commercial land in Kowloon East ranged between HKD4,000 to HKD6,000 per sq. ft. four to five years ago, a plot in Kai Tak was sold to Nan Fung Development in 2017 for over HKD12,800 per sq. ft..
Source: CBRE Research, Q3 2017
Figure 24: Space absorption has been fast in Kowloon East
40%
35%
30%
25%
20%
15%
2000 2001 2002 2003 2004 2005 2006 2007 2008 2009 2010 2011 2012 2013 2014 2015 2016 2017
10%
5%
0%
New supply in 2008-2009
AXA Tower, Landmark East 410,100
641,300
565,700
417,800
486,000
112,400
227,500
AIA Kowloon Tower, Landmark East
Manhattan Place
Exchange Tower
Billion Centre
Crocodile Centre
C-Bons International Center
Size (sq. ft. NFA)
© 2017 CBRE, Inc.
| 35Kowloon East – Hong Kong’s CBD 2.0
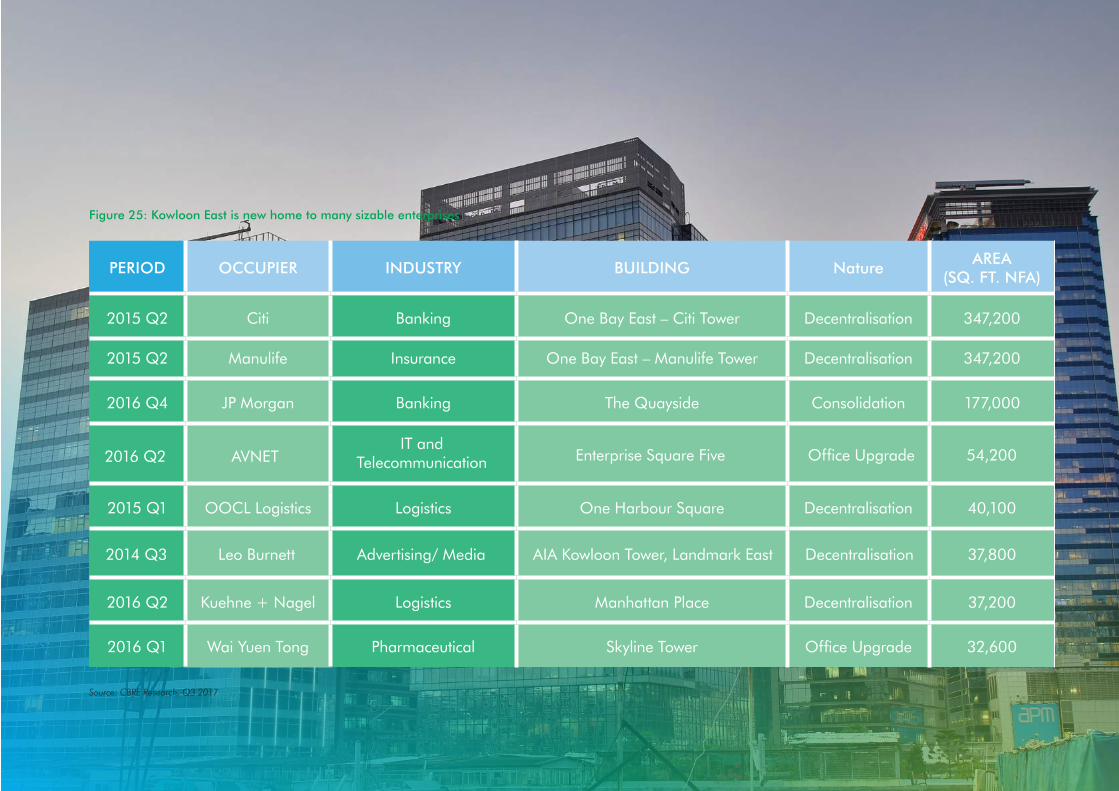
Figure 25: Kowloon East is new home to many sizable enterprises
Source: CBRE Research, Q3 2017
PERIOD OCCUPIER INDUSTRY BUILDING NatureAREA
(SQ. FT. NFA)
2015 Q2 Citi Banking One Bay East – Citi Tower Decentralisation 347,200
2015 Q2 Manulife Insurance One Bay East – Manulife Tower Decentralisation 347,200
2016 Q4 JP Morgan Banking The Quayside Consolidation 177,000
2015 Q1 OOCL Logistics Logistics One Harbour Square Decentralisation 40,100
2016 Q2 Kuehne + Nagel Logistics Manhattan Place Decentralisation 37,200
2016 Q1 Wai Yuen Tong Pharmaceutical Skyline Tower Office Upgrade 32,600
AIA Kowloon Tower, Landmark East Decentralisation 37,800Advertising/ MediaLeo Burnett2014 Q3
Enterprise Square Five Office Upgrade 54,200IT and
TelecommunicationAVNET2016 Q2

CBRE Research
Kowloon East – Hong Kong’s CBD 2.036 |
NKIL 6311GFA: 333,000 sq. ft.Accommodation Value: HK$5,458/sq. ft.Developer: Hong Kong Pacific Investment
NKIL 6312GFA: 555,000 sq. ft.Accommodation Value: HK$4,753/sq. ft.Developer: Swire Properties
0
35
40
45
25
20
15
10
5
30
2012 2013 2014 2015 2016 2017 YTD
End-users Property Funds Developers Individual Investors Unidentified Buyers Commercial Land Sale
NKIL 6556GFA: 1.9 mil sq. ft.Accommodation Value: HK$12,864/sq. ft.Developer: Nan Fung Group
KTIL 761GFA: 660,000 sq. ft.Accommodation Value: HK$5,700/sq. ft.Developer: Mapletree Investment
NKIL 6313GFA: 490,000 sq. ft.Accommodation Value: HK$6,199/sq. ft.Developer: Billion Development, Sino Land & CSI Properties
NKIL 6557GFA: 1.1 mil sq. ft.Accommodation Value: HK$6,733/sq. ft.Developer: Lifestyle International
NKIL 6512GFA: 884,000 sq. ft.Accommodation Value: HK$6,630/sq. ft.Developer: The Link REIT & Nan Fung Group
Grade A office investment
Figure 26: A heavier investment focus in Kowloon East
Source: CBRE Research, Q3 2017
Grade A office and commercial land investment volume in Kowloon East (HKD bil)

© 2017 CBRE, Inc.
| 37Kowloon East – Hong Kong’s CBD 2.0
OUTLOOK
Short-to-medium term
Advances in technology will continue to support the adoption of workplace strategy and reduce corporate demand for expensive CBD office space. At the same time, new infrastructure will improve accessibility to fringe locations. Working and communicating from different locations will become increasingly feasible and drive demand for satellite offices around town. To minimise overheads, multi-floor occupiers are expected to continue to migrate at least part of the office operations to more cost-effective locations.
Future leasing activity for office space in Kowloon East will continue to be driven by decentralisation demand from core submarket occupiers. New office supply, both in core and decentralised submarkets, has been very limited in Hong Kong for many years. However, the tight-supply and low-vacancy environment will ease as several high-quality portfolio buildings become available in decentralised submarkets, predominately in Hong Kong East and Kowloon East. Pent-up demand will be released as more suitable options for relocation and consolidation come on stream.
The increase in supply over a short timeframe will create more competition among landlords seeking tenants. Rents are expected to come under pressure in 2018 and 2019, initially in decentralised areas
where space availability is higher. This gradually filter through to core locations where landlords will be busy backfilling space vacated by tenants who have decentralised.
Flight-to-quality is unlikely to have a negative impact on landlords with properties in core areas in the medium-term. Chinese firms are expected to replace established multinationals and Hong Kong companies as the key driver of demand for office space in core submarkets. CBRE Research’s The Evolution of The Hong Kong Grade A Office Market – A Telescopic Analysis report published in 2016 estimated that 1.8 million sq. ft. of new office demand will originate from Mainland Chinese financial sector firms in the coming years. If this is extended to include potential demand from other sectors such as FinTech, insurance, IT and real estate, new demand from Chinese firms will reach 3.8 million sq. ft. Based on leasing activity by Chinese firms over the past few years, and factoring in their potentially slower overseas expansion in the short-term but offset by the increase in space availability, it could take some six to eight years to realise.
Most new demand from Chinese companies will likely be accommodated in core submarkets. Financial sector firms are expected to continue to set up their first offices in Central while other sectors will establish a presence in Wan Chai / Causeway Bay and Tsim Sha Tsui. CBRE Research does not anticipate seeing
3.8mil sq. ft. of new demand from PRC firms
much new demand from Chinese companies in decentralised submarkets, due to their smaller initial footprint, capacity to afford high rents and preference for a prominent address.
Expansion from companies with an existing presence in Hong Kong will also contribute to aggregate demand from Chinese companies. New entrants from China usually start with a small office but can expand rapidly within a few years. Chinese companies already in Hong Kong prior to 2013 leased an extra 1 million sq. ft. in the three years to 2016, a figure equivalent to 16% of their original scale. Based on this pace, CBRE Research estimates expansionary demand from Chinese enterprises over the next six to eight years will amount to 1.7 million sq. ft..
| 37Kowloon East – Hong Kong’s CBD 2.0
CBRE Research
Kowloon East – Hong Kong’s CBD 2.038 |
1.7mil sq. ft. of expansion demand from PRC firms
Future supply in core submarkets will remain limited in coming years. There will be no new office supply in Central until the Murray Road project arrives in 2021/2022, while Wan Chai / Causeway Bay and Tsim Sha Tsui will see the completion of just one project each between 2018 and 2022. These three projects combined will provide just 824,000 sq. ft. of Grade A office space.
Long-term
Kowloon East will eventually displace Central as Hong Kong’s largest office submarket. The area will see the completion of 8.9 million sq. ft. of new Grade A office space in the next ten years to reach a scale of 22.9 million sq. ft. by 2026/2027. This will continue to pull down the average building age in Kowloon East and widen the gap with core submarkets in terms of building quality.
The government has made commercial sites in Kai Tak available for sale since 2016. Another 21 plots are earmarked for commercial development in Kai Tak, Kowloon Bay and Kwun Tong. While there is no timeline for these sites to be sold, CBRE Research believes the government will closely monitor the office market and ensure the Kowloon East CBD is developed in a careful and considered manner.
The large supply of high quality office space will ensure Kowloon East emerges as a hub for many large corporations. More company headquarters will be established in Kowloon East as strategic infrastructure and community amenities become available. Central will maintain its status as Hong Kong’s premier financial CBD and continue to host government headquarters, regulatory bodies, courts, exchanges and corporate front offices. While no major works are in the pipeline, major upgrades or redevelopment will help preserve the attractiveness and competitiveness of properties in the Central CBD, many of which are several decades old.
Kowloon East – Hong Kong’s CBD 2.038 |
© 2017 CBRE, Inc.
| 39Kowloon East – Hong Kong’s CBD 2.0
The process of office decentralisation will continue but will occur over several years. Rents in Kowloon East will gradually increase as the district matures in the coming decade. Core submarket rents will remain relatively resilient during this period aside from possible generic market cycles in between. Stronger rental increases will be seen in Kowloon East, although growth will likely be back loaded. The rental gap between Kowloon East and core submarkets will eventually narrow in the long-term.
Stronger long-term rental growth will lend support to capital values. Corporate end-users seeking headquarters buildings will likely seek turnkey opportunities in Kowloon East given the higher concentration of new development projects. The transformation of Kowloon East into Hong Kong’s largest CBD and sports and entertainment hub will also generate stronger investment demand. A large volume of commercial activity and world-class entertainment and sports events will revolve around Kowloon East in the coming years, making the district one of the most vibrant in the city. Demand for offices and other commercial real estate in Kowloon East will strengthen significantly.
Kai Tak will likely outperform the other three clusters in Kowloon East as it is the only area planned and developed from scratch, while also being a future transport and event hub. Occupiers in Kai Tak will have access to ample open space and community facilities.
Purchase opportunities will be relatively limited in Kai Tak. The two commercial sites already sold include non-alienation clauses preventing developers from stratifying the future buildings. If the other sites have similar restrictions, many future office developments in Kai Tak will either be kept for portfolio leasing or available for en bloc sale only. Corporate end-users looking to invest in partial buildings will have to seek opportunities in Kwun Tong and Kowloon Bay.

CBRE Research
Kowloon East – Hong Kong’s CBD 2.040 |
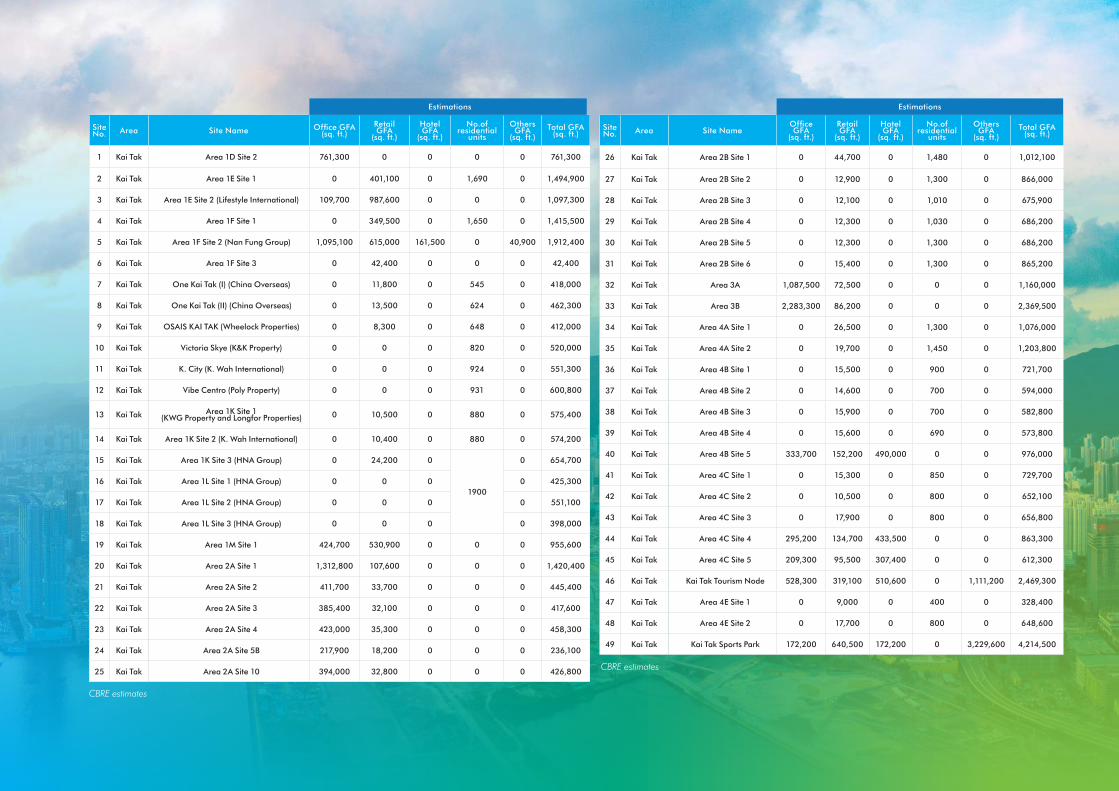
Figure 27: Future development sites available in Kowloon East - Kai Tak
Source: CBRE Research
Green space
Future office / retail / residential development
Exisiting office / retail stock
© 2017 CBRE, Inc.
| 41Kowloon East – Hong Kong’s CBD 2.0
Site No. Area Site Name Office GFA
(sq. ft.)Retail GFA
(sq. ft.)
Hotel GFA
(sq. ft.)
No.of residential
units
Others GFA
(sq. ft.)Total GFA
(sq. ft.)
1 Kai Tak Area 1D Site 2 761,300 0 0 0 0 761,300
2 Kai Tak Area 1E Site 1 0 401,100 0 1,690 0 1,494,900
3 Kai Tak Area 1E Site 2 (Lifestyle International) 109,700 987,600 0 0 0 1,097,300
4 Kai Tak Area 1F Site 1 0 349,500 0 1,650 0 1,415,500
5 Kai Tak Area 1F Site 2 (Nan Fung Group) 1,095,100 615,000 161,500 0 40,900 1,912,400
6 Kai Tak Area 1F Site 3 0 42,400 0 0 0 42,400
7 Kai Tak One Kai Tak (I) (China Overseas) 0 11,800 0 545 0 418,000
8 Kai Tak One Kai Tak (II) (China Overseas) 0 13,500 0 624 0 462,300
9 Kai Tak OSAIS KAI TAK (Wheelock Properties) 0 8,300 0 648 0 412,000
10 Kai Tak Victoria Skye (K&K Property) 0 0 0 820 0 520,000
11 Kai Tak K. City (K. Wah International) 0 0 0 924 0 551,300
12 Kai Tak Vibe Centro (Poly Property) 0 0 0 931 0 600,800
13 Kai Tak Area 1K Site 1 (KWG Property and Longfor Properties) 0 10,500 0 880 0 575,400
14 Kai Tak Area 1K Site 2 (K. Wah International) 0 10,400 0 880 0 574,200
15 Kai Tak Area 1K Site 3 (HNA Group) 0 24,200 0
1900
0 654,700
16 Kai Tak Area 1L Site 1 (HNA Group) 0 0 0 0 425,300
17 Kai Tak Area 1L Site 2 (HNA Group) 0 0 0 0 551,100
18 Kai Tak Area 1L Site 3 (HNA Group) 0 0 0 0 398,000
19 Kai Tak Area 1M Site 1 424,700 530,900 0 0 0 955,600
20 Kai Tak Area 2A Site 1 1,312,800 107,600 0 0 0 1,420,400
21 Kai Tak Area 2A Site 2 411,700 33,700 0 0 0 445,400
22 Kai Tak Area 2A Site 3 385,400 32,100 0 0 0 417,600
23 Kai Tak Area 2A Site 4 423,000 35,300 0 0 0 458,300
24 Kai Tak Area 2A Site 5B 217,900 18,200 0 0 0 236,100
25 Kai Tak Area 2A Site 10 394,000 32,800 0 0 0 426,800
Site No. Area Site Name
Office GFA
(sq. ft.)
Retail GFA
(sq. ft.)
Hotel GFA
(sq. ft.)
No.of residential
units
Others GFA
(sq. ft.)Total GFA
(sq. ft.)
26 Kai Tak Area 2B Site 1 0 44,700 0 1,480 0 1,012,100
27 Kai Tak Area 2B Site 2 0 12,900 0 1,300 0 866,000
28 Kai Tak Area 2B Site 3 0 12,100 0 1,010 0 675,900
29 Kai Tak Area 2B Site 4 0 12,300 0 1,030 0 686,200
30 Kai Tak Area 2B Site 5 0 12,300 0 1,300 0 686,200
31 Kai Tak Area 2B Site 6 0 15,400 0 1,300 0 865,200
32 Kai Tak Area 3A 1,087,500 72,500 0 0 0 1,160,000
33 Kai Tak Area 3B 2,283,300 86,200 0 0 0 2,369,500
34 Kai Tak Area 4A Site 1 0 26,500 0 1,300 0 1,076,000
35 Kai Tak Area 4A Site 2 0 19,700 0 1,450 0 1,203,800
36 Kai Tak Area 4B Site 1 0 15,500 0 900 0 721,700
37 Kai Tak Area 4B Site 2 0 14,600 0 700 0 594,000
38 Kai Tak Area 4B Site 3 0 15,900 0 700 0 582,800
39 Kai Tak Area 4B Site 4 0 15,600 0 690 0 573,800
40 Kai Tak Area 4B Site 5 333,700 152,200 490,000 0 0 976,000
41 Kai Tak Area 4C Site 1 0 15,300 0 850 0 729,700
42 Kai Tak Area 4C Site 2 0 10,500 0 800 0 652,100
43 Kai Tak Area 4C Site 3 0 17,900 0 800 0 656,800
44 Kai Tak Area 4C Site 4 295,200 134,700 433,500 0 0 863,300
45 Kai Tak Area 4C Site 5 209,300 95,500 307,400 0 0 612,300
46 Kai Tak Kai Tak Tourism Node 528,300 319,100 510,600 0 1,111,200 2,469,300
47 Kai Tak Area 4E Site 1 0 9,000 0 400 0 328,400
48 Kai Tak Area 4E Site 2 0 17,700 0 800 0 648,600
49 Kai Tak Kai Tak Sports Park 172,200 640,500 172,200 0 3,229,600 4,214,500
CBRE estimates
CBRE estimates
Estimations Estimations

CBRE Research
Kowloon East – Hong Kong’s CBD 2.042 |
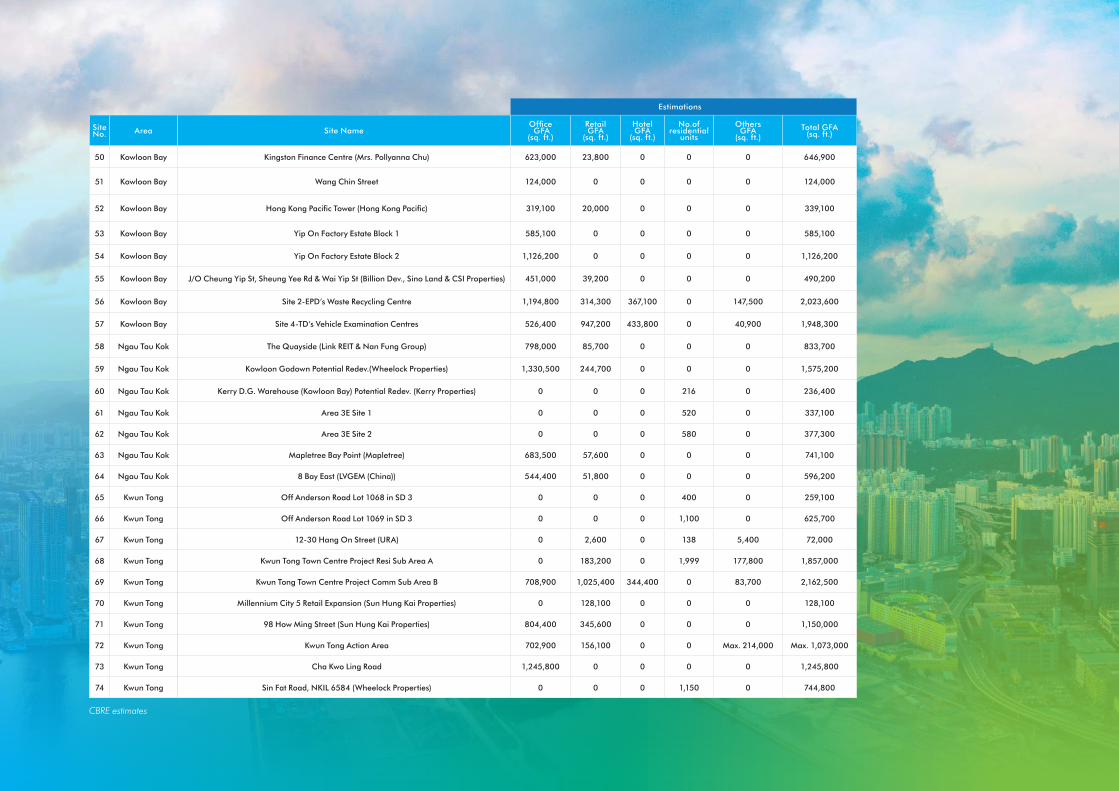
Figure 28: Future development sites available in Kowloon East - Kowloon Bay, Ngau Tau Kok and Kwun Tong
Source: CBRE Research
Green space
Future office / retail / residential development
Exisiting office / retail stock
© 2017 CBRE, Inc.
| 43Kowloon East – Hong Kong’s CBD 2.0
Site No. Area Site Name
Office GFA
(sq. ft.)
Retail GFA
(sq. ft.)
Hotel GFA
(sq. ft.)
No.of residential
units
Others GFA
(sq. ft.)Total GFA
(sq. ft.)
50 Kowloon Bay Kingston Finance Centre (Mrs. Pollyanna Chu) 623,000 23,800 0 0 0 646,900
51 Kowloon Bay Wang Chin Street 124,000 0 0 0 0 124,000
52 Kowloon Bay Hong Kong Pacific Tower (Hong Kong Pacific) 319,100 20,000 0 0 0 339,100
53 Kowloon Bay Yip On Factory Estate Block 1 585,100 0 0 0 0 585,100
54 Kowloon Bay Yip On Factory Estate Block 2 1,126,200 0 0 0 0 1,126,200
55 Kowloon Bay J/O Cheung Yip St, Sheung Yee Rd & Wai Yip St (Billion Dev., Sino Land & CSI Properties) 451,000 39,200 0 0 0 490,200
56 Kowloon Bay Site 2-EPD’s Waste Recycling Centre 1,194,800 314,300 367,100 0 147,500 2,023,600
57 Kowloon Bay Site 4-TD’s Vehicle Examination Centres 526,400 947,200 433,800 0 40,900 1,948,300
58 Ngau Tau Kok The Quayside (Link REIT & Nan Fung Group) 798,000 85,700 0 0 0 833,700
59 Ngau Tau Kok Kowloon Godown Potential Redev.(Wheelock Properties) 1,330,500 244,700 0 0 0 1,575,200
60 Ngau Tau Kok Kerry D.G. Warehouse (Kowloon Bay) Potential Redev. (Kerry Properties) 0 0 0 216 0 236,400
61 Ngau Tau Kok Area 3E Site 1 0 0 0 520 0 337,100
62 Ngau Tau Kok Area 3E Site 2 0 0 0 580 0 377,300
63 Ngau Tau Kok Mapletree Bay Point (Mapletree) 683,500 57,600 0 0 0 741,100
64 Ngau Tau Kok 8 Bay East (LVGEM (China)) 544,400 51,800 0 0 0 596,200
65 Kwun Tong Off Anderson Road Lot 1068 in SD 3 0 0 0 400 0 259,100
66 Kwun Tong Off Anderson Road Lot 1069 in SD 3 0 0 0 1,100 0 625,700
67 Kwun Tong 12-30 Hang On Street (URA) 0 2,600 0 138 5,400 72,000
68 Kwun Tong Kwun Tong Town Centre Project Resi Sub Area A 0 183,200 0 1,999 177,800 1,857,000
69 Kwun Tong Kwun Tong Town Centre Project Comm Sub Area B 708,900 1,025,400 344,400 0 83,700 2,162,500
70 Kwun Tong Millennium City 5 Retail Expansion (Sun Hung Kai Properties) 0 128,100 0 0 0 128,100
71 Kwun Tong 98 How Ming Street (Sun Hung Kai Properties) 804,400 345,600 0 0 0 1,150,000
72 Kwun Tong Kwun Tong Action Area 702,900 156,100 0 0 Max. 214,000 Max. 1,073,000
73 Kwun Tong Cha Kwo Ling Road 1,245,800 0 0 0 0 1,245,800
74 Kwun Tong Sin Fat Road, NKIL 6584 (Wheelock Properties) 0 0 0 1,150 0 744,800
CBRE estimates
Estimations

For more information about this report, please contact:
© 2017 CBRE, Inc.
For more information regarding CBRE Research, please contact:
Marcos ChanHead of Research, Hong Kong, Southern China & Taiwan [email protected]
Sharon ChanAssociate Director, ResearchHong [email protected]
Jerry NgManager, ResearchHong [email protected]
Jessy ChungAssistant Manager, ResearchHong [email protected]
Peter LeungSenior Analyst, ResearchHong [email protected]
Nick Axford, Ph.D.Global Head of [email protected]
Henry Chin, Ph.D.Head of Research, Asia Pacific [email protected]
Richard Barkham, Ph.D., MRICSGlobal Chief Economist [email protected]
Jos TrompHead of Research, [email protected]
Spencer LevyHead of Research, [email protected] Spencer on Twitter: @SpencerGLevy
To learn more about CBRE Research, or to access additional research reports, please visit the Global Research Gateway at www.cbre.com/researchgateway
CBRE RESEARCH
This report was prepared by the CBRE Hong Kong Research Team, which forms part of CBRE Research—a network of preeminent researchers who collaborate to provide real estate market research and econometric forecasting to real estate.
All materials presented in this report, unless specifically indicated otherwise, is under copyright and proprietary to CBRE. Information contained herein, including projections, has been obtained from materials and sources believed to be reliable at the date of publication. While we do not doubt its accuracy, we have not verified it and make no guarantee, warranty or representation about it. Readers are responsible for independently assessing the relevance, accuracy, completeness and currency of the information of this publication. This report is presented for information purposes only exclusively for CBRE clients and professionals, and is not to be used or considered as an offer or the solicitation of an offer to sell or buy or subscribe for securities or other financial instruments. All rights to the material are reserved and none of the material, nor its content, nor any copy of it, may be altered in any way, transmitted to, copied or distributed to any other party without prior express written permission of CBRE. Any unauthorized publication or redistribution of CBRE research reports is prohibited. CBRE will not be liable for any loss, damage, cost or expense incurred or arising by reason of any person using or relying on information in this publication.
To learn more about CBRE Research, or to access additional research reports, please visit the Global Research Gateway at www.cbre.com/research-and-reports
Follow CBRE