Kotler POM 15e IM Notes Appendix MarketingByTheNumbers
74
Appendix 2 Marketing by the Numbers Learning Objectives 1. Conduct pricing, breakeven, and margin analysis. 2. Estimate demand, develop a pro forma and actual profit- and-loss statement, and calculate various marketing performance measures. 3. Conduct financial analyses of marketing tactics. Appendix Overview This appendix provides a basic introduction to measuring marketing financial analysis and is built around a hypothetical manufacturer of consumer electronics products— HD. This company is launching a new product (a device that plays videos and television programming streamed over the Internet on multiple devices in a home including high- definition televisions, tablets, and mobile phones), and we discuss and analyze the various decisions HD’s marketing managers must make before and after launch. The appendix is organized into three sections, and while the HD scenario is carried throughout all sections, instructors can select one or more sections at their discretion. At the end of each section, quantitative exercises provide students with an opportunity to apply the concepts in that section to contexts beyond the HD example. The sections are broken down as follows: 1. Pricing, Breakeven, and Margin Analysis. This section covers pricing considerations and break-even and margin analysis assessments that guide the introduction of HD’s new product launch. 2. Demand Estimates, the Marketing Budget, and Marketing Performance Measures. This section begins Copyright © 2014 Pearson Education, Inc. Publishing as Prentice Hall 1
-
Upload
muhammad-umair -
Category
Documents
-
view
222 -
download
13
description
Instructor's Manual Principals OF Marketing 15 Ed
Transcript of Kotler POM 15e IM Notes Appendix MarketingByTheNumbers
Appendix 2Marketing by the Numbers
Learning Objectives
1. Conduct pricing, breakeven, and margin analysis.2. Estimate demand, develop a pro forma and actual profit-and-loss statement, and
calculate various marketing performance measures.3. Conduct financial analyses of marketing tactics.
Appendix Overview
This appendix provides a basic introduction to measuring marketing financial analysis and is built around a hypothetical manufacturer of consumer electronics products—HD. This company is launching a new product (a device that plays videos and television programming streamed over the Internet on multiple devices in a home including high-definition televisions, tablets, and mobile phones), and we discuss and analyze the various decisions HD’s marketing managers must make before and after launch.
The appendix is organized into three sections, and while the HD scenario is carried throughout all sections, instructors can select one or more sections at their discretion. At the end of each section, quantitative exercises provide students with an opportunity to apply the concepts in that section to contexts beyond the HD example. The sections are broken down as follows:
1. Pricing, Breakeven, and Margin Analysis. This section covers pricing considerations and break-even and margin analysis assessments that guide the introduction of HD’s new product launch.
2. Demand Estimates, the Marketing Budget, and Marketing Performance Measures. This section begins with a discussion of estimating market potential and company sales. It then introduces the marketing budget, as illustrated through a pro forma profit-and-loss statement followed by the actual profit-and-loss statement. Next, the section discusses marketing performance measures, with a focus on helping marketing managers to better defend their decisions from a financial perspective.
3. Financial Analysis of Marketing Tactics. The final section analyzes the financial implications of various marketing tactics, such as increasing advertising expenditures, adding sales representatives to increase distribution, lowering price, or extending the product line.
In this manual, solutions to the quantitative exercises follow the outline of the section in which each set of exercises appears. Additionally, fifteen additional quantitative exercises similar to those in the appendix are provided at the end of the material for this manual. These may be used in lectures, for additional student practice, or for exams.
Copyright © 2014 Pearson Education, Inc. Publishing as Prentice Hall 1

Appendix Outline
I. Pricing, Breakeven, and Margin Analysis
A. Pricing Considerations
1. The limiting factors are demand and costs.
2. Determining Costsa) Fixed costs do not vary with production or sales (e.g., rent,
interest, depreciation, clerical and managerial salaries).b) Variables costs vary directly with the level of production
(e.g., cost of goods sold and many marketing costs).c) Total costs are the sum of the fixed and variable costs.
3. Setting Price Based on Costsa) Cost-plus pricing (or markup pricing) simply adds a
standard markup to the cost of the product.(1) Unit cost for HD:
fixed costs $20,000,000 Unit cost = variable cost + —————— = $125 + ————— = $145
unit sales 1,000,000
(2) If HD desires a 25% markup on sales:
unit cost $145Markup price = ——————————— = ——— = $193.33
(l - desired return on sales) (l - 0.25)
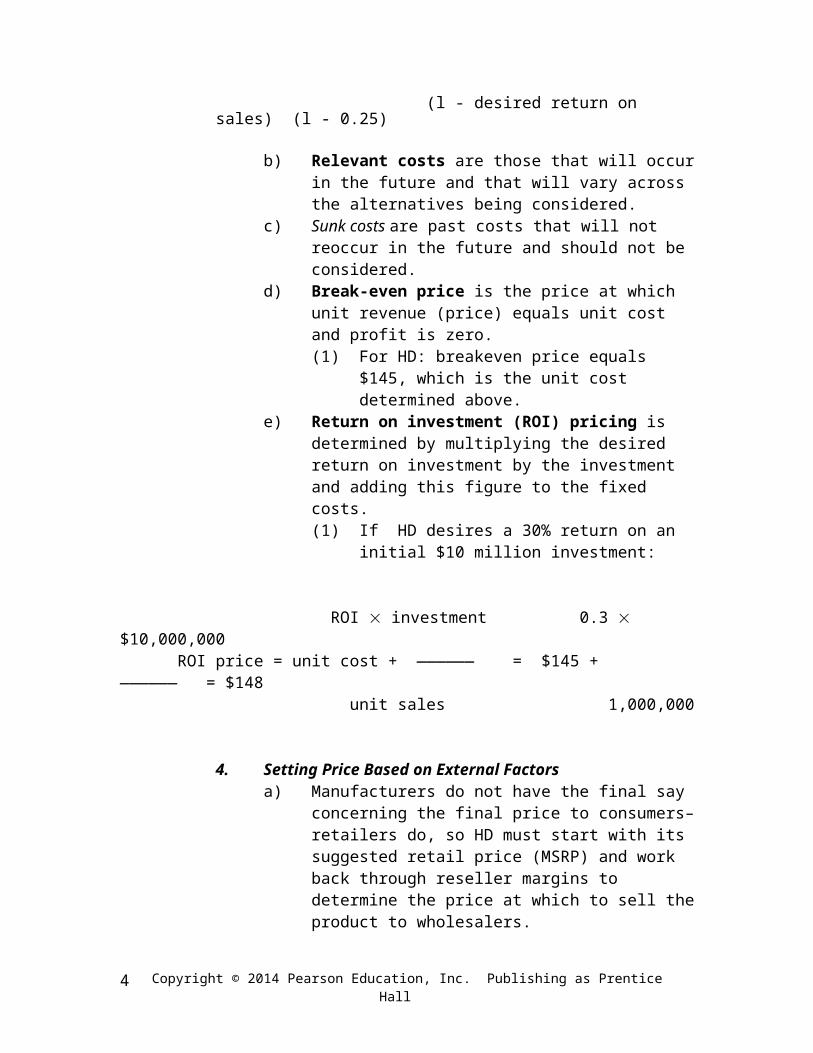
b) Relevant costs are those that will occur in the future and that will vary across the alternatives being considered.
c) Sunk costs are past costs that will not reoccur in the future and should not be considered.
d) Break-even price is the price at which unit revenue (price) equals unit cost and profit is zero.(1) For HD: breakeven price equals $145, which is the
unit cost determined above.e) Return on investment (ROI) pricing is determined by
multiplying the desired return on investment by the investment and adding this figure to the fixed costs.(1) If HD desires a 30% return on an initial $10 million
investment:
Copyright © 2014 Pearson Education, Inc. Publishing as Prentice Hall2

ROI investment 0.3 $10,000,000 ROI price = unit cost + —————— = $145 + —————— = $148
unit sales 1,000,000
4. Setting Price Based on External Factorsa) Manufacturers do not have the final say concerning the
final price to consumers–retailers do, so HD must start with its suggested retail price (MSRP) and work back through reseller margins to determine the price at which to sell the product to wholesalers.
b) Dollar markup is the difference between a company’s selling price for a product and its cost to manufacture or purchase it:
Dollar markup = selling price – cost
c) Markups are usually expressed as a percentage, and there are two different ways to compute markups–on cost or on selling price:
Teaching Note: Sometimes a retailer wants to convert markups based on selling price to markups based on cost, and vice versa. The formulas are:
Suppose a retailer uses a markup of 25% based on selling price and found that his competitor was using a markup of 30% based on cost and wanted to know what this would be as a percentage of selling price. The calculation is:
Copyright © 2014 Pearson Education, Inc. Publishing as Prentice Hall 3
Because the retailer is using a 25% markup on selling price for similar products, his markup is comparable with that of the competitor.
See additional quantitative exercise 6 for another application.
d) Value-based pricing uses buyers’ perceptions of value and not the seller’s cost to determine the MSRP.
e) HD example: MSRP = $299.99, but $300 is used in calculations for simplicity; retailer’s margin is 30% and wholesaler’s is 20%, both based on their selling prices.(1) Thus, the markup chain is:
Suggested retail price: $300minus retail margin (30%): $ 90
Retailer’s cost/wholesaler’s price: $210minus wholesaler’s margin (20%): $ 42
Wholesaler’s cost/HD’s price: $168
Teaching Note: Students should also be able to calculate prices when cost and markup information is known. For example, suppose a retailer knew his cost ($12) and desired markup on price (25%) for a product and wanted to compute the selling price. Substituting (selling price – cost) for dollar markup in the equation for markup percentage on selling price given previously and solving for selling price gives the following formula for determining the selling price:
See quantitative exercise 1.4 and additional quantitative exercises 4 and 5 for more applications of this equation.
B. Break-Even and Margin Analysis
1. Determining Breakeven Unit Volume and Dollar Salesa) Break-even analysis determines the unit volume and dollar
sales needed to be profitable given a particular price and cost structure.
b) Formula for determining break-even unit volume:
fixed costs Break-even volume = ———————————
price unit variable cost
Copyright © 2014 Pearson Education, Inc. Publishing as Prentice Hall4

c) The denominator (price unit variable cost) is called unit contribution (sometimes called contribution margin) and represents the amount that each unit contributes to covering fixed costs.
d) HD’s break-even unit volume is:
fixed cost $20,000,000 Break-even volume = ———————— = ————— = 465,116.2 units
price variable cost $168 $125
So HD will break-even at 465,117 units.
e) Break-even dollar sales can be determined by multiplying unit breakeven volume by selling price:
BE sales = BEvol price = 465,117 units $168 = $78,139,656
f) Another way to calculate break-even sales is to use the percentage contribution margin (hereafter referred to as contribution margin), which is the unit contribution divided by the selling price:
price - variable cost $168 $125 Contribution margin = ———————— = —————— = 0.256 or 25.6%
price $168
fixed costs $20,000,000 Break-even sales = ———————— = —————— = $78,125,000
contribution margin 0.256
(1) Note: the difference between the two break-even sales calculations is due to rounding.
g) Contribution margin can also be calculated as follows:
total sales – total variable costsContribution margin = ———————————
total sales
h) Another way to determine contribution margin for any sales level is by setting sales equal to 100% and subtracting the percentage of variable costs from sales. For HD, variable costs represent 74% of sales (which can be determined by dividing unit variable costs by price, or $125 $168), so contribution margin can be determined as follows:
100% 74% 1 0.74 Contribution margin = —————— = ——— = 1 0.74 = 0.26 or 26%
Copyright © 2014 Pearson Education, Inc. Publishing as Prentice Hall 5

100% 1
2. Determining “Break-even” for Profit Goalsa) While break-even analysis is useful, most companies are
more interested in making a profit.b) When profit is expressed as an absolute amount, simply add
the profit figure to fixed costs and again divide by the unit contribution to determine unit sales (HD would like to realize a $5 million profit in the first year):
fixed cost profit goal $20,000,000 + $5,000,000 Unit volume = —————————— = —————————— = 581,395.3 units
price variable cost $168 $125
Dollar sales = 581,396 units $168 = $97,674,528
or
fixed cost profit goal $20,000,000 + $5,000,000 Sales = —————————— = —————————— = $97,656,250
contribution margin 0.256
Again, note that the difference in the sales calculations is due to rounding.
c) Profit can also be stated as a return on investment goal. Determine the absolute profit goal by multiplying the investment by the desired ROI (HD wants a 30% return on its $10 million investment ($10,000,000 0.30)):
fixed cost profit goal $20,000,000 + $3,000,000 Unit volume = ————————— = —————————— = 534,884 units
price variable cost $168 $125
Dollar sales = 534,884 units $168 = $89,860,512
or
fixed cost profit goal $20,000,000 + $3,000,000 Dollar sales = ————————— = —————————— = $89,843,750
contribution margin 0.256
Copyright © 2014 Pearson Education, Inc. Publishing as Prentice Hall6

d) Profit goals can also be expressed as a percentage of sales. In this case, we incorporate the profit goal into the unit contribution as an additional variable cost (HD wants a 25% return on sales):
fixed cost fixed cost Unit volume = ——————————— or ——————————
price variable cost (0.25 price) (0.75 price) variable cost
So,
$20,000,000 Unit volume = ————————— = 20,000,000 units
(0.75 $168) $125
Dollar sales necessary = 20,000,000 units $168 = $3,360,000,000
C. Marketing by the Numbers Exercise Set One
1.1. Elkins, a manufacturer of ice makers, realizes a cost of $250 for every unit it produces. Its total fixed costs equal $5 million. If the company manufactures 500,000 units, compute the following:
a. unit costb. markup price if the company desires a 10% return on salesc. ROI price if the company desires a 25% return on an investment of $1
million
Answer:
fixed costs $5,000,000 a.) Unit cost = variable cost + —————— = $250 + ————— = $260
unit sales 500,000
unit cost $260b.) Markup price = ————————————— = ——— = $288.89
(l desired return on sales) (l 0.1)
ROI investment (0.25 $1,000,000) c.) ROI price = unit cost + ——————— = $260 + —————— = $260.50
unit sales 500,000
Copyright © 2014 Pearson Education, Inc. Publishing as Prentice Hall 7

1.2. A gift shop owner purchases items to sell in her store. She purchases a chair for $125 and sells it for $275. Determine the following:
a. dollar markupb. markup percentage on costc. markup percentage on selling price
Answer:
a.) Dollar markup = selling price cost = $275 $125 = $150
dollar markup $150b.) Markup percentage on cost = ——————— = ——— = 1.2 = 120%
cost $125
dollar markup $150c.) Markup percentage on price = ——————— = ——— = 0.545 = 54.5%
price $275
1.3. A consumer purchases a coffee maker from a retailer for $90. The retailer’s markup is 30%, and the wholesaler’s markup is 10%, both based on selling price. For what price does the manufacturer sell the product to the wholesaler?
Answer:price cost
Markup percentage on price = —————— price
so,Cost at each level = price (price markup%)
The retailer’s cost = $90 ($90 0.3) = $63, which is the price the wholesaler sells it to the retailer.
The wholesaler’s cost = $63 ($63 0.10) = $56.70, which is the price the manufacturer sells the product to the wholesaler.
Another way to compute this is:
Retail price: $90.00minus retail margin (30%): $27.00
Retailer’s cost/wholesaler’s price: $63.00minus wholesaler’s margin (10%): $ 6.30
Wholesaler’s cost/manufacturer’s price $56.70
Copyright © 2014 Pearson Education, Inc. Publishing as Prentice Hall8

1.4. A lawnmower manufacturer has a unit cost of $140 and wishes to achieve a margin of 30% based on selling price. If the manufacturer sells directly to a retailer who then adds a set margin of 40% based on selling price, determine the retail price charged to consumers.
Answer:
price cost Markup percentage on price = ——————
price
So, at any level in the chain:
cost price = —————
(1 markup)
cost $140 Manufacturer’s price = ————— = ————— = $200
(1 markup) (1 0.3)
cost $200 Retailer’s price = ————— = ————— = $333.33
(1 markup) (1 0.4)
1.5. Advanced Electronics manufactures DVDs and sells them directly to retailers who typically sell them for $20. Retailers take a 40% margin based on the retail selling price. Advanced’s cost information is as follows:
DVD package and disc $2.50/DVDRoyalties $2.25/DVDAdvertising and promotion $500,000Overhead $200,000
Calculate the following:a. contribution per unit and contribution marginb. break-even volume in DVD units and dollarsc. volume in DVD units and dollar sales necessary if Advanced’s profit goal
is 20% profit on sales.d. net profit if 5 million DVDs are sold
Answer:
a.) Unit contribution = selling price unit variable cost
Copyright © 2014 Pearson Education, Inc. Publishing as Prentice Hall 9

To determine Advanced’s selling price, we must subtract the retailer’s margin from the retail price: Advanced’s price = retail price (retail price percentage retailer margin) = $20 ($20 0.4) = $12.
To determine Advanced’s variable cost, we must add up the variable costs. Unit variable costs = $2.50 + $2.25 = $4.75
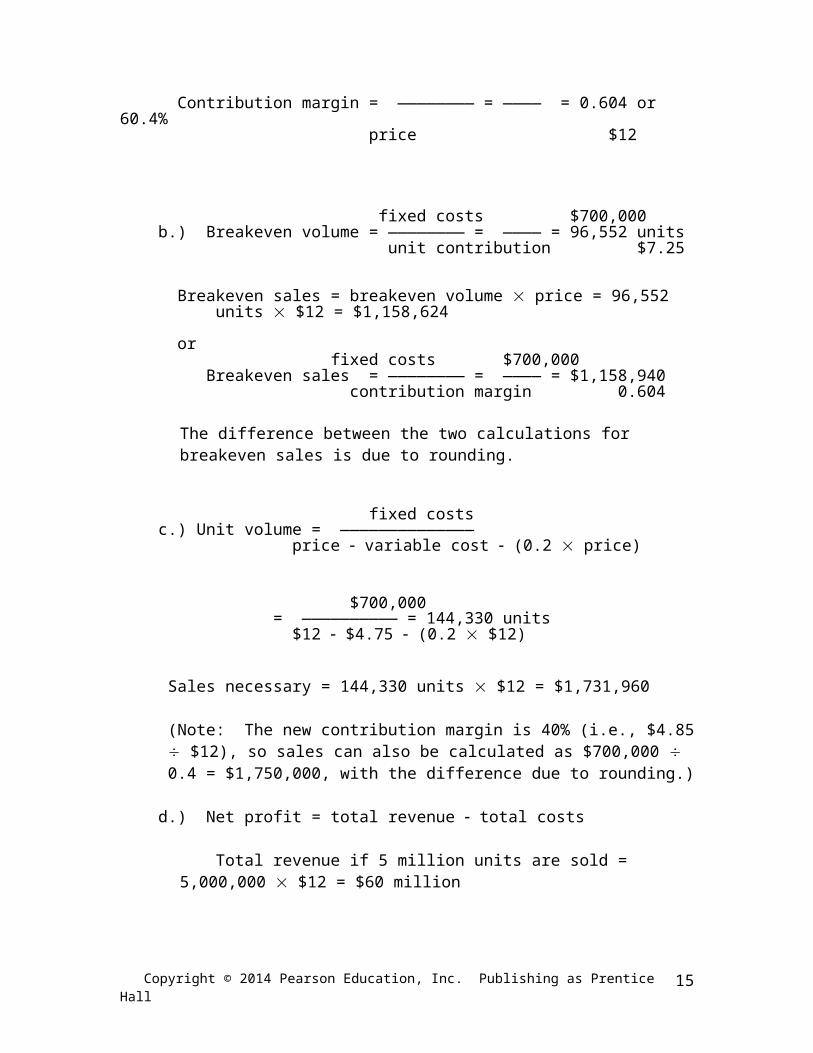
Therefore, the contribution per unit = $12 $4.75 = $7.25
unit contribution $7.25 Contribution margin = ———————— = ———— = 0.604 or 60.4%
price $12
fixed costs $700,000b.) Breakeven volume = ———————— = ———— = 96,552 units
unit contribution $7.25
Breakeven sales = breakeven volume price = 96,552 units $12 = $1,158,624
orfixed costs $700,000
Breakeven sales = ———————— = ———— = $1,158,940 contribution margin 0.604
The difference between the two calculations for breakeven sales is due to rounding.
fixed costs
c.) Unit volume = —————————————— price variable cost (0.2 price)
$700,000 = —————————— = 144,330 units
$12 $4.75 (0.2 $12)
Sales necessary = 144,330 units $12 = $1,731,960
(Note: The new contribution margin is 40% (i.e., $4.85 $12), so sales can also be calculated as $700,000 0.4 = $1,750,000, with the difference due to rounding.)
d.) Net profit = total revenue total costs
Copyright © 2014 Pearson Education, Inc. Publishing as Prentice Hall10

Total revenue if 5 million units are sold = 5,000,000 $12 = $60 million
Total cost is equal to TFC + TVC, so if 5 million units are sold:
Total cost = $700,000 + ($4.75 5,000,000) = $24,450,000
Net profit = $60,000,000 $24,450,000 = $35,550,000
(Note: Students may merely subtract the fixed costs from the total contribution: ($7.25 5,000,000 units) $700,000 = $35,550,000.)
II. Demand Estimates, The Marketing Budget, and Marketing Performance Measures
A. Market Potential and Sales Estimates
1. While determining sales needed to break even or attain various profit goals is useful, companies need more information regarding demand in order to assess the feasibility of attaining the needed sales levels.
2. Total market demand for a product or service is the total volume that would be bought by a defined consumer group in a defined geographic area in a defined time period in a defined marketing environment under a defined level of mix of industry marketing effort.
3. The upper limit of market demand is called market potential.
4. One practical method for estimating total market demand uses three variables:a) number of prospective buyersb) quantity purchased by an average buyer per yearc) price of an average unitd) Market demand can be determined as follows:
Q = n q p
where
Q = total market demand n = number of buyers in the marketq = quantity purchased by an average buyer per yearp = price of an average unit
Copyright © 2014 Pearson Education, Inc. Publishing as Prentice Hall 11

5. A variation of this approach is the chain ratio method, which involves multiplying a base number by a chain of adjusting percentages.a) HD can estimate U.S. demand using a chain of calculations
like the following:
Total number of U.S. households
× The percentage of HDTV-owning U.S. households with broadband Internet access
× The percentage of these households willing and able to buy this device
b) Industry and company research estimates the following: Approximately 113 million U.S. households; 60% own at least one HDTV and have broadband Internet access; 30% of households are willing and able to buy this device. So the total number of potential households is: 113 million households 0.60 0.30 = 20.34 million households.
c) Households need only one device.d) Average retail price across all brands is $350.e) Estimating total market demand for product can be
calculated as: 20.34 million households 1 device per household $350 = $7.119 billion.
f) As can be seen, this estimate of market potential relies heavily on assumptions regarding adjusting percentages, average quantity, and average prices. Thus, companies must make certain that its assumptions are reasonable and defendable.
g) Because market potential sales estimates can vary given the average price used, HD uses unit sales potential to determine its sales estimate for next year. HD expects to attain 3.66% market share in the first year after launching this product, resulting in a forecasted unit sales of 20.34 million units 0.0366 = 744,444 units. At a price of $168 per unit, estimated sales are $125,066,592 (744,444 units $168 per unit). For simplicity, further analyses use forecasted sales of $125 million.
B. The Profit-and-Loss Statement and Marketing Budget
1. A pro forma (or projected) profit-and-loss statement (also called an income statement or operating statement) shows projected revenues less budgeted expenses and estimates the projected net profit for an organization, product, or brand during a specific planning period, typically a year.
Copyright © 2014 Pearson Education, Inc. Publishing as Prentice Hall12

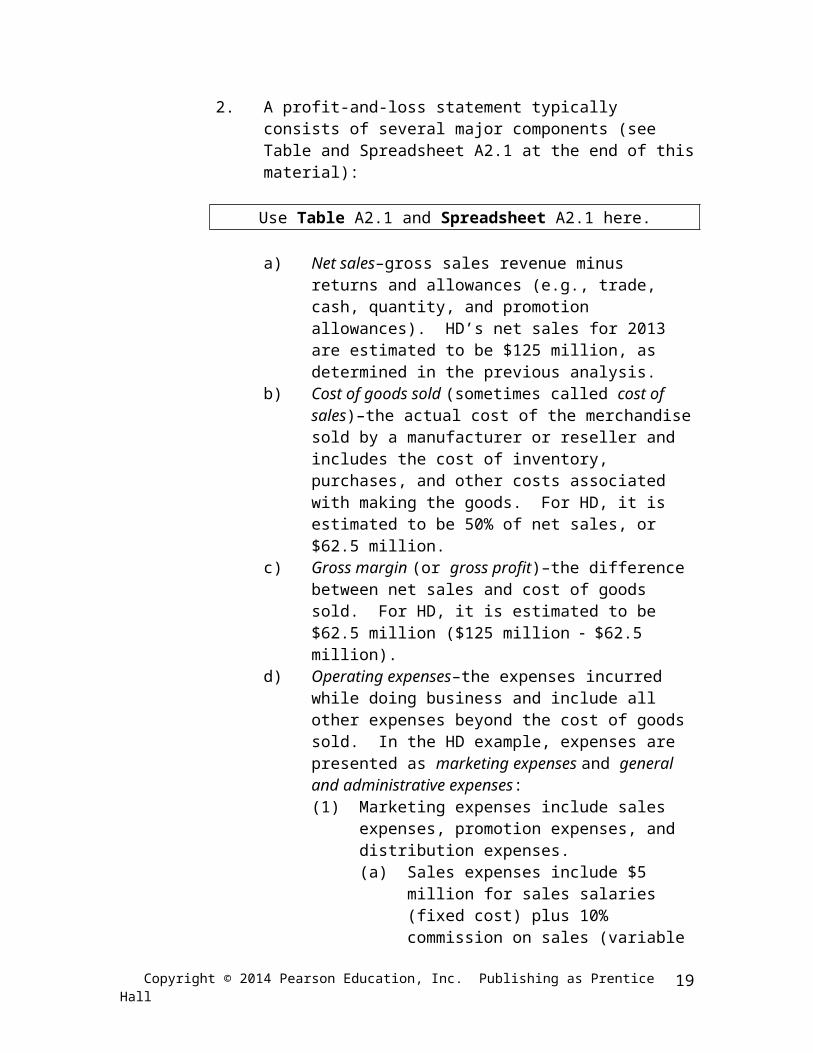
2. A profit-and-loss statement typically consists of several major components (see Table and Spreadsheet A2.1 at the end of this material):
Use Table A2.1 and Spreadsheet A2.1 here.
a) Net sales–gross sales revenue minus returns and allowances (e.g., trade, cash, quantity, and promotion allowances). HD’s net sales for 2013 are estimated to be $125 million, as determined in the previous analysis.
b) Cost of goods sold (sometimes called cost of sales)–the actual cost of the merchandise sold by a manufacturer or reseller and includes the cost of inventory, purchases, and other costs associated with making the goods. For HD, it is estimated to be 50% of net sales, or $62.5 million.
c) Gross margin (or gross profit)–the difference between net sales and cost of goods sold. For HD, it is estimated to be $62.5 million ($125 million $62.5 million).
d) Operating expenses–the expenses incurred while doing business and include all other expenses beyond the cost of goods sold. In the HD example, expenses are presented as marketing expenses and general and administrative expenses:(1) Marketing expenses include sales expenses,
promotion expenses, and distribution expenses.(a) Sales expenses include $5 million for sales
salaries (fixed cost) plus 10% commission on sales (variable cost). Thus, total budgeted sales expense is $17.5 million ($5 million plus 10% of $125 million).
(b) Promotion expenses include $10 million budgeted for advertising and promotion (fixed cost) plus 4% of sales ($5 million) for cooperative advertising allowances to retailers (variable cost) for a total of $15 million.
(c) Distribution expenses include freight and delivery charges that are budgeted at 10% of sales (variable cost) for a total of $12.5 million (10% of $125 million).
(d) Total marketing expenses are estimated to be $45 million ($17.5 million $15 million $12.5 million).
(2) General and administrative expenses are estimated at $5 million (fixed cost), broken down into $2 million for managerial salaries and expenses for the
Copyright © 2014 Pearson Education, Inc. Publishing as Prentice Hall 13

marketing function and $3 million of indirect overhead allocated to this product by the corporate accountants.
e) Net profit before taxes–profit earned after all costs are deducted. HD’s estimated net profit is $12.5 million.
3. Table A2.1 (and Table A2.2) also indicates the percentage of sales that each component of the profit-and-loss statement represents. These percentages are determined by dividing the cost figure by net sales.
C. Marketing Performance Measures
1. Whereas the pro forma profit-and-loss statement shows projected financial performance, the statement given in Table A2.2 shows HD’s actual financial performance based on actual sales, cost of goods sold, and expenses during the past year.
Use Table A2.2 and Spreadsheet A2.2 here.
2. Why did HD lose $1 million rather than make the $12.5 million projected profit?a) Net sales were only $100 million, which is $25 million
short of estimated sales.b) Cost of goods sold as a percentage of sales exceeded
expectations (55% rather than the 50% budgeted).c) Allocated indirect overhead was $5 million rather than the
estimated $3 million.
3. At what level of sales would HD have broken even?a) Contribution margin was 21% rather than the estimated
26% (variable cost represented 79% of sales, so contribution margin = 1 0.79 = 0.21 = 21%).
b) Break-even sales can be calculated:
fixed costs $22,000,000 Break-even sales = ————————— = —————— = $104,761,905
contribution margin 0.21
4. Industry sales fell short of forecasted sales and were $2.5 billion, so HD’s market share was 4% ($100 million $2.5 billion = 0.04 = 4%).
5. Analytic Ratios
Copyright © 2014 Pearson Education, Inc. Publishing as Prentice Hall14
a) Operating ratios are the ratios of selected operating statement items to net sales.
b) Gross margin percentage indicates the percentage of net sales remaining after cost of goods sold that can contribute to operating expenses and net profit before taxes.(1) For HD:
gross margin $45,000,000 Gross margin percentage = —————— = —————— = 0.45 = 45%
net sales $100,000,000
(2) If there was previous history for this product and this ratio was declining, management should examine it more closely to determine why it has decreased (i.e., decrease in sales volume or price, an increase in costs, or a combination of these).
c) Net profit percentage shows the percentage of each sales dollar going to profit.(1) For HD:
net profit $1,000,000 Net profit percentage = ————— = —————— = 0.01 = 1.0%
net sales $100,000,000
d) Operating expense percentage indicates the portion of net sales going to operating expenses.(1) For HD:
total expenses $46,000,000 Operating expense percentage = —————— = —————— = 0.46 = 46%
net sales $100,000,000
e) Inventory turnover rate (also called stockturn rate for resellers) is the number of times an inventory turns over or is sold during a specified time period (often one year).
Teaching Note: It may be computed on a cost, selling price, or a unit basis. The formulas are:
Cost of goods sold Stockturn rate = ———————————
Average inventory at cost
or
Selling price of goods sold Stockturn rate = ———————————
Copyright © 2014 Pearson Education, Inc. Publishing as Prentice Hall 15

Avg. selling price of inventory
or
Sales in units Stockturn rate = ———————————
Average inventory in units
(1) Assuming HD’s beginning and ending inventories were $30 million and $20 million, respectively, the inventory turnover rate computed on a cost basis is:
$55,000,000 $55,000,000 Inventory turnover rate = ——————————— = —————— = 2.2
($30,000,000 + $20,000,000)/2 $25,000,000
(2) The higher the turnover rate, the higher the management efficiency and company profitability, but this rate should be compared to industry averages, competitors’ rates, and past performance.
f) Return on investment (ROI) is used to measure managerial effectiveness and efficiency.(1) It is the ratio of net profits to total investment,
which includes capital investments in land, buildings, and equipment plus inventory costs.
(2) For HD, total investment includes the initial $10 million to refurbish the manufacturing facility plus average inventory ($25 million determined in the previous inventory turnover rate calculation):
net profit before taxes $1,000,000 Return on investment = ——————— = —————— = .0286 = 2.86%
investment $35,000,000
6. Marketing Profitability Metricsa) If HD drops this product, the profits of the total
organization will decrease by $4 million!b) Net Marketing Contribution (NMC). Measures
marketing profitability.(1) Does not include operating expenses not under
marketing’s control (e.g., allocated indirect overhead).
(2) NMC = net sales cost of goods sold marketing expenses
(3) For HD, NMC = $100 million $55 million $41 million = $4 million(a) Marketing expenses include sales expenses
($15 million), promotion expenses ($14
Copyright © 2014 Pearson Education, Inc. Publishing as Prentice Hall16

million), freight expenses ($10 million), and the managerial salaries and expenses of the marketing function ($2 million), which total $41 million.
(b) The product contributed $4 million to HD’s overall company profits.
(c) If the product is dropped, the $5 million in fixed overhead expenses will not disappear–it will simply have to be allocated elsewhere, but the $4 million in NMC will disappear.
c) Marketing Return on Sales and Investment(1) Marketing return on sales (ROS) shows the net
sales attributable to the net marketing contribution.(a) For HD:
net marketing contribution $4,000,000 Marketing ROS = ——————————— = —————— = 0.04 = 4%
net sales $100,000,000
(2) Marketing ROI measures the marketing productivity of a marketing investment.(a) For HD:
net marketing contribution $4,000,000 Marketing ROI = ——————————— = —————— = 0.0976 = 9.76%
marketing expenses $41,000,000
(b) Marketing ROI could be greater than 100%, which can be achieved by attaining a higher net marketing contribution and/or a lower total marketing expense.
Copyright © 2014 Pearson Education, Inc. Publishing as Prentice Hall 17

D. Marketing by the Numbers Exercise Set Two
2.1. Determine the market potential for a product that has 20 million prospective buyers who purchase an average of 2 per year and price averages $50. How many units must a company sell if it desires a 10% share of this market?
Answer:
Q = n q p
where
Q = total market demand n = number of buyers in the marketq = quantity purchased by an average buyer per yearp = price of an average unit
The upper limit of market demand is called market potential. It’s a straightforward calculation:
Q = 20,000,000 buyers 2 units per buyer $50 per unit = $2 billion
Market share = (20,000,000 buyers 2 units per buyer) 0.1 = 4 million units
2.2. Develop a profit-and-loss statement for the Westgate division of North Industries. This division manufactures light fixtures sold to consumers through home improvement and hardware stores. Cost of goods sold represents 40% of net sales. Marketing expenses include selling expenses, promotion expenses, and freight. Selling expenses include sales salaries totaling $3 million per year and sales commissions (5% of sales). The company spent $3 million on advertising last year, and freight costs were 10% of sales. Other costs include $2 million for managerial salaries and expenses for the marketing function and another $3 million for indirect overhead allocated to the division.
a. Develop the profit-and-loss statement if net sales were $20 million last year.
b. Develop the profit-and-loss statement if net sales were $40 million last year.
c. Calculate Westgate’s breakeven sales.
Teaching Note: The profit-and-loss statements can be developed using Spreadsheet A2.1 or A2.2, but the equations in some cells will need to be changed to reflect the percentages for this problem.
Copyright © 2014 Pearson Education, Inc. Publishing as Prentice Hall18
a.) The profit-and-loss statement at $20 million net sales:
Sales $20,000,000Cost of goods sold 8,000,000Gross Margin $12,000,000
Marketing Expenses Sales expenses $4,000,000 Promotion expenses 3,000,000 Freight 2,000,000 9,000,000
General and Administrative Expenses Managerial salaries and expenses $2,000,000 Indirect overhead 3,000,000 5,000,000Net profit before income tax ($2,000,000)
where,
Cost of goods sold = 40% of $20 million sales = $8,000,000
Gross margin = net sales cost of goods sold = $20,000,000 $8,000,000 = $12,000,000
Sales expenses = $3 million for salaries + 5% of $20 million sales = $3,000,000 +
$1,000,000 = $4,000,000
Promotion expenses = $3,000,000 (fixed cost)
Freight = 10% of $20 million sales = $2,000,000
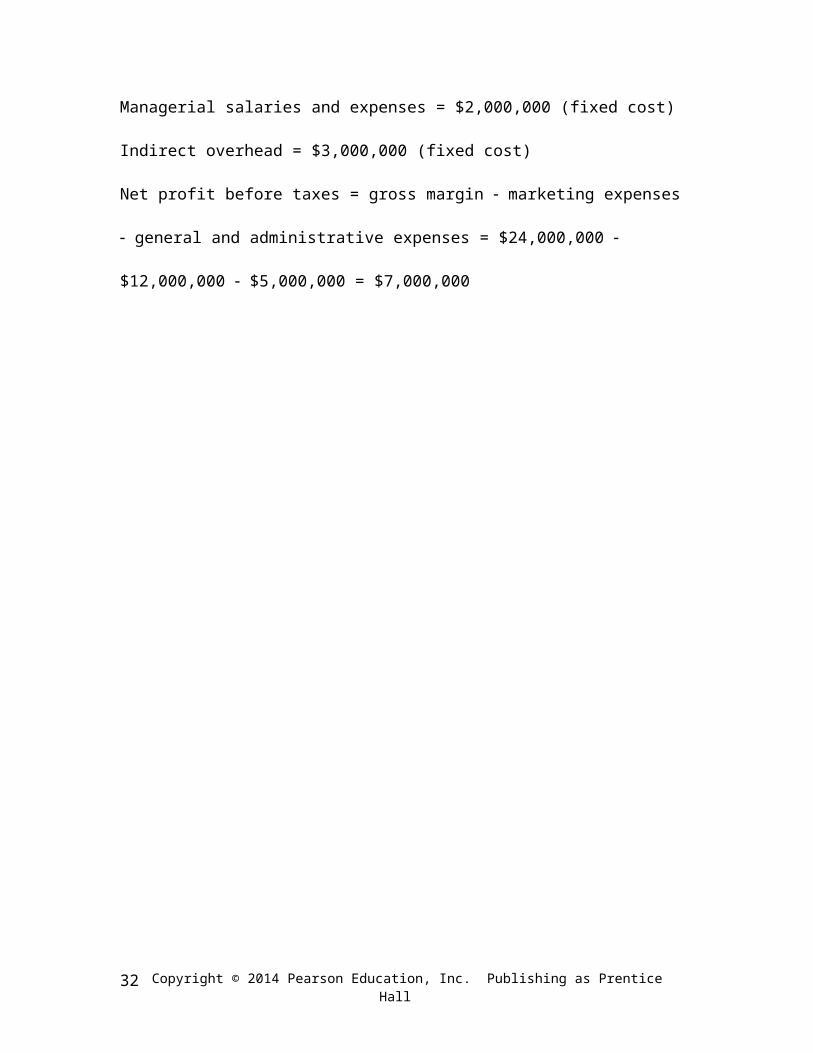
Managerial salaries and expenses = $2,000,000 (fixed cost)
Indirect overhead = $3,000,000 (fixed cost)
Net profit before taxes = gross margin marketing expenses general and administrative
expenses = $12,000,000 $9,000,000 $5,000,000 = $2,000,000
Copyright © 2014 Pearson Education, Inc. Publishing as Prentice Hall 19

b.) The profit-and-loss statement at $40 million net sales:
Net Sales $40,000,000Cost of goods sold 16,000,000Gross Margin $ 24,000,000
Marketing Expenses Sales expenses $5,000,000 Promotion expenses 3,000,000 Freight 4,000,000 12,000,000
General and Administrative Expenses Managerial salaries and expenses $2,000,000 Indirect overhead 3,000,000 5,000,000Net profit before income tax $7,000,000
where,
Cost of goods sold = 40% of $40 million sales = $16,000,000
Gross margin = net sales cost of goods sold = $40,000,000 $16,000,000 = $24,000,000
Sales expenses = $3 million for salaries + 5% of $40 million sales = $3,000,000 +
$2,000,000 = $5,000,000
Promotion expenses = $3,000,000 (fixed cost)
Freight = 10% of $40 million sales = $4,000,000
Managerial salaries and expenses = $2,000,000 (fixed cost)
Indirect overhead = $3,000,000 (fixed cost)
Net profit before taxes = gross margin marketing expenses general and administrative
expenses = $24,000,000 $12,000,000 $5,000,000 = $7,000,000
Copyright © 2014 Pearson Education, Inc. Publishing as Prentice Hall20

c.) Breakeven sales can be determined by:
fixed costsBreak-even sales = ——————————
contribution margin
Total fixed costs = sales salaries + advertising + managerial salaries and expenses +
indirect overhead = $3,000,000 + $3,000,000 + $2,000,000 + $3,000,000 = $11,000,000
Variable costs make up 55% of sales (i.e., COGS = 40%, commissions = 5%, and freight
= 10% of sales). So,
Contribution margin = 1 0.55 = 0.45
Therefore,
fixed costs $11,000,000 Break-even sales = ——————————— = —————— = $24,444,444
contribution margin 0.45
Reality check: Breakeven sales should be between $20 million and $40 million because Westgate did not realize a profit at $20 million but did at $40 million. Plus, breakeven sales should be closer to $20 million because the company only realized a $2 million loss at that sales level but experienced a $7 million profit at sales of $40 million.
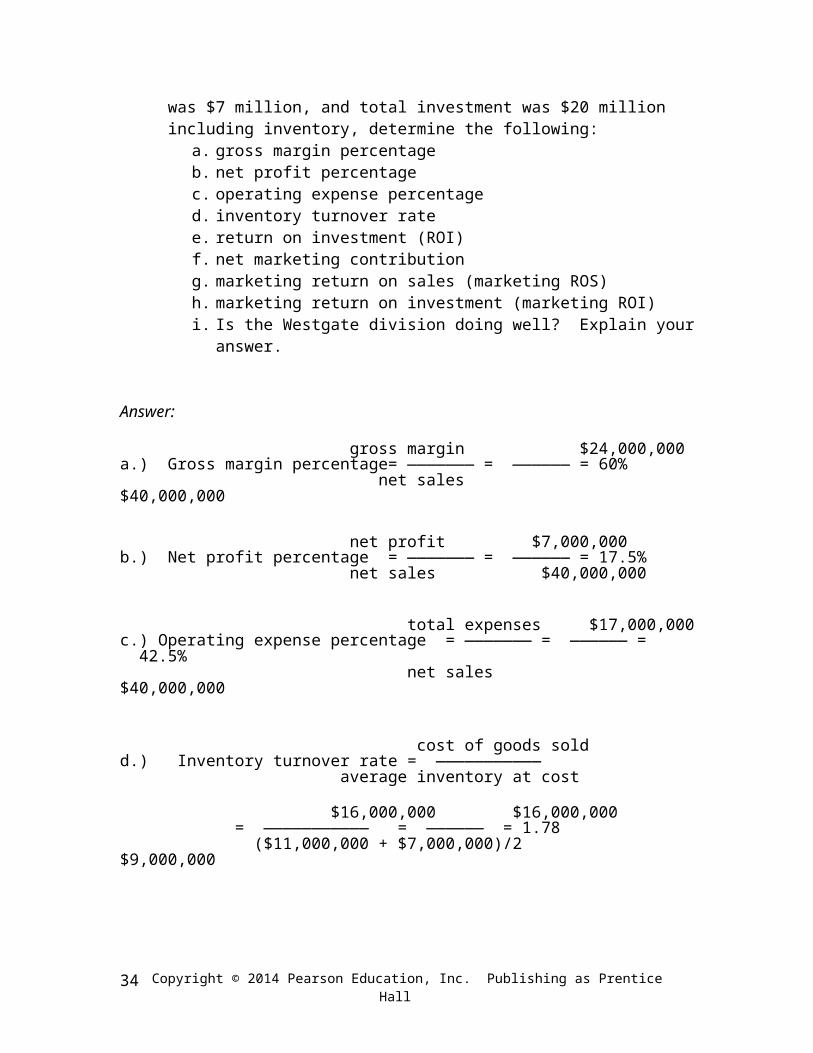
2.3. Using the profit-and-loss statement you developed in question 2.2b, and assuming that Westgate’s beginning inventory was $11 million, ending inventory was $7 million, and total investment was $20 million including inventory, determine the following:
a. gross margin percentageb. net profit percentagec. operating expense percentaged. inventory turnover ratee. return on investment (ROI)f. net marketing contributiong. marketing return on sales (marketing ROS)h. marketing return on investment (marketing ROI)i. Is the Westgate division doing well? Explain your answer.
Answer:
Copyright © 2014 Pearson Education, Inc. Publishing as Prentice Hall 21

gross margin $24,000,000 a.) Gross margin percentage= ——————— = —————— = 60%
net sales $40,000,000
net profit $7,000,000 b.) Net profit percentage = ——————— = —————— = 17.5%
net sales $40,000,000
total expenses $17,000,000 c.) Operating expense percentage = ——————— = —————— = 42.5%
net sales $40,000,000
cost of goods sold d.) Inventory turnover rate = ———————————
average inventory at cost
$16,000,000 $16,000,000 = ——————————— = —————— = 1.78
($11,000,000 + $7,000,000)/2 $9,000,000
net profit before taxes $7,000,000 e.) Return on investment = ————————— = —————— = 35%
investment $20,000,000
f.) NMC = net sales cost of goods sold marketing expenses
where,
marketing expenses = selling expenses + promotion + freight + managerial
salaries and expenses = $5,000,000 + $3,000,000 + $4,000,000 + $2,000,000 =
$14,000,000
so,
NMC = $40,000,000 $16,000,000 $14,000,000 = $10,000,000
net marketing contribution $10,000,000 g.) Marketing ROS = ——————————— = —————— = 25%
net sales $40,000,000
Copyright © 2014 Pearson Education, Inc. Publishing as Prentice Hall22

net marketing contribution $10,000,000 h.) Marketing ROI = ——————————— = —————— = 71.4%
marketing expenses $14,000,000
i.) Students’ responses will vary on this question. However, it should be noted that these ratios should be compared to previous ratios for the division, other divisions of the company, competitors, and industry averages.
III. Financial Analysis of Marketing Tactics
A. Increase Advertising Expenditures
1. What if HD increases national advertising by 50% to $15 million (assume no change in the variable cooperative component of promotional expenditures)?
2. What increase in sales will be needed to break even on this $5 million increase in fixed costs?
3. A quick way to answer this question is to divide the increase in fixed cost by the contribution margin (which was found in a previous analysis to be 21%):
increase in fixed cost $5,000,000 Increase in sales = ————————— = —————— = $23,809,524
contribution margin 0.21
Teaching Note: This is the increase in sales necessary to break even on this increase in fixed costs. Recall, however, that HD did not break even last year, so this increase in sales is in addition to the $5 million increase HD needs to break even.
B. Increase Distribution Coverage1. HD currently employs 60 sales representatives who earn an
average of $50,000 in salary plus 10% commission on sales.2. The product is currently sold through 1,875 retail outlets, and HD
wants to increase that to 2,500 outlets.3. How many additional salespeople will HD need, and what level of
sales will be necessary to break even on the increased cost?a) The workload method uses the following formula to
determine the salesforce size:
NC FC LC NS = ————————
TA
where,
Copyright © 2014 Pearson Education, Inc. Publishing as Prentice Hall 23

NS = number of salespeopleNC = number of customersFC = average frequency of customer calls per customerLC = average length of customer callTA = time an average salesperson has available for selling per year
(1) HD reps typically call on accounts an average of 20 times per year for about 2 hours per call, the average available time per sales rep per year is 1,250 hours (50 weeks 25 hours per week devoted to selling).
(2) So the number of sales reps HD will need to cover 2,500 retail accounts is:
2,500 20 2 NS = ——————— = 80 salespeople
1,250
(3) So HD will need to hire 20 more salespeople. The cost to hire these reps will be $1 million (20 salespeople $50,000 salary per rep).
b) What increase in sales will be required to break even on this increase in fixed costs? As seen in the previous analysis, divide the increase in fixed cost by the contribution margin (which remains unchanged at 21% because the 10% commission was already accounted for):
increase in fixed cost $1,000,000 Increase in sales = —————————— = —————— = $4,761,905
contribution margin 0.21
c) Since the average revenue generated per outlet is $53,333 ($100 million in sales 1,875 outlets), HD would need about 90 new outlets ($4,761,905 $53,333 = 89.3 outlets).
d) This seems reasonable given that current reps cover about 31 outlets apiece (1,875 outlets divided by 60 reps) and new reps would only need to acquire about 4.5 outlets for HD to break even on this proposal (89.3 outlets 20 reps).
C. Decrease Price1. What increase in sales would be necessary to break even on a 10%
decrease in price? That is, what increase in sales will be needed to maintain the total contribution that HD realized at the higher price?a) Current total contribution = contribution margin sales =
0.21 $100 million = $21 million.b) Unit variable costs do not change, however, and can be
determined by multiplying the unit price by the percentage
Copyright © 2014 Pearson Education, Inc. Publishing as Prentice Hall24

represented by variable costs (recall that variable costs represented 79% of sales). Thus, unit variable costs equal $132.72 ($168 0.79).
c) Price changes result in changes in unit contribution and contribution margin, so we must calculate the new contribution margin to determine the sales necessary to break even on this price reduction.
d) New unit contribution and contribution margin can be calculated as follows:
Old New (reduced 10%)
Price $168 $151.20
Unit variable cost $132.72 $132.72
= Unit contribution $35.28 $18.48
Contribution margin $35.28/$168 = 0.21 or 21% $18.48/$151.20 = 0.12 or 12%
e) To determine the sales level needed to break even on this price reduction, calculate the level of sales that must be attained at the new contribution margin to achieve the original total contribution of $21 million:
New contribution margin new sales level = original total contribution
So,
original contribution $21,000,000 New sales level = —————————— = —————— = $175,000,000
new contribution margin 0.12
f) Sales must increase by $75 million, and the marketing manager must assess whether or not this is a reasonable goal.
D. Extend the Product Line1. HD is considering introducing a lower-price model in addition to
the original model.2. Cannibalization is the situation in which one product sold by a
company takes a portion of its sales from other company products.
Copyright © 2014 Pearson Education, Inc. Publishing as Prentice Hall 25

a) If the new product has a lower contribution than the original product, the company’s total contribution will decrease on cannibalized sales.
b) However, if the new product can generate enough new volume, it is worth considering.
c) To assess cannibalization, we must look at the incremental contribution gained by having both products available.
3. Assume the first model offered by HD is called HD1 and the new, lower-priced model is HD2.
4. HD2 will retail for $250 and resellers take the same markup percentages on price as they do with HD1, so the markup chain is:
Retail price: $250minus retail margin (30%): $ 75
Retailer’s cost/wholesaler’s price: $175minus wholesaler’s margin (20%): $ 35
Wholesaler’s cost/HD’s price $140
5. HD1's unit contribution is about $35 ($168 $132.72). Recall that price and unit variable costs were determined in previous analyses.
6. HD2's variable costs are estimated to be $120, which gives a unit contribution of $20 ($140 $120).a) Thus, for every unit that HD2 cannibalizes from HD1, the
company will lose $15 in contribution toward fixed costs and profit.
b) The original estimate for next year’s sales of HD1 was 600,000 units. But with the introduction of HD2, it is estimated that 200,000 of those sales will be cannibalized by HD2. This results in a loss of contribution of $3 million (200,000 units ($15) per cannibalized unit).
c) It is estimated that HD2 will generate an additional 500,000 unit sales, resulting in an additional contribution of $10 million (500,000 units $20 per unit).
7. The net effect is that HD will gain $7 million in total contribution by introducing HD2.
8. This can be seen by comparing the total contribution with and without the introduction of HD2:
HD1 only HD1 and HD2
HD1 contribution 600,000 units $35 = $21,000,000 400,000 units $35 = $14,000,000
Copyright © 2014 Pearson Education, Inc. Publishing as Prentice Hall26

HD2 contribution 0 700,000 units $20 = $14,000,000
Total Contribution $21,000,000 $28,000,000
9. HD should introduce HD2, but only if additional fixed costs do not exceed $7 million.
E. Marketing by the Numbers Exercise Set Three
3.1. Alliance, Inc. sells gas lamps to consumers through retail outlets. Total industry sales for Alliance’s relevant market last year were $100 million, with Alliance’s sales representing 5% of that total. Contribution margin is 25%. Alliance’s sales force calls on retail outlets and each sales rep earns $50,000 per year plus 1% commission on all sales. Retailers receive a 40% margin on selling price and generate average revenue of $10,000 per outlet for Alliance.
a. The marketing manager has suggested increasing consumer advertising by $200,000. By how much would dollar sales have to increase to break even on this expenditure? What increase in overall market share does this represent?
b. Another suggestion is to hire two more sales representatives to gain new consumer retail accounts. How many new retail outlets would be necessary to break even on the increased cost of adding three sales reps?
c. A final suggestion is a make a 10% across-the-board price reduction. By how much would dollar sales have to increase to maintain Alliance’s current contribution? (See endnote 13 to calculate the new contribution margin.)
d. Which suggestion do you think Alliance should implement? Explain your recommendation.
Answer:
a.) Increase advertising by $200,000:
An increase in advertising of $200,000 represents an increase in fixed costs by that amount. Therefore, the increase in sales necessary to breakeven on this increase in fixed costs can be calculated by dividing by the contribution margin:
increase in fixed costs $200,000 Increase in sales = ——————————— = —————— = $800,000
contribution margin 0.25
1 share point = 1% of total market sales. So 1% of $100,000,000 = $1,000,000. Alliance would have to realize a 0.8 share point increase in market share (i.e., $800,000 increase in
Copyright © 2014 Pearson Education, Inc. Publishing as Prentice Hall 27

sales $1,000,000 per point = 0.8 share points), resulting in a market share of 5.8% required.
Another way to determine this:
increase in sales $800,000 Increase in share points = ——————————— = ————— = 0.008
total market sales $100,000,000
Thus, Alliance would need to increase market share 0.8 percentage points (i.e., increase from 5% market share to 5.8% market share).
Still another way to determine this:
new sales $5,800,000 New market share = ———————— = ————— = 0.058 = 5.8%
total market sales $100,000,000
So the increase is 0.8 percentage points (from 5% to 5.8% market share).
b.) Add two sales representatives:
Each sales rep earns $50,000 in salary, so the increase in fixed cost = $100,000 (i.e., 2 reps $50,000).
As we did in part a with the increase in advertising expenditure, the $100,000 is an increase in fixed costs. Therefore, we can determine the increase in sales necessary to break even on this increase in fixed cost by dividing by the contribution margin:
increase in fixed costs $100,000 Increase in sales = ——————————— = —————— = $400,000
contribution margin 0.25
Retail outlets generate average revenue of $10,000 per outlet for Alliance, so the number of outlets necessary to break even on the increased cost of adding three sales reps can be determined by:
increase in sales $400,000 Increase in outlets = ——————————— = ———— = 40 outlets
revenue per outlet $10,000
Therefore, Alliance must obtain distribution through 40 more outlets to break even on this recommendation.
c.) Decrease price by 10%:
We must determine the current total contribution and the new contribution margin.
Copyright © 2014 Pearson Education, Inc. Publishing as Prentice Hall28

Knowing that Alliance’s market share is 5% of the total $100 million, therefore:
Current sales = 0.05 $100 million = $5 million
Therefore,
Current total contribution = contribution margin sales = 0.25 $5 million = $1.25 million
Though we do not know prices, we can base our analyses on 100% or price = $1.00. Because we know the current contribution margin is 25%, the unit contribution will equal $0.25 and unit variable costs will equal $0.75. Thus, we can see the effect on unit contribution and contribution margin when price is decreased to $0.80:
Old New (reduced 10% )
Price $1.00 $0.90
Unit variable cost $0.75 $0.75
= Unit contribution $0.25 $0.15
Contribution margin $0.25/$1.00 = 0.25 or 25% $0.15/$0.90 = 0.1667 or 16.67 %
As can be seen, a 10% reduction in price resulted in a decrease of the contribution margin from 25% to 16.67%. To determine the level of sales necessary to break even on this price reduction, we calculate the level of sales that must be attained at the new contribution margin to achieve the same original total contribution of $1.25 million:
New contribution margin new sales level = original total contribution
So,
original contribution $1,250,000 New sales level = ——————————— = —————— = $7,498,500.30
new contribution margin 0.1667
Thus, the absolute increase in sales to merely break even on a 10% reduction in price equals $2,498,500.30 (i.e., $7,498,500.30 $5 million).
d.) Students’ recommendations will vary. However, it appears that the suggestion to reduce price by 10% is the least attractive alternative.
Copyright © 2014 Pearson Education, Inc. Publishing as Prentice Hall 29

3.2. PepsiCo sells its soft drinks in approximately 400,000 retail establishments, such as supermarkets, discount stores, and convenience stores. Sales representatives call on each retail account weekly, which means each account is called on by a sales rep 52 times per year. The average length of a sales call is 75 minutes (or 1.25 hours). An average salesperson works 2,000 hours per year (50 weeks per year 40 hours per week), but spends ten hours a week on nonselling activities, such as administrative tasks and travel. How many sales people does PepsiCo need?
Answer:
The number of salespeople can be determined by using the workload method:
NC FC LC NS = ————————
TA
where,
NS = number of salespeople
NC = number of customers (400,000)
FC = frequency of customer calls (52)
LC = length of customer call (1.25)
TA = time an average salesperson has available for selling per year
(50 weeks 30 hours per week = 1,500 hours)
400,000 52 1.25 NS = ———————— = 17,333
1,500
Thus, PepsiCo needs 17,333 salespeople to carry out the selling function.
3.3. Hair Zone manufactures a brand of hair styling gel. It is considering adding a modified version of the product—a foam that provides stronger hold. Hair Zone’s variable costs and prices to wholesalers are:
Current hair gel New foam product
Unit selling price 2.00 2.25
Copyright © 2014 Pearson Education, Inc. Publishing as Prentice Hall30

Unit variable costs .85 1.25
Hair Zone expects to sell 1 million units of the new styling foam in the first year after introduction, but it expects that 60% of those sales will come from buyers who normally purchase Hair Zone’s styling gel. Hair Zone estimates that it would sell 1.5 million units of the gel if it did not introduce the foam. If the fixed cost of launching the new foam will be $100,000 during the first year, should Hair Zone add the new product to its line? Why or why not?
Answer:
This is a cannibalization problem. To analyze this problem, we need to determine unit contributions:
Unit contribution = price unit variable costs
Unit contribution for the gel product = $2.00 $0.85 = $1.15
Unit contribution for the foam product = $2.25 $1.25 = $1.00
One way to analyze this is to assess the incremental contribution gained (or lost) by adding the new product. Hair Zone estimates that next year’s sales of the new foam product would be 1 million units, but 600,000 (60% of 1 million) will be cannibalized from the original gel product Thus, Hair Zone will lose $0.15 in contribution for every unit cannibalized:
Contribution lost due to cannibalization = 600,000 units ($0.15) = $90,000
However, it is estimated that the foam product will generate an additional 400,000 unit sales (1 million units 600,000 cannibalized units). Thus,
Contribution due to net new volume = 400,000 units $1 per unit = $400,000
The net effect is that Hair Zone will gain $310,000 in contribution by introducing the foam product (incremental contribution = $400,000 $90,000 = $310,000).
This increase in total contribution is greater than the $100,000 increase in fixed costs to introduce this product, so Hair Zone should consider this option favorably.
Copyright © 2014 Pearson Education, Inc. Publishing as Prentice Hall 31
Another way to see this is to compare Hair Zone’s total contribution with and without the introduction of the new product:
gel only gel and foam
gel contribution 1,500,000 units $1.15 = $1,725,000 900,000 units $1.15 = $1,035,000
foam contribution 0 1,000,000 units $1.00 = $1,000,000
Total Contribution $1,725,000 $2,035,000
Notice that the difference in the total contribution is a net gain of $310,000 ($2,035,000 $1,725,000 = $310,000), which we found using the incremental method. Again, because the increase in total contribution is greater than the increase in fixed cost, Hair Zone should go ahead with this product introduction.
Copyright © 2014 Pearson Education, Inc. Publishing as Prentice Hall32

Table A2.1
Pro Forma Profit-and-Loss Statement for the 12-Month Period Ended December 31, 2013
% of salesNet Sales $125,000,000 100%Cost of goods sold 62,500,000 50% Gross Margin $ 62,500,000 50%
Marketing Expenses Sales expenses $17,500,000 Promotion expenses 15,000,000 Freight 12,500,000 45,000,000 36%
General and Administrative Expenses Managerial salaries and expenses $2,000,000 Indirect overhead 3,000,000 5,000,000 4%Net profit before income tax $12,500,000 10%
Table A2.2
Profit-and-Loss Statement for the 12-Month Period Ended December 31, 2013
% of salesNet Sales $100,000,000 100%Cost of goods sold 55,000,000 55%Gross Margin $ 45,000,000 45%
Marketing Expenses Sales expenses $15,000,000 Promotion expenses 14,000,000 Freight 10,000,000 39,000,000 39%
General and Administrative Expenses Managerial salaries and expenses $2,000,000 Indirect overhead 5,000,000 7,000,000 7%Net profit before income tax ($1,000,000) -1%
Copyright © 2014 Pearson Education, Inc. Publishing as Prentice Hall 33
Spreadsheet A2.1
Pro Forma Profit-and-Loss Statement for the 12-Month Period Ended December 31, 2013
Teaching Note: Note that the absolute amount for the cost of goods sold was entered in that cell because the percentage of sales that cost of goods sold represents was estimated to represent 50% of sales when developing the pro forma statement, but it represented 55% of actual sales. Either one of these spreadsheets can be used to develop the spreadsheets for quantitative exercise 2.2, but students will have to change equations in the cells to calculate the correct expenses.
Spreadsheet A2.2
Profit-and-Loss Statement for the 12-Month Period Ended December 31, 2013
Copyright © 2014 Pearson Education, Inc. Publishing as Prentice Hall34

Additional Quantitative Exercises
1. Chill Out, a manufacturer of outdoor patio heaters, realizes a cost of $75 for every heater it produces. Total fixed costs equal $3 million. If the company manufactures 1 million heaters, compute the following:
a. unit costb. markup price if the company desires a 15% return on salesc. ROI price if the company desires a 20% return on an investment of $10
million
Answer:
fixed costs $3,000,000 a.) Unit cost = variable cost + —————— = $75 + ————— = $78
unit sales 1,000,000
unit cost $78b.) Markup price = ————————————— = ——— = $91.76
(l desired return on sales) l 0.15
ROI investment (0.20 $10,000,000) c.) ROI price = unit cost + ——————— = $78 + —————— = $80.00
unit sales 1,000,000
2. A women’s apparel retailer purchases items to sell in the store. If the retailer purchases a blouse for $30 and sells it for $45, determine the following:
a. dollar markupb. markup percentage on costc. markup percentage on selling price
Answer:
a.) Dollar markup = selling price cost = $45 $30 = $15
dollar markup $15b.) Markup percentage on cost = ——————— = ——— = 0.5 = 50%
cost $30
dollar markup $15c.) Markup percentage on price = ——————— = ——— = 0.333 = 33.3%
price $45
Copyright © 2014 Pearson Education, Inc. Publishing as Prentice Hall 35

3. A consumer purchases a lawn mower from Home Depot for $225. Home Depot’s markup is 30%, and the wholesaler’s is 20%, both based on selling price. For what price does the manufacturer sell the product to the wholesaler?
Answer:
price cost Markup percentage on price = ——————
price
so,Cost at each level = price (price markup%)
Home Depot’s cost = $225 ($225 0.30) = $157.50, which is the price the wholesaler sells it to Home Depot.
The wholesaler’s cost = $157.50 ($157.50 0.20) = $126, which is the price the manufacturer sells the product to the wholesaler.
Another way to compute this is:
Retail price: $225.00minus retail margin (30%): $ 67.50
Retailer’s cost/wholesaler’s price: $157.50minus wholesale margin (20%): $ 31.50
Wholesaler’s cost/manufacturer’s price $ 126.00
4. A bicycle manufacturer has a unit cost of $75 and wishes to achieve a margin of 40% based on selling price. If the manufacturer sells directly to a retailer who then adds a set margin of 30% based on selling price, determine the retail price charged to consumers.
Answer:
price cost Markup percentage on price = ——————
price
So, at any level in the chain:
cost price = —————
(1 markup)
cost $75 Manufacturer’s price = ————— = ————— = $125
(1 markup) (1 0.4)
Copyright © 2014 Pearson Education, Inc. Publishing as Prentice Hall36
cost $125 Retailer’s price = ————— = ————— = $178.57
(1 markup) (1 0.3)
5. Complete the blanks in the following markup chain. All markup percentages are based on selling prices.
$ %
Retail selling price $4.00
Retail markup ____________ 50%
Retail cost ____________
Wholesale selling price ____________
Wholesale markup ____________ __________
Wholesale cost ____________
Manufacturer’s selling price ____________
Manufacturer’s markup ____________ 60%
Manufacturer’s cost $0.48
Answer:
To complete this chain, students need the following equations:
Dollar markup = selling price cost
price cost Markup percentage on price = ——————
price so,
Cost at each level = price (price markup%)
price cost Markup percentage on price = ——————
price
Copyright © 2014 Pearson Education, Inc. Publishing as Prentice Hall 37

So, at any level in the chain:
cost price = —————
(1 markup%)
To fill in the blanks on this chain, students can begin either at the top or the bottom. If beginning at the top, they can determine the retail dollar markup, followed by the retail cost, which is the wholesale selling price. There is not enough information at that point to continue down the chain, so they will have to work from the bottom to determine the wholesale cost. Working from the bottom, they can first determine the manufacturer’s selling price from the information given, and the difference between the price and the cost is the dollar markup. The manufacturer’s price is the wholesale cost, so now they can work from the top to determine the wholesale selling price (which they would have gotten to if starting at the top). Once these two figures are determined, they can subtract the wholesale cost from the wholesale price to determine the wholesale dollar markup. The only unknown, then, is the percentage wholesale markup, which can be determined by dividing the wholesale dollar markup by the wholesale price.
$ %
Retail selling price $4.00
Retail markup ___$2.00____ 50%
Retail cost ___$2.00____
Wholesale selling price ___$2.00____
Wholesale markup ___$0.80____ __40%___
Wholesale cost ___$1.20____
Manufacturer’s selling price ___$1.20____
Manufacturer’s markup ___$0.72____ 60%
Manufacturer’s cost $0.48
6. Note: Only use this exercise if the equations given in the teaching note were covered. Suppose a retailer uses a markup of 40% based on price and found that his competitor was using a markup of 50% percent based on cost and wanted to know what this would be as a percentage of selling price. Are these equivalent?
Copyright © 2014 Pearson Education, Inc. Publishing as Prentice Hall38

Answer:
The equations given in the teaching note are:
The calculation is:
These are not equivalent as the first retailer is using a 40% markup based on price, but the competitor is using a lower markup based on price (33.3%).
7. Seasons, Inc. manufactures holiday wreaths and sells them directly to retailers for $5.00. The manufacturer’s cost information is as follows:
Variable cost $3.35/wreathAdvertising and promotion $300,000Overhead $700,000
Calculate the following:a. contribution per unit and contribution margin for the manufacturerb. break-even volume in units and dollarsc. volume in units and dollar sales necessary if Seasons’s profit goal is
$500,000d. net profit if 6 million wreaths are sold
Answer:
a.) Unit contribution = selling price unit variable cost
Therefore, the contribution per unit = $5 $3.35 = $1.65
unit contribution $1.65 Contribution margin = ———————— = ———— = 0.33 or 33%
price $5
Copyright © 2014 Pearson Education, Inc. Publishing as Prentice Hall 39

fixed costs $1,000,000b.) Breakeven volume = ———————— = ———— = 606,061 units
unit contribution $1.65
Breakeven sales = breakeven volume price = 606,061 units $5 = $3,030,305
orfixed costs $1,000,000
Breakeven sales = ———————— = ———— = $3,030,303 contribution margin 0.33
The difference between the two calculations for breakeven sales is due to rounding.
fixed costs + profit goal
c.) Unit volume = ——————————— price variable cost
$1,000,000 + $500,000 = —————————— = 909,091 units
$5 $3.35
Sales necessary = 909,091 units x $5 = $4,545,455
or fixed costs + profit goal $1,500,000
Breakeven sales = ———————— = ———— = $4,545,455 contribution margin 0.33
d.) Net profit = total revenue total costs
Total revenue if 6 million units are sold = 6,000,000 $5 = $30 million
Total cost is equal to TFC + TVC, so if 6 million units are sold:
Total cost = $1,000,000 + ($3.35 6,000,000) = $21,100,000
Net profit = $30,000,000 $21,100,000 = $8,900,000
(Note: Students may merely subtract the fixed costs from the total contribution: ($1.65 6,000,000 units) $1,000,000 = $8,900,000.)
Copyright © 2014 Pearson Education, Inc. Publishing as Prentice Hall40

8. A company sells its products for $8.50. It has variable costs of $2.50, and fixed costs total $250,000. What must its dollar sales be to break even? How many units must it sell to earn a 20% return on its investment of $100,000?
Answer:
fixed costs $250,000 Breakeven volume = ———————— = ———— = 41,667 units
unit contribution $6.00
where unit contribution = price variable cost = $8.50 $2.50 = $6.00
Breakeven sales = breakeven volume price = 41,667 units $8.50 = $354,169.50
or
fixed costs $250,000 Breakeven sales = ———————— = ———— = $352,113
contribution margin 0.71
where
unit contribution $6.00 Contribution margin = ———————— = ———— = 0.7059 or 71%
price $8.50price $8.50
The difference between the two calculations for breakeven sales is due to rounding.
To determine the unit volume necessary to earn a 20% return on an investment of $100,000, we must first determine the absolute amount of the profit goal. The profit goal is 20% of $100,000, or $20,000 (0.2 $100,000).
so fixed costs + profit goal
Unit volume = ——————————— unit contribution
$250,000 + $20,000 = —————————— = 45,000 units
$6.00
9. Determine the market potential for a product that has 8 million prospective buyers who purchase an average of 2 per year and price averages $50.
Copyright © 2014 Pearson Education, Inc. Publishing as Prentice Hall 41

Answer:
Q = n q p
where
Q = total market demand n = number of buyers in the marketq = quantity purchased by an average buyer per yearp = price of an average unit
The upper limit of market demand is called market potential. It’s a straightforward calculation:
Q = 8,000,000 buyers 2 units per buyer $50 per unit = $800 million
10. Smithsborough, Inc. had the following profit and loss statement for the year ending 2009:
Sales $50,000,000Cost of goods sold 10,000,000Gross Margin $40,000,000
Marketing Expenses Sales expenses $10,000,000 Promotion expenses 4,000,000 14,000,000
General and Administrative Expenses Managerial salaries and expenses for the marketing function $1,000,000 Indirect overhead 6,000,000 7,000,000Net profit before income tax $19,000,000
Determine the following ratios:a. gross margin percentageb. net profit percentagec. operating expense percentaged. net marketing contributione. marketing return on sales (marketing ROS)f. marketing return on investment (marketing ROI)g. Is Smithsborough doing well? Explain your answer.
Answer:
gross margin $40,000,000 a.) Gross margin percentage= ——————— = —————— = 0.80 = 80%
net sales $50,000,000
Copyright © 2014 Pearson Education, Inc. Publishing as Prentice Hall42

net profit $19,000,000 b.) Net profit percentage = ——————— = —————— = 0.38 = 38%
net sales $50,000,000
total expenses $21,000,000 c.) Operating expense percentage = ——————— = ————— = 0.42 = 42%
net sales $50,000,000
d.) NMC = net sales cost of goods sold marketing expenses
where,
marketing expenses = selling expenses + promotion + managerial salaries and
expenses for the marketing function = $10,000,000 + $4,000,000 + $1,000,000 =
$15,000,000
so,
NMC = $50,000,000 $10,000,000 $15,000,000 = $25,000,000
net marketing contribution $25,000,000 e.) Marketing ROS = ——————————— = —————— = 0.50 = 50%
net sales $50,000,000
net marketing contribution $25,000,000 f.) Marketing ROI = ——————————— = —————— = 1.67 = 167%
marketing expenses $15,000,000
This is not a mistake. Marketing ROI can be greater than 100%, which indicates that the company is efficient with its marketing expenditures. In this case, each dollar spent on marketing is generating $1.67 toward general fixed costs and profit.
g.) Students’ responses will vary on this question, but most students will agree that Smithsborough is doing well. However, it should be noted that these ratios should be compared to previous ratios for the division, other divisions of the company, competitors, and industry averages.
11. Given the following cost structure, calculate Blendco, Inc.’s breakeven dollar sales:
Cost of goods sold equal to 50% of sales
Copyright © 2014 Pearson Education, Inc. Publishing as Prentice Hall 43

Sales salaries totaling $1,000,000 plus 10% commission on each sale
Advertising expenditures of $500,000
Freight expenses equal 10% of sales
Marketing staff costs equal $250,000 per year
Indirect overhead equals $600,000
Answer:
Breakeven sales can be determined by:
fixed costsBreak-even sales = ——————————
contribution margin
Total fixed costs = sales salaries + advertising + managerial salaries and expenses +
indirect overhead = $1,000,000 + $500,000 + $250,000 + $600,000 = $2,350,000
Variable costs make up 70% of sales (i.e., COGS = 50%, commissions = 10%, and
freight = 10% of sales). So,
Contribution margin = 1 0.70 = 0.30
Therefore,
fixed costs $2,350,000 Break-even sales = ——————————— = —————— = $7,833,333
contribution margin 0.30
12. Drake, Inc. manufactures electric welders that it sells to other manufacturers, and sales last year were $45 million. Drake has a 35% contribution margin. The marketing manager has suggested increasing the number of sales representatives by five, which would cause fixed costs to increase by $250,000. Another suggestion is to reduce price by 10%.
Copyright © 2014 Pearson Education, Inc. Publishing as Prentice Hall44

a. What incremental dollar volume would be necessary to break even on the suggestion to hire five additional sales reps?
b. What absolute increase in dollar sales volume would be necessary to maintain Drake’s current contribution if price was reduced by 10%?
c. Which suggestion do you think Drake should implement? Explain your recommendation.
Answer:
a.) Add five sales representatives:
Adding five sale reps would increase fixed cost by $250,000.
We can determine the increase in sales necessary to break even on this increase in fixed cost by dividing by the contribution margin:
increase in fixed costs $250,000 Increase in sales = ——————————— = —————— = $714,286
contribution margin 0.35
b.) Decrease price by 10%:
We must determine the current total contribution with sales of $45 million and the new contribution margin after price is reduced by 10%.
Therefore,
Current total contribution = contribution margin sales = 0.35 $45 million = $15,750,000
Though we do not know prices, we can base our analyses on 100% or price = $1.00. Because we know the current contribution margin is 35%, the unit contribution will equal $0.35 and unit variable costs will equal $0.65. Thus, we can see the effect on unit contribution and contribution margin when price is decreased to $0.90:
Old New (reduced 10% )
Price $1.00 $0.90
Unit variable cost $0.65 $0.65
= Unit contribution $0.35 $0.25
Contribution margin $0.35/$1.00 = 0.35 or 35% $0.25/$0.90 = 0.278 or 27.8 %
Copyright © 2014 Pearson Education, Inc. Publishing as Prentice Hall 45

As can be seen, a 10% reduction in price resulted in a decrease of the contribution margin from 35% to 27.8%. To determine the level of sales necessary to break even on this price reduction, we calculate the level of sales that must be attained at the new contribution margin to achieve the same original total contribution of $15,750,000:
New contribution margin new sales level = original total contribution
So,
original contribution $15,750,000 New sales level = ——————————— = —————— = $56,654,676
new contribution margin 0.278
Thus, the absolute increase in sales to merely break even on a 10% reduction in price equals $11,654,676 (i.e., $56,654,676 $45,000,000).
c.) Students’ recommendations will vary. However, it appears that the suggestion to reduce price by 10% is the least attractive alternative.
13. Artco sells framed artwork in approximately 5,000 home decorating stores. Sales representatives call on each store 5 times per year. The average length of a sales call is one hour. While an average salesperson works 2,000 hours per year (i.e., 50 weeks per year 40 hours per week), each spends ten hours a week on nonselling activities, such as administrative tasks and travel. How many sales people does Artco need?
Answer:
The number of salespeople can be determined by using the workload method:
NC FC LC NS = ————————
TA
where,
NS = number of salespeople
NC = number of customers (5,000 stores)
FC = frequency of customer calls (5 time per year)
LC = length of customer call (1 hour)
Copyright © 2014 Pearson Education, Inc. Publishing as Prentice Hall46

TA = time an average salesperson has available for selling per year (50 weeks
30 hours per week = 1,500 hours)
5,000 5 1 NS = ———————— = 16.67 or 17 salespeople
1,500
14. Avian Electronics, Inc. manufactures a model of portable music players that can play music downloaded from the Internet. It is considering adding a more advanced model of the product that can also download and play video files as well as music files. Avian’s variable costs and prices to wholesalers are:
Current Audio model New Audio/Video model
Unit selling price $150.00 $250.00
Unit variable costs $60.00 $120.00
The company expects to sell 2 million units of the new audio/video model in the first year after introduction, but it expects that half of those sales will come from buyers who would have purchased Avian’s current audio model. Avian estimates that it would sell 2.5 million units of the current audio model if it did not introduce the audio/video model. If the fixed cost of launching the new audio/video model will be $800,000 during the first year, should Avian add the new model? Why or why not?
Answer:
This is a cannibalization problem. To analyze this problem, we need to determine unit contributions:
Unit contribution = price unit variable costs
Unit contribution for the audio model = $150 $60 = $90
Unit contribution for the audio/video model = $250 $120 = $130
Because the audio/video model has a higher contribution than the audio model, any cannibalized volume will positively impact total contribution. That is, Avian will experience a gain in contribution of $40 for every unit cannibalized from the audio model ($130 $90 = $40). However, we must determine the contribution gained by adding the new model to ensure that it is higher than the $800,000 increase in fixed costs associated with the introduction of the new model.
Contribution gained due to cannibalization = 1 million units $40 = $40,000,000
Copyright © 2014 Pearson Education, Inc. Publishing as Prentice Hall 47

No further calculations are necessary because the gain in contribution due to cannibalization alone far exceeds the increase in fixed cost. Avian should introduce the new model.
(However, if students did calculate the total incremental contribution, they must determine the contribution generated by the other 1 million units of the audio/video model that are not cannibalized sales: 1 million units $130 = $130 million. Add that to the contribution due to the cannibalized sales, and we get a total increase in contribution of $170 million.)
Another way students might do this problem is to examine the total contributions with and without the new model:
Audio model only Audio and Audio/Video models
audio contribution 2,500,000 units $90 = $225,000,000 1,500,000 units $90 = $135,000,000
audio/video contribution 0 2,000,000 units $130 = $260,000,000
Total Contribution $225,000,000 $395,000,000
The difference in the total contribution is a net gain of $170 million ($395 million $225 million = $170 million), which is greater than the $800,000 increase in fixed costs.
15. Perfam is a manufacturer of fragrances for women. It currently sells two brands, one called Allure, which is sold to wholesalers for $40, and another called Beauty, which is sold to wholesalers for $20. It is considering adding a mid-priced brand called Classy for $30. Perfam’s variable costs and prices to wholesalers for six ounce bottles are:
Allure Beauty Classy (new brand)
Unit selling price $40.00 $20.00 $30.00
Unit variable costs
$20.00 $10.00 $15.00
Perfam expects to sell 10,000 bottles of the new Classy brand, but 5,000 of those sales will be cannibalized from Allure and 1,000 will be cannibalized from Beauty. Before Perfam considered the new brand, it had expected to sell 11,000 bottles of Allure and 10,000 bottles of Beauty. Should Perfam launch the new Classy brand?
Answer:
This is a cannibalization problem. To analyze this problem, we need to determine unit contributions for each brand:
Copyright © 2014 Pearson Education, Inc. Publishing as Prentice Hall48

Unit contribution = price unit variable costs
Unit contribution for Allure = $40 $20 = $20
Unit contribution for Beauty = $20 $10 = $10
Unit contribution for Classy = $30 $15 = $15
One way to analyze this is to assess the incremental contribution gained (or lost) by adding the new product. Perfam estimates that next year’s sales of the new Classy brand will be 10,000 bottles, but 5,000 of those will be cannibalized from the Allure brand and 1,000 will be cannibalized from the Beauty brand. Thus, Perfam will lose $5 in contribution for every bottle cannibalized from Allure, but it will gain $5 in contribution for every bottle cannibalized from Beauty:
Contribution lost due to cannibalization from Allure = 5,000 bottles ($5) = $25,000
Contribution gained due to cannibalization from Beauty = 1,000 bottles $5 = $5,000
The net effect is a loss in total contribution of $20,000 due to cannibalization.
However, it is estimated that Classy will generate an additional 4,000 bottle sales.
Thus,
Contribution due to net new volume = 4,000 bottles $15 per unit = $60,000
The net effect is that Perfam will gain $40,000 in incremental contribution by introducing the new Classy brand (incremental contribution = $60,000 $20,000 = $40,000).
Assuming no increases in fixed costs, Perfam should launch this new brand.
Another way to see is to compare Perfam’s total contribution with and without the introduction of the new product:
Allure and Beauty only All three brands
Allure contribution 11,000 bottles $20 = $220,000 6,000 bottles $20 = $120,000
Beauty contribution 10,000 bottles $10 = $100,000 9,000 bottles $10 = $90,000
Classy contribution 0 10,000 bottles $15 = $150,000
Total Contribution $320,000 $360,000
Notice that the difference in the total contribution is a net gain of $40,000 ($360,000 $320,000 = $40,000), which we found using the incremental method.
Copyright © 2014 Pearson Education, Inc. Publishing as Prentice Hall 49