Explaining informal sector entrepreneurship in Kosovo: An ...
Kosovo Informal Settlement Pocket
Enumeration Report
DECEMBER 2016
A member of the SA SDI Alliance
Enumeration Report: Kosovo Informal Settlement Pocket
2
CONTENTS
LIST OF TABLES 3
LIST OF FIGURES 3
LIST OF ACRONYMS AND ABBREVIATIONS 4
GLOSSARY 4
PREFACE 5
EXECUTIVE SUMMARY 6
1. INTRODUCTION 8
2. LOCATION AND CONTEXT OF THE SETTLEMENT 113.1. Stakeholder participation and engagement 17
3. METHODOLOGY 173.2. Pre-implementation and field work 18
3.3.Value add to the project-employment opportunities 19
4. COVERAGE OF THE ENUMERATION AND RESPONSE RATES 204.1. Coverage of the enumeration 21
4.2. Response rates 24
5. SUMMARY FINDINGS 25
6. ANALYSIS 266.1. Structure analysis 26
6.2. Demographics of Kosovo population 34
6.2.1. Age distribution 34
6.2.1.1 A profile of youth 35
6.2.2. Gender breakdown 36
6.2.3. Education enrolment and school attendance 38
6.2.4. Employment 39
6.2.5. Household income and expenditure 44
6.3. Access to services 47
6.3.1. Water access 48
6.3.2. Sanitation 50
6.3.3. Electricity 52
6.3.4. Community services and local business 54
6.4. Health and disasters 55
6.5. Settlement dynamics 57
6.6. Settlement priorities 58
6.7. Implications of findings for human settlements 61
6.7.1. Planning considerations 61
6.7.2. Pathway to qualification 62
7. CONCLUSION 68
REFERENCES 69
LIST OF CORE TEAM MEMBERS 70
Enumeration Report: Kosovo Informal Settlement Pocket
3
LIST OF TABLES
LIST OF FIGURES
Table 1: Total population of Kosovo derived from stated number of people living inside each structure 22
Table 2: Total population of Kosovo based on actual number of persons enumerated per structure 23
Table 3: Total households for Kosovo derived from stated number of households 24
Table 4: Number of rooms per structure 27
Table 5: Number of people per structure 28
Table 6a: Square metres of floor space categorised 29
Table 6b: Square metres of floor space categorised available per person excluding structures with one occupant 30
Table 7: Main use of structures 31
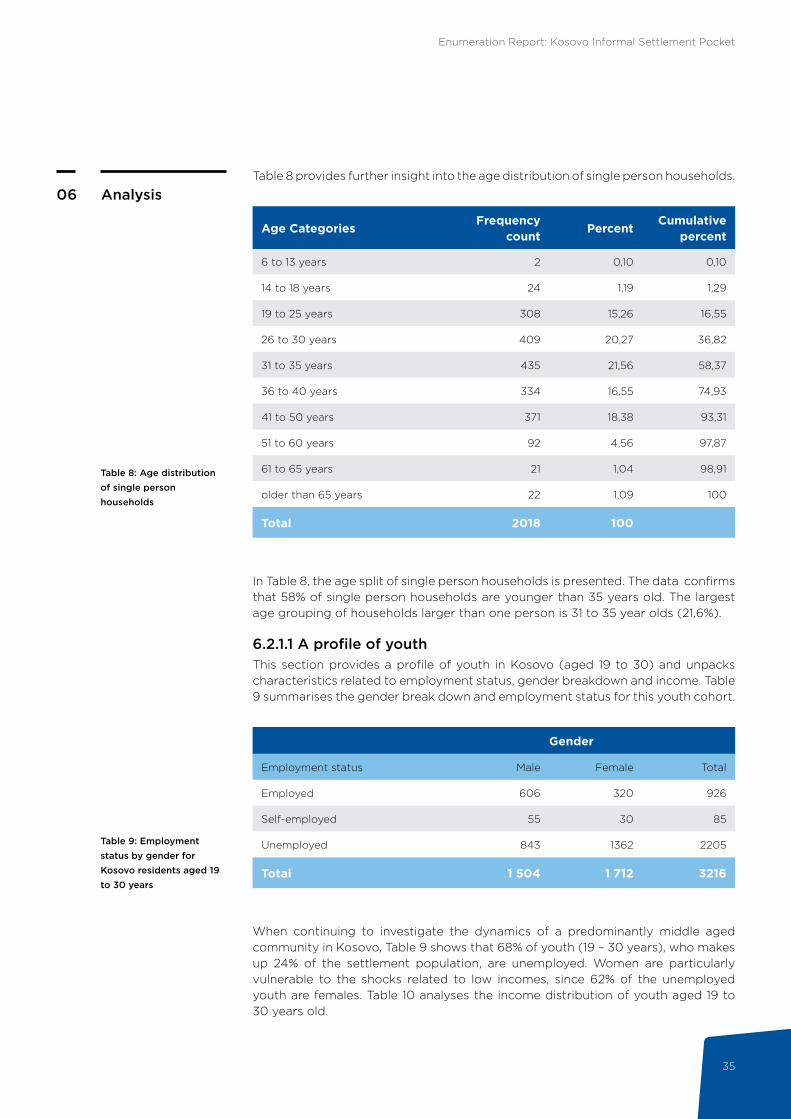
Table 8: Age distribution of single person households 35
Table 9: Employment status by gender for Kosovo residents aged 19 to 30 years 35
Table 10: Income distribution for age cohort 19 to 30-years-old 36
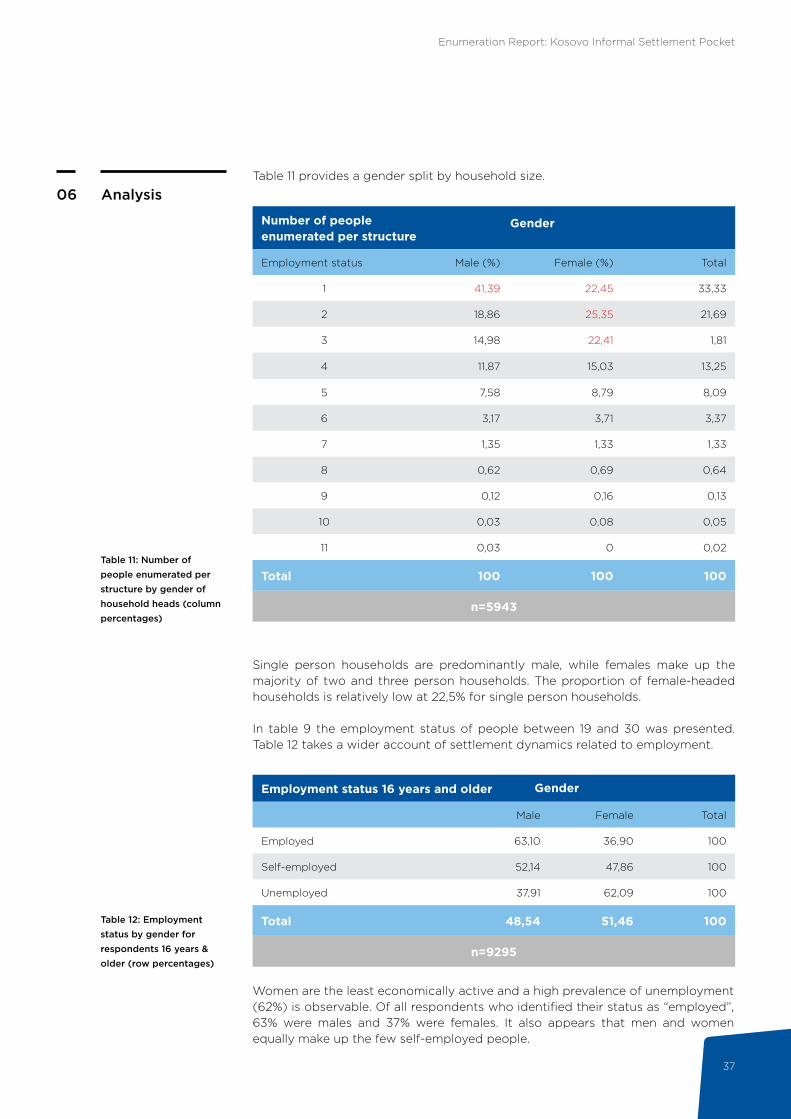
Table 11: Number of people enumerated per structure by gender of household heads (column percentages) 37
Table 12: Employment status by gender for respondents 16 years & older (row percentages) 37
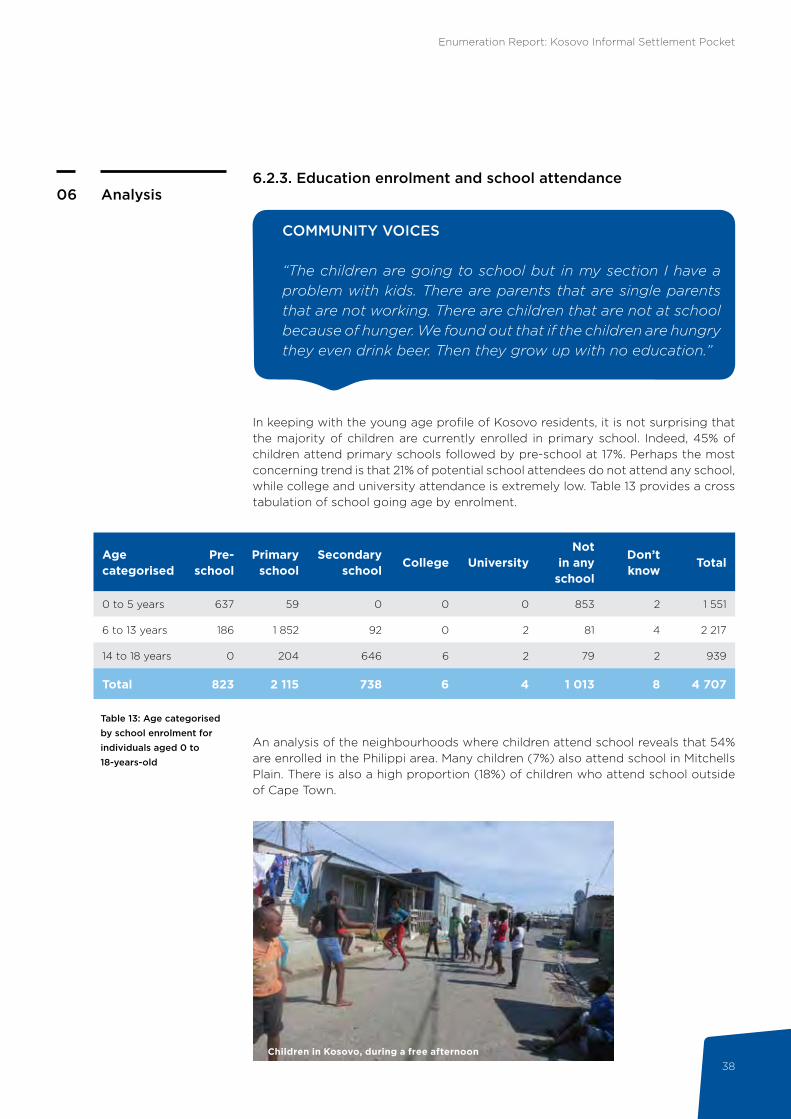
Table 13: Age categorised by school enrolment for individuals aged 0 to 18-years-old 38
Table 14: Age by employment status (row frequencies & percentages) 41
Table 15: Employment status by gender for respondents 16 years & older (Column percentages) 42
Table 16: Travel time to work 43
Table 17: Income distribution 44
Table 18: Expenses distribution 45
Table 19: Percentage distribution of sanitation access 50
Table 20: Accessing community facilities inside or within walking distance to settlement 55
Table 21: First port of call for medical assistance 56
Table 22: Main household priorities by ranking (row percentages) 58
Table 23: Reasons to move out of settlement by ranking order 60
Table 24: Reasons to move out of settlement by ranking (row percentages) 60
Table 25: Age distribution of single-person households 61
Figure 1: Transport for Cape Town graphical representation of the Philippi transport node 12
Figure 2: SA SDI Alliance stakeholder participation & engagement strategy 17
Figure 3: Pre-implementation and field work process flow chart 18
Figure 4: Map of all structures in Kosovo, indicating the coverage of the enumeration 21
Figure 5: Percentage breakdown per respondent type for Kosovo informal settlement 22
Figure 6: Percentage breakdown of structure ownership 26
Figure 7: Map of structure owndership 27
Figure 8: Percentage breakdown for square metres per person of floor area provided by a structure, categorised 30
Figure 9: Map indicating age of structures categorised 33
Figure 10: Age distribution of Kosovo population 34
Figure 11: Gender breakdown 36
Figure 12: Percentage breakdown of main transport type to work 43
Figure 13: Percentage distribution of grant type 46
Figure 14: Kosovo amenities 47
Figure 15: Map of Kosovo water points with 25m radius 48
Figure 16: Map showing sanitation access with 25m radius 51
Figure 17: Percentage breakdown of electricity access 52
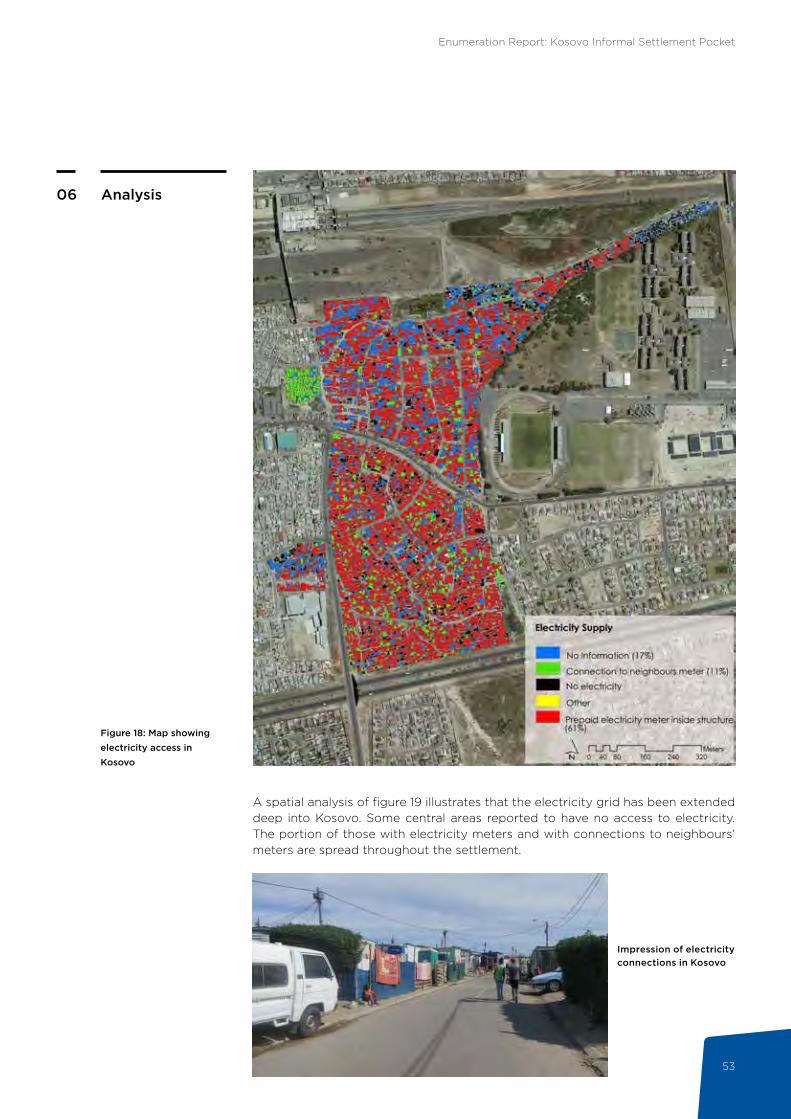
Figure 18: Map showing electricity access in Kosovo 53
Figure 19: Number of years lived in Kosovo categorised 57
Enumeration Report: Kosovo Informal Settlement Pocket
4
LIST OF ACRONYMS AND ABBREVIATIONS
GLOSSARY
CoCT – City of Cape Town (refers to the municipality)
CORC – Community Organisation Resource Centre
The Department – Department of Human Settlements
EPWP - Expanded Public Works Programme
FEDUP – Federation of the Urban and Rural Poor
GIS – Geographical Information Systems
GPS – Global Positioning System
ISN – Informal Settlement Network
MEC – Member of the Executive Council
NGO – Non-Governmental Organisation
Province – The Western Cape Government
PSC – Project Steering Committee
SC – Sub-Council
SA SDI Alliance – South African Slum Dwellers International Alliance
SDI – Slum Dwellers International
StatsSA – Statistics South Africa
Enumeration: An enumeration entails the gathering of socio-economic data and shack numbering for all households in informal settlement pockets.
Household: A group of people under one structure sharing one common area. If the structure is divided and a different door is used to enter the next area and the common area is not shared, then that can be considered as a different household.
Household head:The household head is a person who is recognized as such by the household. She or he is generally the person who bears the chief responsibiloty for managing the affairs of the household and takes decisions on behalf of the household. This person does not necessarily have to be the breadwinner.
Informal settlement pocket:According to the City of Cape Town, an informal settlement pocket consists of one or more informal structures, which are known to the community as a unit with a unique name. It could be a stand-alone portion or form part of a larger grouping. An informal settlement area consists of one or more informal settlement pockets due to the geographical position and/or contiguous nature of these pockets.
Enumeration Report: Kosovo Informal Settlement Pocket
5
PREFACE
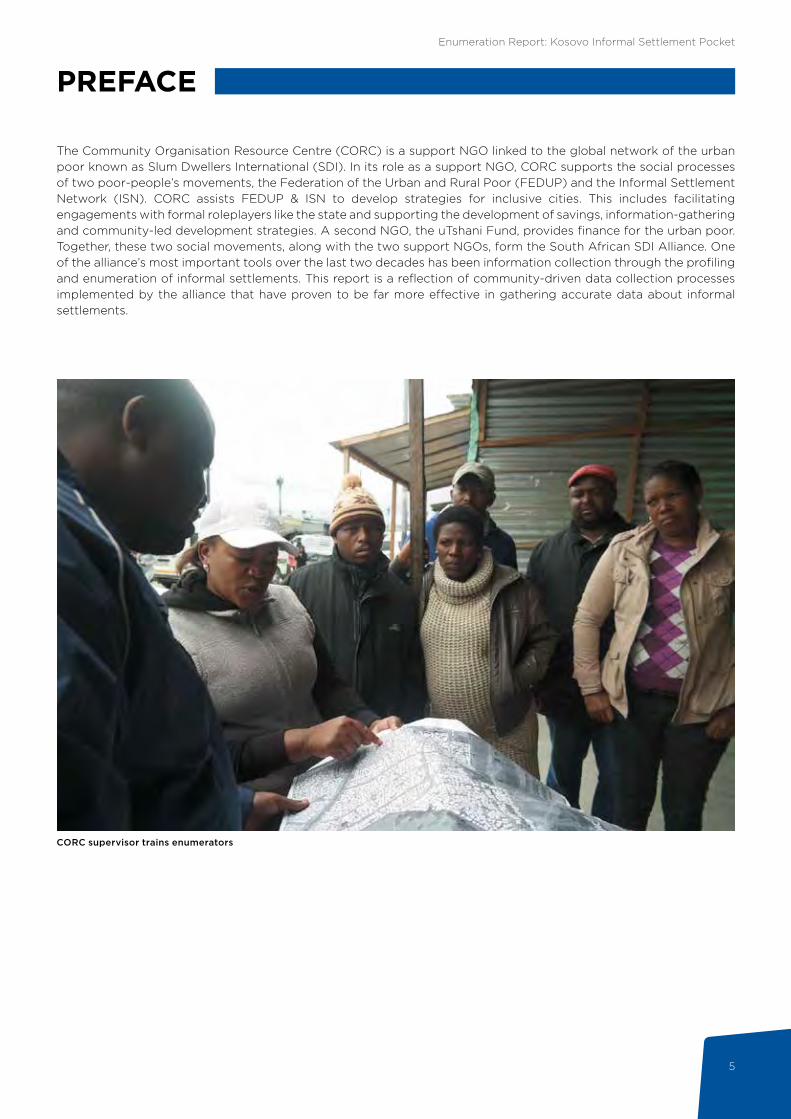
The Community Organisation Resource Centre (CORC) is a support NGO linked to the global network of the urban poor known as Slum Dwellers International (SDI). In its role as a support NGO, CORC supports the social processes of two poor-people’s movements, the Federation of the Urban and Rural Poor (FEDUP) and the Informal Settlement Network (ISN). CORC assists FEDUP & ISN to develop strategies for inclusive cities. This includes facilitating engagements with formal roleplayers like the state and supporting the development of savings, information-gathering and community-led development strategies. A second NGO, the uTshani Fund, provides finance for the urban poor. Together, these two social movements, along with the two support NGOs, form the South African SDI Alliance. One of the alliance’s most important tools over the last two decades has been information collection through the profiling and enumeration of informal settlements. This report is a reflection of community-driven data collection processes implemented by the alliance that have proven to be far more effective in gathering accurate data about informal settlements.
CORC supervisor trains enumerators
Enumeration Report: Kosovo Informal Settlement Pocket
6
EXECUTIVE SUMMARY
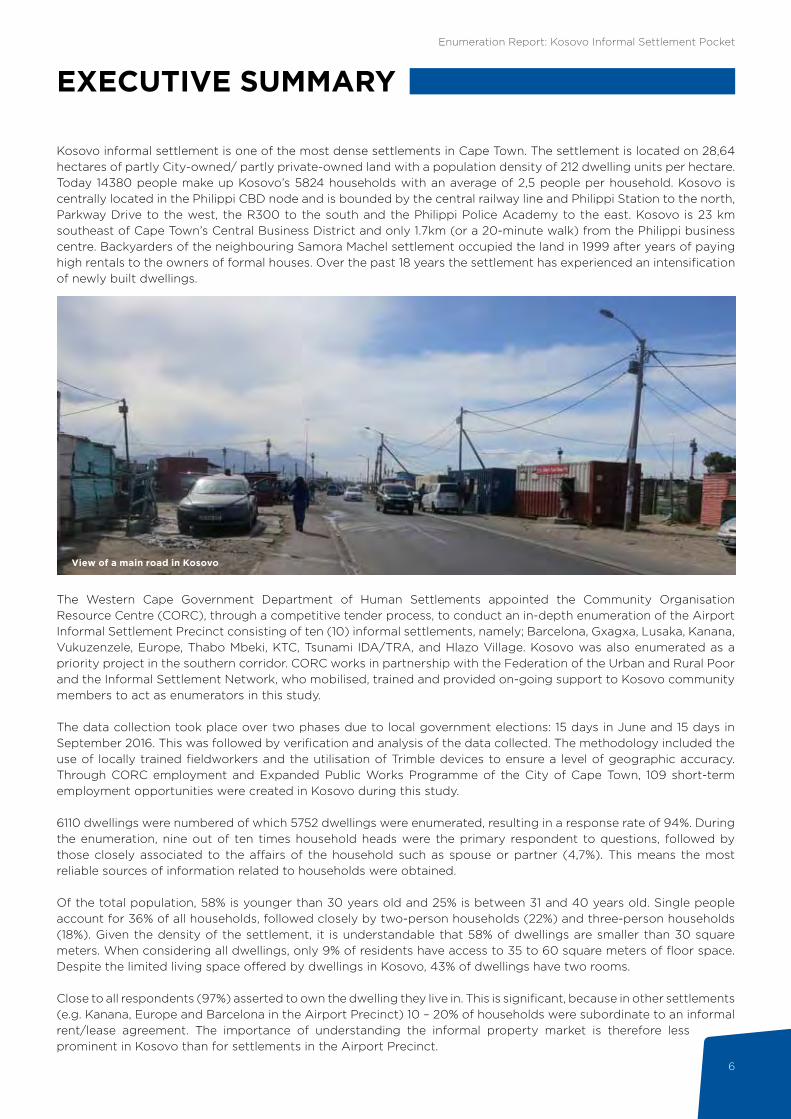
Kosovo informal settlement is one of the most dense settlements in Cape Town. The settlement is located on 28,64 hectares of partly City-owned/ partly private-owned land with a population density of 212 dwelling units per hectare. Today 14380 people make up Kosovo’s 5824 households with an average of 2,5 people per household. Kosovo is centrally located in the Philippi CBD node and is bounded by the central railway line and Philippi Station to the north, Parkway Drive to the west, the R300 to the south and the Philippi Police Academy to the east. Kosovo is 23 km southeast of Cape Town’s Central Business District and only 1.7km (or a 20-minute walk) from the Philippi business centre. Backyarders of the neighbouring Samora Machel settlement occupied the land in 1999 after years of paying high rentals to the owners of formal houses. Over the past 18 years the settlement has experienced an intensification of newly built dwellings.
The Western Cape Government Department of Human Settlements appointed the Community Organisation Resource Centre (CORC), through a competitive tender process, to conduct an in-depth enumeration of the Airport Informal Settlement Precinct consisting of ten (10) informal settlements, namely; Barcelona, Gxagxa, Lusaka, Kanana, Vukuzenzele, Europe, Thabo Mbeki, KTC, Tsunami IDA/TRA, and Hlazo Village. Kosovo was also enumerated as a priority project in the southern corridor. CORC works in partnership with the Federation of the Urban and Rural Poor and the Informal Settlement Network, who mobilised, trained and provided on-going support to Kosovo community members to act as enumerators in this study.
The data collection took place over two phases due to local government elections: 15 days in June and 15 days in September 2016. This was followed by verification and analysis of the data collected. The methodology included the use of locally trained fieldworkers and the utilisation of Trimble devices to ensure a level of geographic accuracy. Through CORC employment and Expanded Public Works Programme of the City of Cape Town, 109 short-term employment opportunities were created in Kosovo during this study.
6110 dwellings were numbered of which 5752 dwellings were enumerated, resulting in a response rate of 94%. During the enumeration, nine out of ten times household heads were the primary respondent to questions, followed by those closely associated to the affairs of the household such as spouse or partner (4,7%). This means the most reliable sources of information related to households were obtained.
Of the total population, 58% is younger than 30 years old and 25% is between 31 and 40 years old. Single people account for 36% of all households, followed closely by two-person households (22%) and three-person households (18%). Given the density of the settlement, it is understandable that 58% of dwellings are smaller than 30 square meters. When considering all dwellings, only 9% of residents have access to 35 to 60 square meters of floor space. Despite the limited living space offered by dwellings in Kosovo, 43% of dwellings have two rooms.
Close to all respondents (97%) asserted to own the dwelling they live in. This is significant, because in other settlements (e.g. Kanana, Europe and Barcelona in the Airport Precinct) 10 – 20% of households were subordinate to an informal rent/lease agreement. The importance of understanding the informal property market is therefore less prominent in Kosovo than for settlements in the Airport Precinct.
View of a main road in Kosovo
Enumeration Report: Kosovo Informal Settlement Pocket
7
The majority of Kosovo residents face economic hardship. According to community responses, the unemployment rate is 56%. The majority of households (97%) earn less than R3500 per month, while 29% of households report to have no income at all. 31 to 35 years olds are the most economically active, followed by 41 to 50 year olds. Youth aged 19 to 30 years, which make up 24% of the total population, are particularly affected. 69 in every 100 youth are unemployed, and women are particularly affected by the shocks related to unemployment since 62% of the unemployed youth are female. Only 2,6% of youth are reportedly self-employed and 46% of youth earn no income. According to the enumeration data, 4,206 people receive the Child Support Grant, 177 pensioners (1,2% of population) receive the old-age grant, and 107 people (0,77%) of the population receive disability grants. Kosovo has more residents with disabilities than many other settlements, and it is important to take this into account when designing services, infrastructure, and access.
In Kosovo, 4707 children are younger than 18 years old and account for 35% of the population. In terms of school going children, 45% are in primary school, 17% are enrolled in pre-school and 16% are enrolled in secondary school. College and university attendance is extremely low. Of all children of school going age (6 to 18 years) 160 (3,4%) do not attend any schooling.
Kosovo is poorly serviced by City of Cape Town and Western Cape Government standards. Households reported their access to electricity is reported as 73% prepaid, 13% illegal connection and 14% have no access to electricity. Water and sanitation services are also lacking as the community grew over the years. At current levels, there are 42 taps resulting in a ratio of 138 households per water tap. There are 188 temporary toilets resulting in a ratio of 31 households per toilet.
Kosovo benefits from its proximity to a central transport node in Cape Town’s transport network. Commuters reported that seven out of ten people get to work by train. Plans of the City of Cape Town and Philippi Economic Development Initiative (PEDI) was revealed in July 2016 to build the largest MyCiti Bus Rapid Transport (BRT) station in the city on the corner of Govan Mbeki and New Eisleben roads, set to transform Philippi business district by unlocking developable land in the vicinity of Philippi Village. Any such development near Philippi Train Station will need to draw the Kosovo community in as stakeholders in the development process.
This enumeration outlines and details evidence to inform the planning and developments strategies for the Airport Precinct initiative. Using the data collected through this study not only improves the evidence base from which settlement planning occurs, but has also proved to build community capacity as central partners in upgrading initiatives.
61101
1 All information reflected in this report is based on the analysis of data collected during the enumeration exercise, unless otherwise stated
MAIN PRIORITIES
UPGRADING CATEGORY
MAJOR CONSTRAINTS
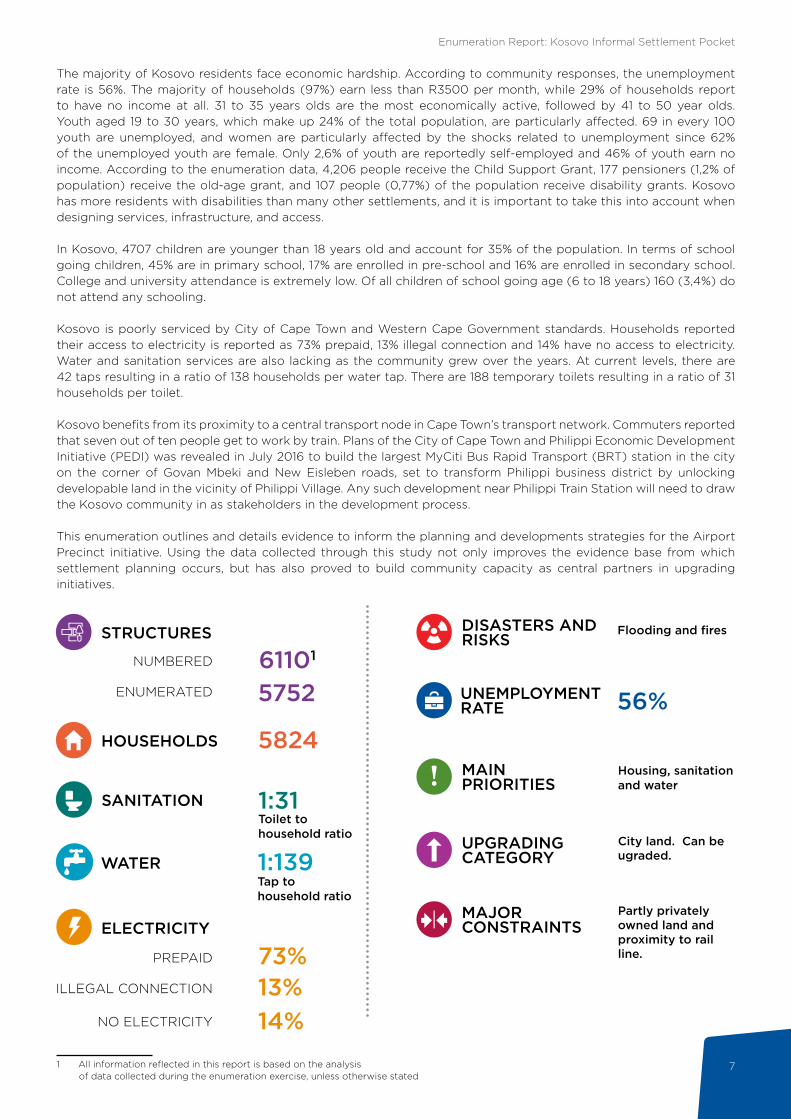
STRUCTURES
NUMBERED
ENUMERATED 5752
HOUSEHOLDS 5824Housing, sanitation and water
City land. Can be ugraded.
Partly privately owned land and proximity to rail line.
1:31Toilet to household ratio
SANITATION
Tap to household ratio
1:139WATER
PREPAID
ILLEGAL CONNECTION
NO ELECTRICITY
73%13%14%
ELECTRICITY
56%UNEMPLOYMENT RATE
DISASTERS AND RISKS
Flooding and fires
Enumeration Report: Kosovo Informal Settlement Pocket
8
1. INTRODUCTION
Introduction01South Africa, like other developing countries, has seen a rapid rise of informal settlements in major cities2. This increase is attributed to a number of factors which can be grouped under two broad categories i.e. urbanisation and population growth. In terms of urbanisation, people migrate into cities in search of greener pastures. Upon arrival, they find it near impossible to secure affordable housing and are often forced to find accommodation in informal settlements. With respect to population growth, Census figures have shown a consistent increase in the population size and growth rates of the country. In addition, there is a growing phenomenon of young adults who split from families in order to set up home elsewhere in pursuit of independence. This further compounds the problems associated with housing demand.3
It is expected that housing would be affected by increases in population size and the decline of household size, which puts an additional strain on the state’s available resources to provide adequate housing for the population.
2 HDA .2013b. South Africa: Informal Settlements Status3 Todes, A. et al. 2010. Contemporary South African Urbanisation Dynamics. Urban Forum. Urban Forum (2010) 21:331–348
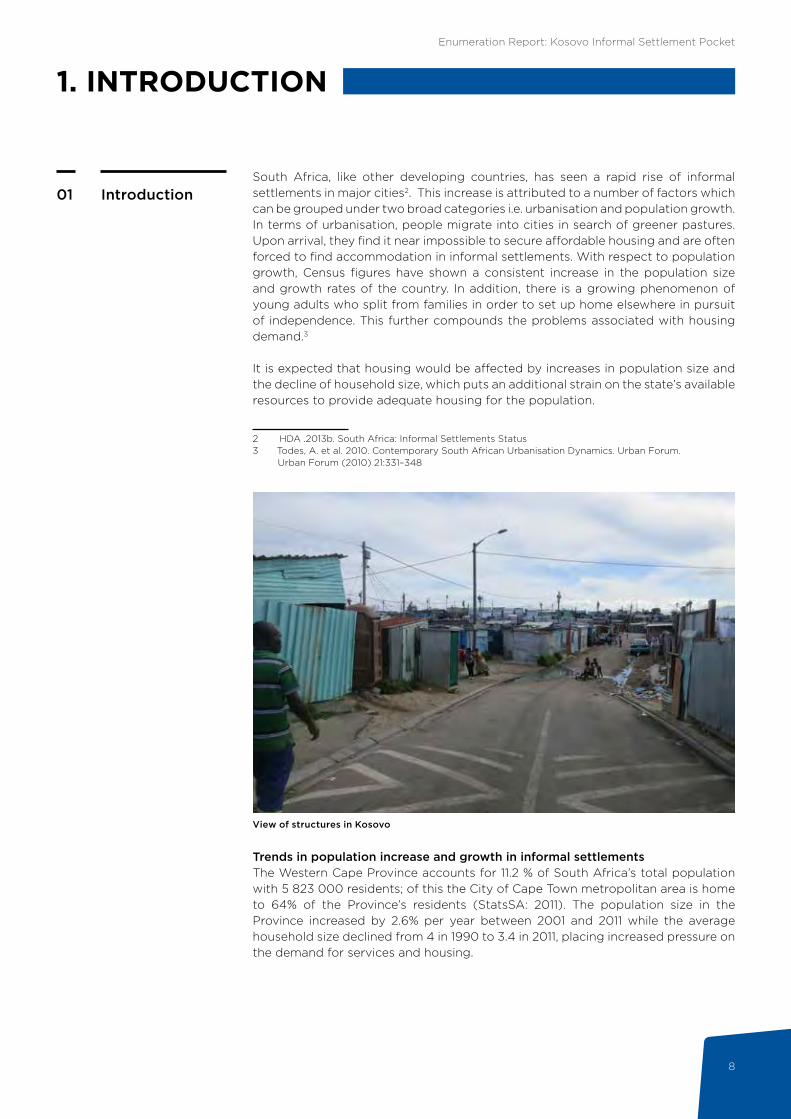
View of structures in Kosovo
Trends in population increase and growth in informal settlementsThe Western Cape Province accounts for 11.2 % of South Africa’s total population with 5 823 000 residents; of this the City of Cape Town metropolitan area is home to 64% of the Province’s residents (StatsSA: 2011). The population size in the Province increased by 2.6% per year between 2001 and 2011 while the average household size declined from 4 in 1990 to 3.4 in 2011, placing increased pressure on the demand for services and housing.

Enumeration Report: Kosovo Informal Settlement Pocket
9
Introduction01Informal settlements are home to millions of people in developing countries. Between 1994 and 2011, the number of informal settlements in South Africa increased from approximately 300 to about 2 700 and it is estimated that 1.25 million households live in these settlements (NDHS, 2014). According to Statistics South Africa (Stats SA), 142 706 households lived in shacks (not in backyards) and informal residential areas in the Western Cape at the time of the 2001 Census. This figure is compared to 191 668 at the time of the 2011 Census (HDA, 2013:11). In 2013, approximately 193 000 households lived in 204 informal settlement areas in the City of Cape Town and this number increases each year. These statistics clearly illustrate that government needs to address informality as a matter of priority. As a starting point, policy and implementation need to align to the Western Cape Department of Human Settlements’ strategic direction of allocating more resources to the Upgrading of Informal Settlements Programme (UISP) in order to improve the living conditions of informal settlement dwellers and those living in backyards who continue to wait for a housing opportunity.
Catalytic projects – creating opportunities at scaleIn 2014, the national Minister of Human Settlements announced that the Department would embark on the delivery of catalytic human settlements projects to capitalise on the economies of scale of such projects. Subsequently, the Minister of the Western Cape Department of Human Settlements (WCDHS), Bonginkosi Madikizela announced in his 2015 Budget Speech that the Department had identified 5 catalytic and 9 priority projects in the province, which would be funded and jointly implemented with the National Department of Human Settlements (NDHS). The Southern Corridor Integrated Human Settlements Project is one of the catalytic projects and is comprised of several projects within the City of Cape Town’s area of jurisdiction. The Airport Informal Settlement Precinct and Kosovo are two projects that will be implemented through the Southern Corridor Integrated Human Settlements Project.
The Airport Informal Settlement Precinct consists of ten (10) informal settlements, namely; Barcelona, Gxagxa, Lusaka, Kanana, Vukuzenzele, Europe, Thabo Mbeki, KTC, Tsunami IDA/TRA, and Hlazo Village. These settlements form a strip of between 200 and 500 metres wide along the southern border of the N2. The majority of settlements border Steve Biko Street to the northwest and Borcherds Quarry Road to the southeast, stretching 2.5km in a northwest-southeast direction. Barcelona, Gxagxa, Lusaka, Kanana, Vukuzenzele, and Europe were enumerated in the first phase of the government contract. Thabo Mbeki, KTC, Tsunami IDA/TRA and Hlazo Village were enumerated in the second phase and form part of the Airport Precinct. Kosovo was also enumerated in this government contract as a priority project in the Southern Corridor.
It is in this context that the Department commissioned an enumeration study across each of these informal settlement pockets, appointing the Community Organisation Resource Centre (CORC) through a competitive bidding process, to undertake this task.
Enumeration Report: Kosovo Informal Settlement Pocket
10
Introduction01Overall purpose of the studyThe overall purpose of the enumeration study was to gather data and information at household level in order to understand the profile of the households, social networks and the level of services in the informal settlement pockets that form part of the Southern Corridor. The data and information gathered will assist the Department in understanding the status quo of each informal settlement pocket in order to develop credible settlement profiles which will assist with determining human settlement needs per household, informing decision making, and future planning for the informal settlement pockets.
The project deliverables of the study were to:• Negotiate, design, implement and manage a stakeholder participatory process• Conduct a household level enumeration exercise• Conduct GIS mapping of all households• Analyse the data collected for each settlement• Record existing social infrastructure and socio-economic opportunities• Develop a database which will provide a profile of each household and each
informal settlement
Kosovo shack numbering team
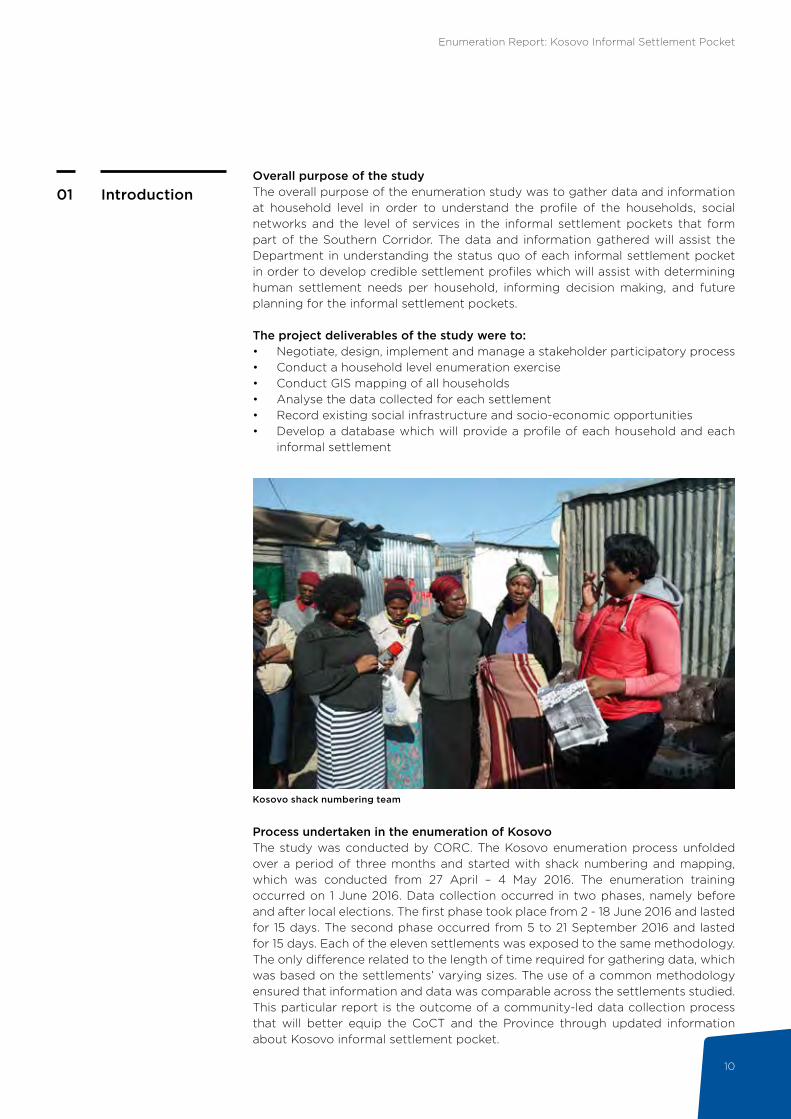
Process undertaken in the enumeration of KosovoThe study was conducted by CORC. The Kosovo enumeration process unfolded over a period of three months and started with shack numbering and mapping, which was conducted from 27 April – 4 May 2016. The enumeration training occurred on 1 June 2016. Data collection occurred in two phases, namely before and after local elections. The first phase took place from 2 - 18 June 2016 and lasted for 15 days. The second phase occurred from 5 to 21 September 2016 and lasted for 15 days. Each of the eleven settlements was exposed to the same methodology. The only difference related to the length of time required for gathering data, which was based on the settlements’ varying sizes. The use of a common methodology ensured that information and data was comparable across the settlements studied. This particular report is the outcome of a community-led data collection process that will better equip the CoCT and the Province through updated information about Kosovo informal settlement pocket.
Enumeration Report: Kosovo Informal Settlement Pocket
11
2. LOCATION AND CONTEXT OF THE SETTLEMENT
Location and context of the settlement
02
COMUNITY VOICES
“In 1999 there was a war that took place in Kosovo. That was the time when the community occupied the land. You know people (were) listening to much news and radios. So people can take [news] from the electronic things and make it their own. Every time in the news it was all about Kosovo. So that was a time of heavy instability and it coincided [with] our own Kosovo here.”
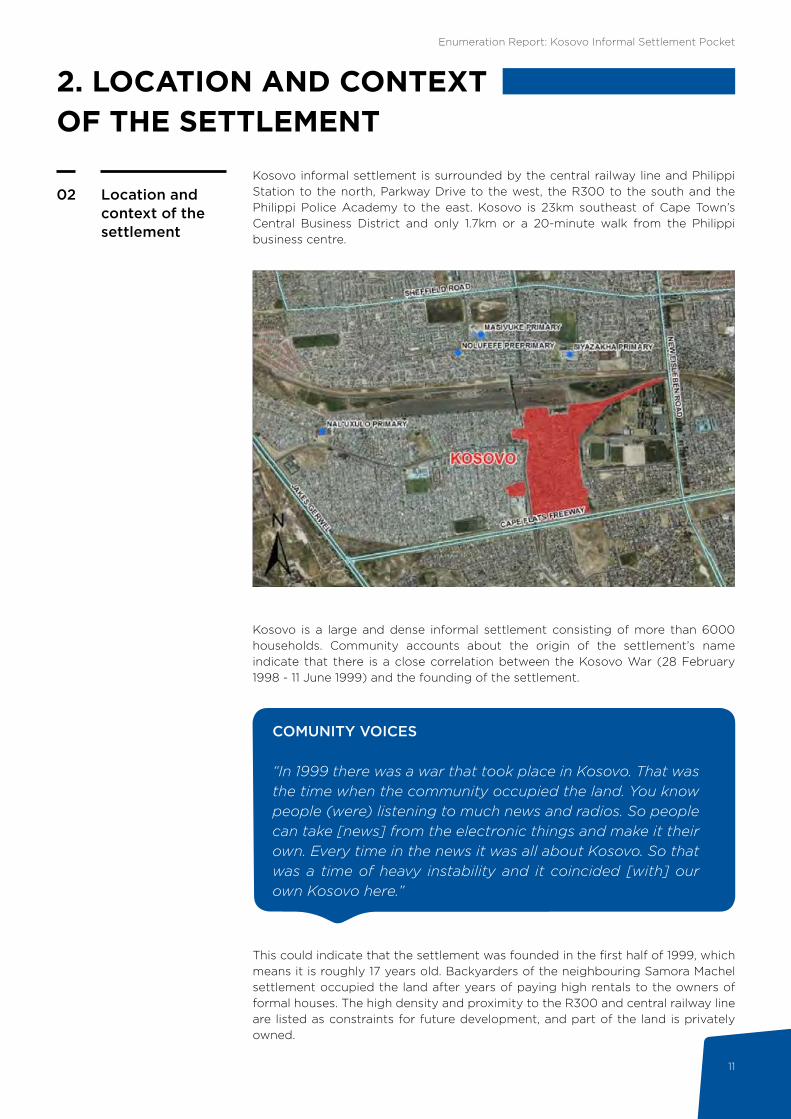
Kosovo informal settlement is surrounded by the central railway line and Philippi Station to the north, Parkway Drive to the west, the R300 to the south and the Philippi Police Academy to the east. Kosovo is 23km southeast of Cape Town’s Central Business District and only 1.7km or a 20-minute walk from the Philippi business centre.
Kosovo is a large and dense informal settlement consisting of more than 6000 households. Community accounts about the origin of the settlement’s name indicate that there is a close correlation between the Kosovo War (28 February 1998 - 11 June 1999) and the founding of the settlement.
This could indicate that the settlement was founded in the first half of 1999, which means it is roughly 17 years old. Backyarders of the neighbouring Samora Machel settlement occupied the land after years of paying high rentals to the owners of formal houses. The high density and proximity to the R300 and central railway line are listed as constraints for future development, and part of the land is privately owned.
Enumeration Report: Kosovo Informal Settlement Pocket
12
Location and context of the settlement
02 COMUNITY VOICES
“We were backyarders in Samora and our landlords treated us badly. For example, if you don’t work you will pay R500 [in rent]. After paying your R500, the landlord will still complain about water and electricity. We decided to [stop] renting and saw a field that was near. The field was a very dangerous place where people were dying. But we didn’t have a choice because we didn’t have a place to stay. We [moved to] Kosovo and the people came and came to put [up] their houses in the field.”
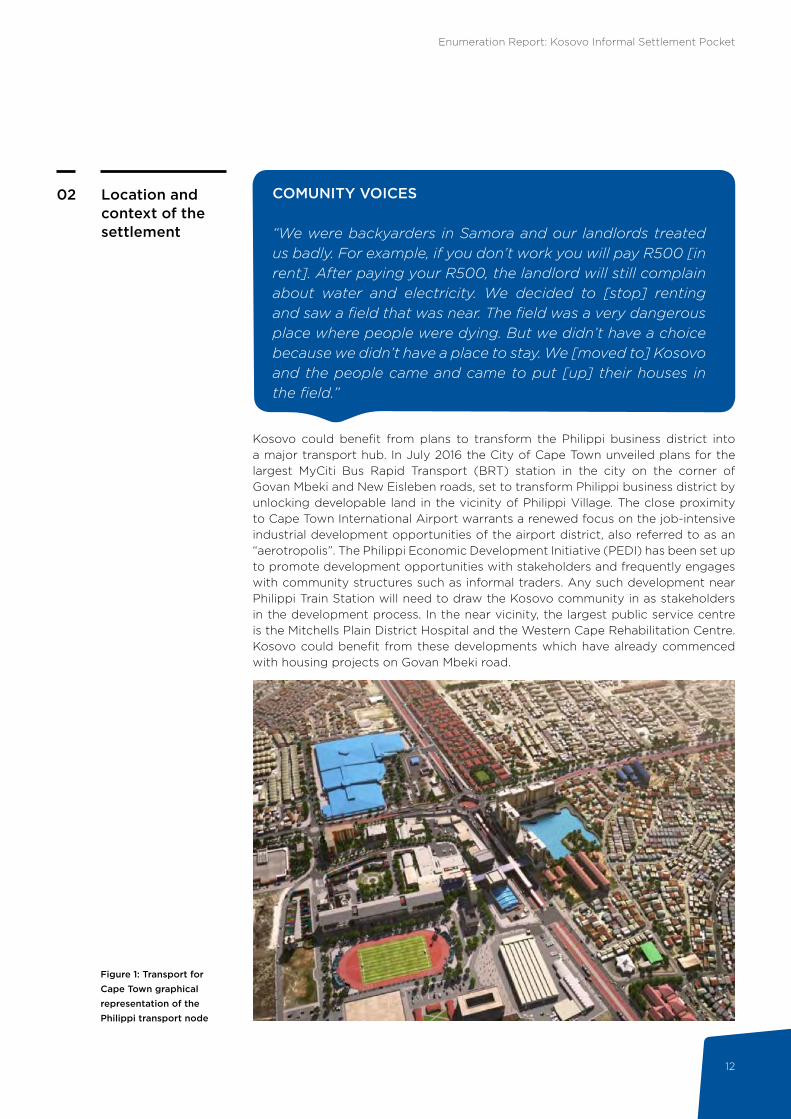
Kosovo could benefit from plans to transform the Philippi business district into a major transport hub. In July 2016 the City of Cape Town unveiled plans for the largest MyCiti Bus Rapid Transport (BRT) station in the city on the corner of Govan Mbeki and New Eisleben roads, set to transform Philippi business district by unlocking developable land in the vicinity of Philippi Village. The close proximity to Cape Town International Airport warrants a renewed focus on the job-intensive industrial development opportunities of the airport district, also referred to as an “aerotropolis”. The Philippi Economic Development Initiative (PEDI) has been set up to promote development opportunities with stakeholders and frequently engages with community structures such as informal traders. Any such development near Philippi Train Station will need to draw the Kosovo community in as stakeholders in the development process. In the near vicinity, the largest public service centre is the Mitchells Plain District Hospital and the Western Cape Rehabilitation Centre. Kosovo could benefit from these developments which have already commenced with housing projects on Govan Mbeki road.
Figure 1: Transport for Cape Town graphical representation of the Philippi transport node
Enumeration Report: Kosovo Informal Settlement Pocket
13
Location and context of the settlement
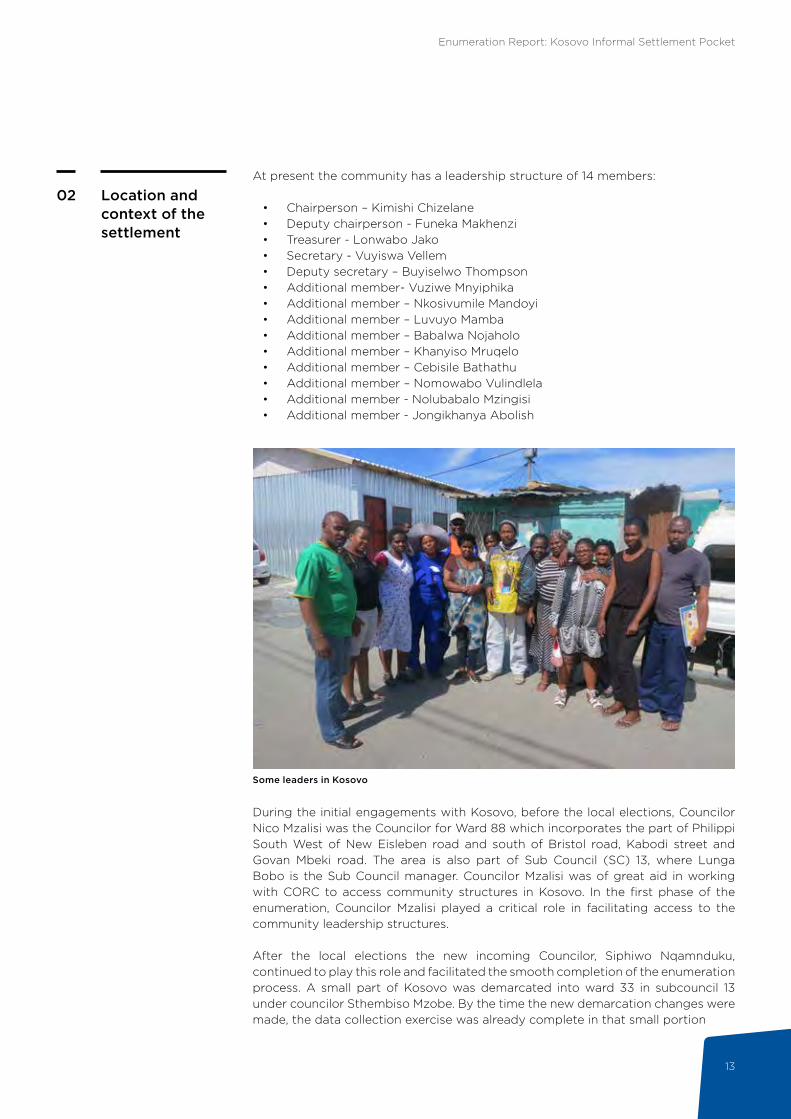
02At present the community has a leadership structure of 14 members:
• Chairperson – Kimishi Chizelane• Deputy chairperson - Funeka Makhenzi• Treasurer - Lonwabo Jako• Secretary - Vuyiswa Vellem• Deputy secretary – Buyiselwo Thompson• Additional member- Vuziwe Mnyiphika• Additional member – Nkosivumile Mandoyi• Additional member – Luvuyo Mamba• Additional member – Babalwa Nojaholo• Additional member – Khanyiso Mruqelo• Additional member – Cebisile Bathathu• Additional member – Nomowabo Vulindlela• Additional member - Nolubabalo Mzingisi• Additional member - Jongikhanya Abolish
Some leaders in Kosovo
During the initial engagements with Kosovo, before the local elections, Councilor Nico Mzalisi was the Councilor for Ward 88 which incorporates the part of Philippi South West of New Eisleben road and south of Bristol road, Kabodi street and Govan Mbeki road. The area is also part of Sub Council (SC) 13, where Lunga Bobo is the Sub Council manager. Councilor Mzalisi was of great aid in working with CORC to access community structures in Kosovo. In the first phase of the enumeration, Councilor Mzalisi played a critical role in facilitating access to the community leadership structures.
After the local elections the new incoming Councilor, Siphiwo Nqamnduku, continued to play this role and facilitated the smooth completion of the enumeration process. A small part of Kosovo was demarcated into ward 33 in subcouncil 13 under councilor Sthembiso Mzobe. By the time the new demarcation changes were made, the data collection exercise was already complete in that small portion
Enumeration Report: Kosovo Informal Settlement Pocket
14
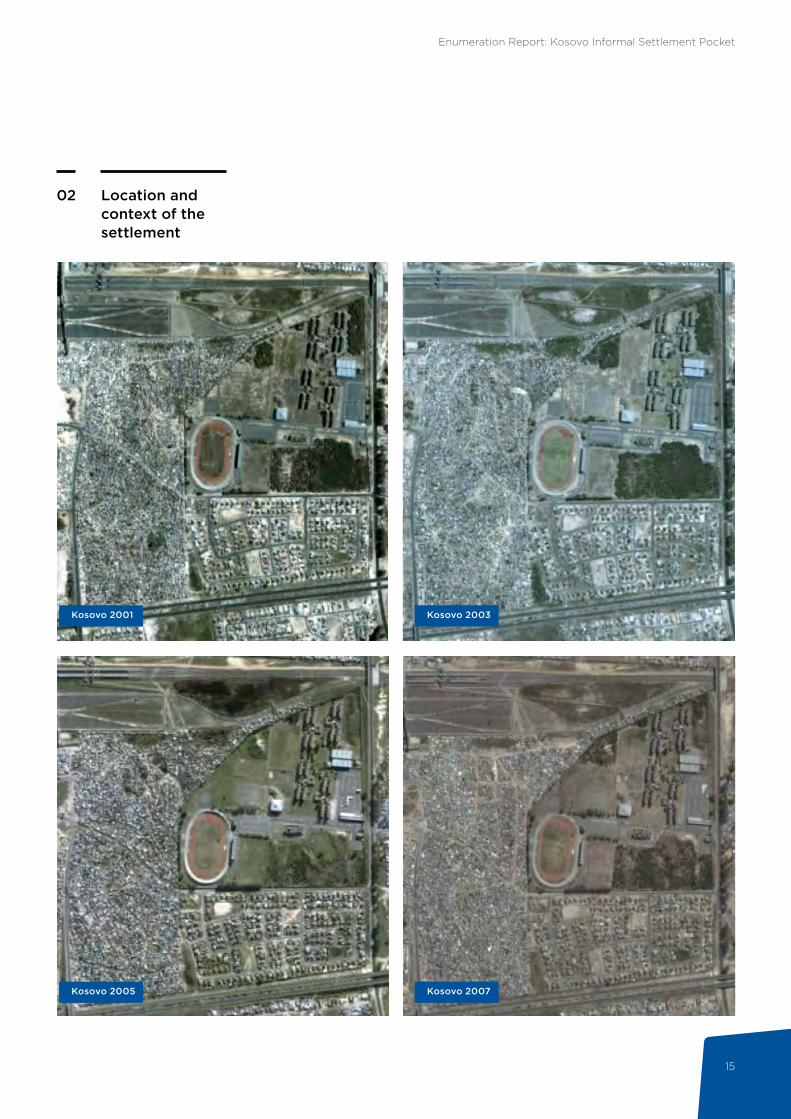
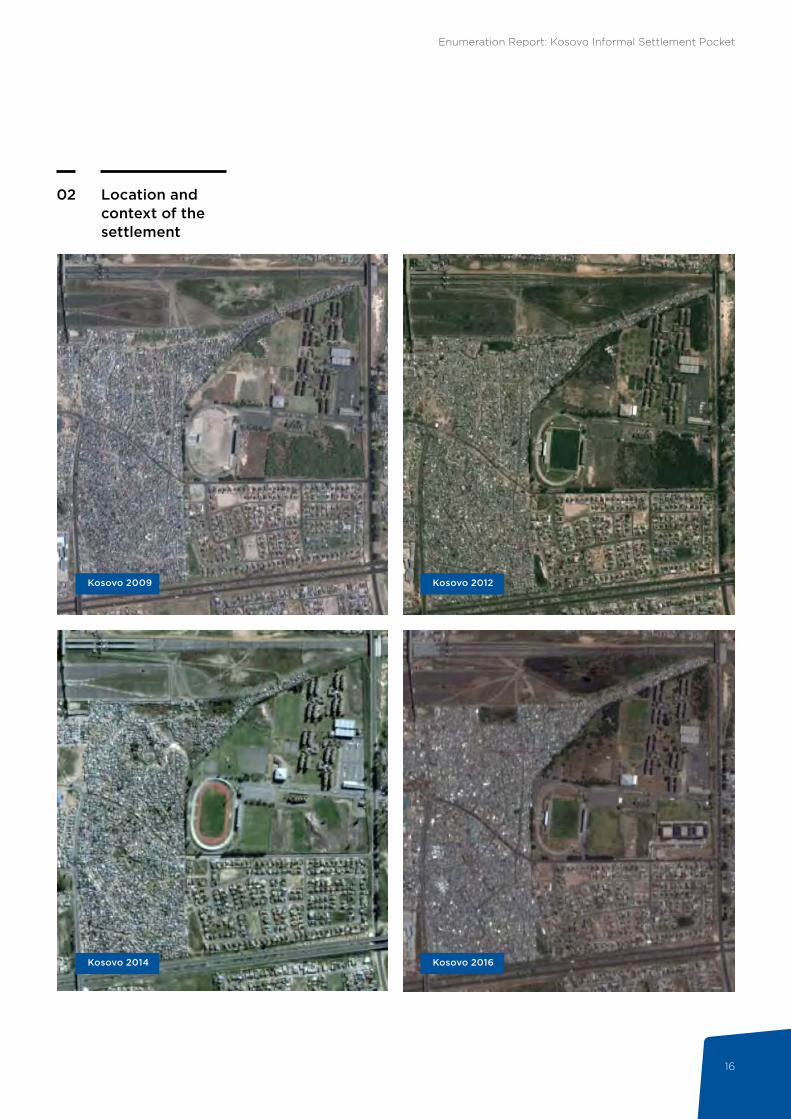
The growth of Kosovo can also be analysed by means of reviewing trends in historical Google Earth satellite images. If community records are accurate that the settlement was founded in 1999, a logical deduction is that the land invasion and subsequent occupation was rapid. The earliest satellite image available from 2001 illustrates that a substantial portion of the current population was already living in Kosovo settlement. When tracing the settlement growth over the next six years (2001-2007), the intensity of dwelling construction can be observed, and the last remaining open spaces such as the sliver of land to the northeast near the rail line and pockets of wetland in the centre are occupied. The informal street patterns also emerge more prominently. From 2009-2014, the density of the settlement appears to be stable. However, judging from the satellite images in 2012, it appears that a fire could have destroyed approximately 100-200 dwellings on the intersection of Parkway drive and White Hart Lane. This land was again occupied by 2014. In 2016, two pockets of land to the west of the settlement were occupied more intensely. These sections are included as part of the area enumerated in Kosovo. Today the settlement covers 28.64ha at a density of 212 households per hectare, which is significantly higher than the average citywide density of 5.26 dwelling units per hectare.
Location and context of the settlement
02 COMUNITY VOICES
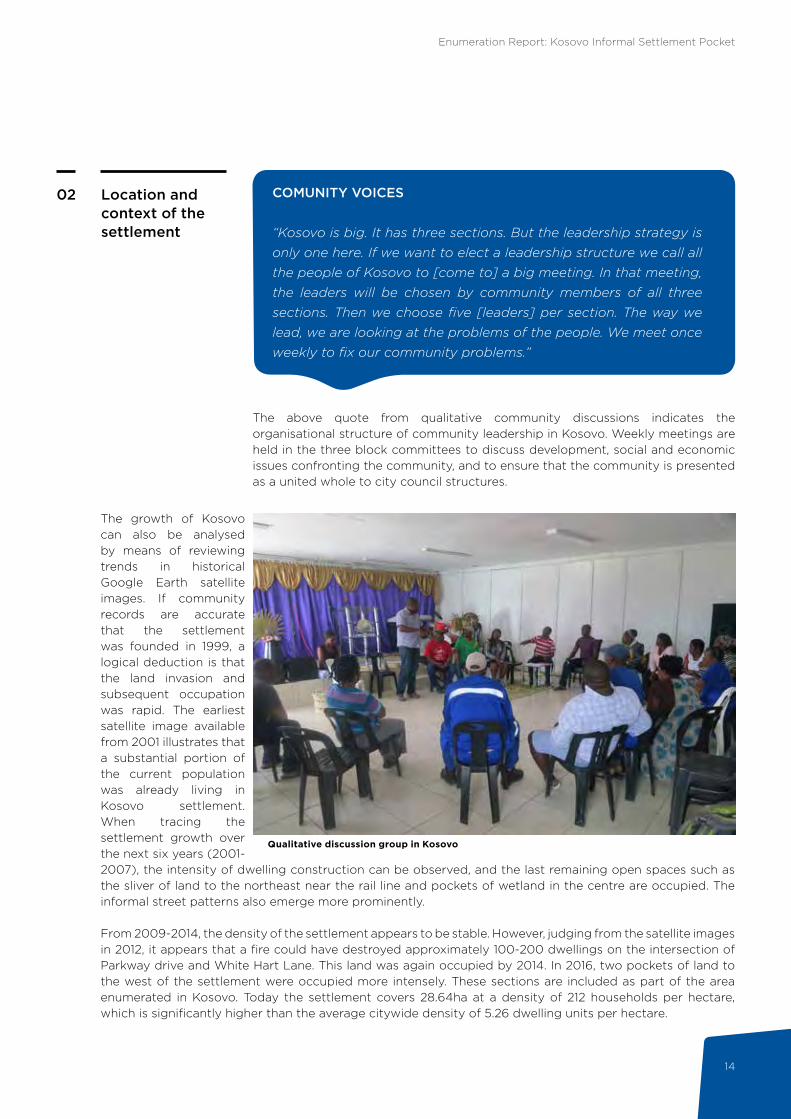
“Kosovo is big. It has three sections. But the leadership strategy is only one here. If we want to elect a leadership structure we call all the people of Kosovo to [come to] a big meeting. In that meeting, the leaders will be chosen by community members of all three sections. Then we choose five [leaders] per section. The way we lead, we are looking at the problems of the people. We meet once weekly to fix our community problems.”
The above quote from qualitative community discussions indicates the organisational structure of community leadership in Kosovo. Weekly meetings are held in the three block committees to discuss development, social and economic issues confronting the community, and to ensure that the community is presented as a united whole to city council structures.
Qualitative discussion group in Kosovo
Enumeration Report: Kosovo Informal Settlement Pocket
15
Kosovo 2001
Location and context of the settlement
02
Kosovo 2003
Kosovo 2005 Kosovo 2007
Enumeration Report: Kosovo Informal Settlement Pocket
16
Kosovo 2016
Location and context of the settlement
02
Kosovo 2009 Kosovo 2012
Kosovo 2014
Enumeration Report: Kosovo Informal Settlement Pocket
17
3. METHODOLOGY
Methodology03
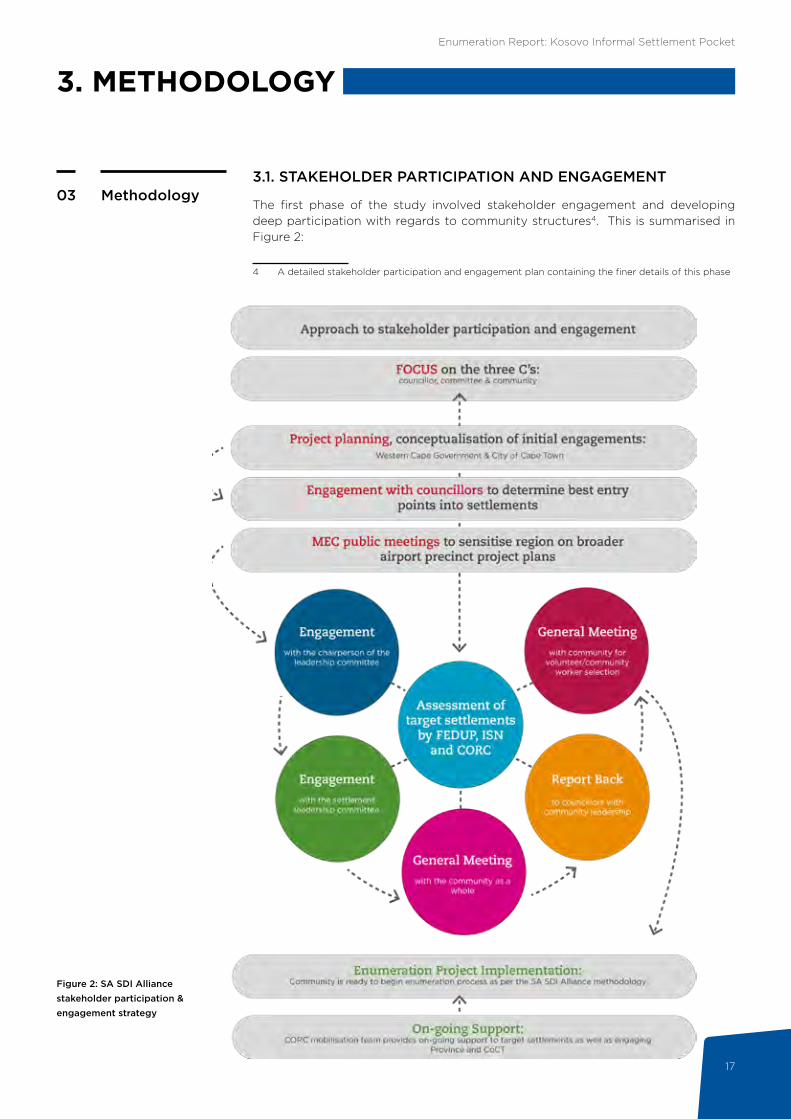
Figure 2: SA SDI Alliance stakeholder participation & engagement strategy
3.1. STAKEHOLDER PARTICIPATION AND ENGAGEMENT
The first phase of the study involved stakeholder engagement and developing deep participation with regards to community structures4. This is summarised in Figure 2:
4 A detailed stakeholder participation and engagement plan containing the finer details of this phase
Enumeration Report: Kosovo Informal Settlement Pocket
18
Methodology033.2. PRE-IMPLEMENTATION AND FIELD WORK
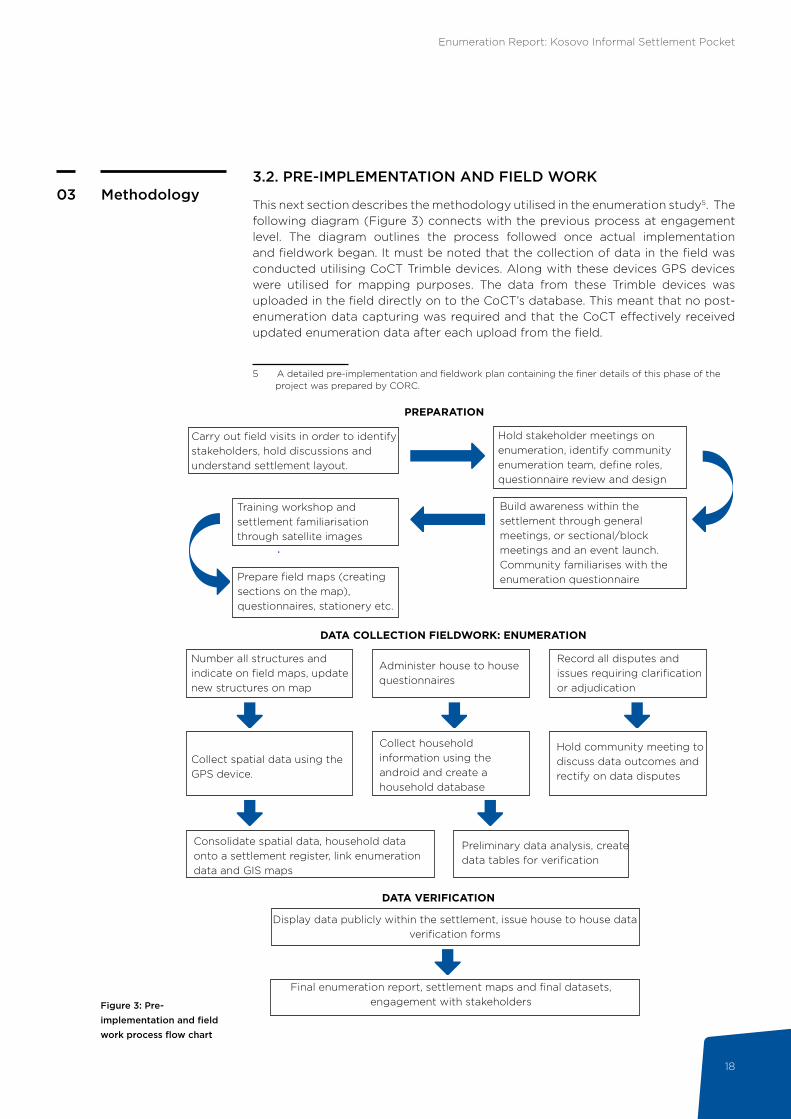
This next section describes the methodology utilised in the enumeration study5. The following diagram (Figure 3) connects with the previous process at engagement level. The diagram outlines the process followed once actual implementation and fieldwork began. It must be noted that the collection of data in the field was conducted utilising CoCT Trimble devices. Along with these devices GPS devices were utilised for mapping purposes. The data from these Trimble devices was uploaded in the field directly on to the CoCT’s database. This meant that no post-enumeration data capturing was required and that the CoCT effectively received updated enumeration data after each upload from the field.
5 A detailed pre-implementation and fieldwork plan containing the finer details of this phase of the project was prepared by CORC.
Figure 3: Pre-implementation and field work process flow chart
Final enumeration report, settlement maps and final datasets, engagement with stakeholders
DATA COLLECTION FIELDWORK: ENUMERATION
PREPARATION
Carry out field visits in order to identify stakeholders, hold discussions and understand settlement layout.
Training workshop and settlement familiarisation through satellite images
Prepare field maps (creating sections on the map), questionnaires, stationery etc.
Number all structures and indicate on field maps, update new structures on map
Collect spatial data using the GPS device.
Consolidate spatial data, household data onto a settlement register, link enumeration data and GIS maps
Hold stakeholder meetings on enumeration, identify community enumeration team, define roles, questionnaire review and design
Build awareness within the settlement through general meetings, or sectional/block meetings and an event launch. Community familiarises with the enumeration questionnaire
Administer house to house questionnaires
Record all disputes and issues requiring clarification or adjudication
Hold community meeting to discuss data outcomes and rectify on data disputes
Collect household information using the android and create a household database
Preliminary data analysis, create data tables for verification
Display data publicly within the settlement, issue house to house data verification forms
DATA VERIFICATION
Enumeration Report: Kosovo Informal Settlement Pocket
19
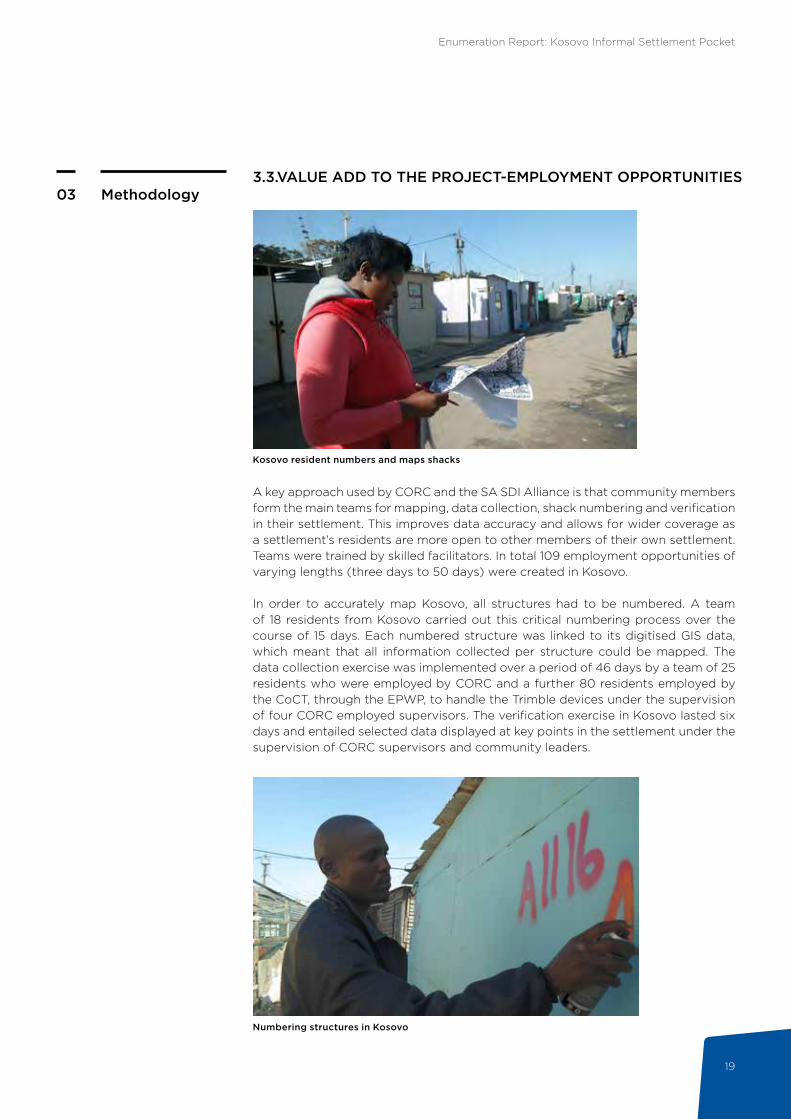
3.3.VALUE ADD TO THE PROJECT-EMPLOYMENT OPPORTUNITIESMethodology03
Kosovo resident numbers and maps shacks
A key approach used by CORC and the SA SDI Alliance is that community members form the main teams for mapping, data collection, shack numbering and verification in their settlement. This improves data accuracy and allows for wider coverage as a settlement’s residents are more open to other members of their own settlement. Teams were trained by skilled facilitators. In total 109 employment opportunities of varying lengths (three days to 50 days) were created in Kosovo.
In order to accurately map Kosovo, all structures had to be numbered. A team of 18 residents from Kosovo carried out this critical numbering process over the course of 15 days. Each numbered structure was linked to its digitised GIS data, which meant that all information collected per structure could be mapped. The data collection exercise was implemented over a period of 46 days by a team of 25 residents who were employed by CORC and a further 80 residents employed by the CoCT, through the EPWP, to handle the Trimble devices under the supervision of four CORC employed supervisors. The verification exercise in Kosovo lasted six days and entailed selected data displayed at key points in the settlement under the supervision of CORC supervisors and community leaders.
Numbering structures in Kosovo
Enumeration Report: Kosovo Informal Settlement Pocket
20
4. COVERAGE OF THE ENUMERATION AND RESPONSE RATES
Coverage of the enumeration and response rates
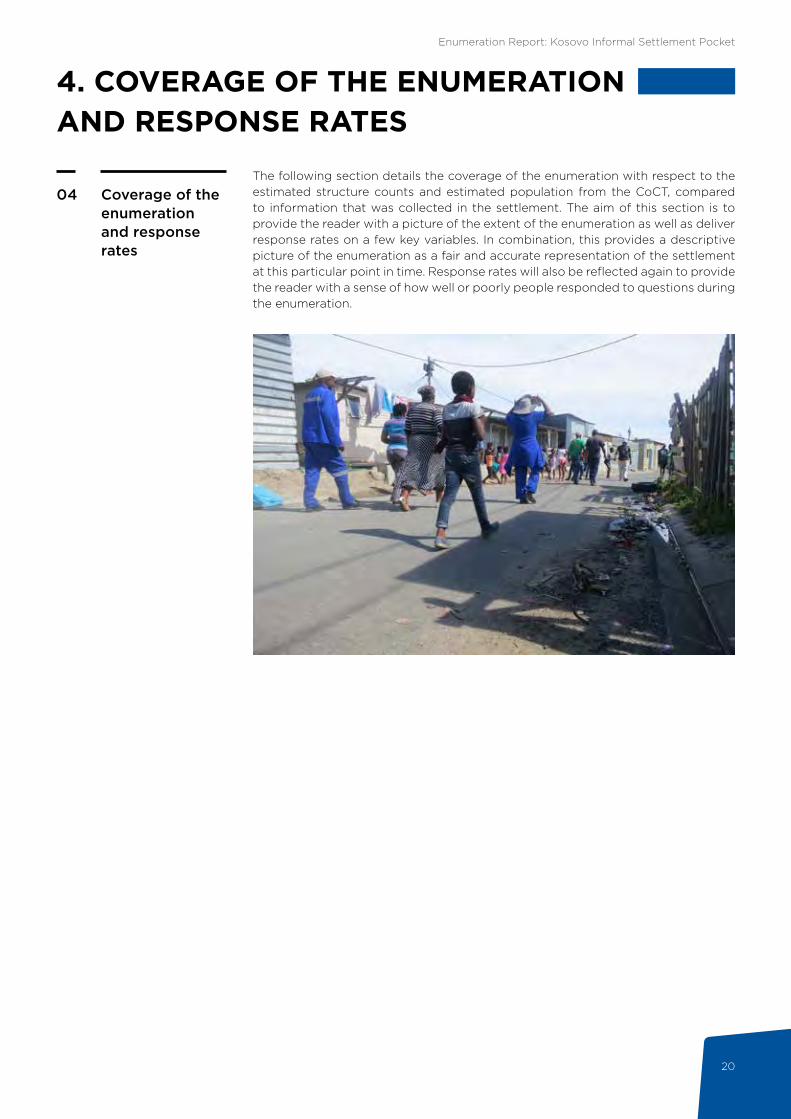
04The following section details the coverage of the enumeration with respect to the estimated structure counts and estimated population from the CoCT, compared to information that was collected in the settlement. The aim of this section is to provide the reader with a picture of the extent of the enumeration as well as deliver response rates on a few key variables. In combination, this provides a descriptive picture of the enumeration as a fair and accurate representation of the settlement at this particular point in time. Response rates will also be reflected again to provide the reader with a sense of how well or poorly people responded to questions during the enumeration.
Enumeration Report: Kosovo Informal Settlement Pocket
21
Coverage of the enumeration and response rates
04
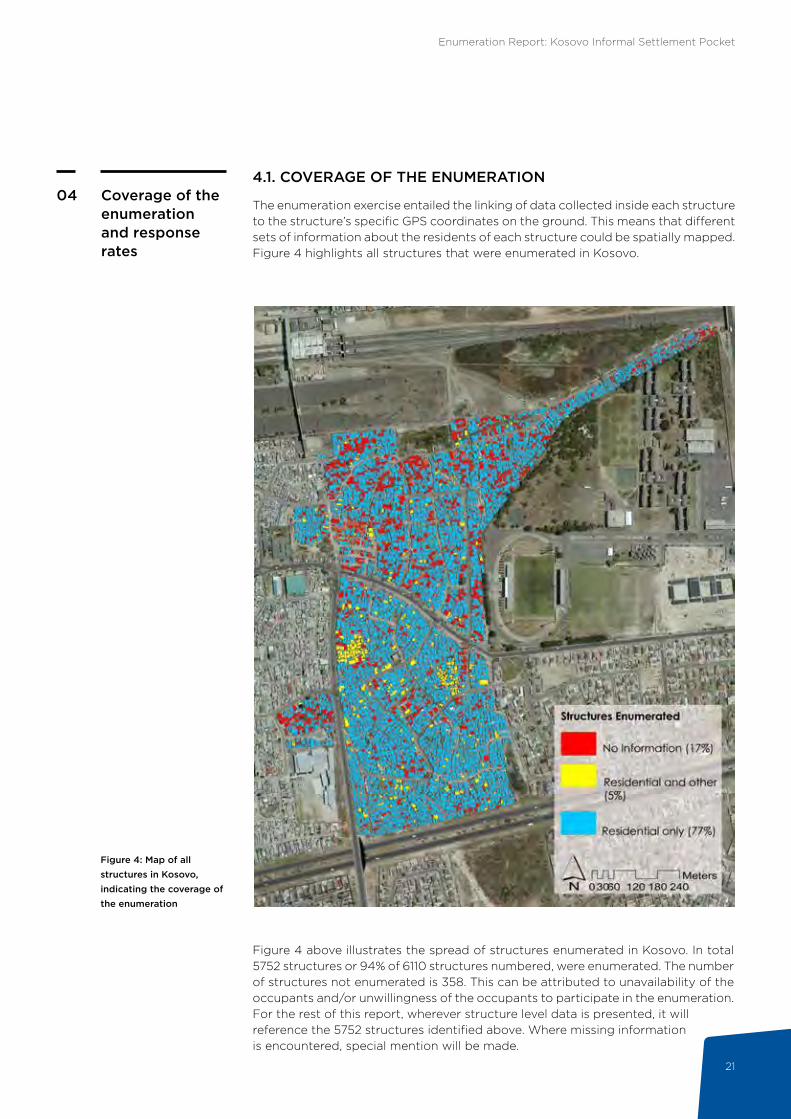
Figure 4: Map of all structures in Kosovo, indicating the coverage of the enumeration
4.1. COVERAGE OF THE ENUMERATION
The enumeration exercise entailed the linking of data collected inside each structure to the structure’s specific GPS coordinates on the ground. This means that different sets of information about the residents of each structure could be spatially mapped. Figure 4 highlights all structures that were enumerated in Kosovo.
Figure 4 above illustrates the spread of structures enumerated in Kosovo. In total 5752 structures or 94% of 6110 structures numbered, were enumerated. The number of structures not enumerated is 358. This can be attributed to unavailability of the occupants and/or unwillingness of the occupants to participate in the enumeration. For the rest of this report, wherever structure level data is presented, it will reference the 5752 structures identified above. Where missing information is encountered, special mention will be made.
Enumeration Report: Kosovo Informal Settlement Pocket
22
Coverage of the enumeration and response rates
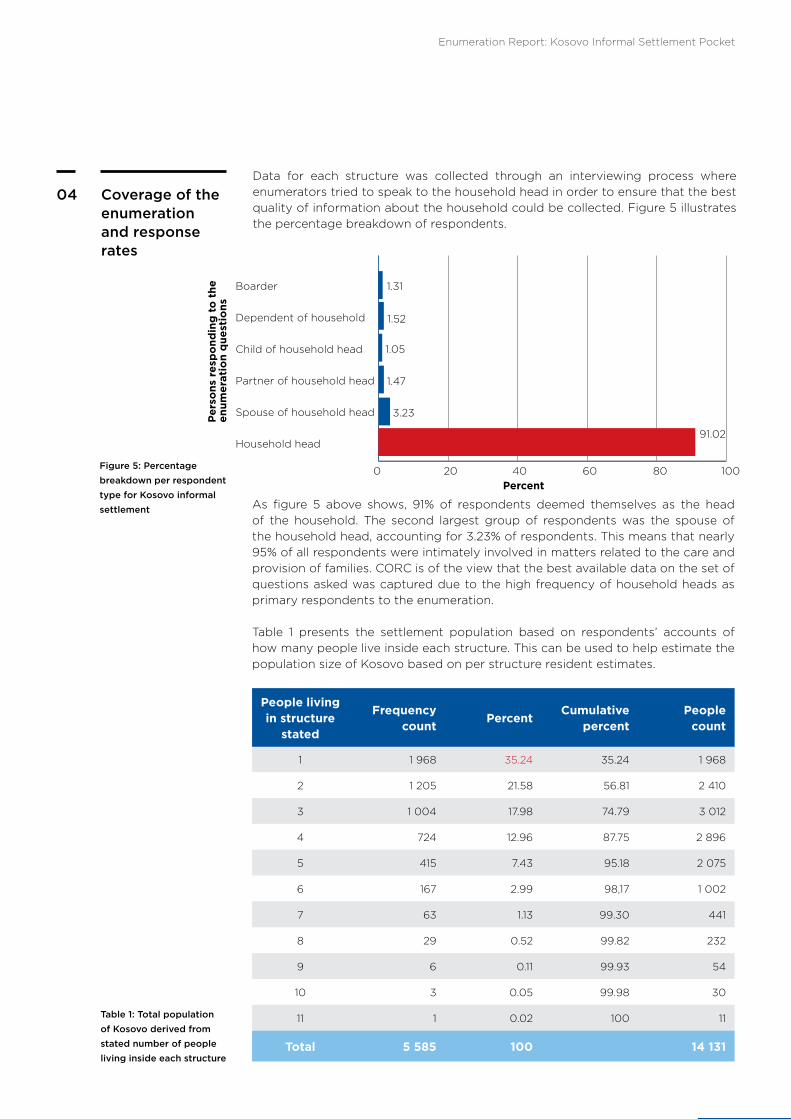
04Data for each structure was collected through an interviewing process where enumerators tried to speak to the household head in order to ensure that the best quality of information about the household could be collected. Figure 5 illustrates the percentage breakdown of respondents.
As figure 5 above shows, 91% of respondents deemed themselves as the head of the household. The second largest group of respondents was the spouse of the household head, accounting for 3.23% of respondents. This means that nearly 95% of all respondents were intimately involved in matters related to the care and provision of families. CORC is of the view that the best available data on the set of questions asked was captured due to the high frequency of household heads as primary respondents to the enumeration.
Table 1 presents the settlement population based on respondents’ accounts of how many people live inside each structure. This can be used to help estimate the population size of Kosovo based on per structure resident estimates.
Figure 5: Percentage breakdown per respondent type for Kosovo informal settlement
Percent0 20
1.31
1.52
1.05
1.47
3.23
91.02
40 60 80 100
Boarder
Dependent of household
Child of household head
Partner of household head
Spouse of household head
Household head
Per
sons
res
po
ndin
g t
o t
he
enum
erat
ion
que
stio
ns
People living in structure
stated
Frequency count
PercentCumulative
percentPeople
count
1 1 968 35.24 35.24 1 968
2 1 205 21.58 56.81 2 410
3 1 004 17.98 74.79 3 012
4 724 12.96 87.75 2 896
5 415 7.43 95.18 2 075
6 167 2.99 98,17 1 002
7 63 1.13 99.30 441
8 29 0.52 99.82 232
9 6 0.11 99.93 54
10 3 0.05 99.98 30
11 1 0.02 100 11
Total 5 585 100 14 131
Table 1: Total population of Kosovo derived from stated number of people living inside each structure
Enumeration Report: Kosovo Informal Settlement Pocket
23
Coverage of the enumeration and response rates
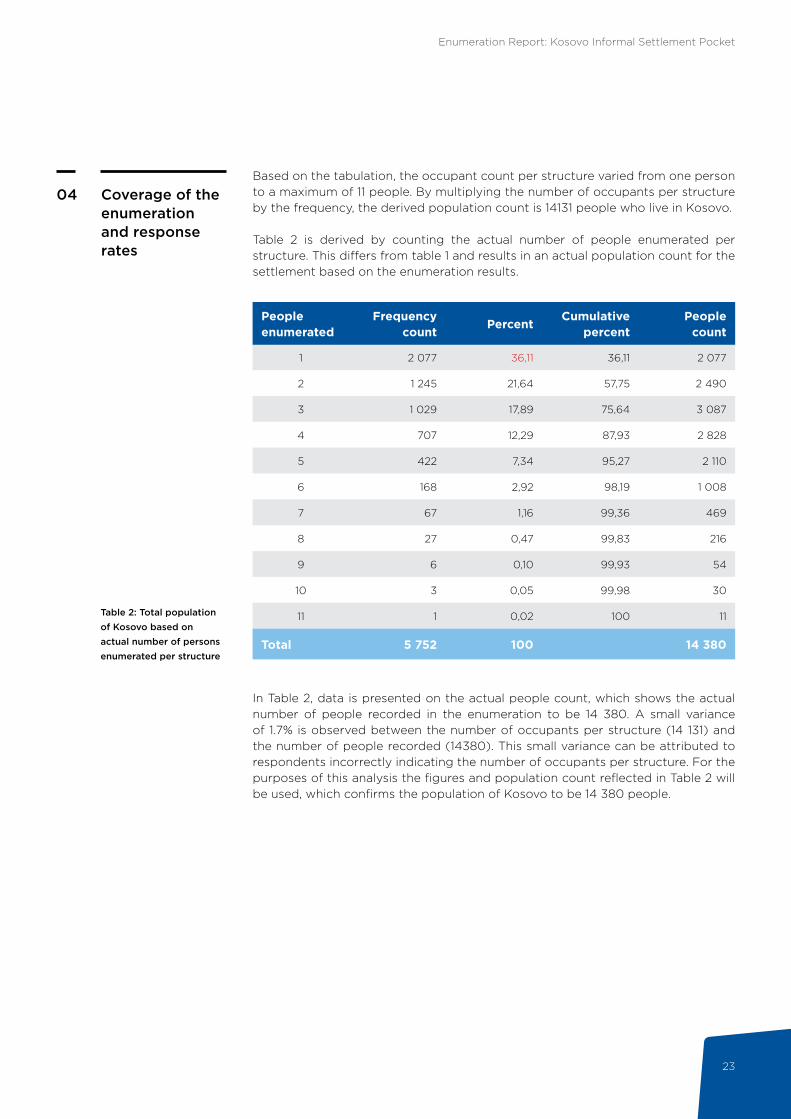
04Based on the tabulation, the occupant count per structure varied from one person to a maximum of 11 people. By multiplying the number of occupants per structure by the frequency, the derived population count is 14131 people who live in Kosovo.
Table 2 is derived by counting the actual number of people enumerated per structure. This differs from table 1 and results in an actual population count for the settlement based on the enumeration results.
People enumerated
Frequency count
PercentCumulative
percentPeople
count
1 2 077 36,11 36,11 2 077
2 1 245 21,64 57,75 2 490
3 1 029 17,89 75,64 3 087
4 707 12,29 87,93 2 828
5 422 7,34 95,27 2 110
6 168 2,92 98,19 1 008
7 67 1,16 99,36 469
8 27 0,47 99,83 216
9 6 0,10 99,93 54
10 3 0,05 99,98 30
11 1 0,02 100 11
Total 5 752 100 14 380
Table 2: Total population of Kosovo based on actual number of persons enumerated per structure
In Table 2, data is presented on the actual people count, which shows the actual number of people recorded in the enumeration to be 14 380. A small variance of 1.7% is observed between the number of occupants per structure (14 131) and the number of people recorded (14380). This small variance can be attributed to respondents incorrectly indicating the number of occupants per structure. For the purposes of this analysis the figures and population count reflected in Table 2 will be used, which confirms the population of Kosovo to be 14 380 people.
Enumeration Report: Kosovo Informal Settlement Pocket
24
Coverage of the enumeration and response rates
04
Households stated
Frequency count
PercentCumulative
percentHousehold
count
1 5 690 98,92 98,92 5 690
2 52 0,90 99,83 104
3 10 0,17 100 30
Total 5 752 100 5 824
Table 3: Total households for Kosovo derived from stated number of households
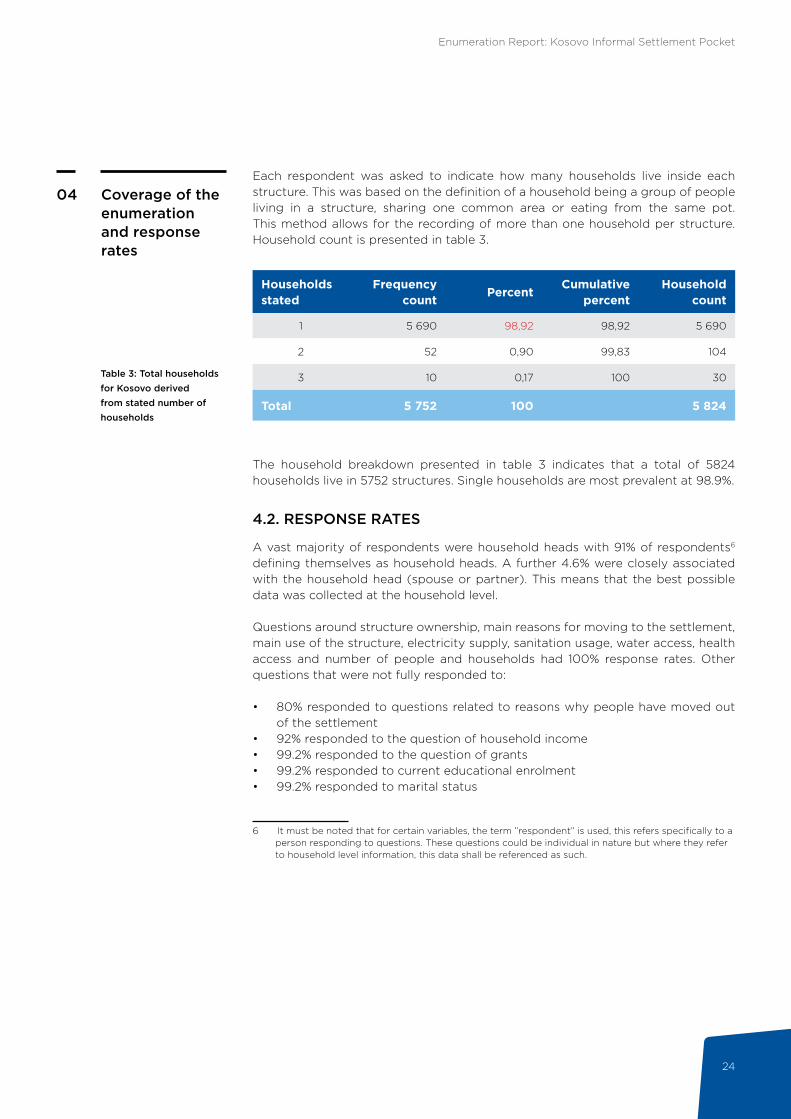
Each respondent was asked to indicate how many households live inside each structure. This was based on the definition of a household being a group of people living in a structure, sharing one common area or eating from the same pot. This method allows for the recording of more than one household per structure. Household count is presented in table 3.
The household breakdown presented in table 3 indicates that a total of 5824 households live in 5752 structures. Single households are most prevalent at 98.9%.
4.2. RESPONSE RATES
A vast majority of respondents were household heads with 91% of respondents6 defining themselves as household heads. A further 4.6% were closely associated with the household head (spouse or partner). This means that the best possible data was collected at the household level.
Questions around structure ownership, main reasons for moving to the settlement, main use of the structure, electricity supply, sanitation usage, water access, health access and number of people and households had 100% response rates. Other questions that were not fully responded to:
• 80% responded to questions related to reasons why people have moved out of the settlement
• 92% responded to the question of household income• 99.2% responded to the question of grants• 99.2% responded to current educational enrolment• 99.2% responded to marital status
6 It must be noted that for certain variables, the term ”respondent” is used, this refers specifically to a person responding to questions. These questions could be individual in nature but where they refer to household level information, this data shall be referenced as such.
Enumeration Report: Kosovo Informal Settlement Pocket
25
Summary findings
05
KOSOVO SUMMARY FINDINGS
Age of settlement Founded in 1999 (18 years old).
Types of structures Shacks built predominantly from zinc wood and plastic
Total land occupied 28.64 hectare
Population density 212 dwelling units per hectare
Population 14 380
Average household size 2.5
Total structures numbered 6110
Total structures enumerated 5752
Total Males 6655
Total Females 7553 (172 instances of gender not recorded)
Female household heads 42.2%
Total children under 18 years of age 4 708
Number of toilets 188
Toilet to people ratio 1:76
Toilet to household ratio 1:31
Number of taps 42
Tap to people ratio 1:342
Tap to household ratio 1:139
Electricity coverage 73% prepaid meters, 13% connection to neighbours meters and 14% no electricity
Unemployment rate 56% (expanded definition)
Main priorities Housing sanitation access and water access
Disasters experienced by residents Fires, flooding
South African residents 98,7%
Non-South African residents 1,3%
5. SUMMARY FINDINGS
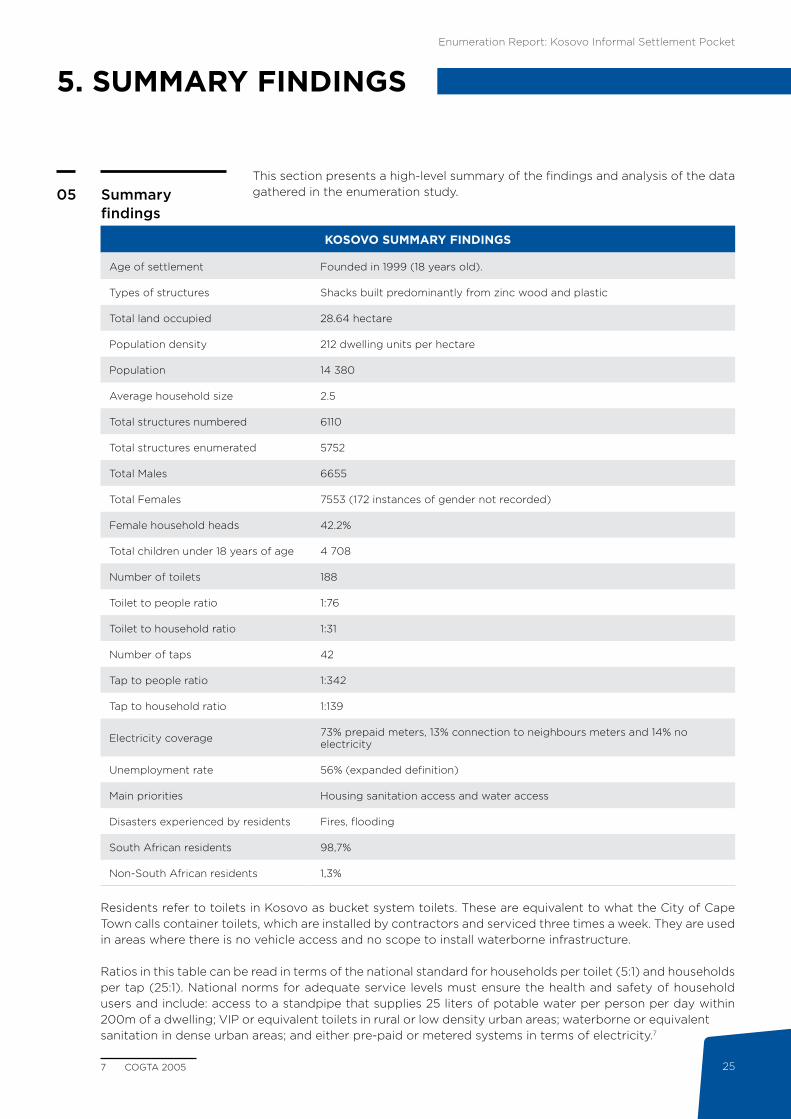
This section presents a high-level summary of the findings and analysis of the data gathered in the enumeration study.
Residents refer to toilets in Kosovo as bucket system toilets. These are equivalent to what the City of Cape Town calls container toilets, which are installed by contractors and serviced three times a week. They are used in areas where there is no vehicle access and no scope to install waterborne infrastructure.
Ratios in this table can be read in terms of the national standard for households per toilet (5:1) and households per tap (25:1). National norms for adequate service levels must ensure the health and safety of household users and include: access to a standpipe that supplies 25 liters of potable water per person per day within 200m of a dwelling; VIP or equivalent toilets in rural or low density urban areas; waterborne or equivalent sanitation in dense urban areas; and either pre-paid or metered systems in terms of electricity.7
7 COGTA 2005
Enumeration Report: Kosovo Informal Settlement Pocket
26
Analysis06
Figure 6: Percentage breakdown of structure ownership
0.6%2.4%
97%
97%Own the structure
0.6%Pay rent
2.4%Living rent free
6. ANALYSIS
This section comprises a detailed analysis of Kosovo’s enumeration data. The analysis begins with structure level data, followed by individual level data and concludes with data on priorities and migration.
The structure level analysis focuses on questions asked primarily of the main respondent (in the case of Kosovo, predominantly the household head). These questions ranged from structure and household level access to various basic services and ranking of priorities. This section also examines population demographics, access to services and concludes with potential housing subsidy qualifiers in the settlement.
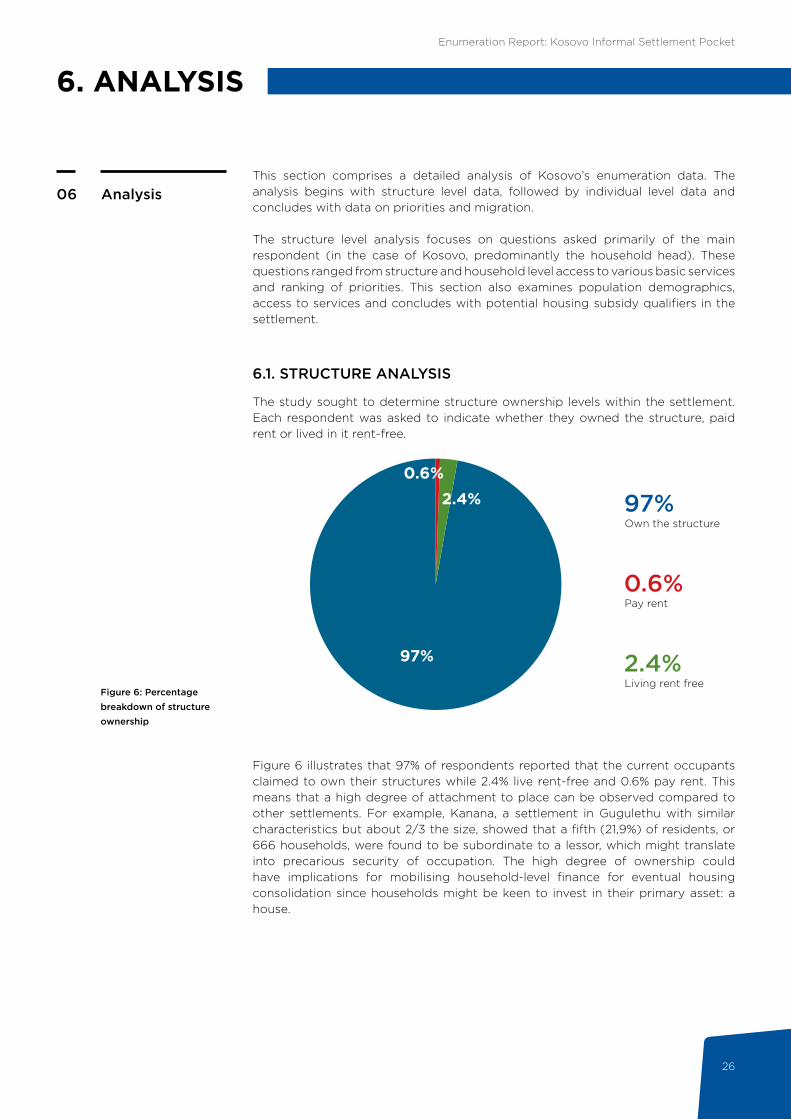
6.1. STRUCTURE ANALYSIS
The study sought to determine structure ownership levels within the settlement. Each respondent was asked to indicate whether they owned the structure, paid rent or lived in it rent-free.
Figure 6 illustrates that 97% of respondents reported that the current occupants claimed to own their structures while 2.4% live rent-free and 0.6% pay rent. This means that a high degree of attachment to place can be observed compared to other settlements. For example, Kanana, a settlement in Gugulethu with similar characteristics but about 2/3 the size, showed that a fifth (21,9%) of residents, or 666 households, were found to be subordinate to a lessor, which might translate into precarious security of occupation. The high degree of ownership could have implications for mobilising household-level finance for eventual housing consolidation since households might be keen to invest in their primary asset: a house.
Enumeration Report: Kosovo Informal Settlement Pocket
27
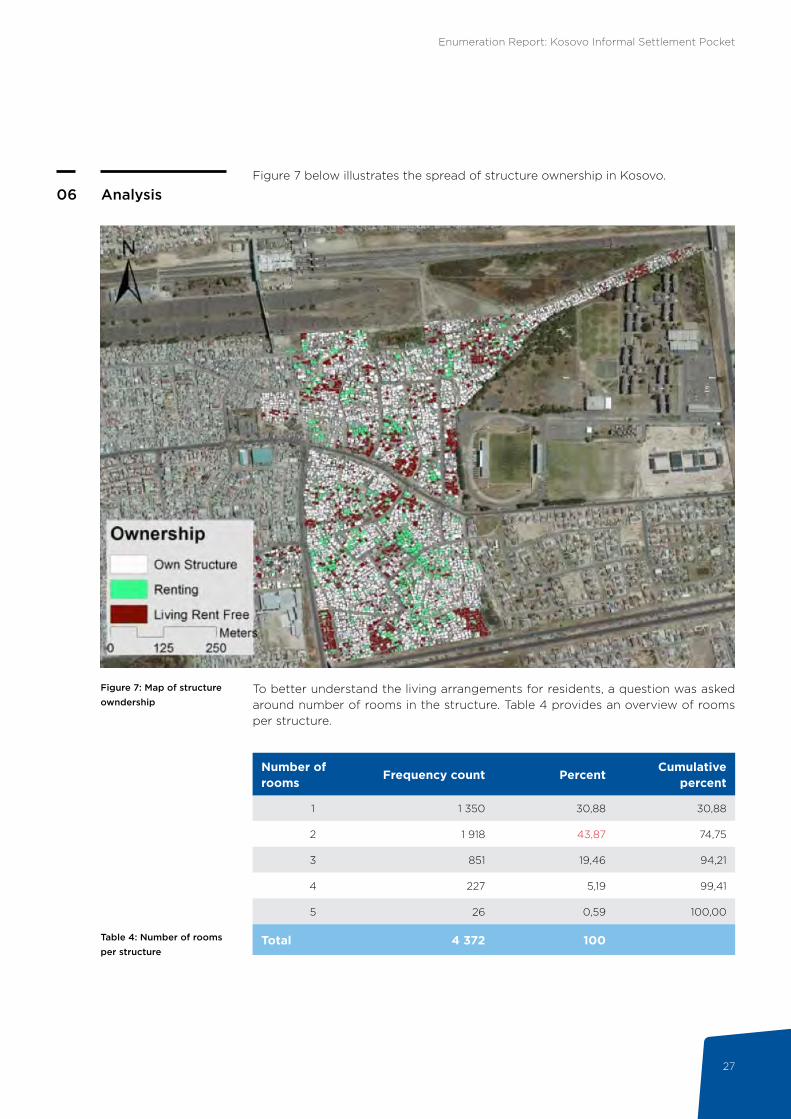
Analysis06Figure 7 below illustrates the spread of structure ownership in Kosovo.
Figure 7: Map of structure owndership
Table 4: Number of rooms per structure
Number of rooms
Frequency count PercentCumulative
percent
1 1 350 30,88 30,88
2 1 918 43,87 74,75
3 851 19,46 94,21
4 227 5,19 99,41
5 26 0,59 100,00
Total 4 372 100
To better understand the living arrangements for residents, a question was asked around number of rooms in the structure. Table 4 provides an overview of rooms per structure.
Enumeration Report: Kosovo Informal Settlement Pocket
28
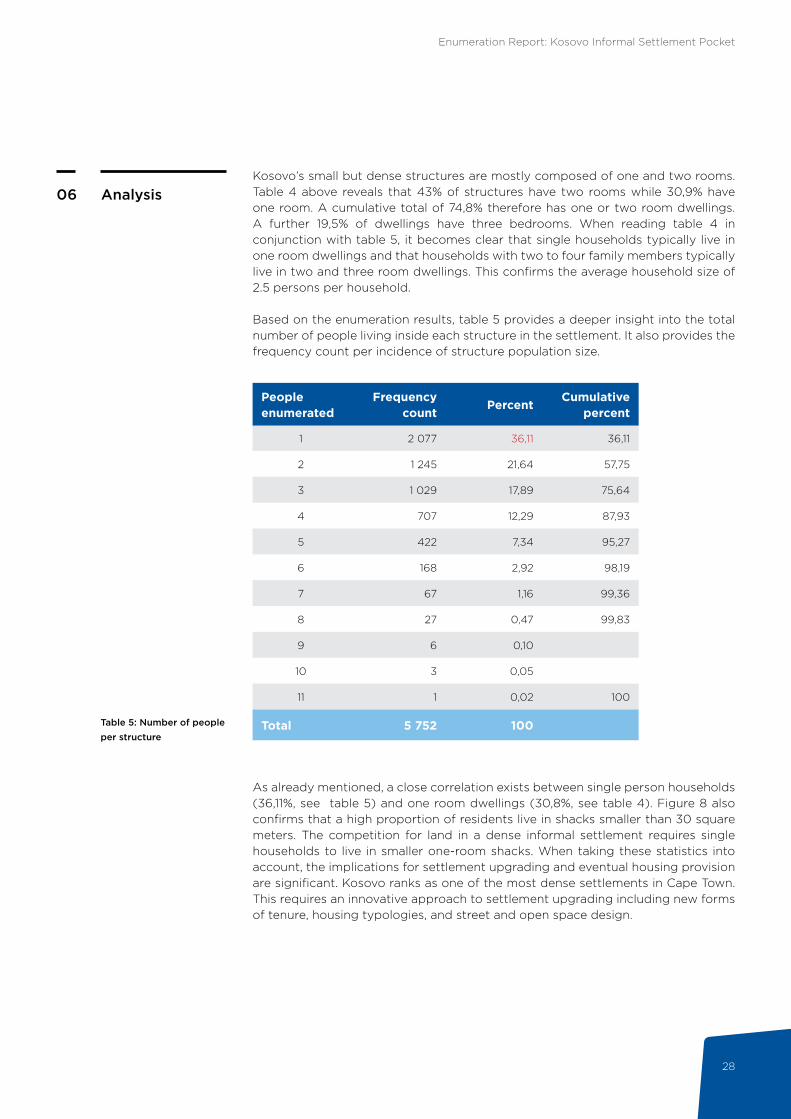
Analysis06Kosovo’s small but dense structures are mostly composed of one and two rooms. Table 4 above reveals that 43% of structures have two rooms while 30,9% have one room. A cumulative total of 74,8% therefore has one or two room dwellings. A further 19,5% of dwellings have three bedrooms. When reading table 4 in conjunction with table 5, it becomes clear that single households typically live in one room dwellings and that households with two to four family members typically live in two and three room dwellings. This confirms the average household size of 2.5 persons per household.
Based on the enumeration results, table 5 provides a deeper insight into the total number of people living inside each structure in the settlement. It also provides the frequency count per incidence of structure population size.
As already mentioned, a close correlation exists between single person households (36,11%, see table 5) and one room dwellings (30,8%, see table 4). Figure 8 also confirms that a high proportion of residents live in shacks smaller than 30 square meters. The competition for land in a dense informal settlement requires single households to live in smaller one-room shacks. When taking these statistics into account, the implications for settlement upgrading and eventual housing provision are significant. Kosovo ranks as one of the most dense settlements in Cape Town. This requires an innovative approach to settlement upgrading including new forms of tenure, housing typologies, and street and open space design.
Table 5: Number of people per structure
People enumerated
Frequency count
PercentCumulative
percent
1 2 077 36,11 36,11
2 1 245 21,64 57,75
3 1 029 17,89 75,64
4 707 12,29 87,93
5 422 7,34 95,27
6 168 2,92 98,19
7 67 1,16 99,36
8 27 0,47 99,83
9 6 0,10
10 3 0,05
11 1 0,02 100
Total 5 752 100
Enumeration Report: Kosovo Informal Settlement Pocket
29
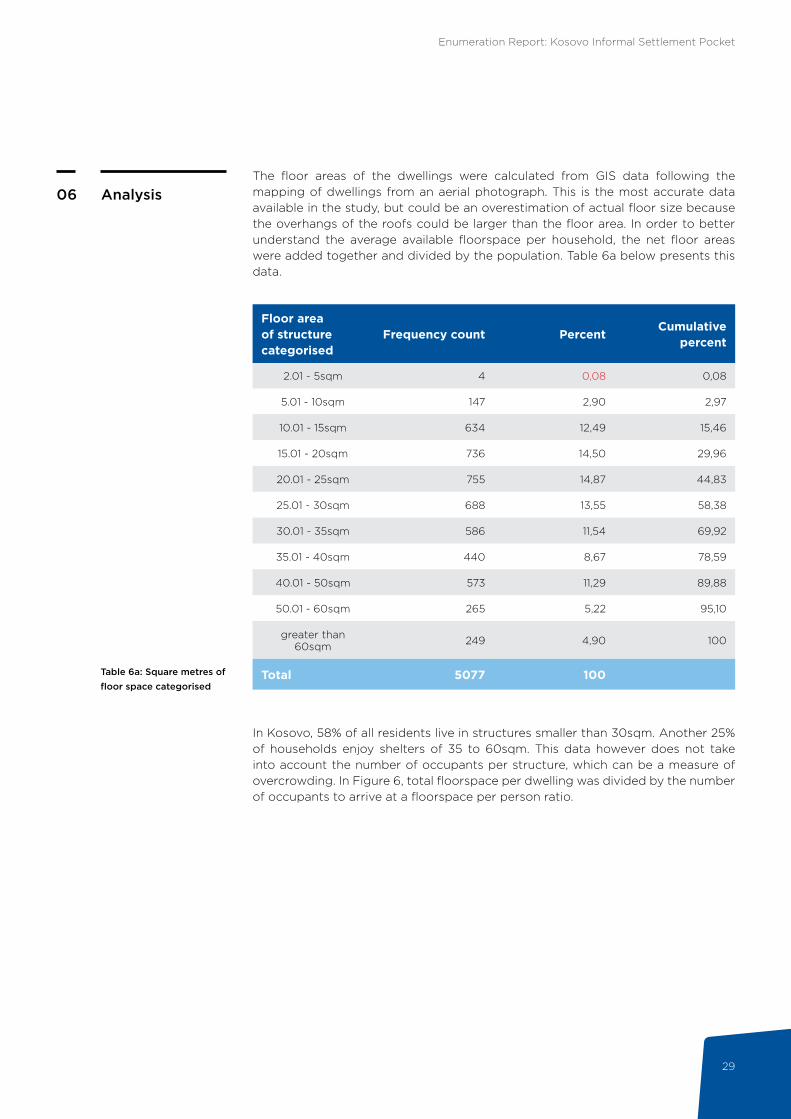
Analysis06The floor areas of the dwellings were calculated from GIS data following the mapping of dwellings from an aerial photograph. This is the most accurate data available in the study, but could be an overestimation of actual floor size because the overhangs of the roofs could be larger than the floor area. In order to better understand the average available floorspace per household, the net floor areas were added together and divided by the population. Table 6a below presents this data.
Floor area of structure categorised
Frequency count PercentCumulative
percent
2.01 - 5sqm 4 0,08 0,08
5.01 - 10sqm 147 2,90 2,97
10.01 - 15sqm 634 12,49 15,46
15.01 - 20sqm 736 14,50 29,96
20.01 - 25sqm 755 14,87 44,83
25.01 - 30sqm 688 13,55 58,38
30.01 - 35sqm 586 11,54 69,92
35.01 - 40sqm 440 8,67 78,59
40.01 - 50sqm 573 11,29 89,88
50.01 - 60sqm 265 5,22 95,10
greater than 60sqm 249 4,90 100
Total 5077 100
In Kosovo, 58% of all residents live in structures smaller than 30sqm. Another 25% of households enjoy shelters of 35 to 60sqm. This data however does not take into account the number of occupants per structure, which can be a measure of overcrowding. In Figure 6, total floorspace per dwelling was divided by the number of occupants to arrive at a floorspace per person ratio.
Table 6a: Square metres of floor space categorised
Enumeration Report: Kosovo Informal Settlement Pocket
30
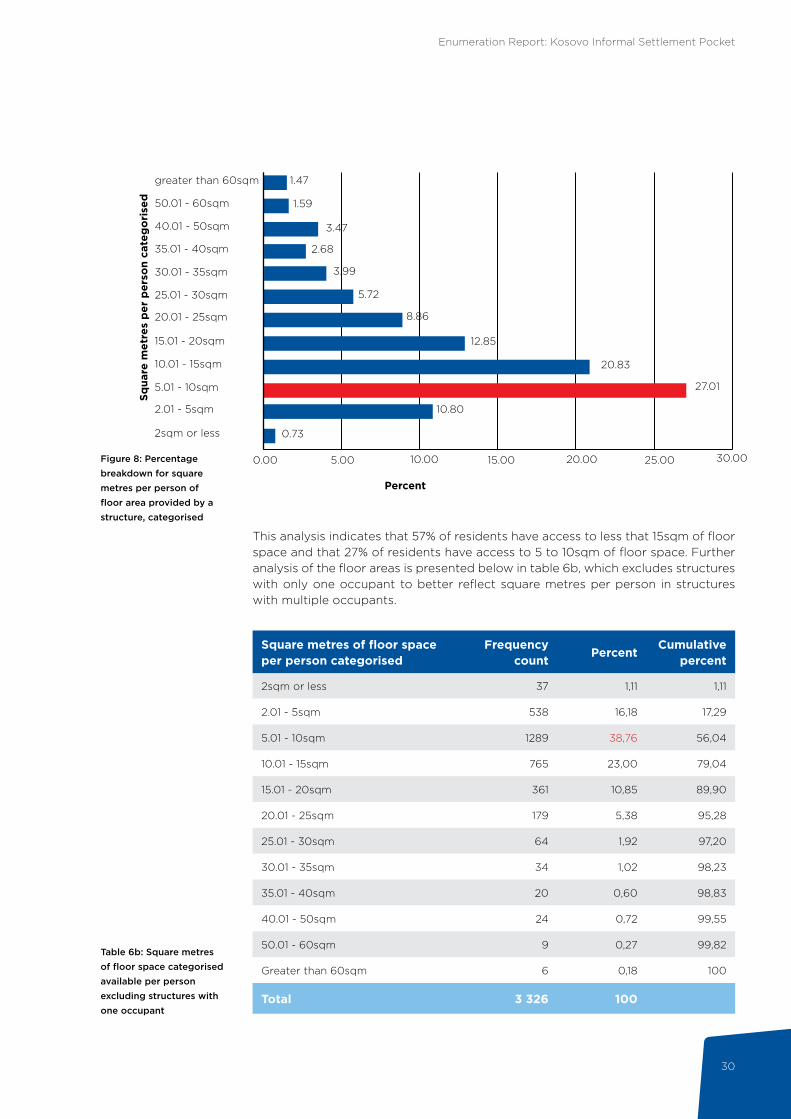
Figure 8: Percentage breakdown for square metres per person of floor area provided by a structure, categorised
30.000.00 5.00 15.0010.00 20.00 25.00
Percent
greater than 60sqm
50.01 - 60sqm
40.01 - 50sqm
35.01 - 40sqm
30.01 - 35sqm
25.01 - 30sqm
20.01 - 25sqm
15.01 - 20sqm
10.01 - 15sqm
5.01 - 10sqm
2.01 - 5sqm
2sqm or less
Squa
re m
etre
s p
er p
erso
n ca
teg
ori
sed
1.47
1.59
3.47
2.68
3.99
5.72
8.86
12.85
20.83
27.01
10.80
0.73
This analysis indicates that 57% of residents have access to less that 15sqm of floor space and that 27% of residents have access to 5 to 10sqm of floor space. Further analysis of the floor areas is presented below in table 6b, which excludes structures with only one occupant to better reflect square metres per person in structures with multiple occupants.
Square metres of floor space per person categorised
Frequency count
PercentCumulative
percent
2sqm or less 37 1,11 1,11
2.01 - 5sqm 538 16,18 17,29
5.01 - 10sqm 1289 38,76 56,04
10.01 - 15sqm 765 23,00 79,04
15.01 - 20sqm 361 10,85 89,90
20.01 - 25sqm 179 5,38 95,28
25.01 - 30sqm 64 1,92 97,20
30.01 - 35sqm 34 1,02 98,23
35.01 - 40sqm 20 0,60 98,83
40.01 - 50sqm 24 0,72 99,55
50.01 - 60sqm 9 0,27 99,82
Greater than 60sqm 6 0,18 100
Total 3 326 100
Table 6b: Square metres of floor space categorised available per person excluding structures with one occupant
Enumeration Report: Kosovo Informal Settlement Pocket
31
Analysis06When the total floor space of a dwelling is divided by the number of occupants, the majority (79%) of all residents excluding single person households have about 5 to 15 sqm to themselves. Earlier it was established that single households tend to live in small (less than 10 square meter) one-room dwellings. Table 6 illustrates that this trend also applies to the bulk of two and three person households, since the highest proportion of residents (38,7%) has access to 5-10 square metres. The concentration of small shacks separated by informal roads and footpaths should be considered for any future settlement upgrade and eventual housing consolidation.
Respondents were asked about the main use of their structure. Where they indicated uses other than residential, this was recorded in the database but is not reflected in this analysis. Table 7 provides the breakdown of structure use.
Structure main useFrequency
countPercent
Residential only 5277 94,10
Residential and Other 331 5,90
Total 5608 100Table 7: Main use of structures
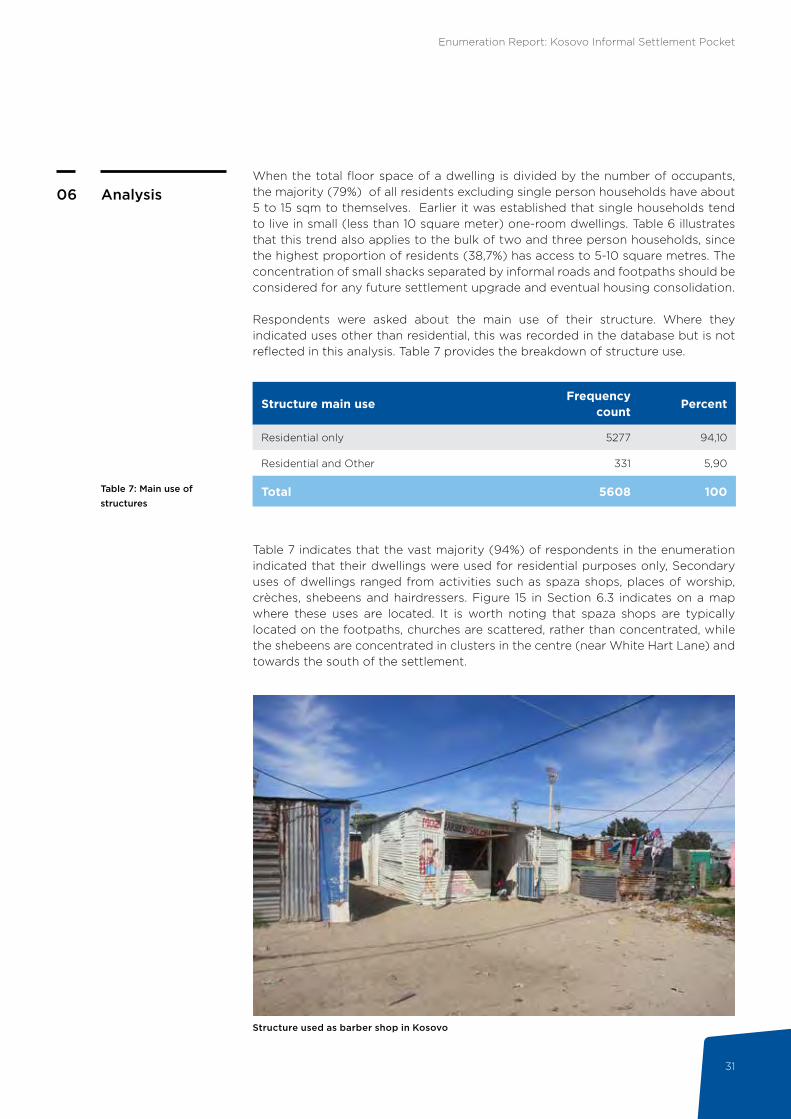
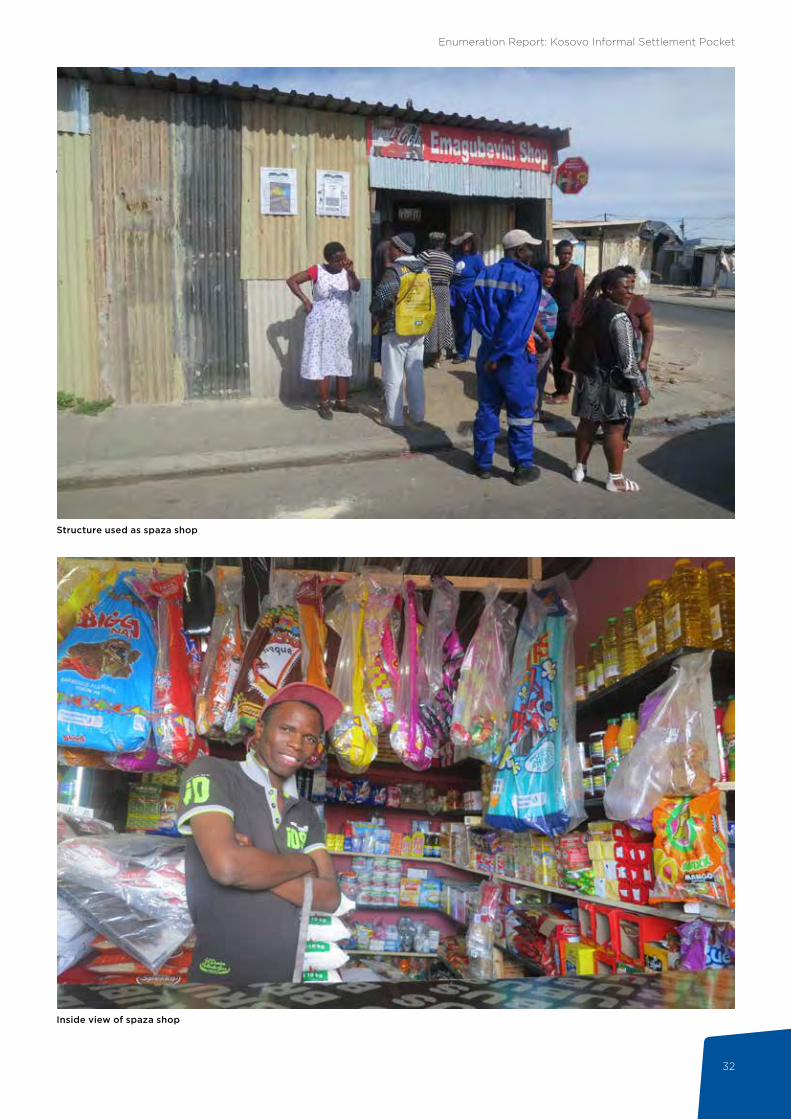
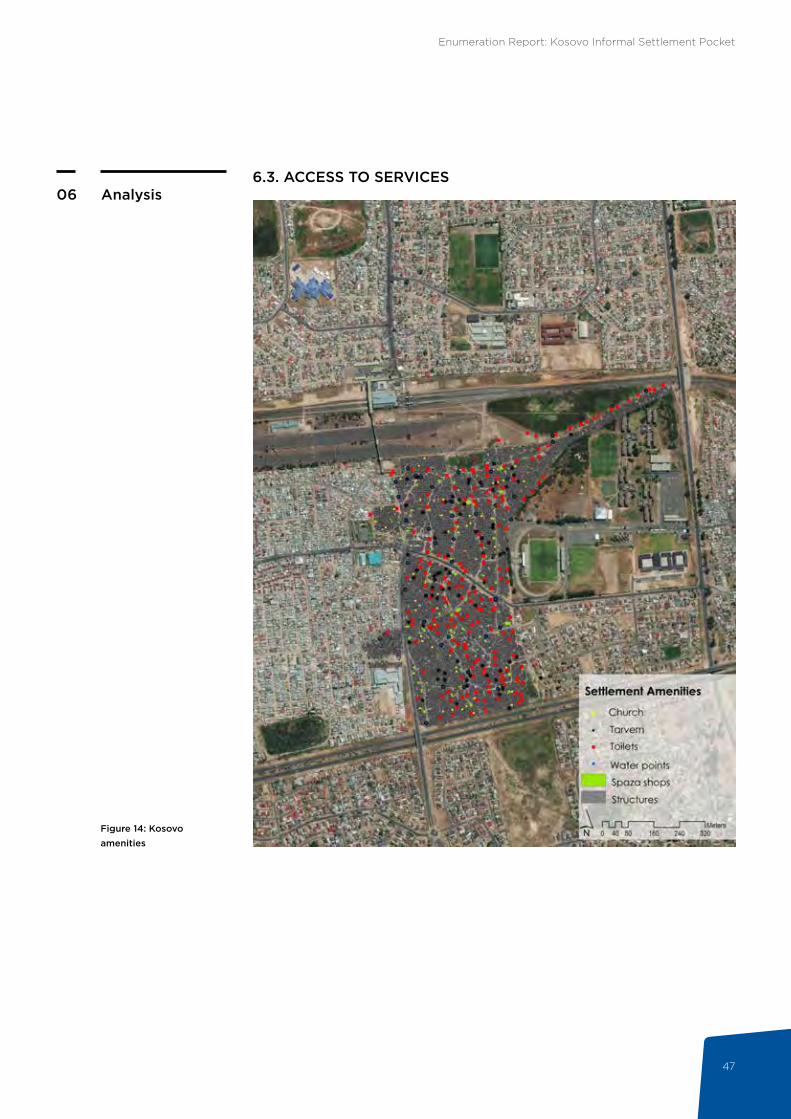
Table 7 indicates that the vast majority (94%) of respondents in the enumeration indicated that their dwellings were used for residential purposes only, Secondary uses of dwellings ranged from activities such as spaza shops, places of worship, crèches, shebeens and hairdressers. Figure 15 in Section 6.3 indicates on a map where these uses are located. It is worth noting that spaza shops are typically located on the footpaths, churches are scattered, rather than concentrated, while the shebeens are concentrated in clusters in the centre (near White Hart Lane) and towards the south of the settlement.
Structure used as barber shop in Kosovo
Enumeration Report: Kosovo Informal Settlement Pocket
32
Structure used as spaza shop
Inside view of spaza shop
Enumeration Report: Kosovo Informal Settlement Pocket
33
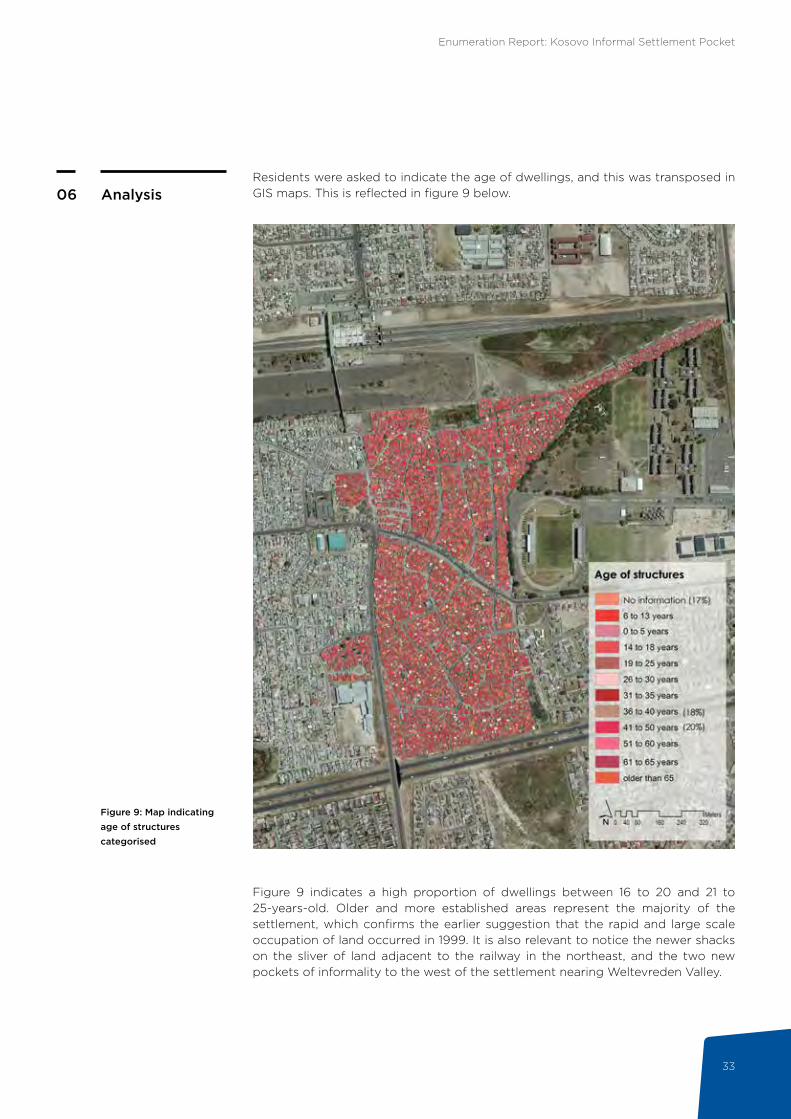
Analysis06Residents were asked to indicate the age of dwellings, and this was transposed in GIS maps. This is reflected in figure 9 below.
Figure 9: Map indicating age of structures categorised
Figure 9 indicates a high proportion of dwellings between 16 to 20 and 21 to 25-years-old. Older and more established areas represent the majority of the settlement, which confirms the earlier suggestion that the rapid and large scale occupation of land occurred in 1999. It is also relevant to notice the newer shacks on the sliver of land adjacent to the railway in the northeast, and the two new pockets of informality to the west of the settlement nearing Weltevreden Valley.

Enumeration Report: Kosovo Informal Settlement Pocket
34
Analysis06
Figure 10: Age distribution of Kosovo population
6.2. DEMOGRAPHICS OF KOSOVO POPULATION
6.2.1. Age distributionIn Figure 10 below, the split of age groups in Kosovo is presented
The two largest age groups are 31 to 40 years old (24,9%) and 19 to 30 years old (24,4%). A possible understanding of this data can be gained by deducing that the original occupants of the settlement in 1999 were probably youngsters (18-25-year-olds), who are now entering middle age (30-40-yearolds). The age group 41 to 65 years old makes up 15,6% of the population, who were most probably the parents of the first occupants. Kosovo can therefore be characterised as a settlement of young people who are now entering middle age. The high proportion of 6 to 13 year olds (16,3%) is another indication that the community is reaching stability in terms of nucleus family structure.
0.00
5.00
10.00
15.00
20.00
25.00
30.00
0 to 5 years
6 to 13 years
14 to 18 years
19 to 30 years
31 to 40 years
41 to 65 years
older than 65
Age categories
Per
cent
11.36
16.27
6.86
24.44 24.89
15.63
0.55
People of varying ages on a street in Kosovo
Enumeration Report: Kosovo Informal Settlement Pocket
35
Age CategoriesFrequency
countPercent
Cumulative percent
6 to 13 years 2 0,10 0,10
14 to 18 years 24 1,19 1,29
19 to 25 years 308 15,26 16,55
26 to 30 years 409 20,27 36,82
31 to 35 years 435 21,56 58,37
36 to 40 years 334 16,55 74,93
41 to 50 years 371 18,38 93,31
51 to 60 years 92 4,56 97,87
61 to 65 years 21 1,04 98,91
older than 65 years 22 1,09 100
Total 2018 100
Analysis06
Table 8: Age distribution of single person households
Table 9: Employment status by gender for Kosovo residents aged 19 to 30 years
In Table 8, the age split of single person households is presented. The data confirms that 58% of single person households are younger than 35 years old. The largest age grouping of households larger than one person is 31 to 35 year olds (21,6%).
6.2.1.1 A profile of youthThis section provides a profile of youth in Kosovo (aged 19 to 30) and unpacks characteristics related to employment status, gender breakdown and income. Table 9 summarises the gender break down and employment status for this youth cohort.
When continuing to investigate the dynamics of a predominantly middle aged community in Kosovo, Table 9 shows that 68% of youth (19 – 30 years), who makes up 24% of the settlement population, are unemployed. Women are particularly vulnerable to the shocks related to low incomes, since 62% of the unemployed youth are females. Table 10 analyses the income distribution of youth aged 19 to 30 years old.
Employment status Male Female Total
Employed 606 320 926
Self-employed 55 30 85
Unemployed 843 1362 2205
Total 1 504 1 712 3216
Gender
Table 8 provides further insight into the age distribution of single person households.

Enumeration Report: Kosovo Informal Settlement Pocket
36
Analysis06
Table 10: Income distribution for age cohort 19 to 30-years-old
Figure 11: Gender breakdown
46.8453.16%
53.16%
46.84%
Female
Male
Table 10 shows that 78% of the working youth aged 19 – 30 years old earn less than R1500 per month, that 19% earn between R1501 and R3500 and that 47% of youth earn no income at all. A young population, high unemployment, and precarious livelihoods create conditions of high vulnerability, especially for women. In other circumstances, this could be an opportunity for entrepreneurial activity, but only 3% of working youth are reported to be self-employed.
6.2.2. Gender breakdownThe enumeration covered a broad spectrum of demographic data. 53 out of every 100 people are women as Figure 11 indicates.
Income categories
Frequency count PercentCumulative
percent
No Income 927 46,72 46,72
R1 - R400 124 6,25 52,97
R401 - R800 118 5,95 58,92
R801 - R1500 377 19,00 77,92
R1501 - R3500 386 19,46 97,38
R3501 - R7500 52 2,62 100
Total 1984 100
Enumeration Report: Kosovo Informal Settlement Pocket
37
Analysis06
Table 11: Number of people enumerated per structure by gender of household heads (column percentages)
Table 12: Employment status by gender for respondents 16 years & older (row percentages)
Table 11 provides a gender split by household size.
Women are the least economically active and a high prevalence of unemployment (62%) is observable. Of all respondents who identified their status as “employed”, 63% were males and 37% were females. It also appears that men and women equally make up the few self-employed people.
Number of people enumerated per structure
Employment status Male (%) Female (%) Total
1 41,39 22,45 33,33
2 18,86 25,35 21,69
3 14,98 22,41 1,81
4 11,87 15,03 13,25
5 7,58 8,79 8,09
6 3,17 3,71 3,37
7 1,35 1,33 1,33
8 0,62 0,69 0,64
9 0,12 0,16 0,13
10 0,03 0,08 0,05
11 0,03 0 0,02
Total 100 100 100
n=5943
Gender
Employment status 16 years and older
Male Female Total
Employed 63,10 36,90 100
Self-employed 52,14 47,86 100
Unemployed 37,91 62,09 100
Total 48,54 51,46 100
n=9295
Gender
Single person households are predominantly male, while females make up the majority of two and three person households. The proportion of female-headed households is relatively low at 22,5% for single person households.
In table 9 the employment status of people between 19 and 30 was presented. Table 12 takes a wider account of settlement dynamics related to employment.
Enumeration Report: Kosovo Informal Settlement Pocket
38
Analysis06
Table 13: Age categorised by school enrolment for individuals aged 0 to 18-years-old
COMMUNITY VOICES
“The children are going to school but in my section I have a problem with kids. There are parents that are single parents that are not working. There are children that are not at school because of hunger. We found out that if the children are hungry they even drink beer. Then they grow up with no education.”
6.2.3. Education enrolment and school attendance
Age categorised
Pre-school
Primary school
Secondary school
College UniversityNot
in any school
Don’t know
Total
0 to 5 years 637 59 0 0 0 853 2 1 551
6 to 13 years 186 1 852 92 0 2 81 4 2 217
14 to 18 years 0 204 646 6 2 79 2 939
Total 823 2 115 738 6 4 1 013 8 4 707
In keeping with the young age profile of Kosovo residents, it is not surprising that the majority of children are currently enrolled in primary school. Indeed, 45% of children attend primary schools followed by pre-school at 17%. Perhaps the most concerning trend is that 21% of potential school attendees do not attend any school, while college and university attendance is extremely low. Table 13 provides a cross tabulation of school going age by enrolment.
An analysis of the neighbourhoods where children attend school reveals that 54% are enrolled in the Philippi area. Many children (7%) also attend school in Mitchells Plain. There is also a high proportion (18%) of children who attend school outside of Cape Town.
Children in Kosovo, during a free afternoon
Enumeration Report: Kosovo Informal Settlement Pocket
39
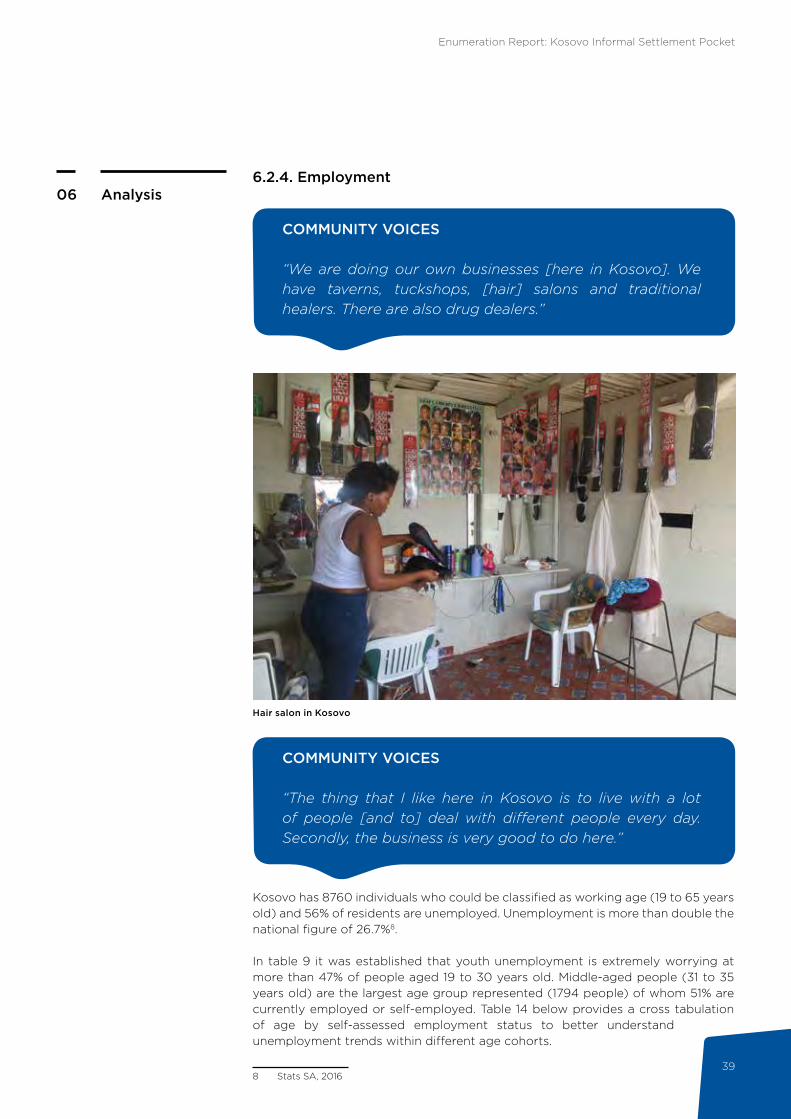
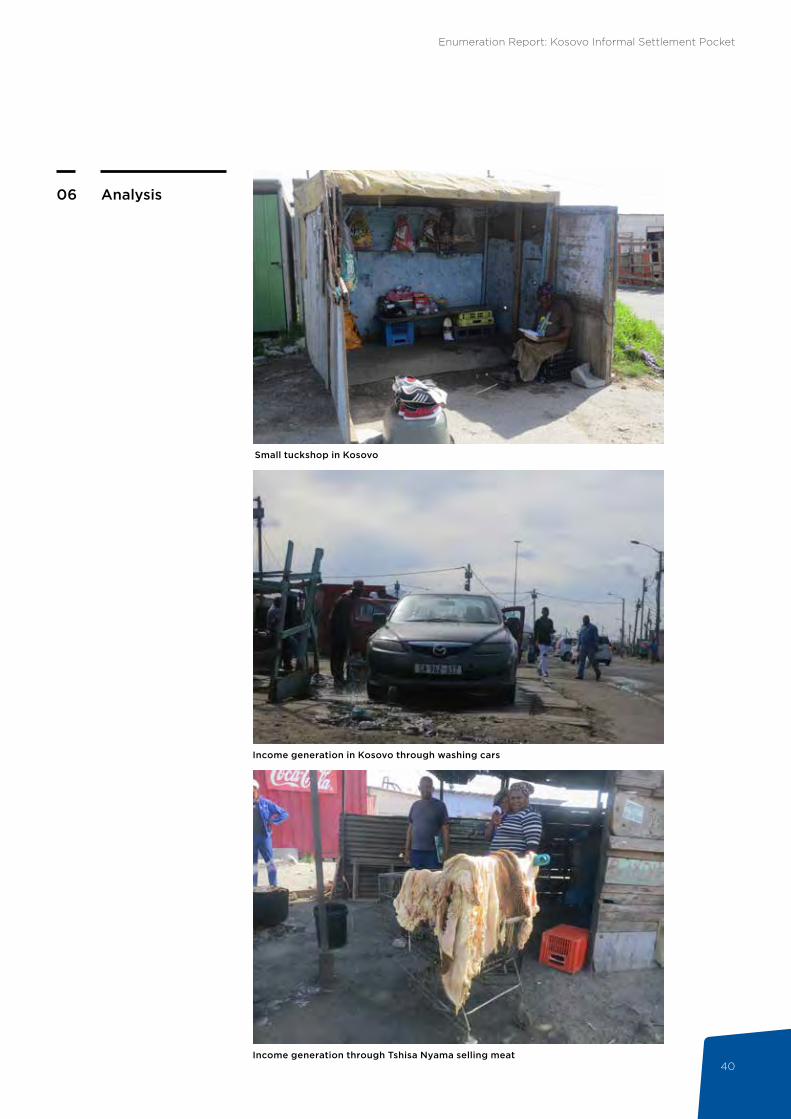
Analysis066.2.4. Employment
COMMUNITY VOICES
“We are doing our own businesses [here in Kosovo]. We have taverns, tuckshops, [hair] salons and traditional healers. There are also drug dealers.”
COMMUNITY VOICES
“The thing that I like here in Kosovo is to live with a lot of people [and to] deal with different people every day. Secondly, the business is very good to do here.”
Kosovo has 8760 individuals who could be classified as working age (19 to 65 years old) and 56% of residents are unemployed. Unemployment is more than double the national figure of 26.7%8.
In table 9 it was established that youth unemployment is extremely worrying at more than 47% of people aged 19 to 30 years old. Middle-aged people (31 to 35 years old) are the largest age group represented (1794 people) of whom 51% are currently employed or self-employed. Table 14 below provides a cross tabulation of age by self-assessed employment status to better understand unemployment trends within different age cohorts.
8 Stats SA, 2016
Hair salon in Kosovo
Enumeration Report: Kosovo Informal Settlement Pocket
40
Small tuckshop in Kosovo
Income generation in Kosovo through washing cars
Income generation through Tshisa Nyama selling meat
Analysis06

Enumeration Report: Kosovo Informal Settlement Pocket
41
Table 14: Age by employment status (row frequencies & percentages)
Age categories EmployedSelf-
employedUn-
employedTotal
14 to 18 years 4 2 461 467
Row % 0,86 0 98,72 100
19 to 25 years 278 22 1 415 1 715
Row % 16,21 1,28 82,51 100
26 to 30 years 655 63 799 1 517
Row % 43,18 4,15 52,67 100
31 to 35 years 904 77 813 1 794
Row % 50,39 4,29 45,32 100
36 to 40 years 816 95 690 1 601
Row % 50,97 5,93 43,10 100
41 to 50 years 873 107 681 1 661
Row % 52,56 6,44 41,00 100
51 to 60 years 165 26 212 403
Row % 40,94 6,45 52,61 100
61 to 65 years 10 4 55 69
Row % 14,49 6 79,71 100
Total 3 705 396 5 126 9 227
Row % 40,15 4,29 55,55 100
Analysis06
Table 14 indicates that 82% of youth (19 to 25 years old) who make up the second largest age group (1715 people), are unemployed. The data below shows, quite worryingly, that those younger than 30-years-old are much less economically active than 31 – 60 year olds, who record average employment rates of more than 55%. Table 12 above provided a cross tabulation of employment status by gender but looking at row percentages allowing for comparison between different employment statuses. Table 15 provides the same cross tabulation but with column percentages allowing for a deeper comparison between genders with regards to employment status.
Enumeration Report: Kosovo Informal Settlement Pocket
42
Analysis06
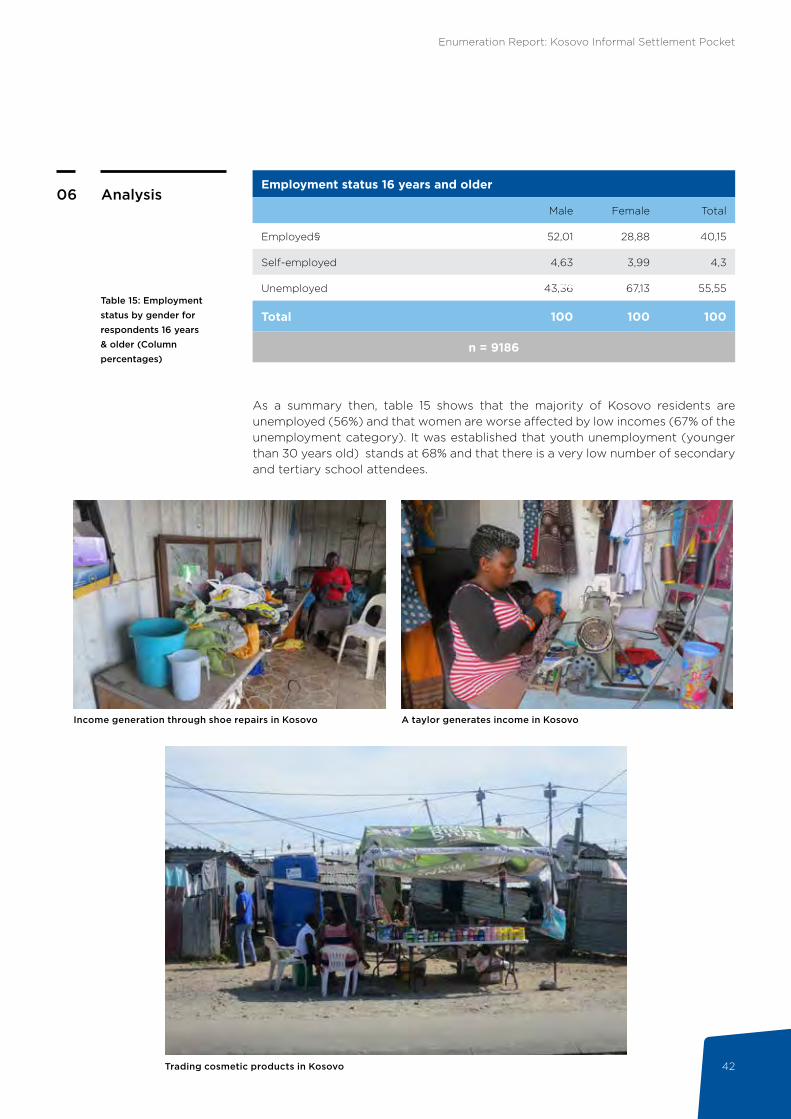
Table 15: Employment status by gender for respondents 16 years & older (Column percentages)
Employment status 16 years and older
Male Female Total
Employed§ 52,01 28,88 40,15
Self-employed 4,63 3,99 4,3
Unemployed 43,36 67,13 55,55
Total 100 100 100
n = 9186
Gender
As a summary then, table 15 shows that the majority of Kosovo residents are unemployed (56%) and that women are worse affected by low incomes (67% of the unemployment category). It was established that youth unemployment (younger than 30 years old) stands at 68% and that there is a very low number of secondary and tertiary school attendees.
Income generation through shoe repairs in Kosovo A taylor generates income in Kosovo
Trading cosmetic products in Kosovo
Enumeration Report: Kosovo Informal Settlement Pocket
43
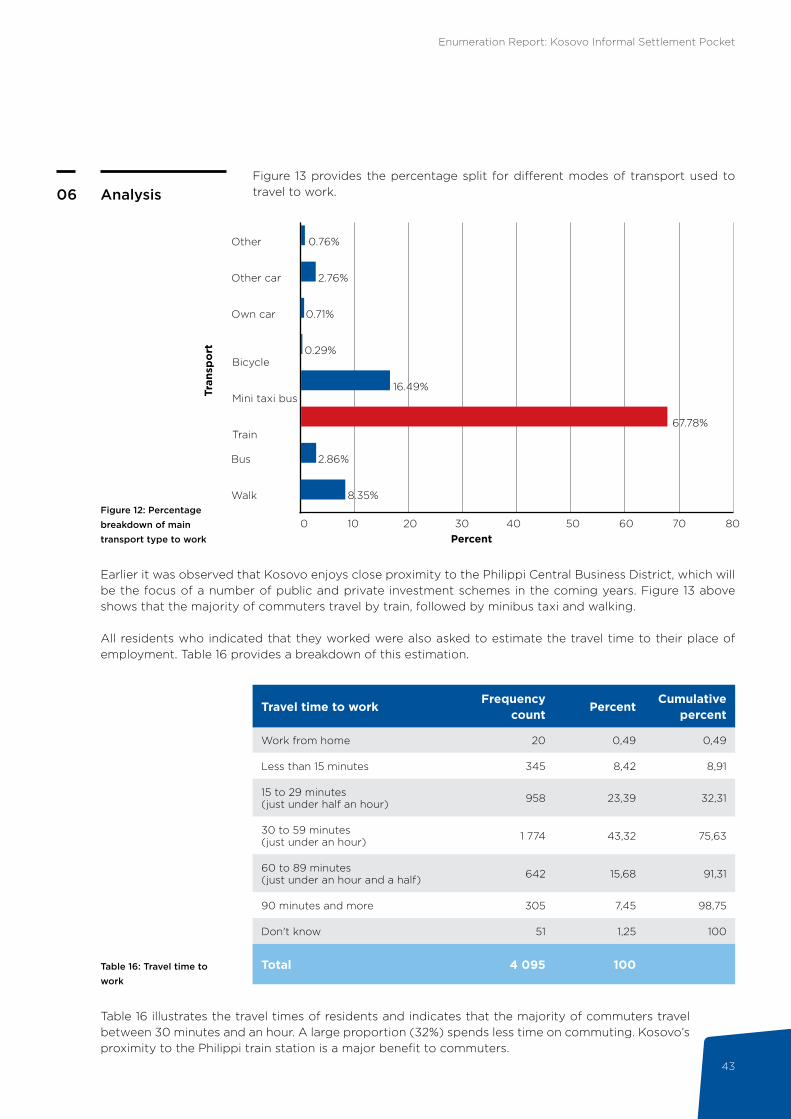
Analysis06Figure 13 provides the percentage split for different modes of transport used to travel to work.
Figure 12: Percentage breakdown of main transport type to work
Bicycle
Mini taxi bus
Train
Tran
spo
rt
Other 0.76%
2.76%
0.71%
0.29%
16.49%
2.86%
8.35%
67.78%
Percent
Other car
Own car
Bus
Walk
0 10 20 30 40 50 60 70 80
Earlier it was observed that Kosovo enjoys close proximity to the Philippi Central Business District, which will be the focus of a number of public and private investment schemes in the coming years. Figure 13 above shows that the majority of commuters travel by train, followed by minibus taxi and walking.
All residents who indicated that they worked were also asked to estimate the travel time to their place of employment. Table 16 provides a breakdown of this estimation.
Travel time to workFrequency
countPercent
Cumulative percent
Work from home 20 0,49 0,49
Less than 15 minutes 345 8,42 8,91
15 to 29 minutes (just under half an hour) 958 23,39 32,31
30 to 59 minutes (just under an hour) 1 774 43,32 75,63
60 to 89 minutes (just under an hour and a half) 642 15,68 91,31
90 minutes and more 305 7,45 98,75
Don't know 51 1,25 100
Total 4 095 100 Table 16: Travel time to work
Table 16 illustrates the travel times of residents and indicates that the majority of commuters travel between 30 minutes and an hour. A large proportion (32%) spends less time on commuting. Kosovo’s proximity to the Philippi train station is a major benefit to commuters.
Enumeration Report: Kosovo Informal Settlement Pocket
44
Analysis06
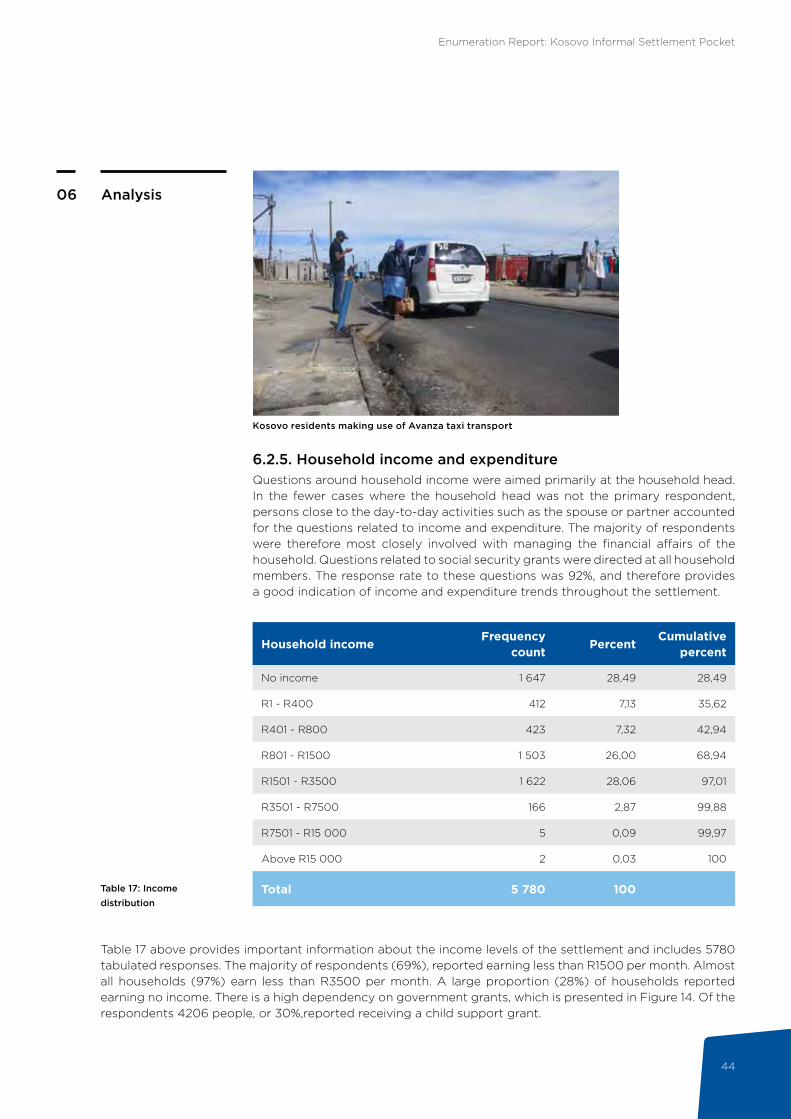
6.2.5. Household income and expenditureQuestions around household income were aimed primarily at the household head. In the fewer cases where the household head was not the primary respondent, persons close to the day-to-day activities such as the spouse or partner accounted for the questions related to income and expenditure. The majority of respondents were therefore most closely involved with managing the financial affairs of the household. Questions related to social security grants were directed at all household members. The response rate to these questions was 92%, and therefore provides a good indication of income and expenditure trends throughout the settlement.
Kosovo residents making use of Avanza taxi transport
Household incomeFrequency
countPercent
Cumulative percent
No income 1 647 28,49 28,49
R1 - R400 412 7,13 35,62
R401 - R800 423 7,32 42,94
R801 - R1500 1 503 26,00 68,94
R1501 - R3500 1 622 28,06 97,01
R3501 - R7500 166 2,87 99,88
R7501 - R15 000 5 0,09 99,97
Above R15 000 2 0,03 100
Total 5 780 100 Table 17: Income distribution
Table 17 above provides important information about the income levels of the settlement and includes 5780 tabulated responses. The majority of respondents (69%), reported earning less than R1500 per month. Almost all households (97%) earn less than R3500 per month. A large proportion (28%) of households reported earning no income. There is a high dependency on government grants, which is presented in Figure 14. Of the respondents 4206 people, or 30%,reported receiving a child support grant.
Enumeration Report: Kosovo Informal Settlement Pocket
45
Analysis06
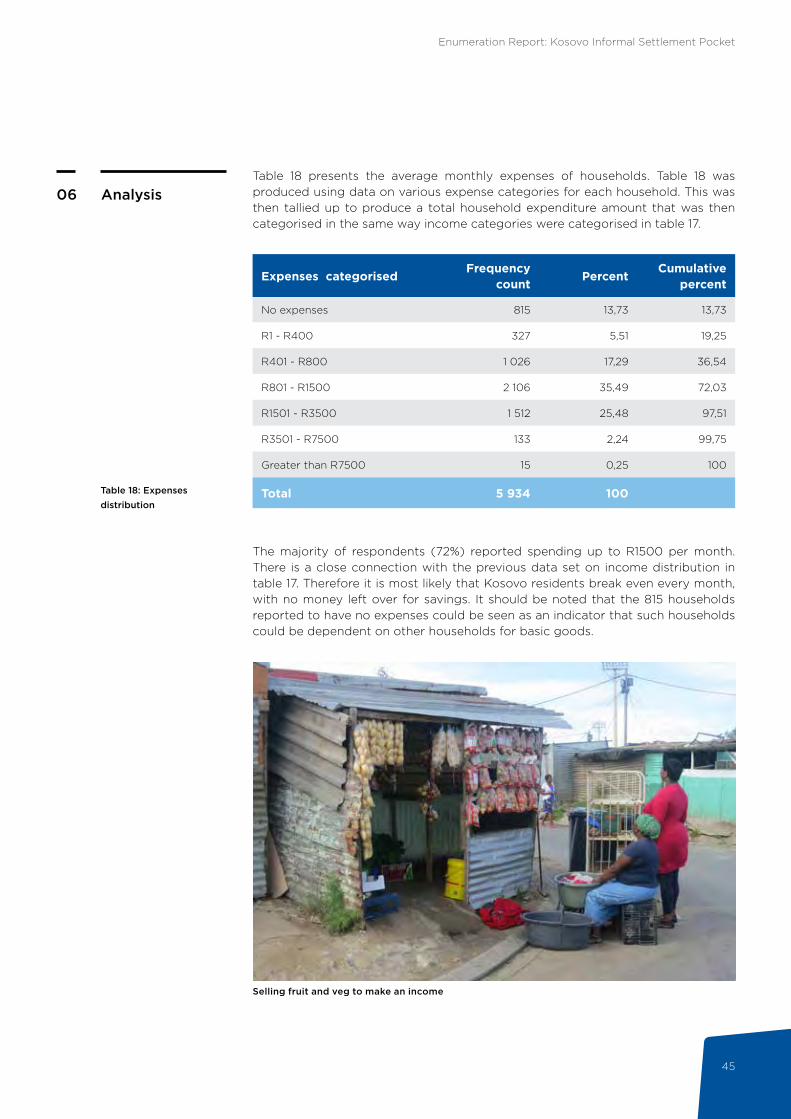
Table 18: Expenses distribution
Expenses categorisedFrequency
countPercent
Cumulative percent
No expenses 815 13,73 13,73
R1 - R400 327 5,51 19,25
R401 - R800 1 026 17,29 36,54
R801 - R1500 2 106 35,49 72,03
R1501 - R3500 1 512 25,48 97,51
R3501 - R7500 133 2,24 99,75
Greater than R7500 15 0,25 100
Total 5 934 100
The majority of respondents (72%) reported spending up to R1500 per month. There is a close connection with the previous data set on income distribution in table 17. Therefore it is most likely that Kosovo residents break even every month, with no money left over for savings. It should be noted that the 815 households reported to have no expenses could be seen as an indicator that such households could be dependent on other households for basic goods.
Table 18 presents the average monthly expenses of households. Table 18 was produced using data on various expense categories for each household. This was then tallied up to produce a total household expenditure amount that was then categorised in the same way income categories were categorised in table 17.
Selling fruit and veg to make an income
Enumeration Report: Kosovo Informal Settlement Pocket
46
Analysis06
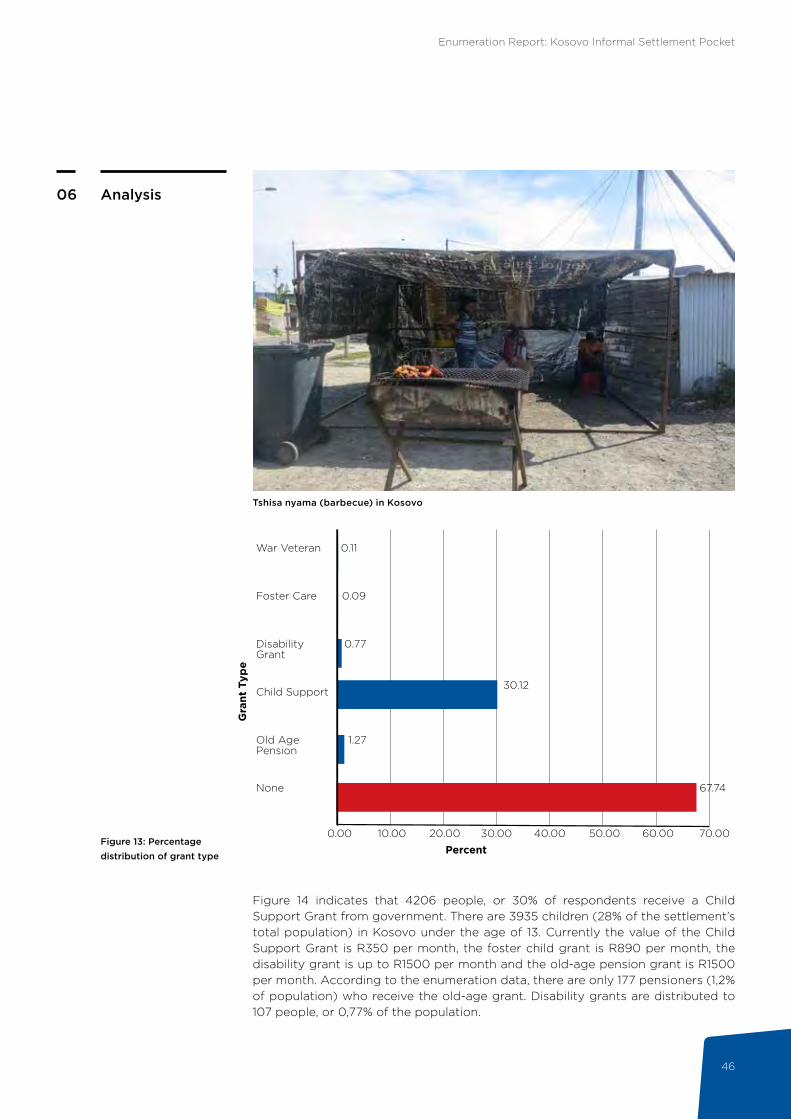
Figure 13: Percentage distribution of grant type
67.74
50.00 60.00 70.00
Percent0.00
None
Old Age Pension
Child Support
Gra
nt T
ype
Disability Grant
Foster Care
War Veteran
10.00
0.09
0.11
0.77
30.12
1.27
20.00 30.00 40.00
Figure 14 indicates that 4206 people, or 30% of respondents receive a Child Support Grant from government. There are 3935 children (28% of the settlement’s total population) in Kosovo under the age of 13. Currently the value of the Child Support Grant is R350 per month, the foster child grant is R890 per month, the disability grant is up to R1500 per month and the old-age pension grant is R1500 per month. According to the enumeration data, there are only 177 pensioners (1,2% of population) who receive the old-age grant. Disability grants are distributed to 107 people, or 0,77% of the population.
Tshisa nyama (barbecue) in Kosovo
Enumeration Report: Kosovo Informal Settlement Pocket
47
Analysis06
Figure 14: Kosovo amenities
6.3. ACCESS TO SERVICES
Enumeration Report: Kosovo Informal Settlement Pocket
48
Analysis06
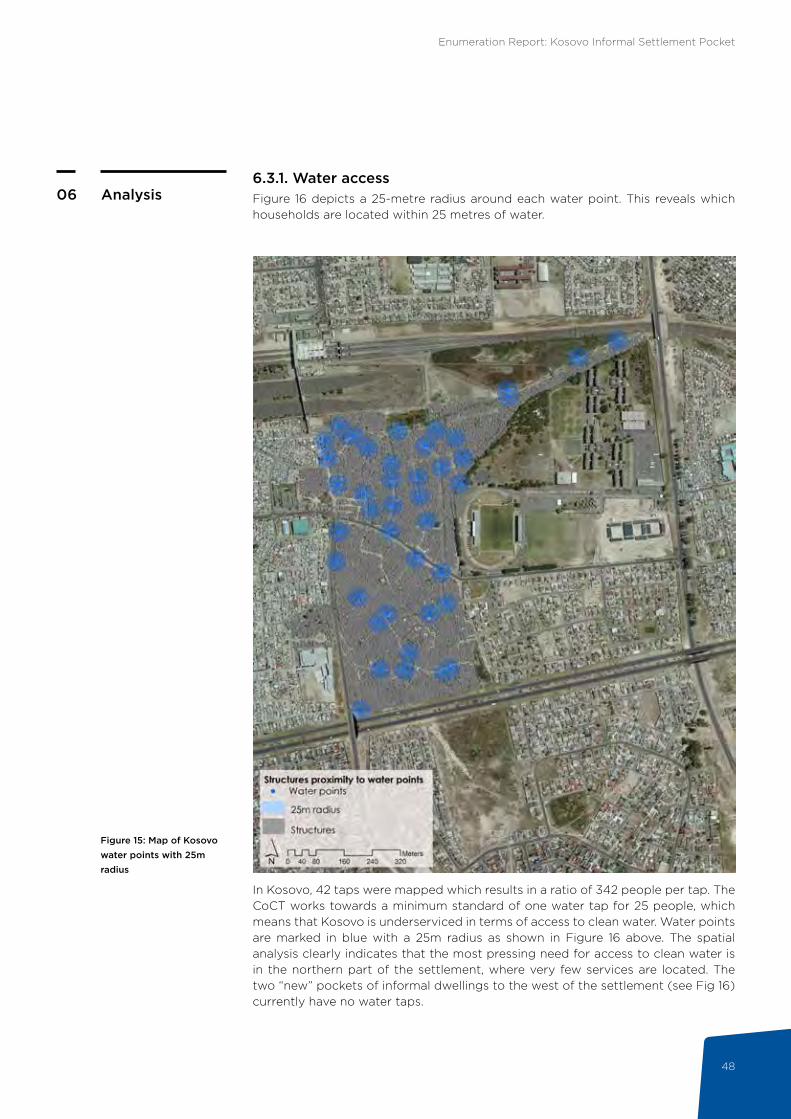
Figure 15: Map of Kosovo water points with 25m radius
6.3.1. Water accessFigure 16 depicts a 25-metre radius around each water point. This reveals which households are located within 25 metres of water.
In Kosovo, 42 taps were mapped which results in a ratio of 342 people per tap. The CoCT works towards a minimum standard of one water tap for 25 people, which means that Kosovo is underserviced in terms of access to clean water. Water points are marked in blue with a 25m radius as shown in Figure 16 above. The spatial analysis clearly indicates that the most pressing need for access to clean water is in the northern part of the settlement, where very few services are located. The two “new” pockets of informal dwellings to the west of the settlement (see Fig 16) currently have no water taps.
Enumeration Report: Kosovo Informal Settlement Pocket
49
Analysis06 COMMUNITY VOICES
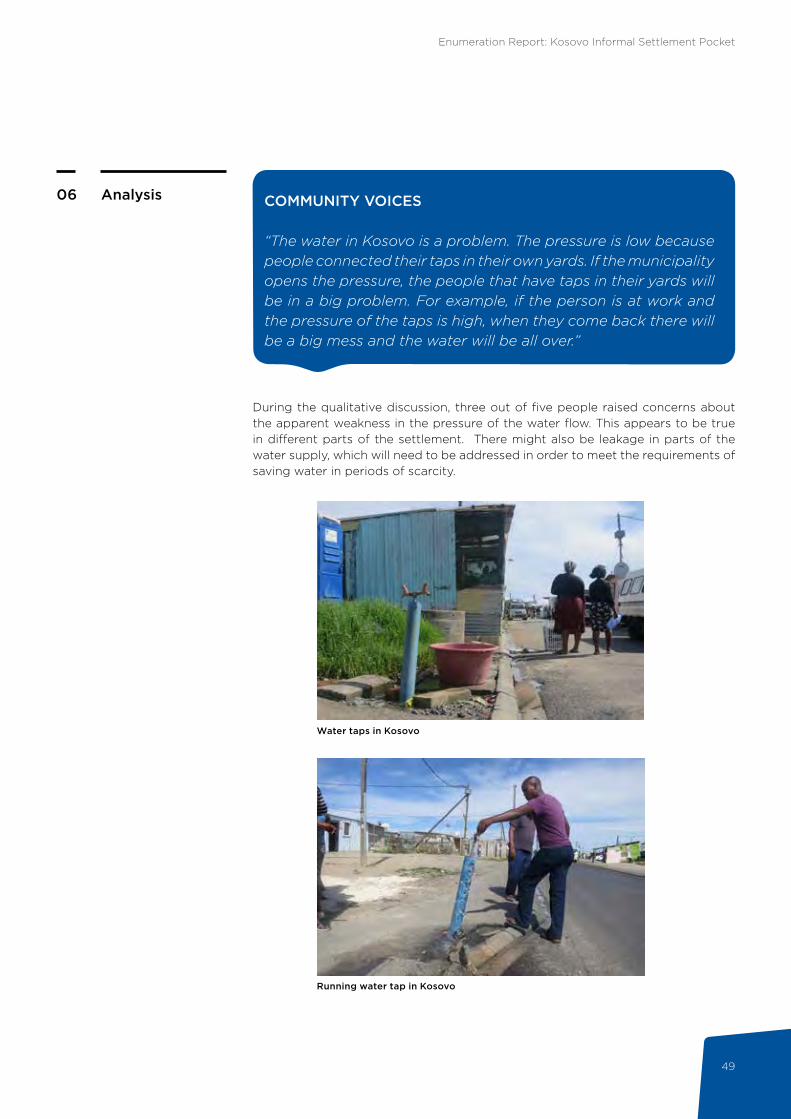
“The water in Kosovo is a problem. The pressure is low because people connected their taps in their own yards. If the municipality opens the pressure, the people that have taps in their yards will be in a big problem. For example, if the person is at work and the pressure of the taps is high, when they come back there will be a big mess and the water will be all over.”
During the qualitative discussion, three out of five people raised concerns about the apparent weakness in the pressure of the water flow. This appears to be true in different parts of the settlement. There might also be leakage in parts of the water supply, which will need to be addressed in order to meet the requirements of saving water in periods of scarcity.
Water taps in Kosovo
Running water tap in Kosovo
Enumeration Report: Kosovo Informal Settlement Pocket
50
Analysis06
Table 19: Percentage distribution of sanitation access
Access to toiletsFrequency
countPercent
Cumulative percent
Communal use 4 114 71,84 71,84
Household use only 194 3,39 75,22
Limited to a few families 1419 24,78 100
Total 5 727 100
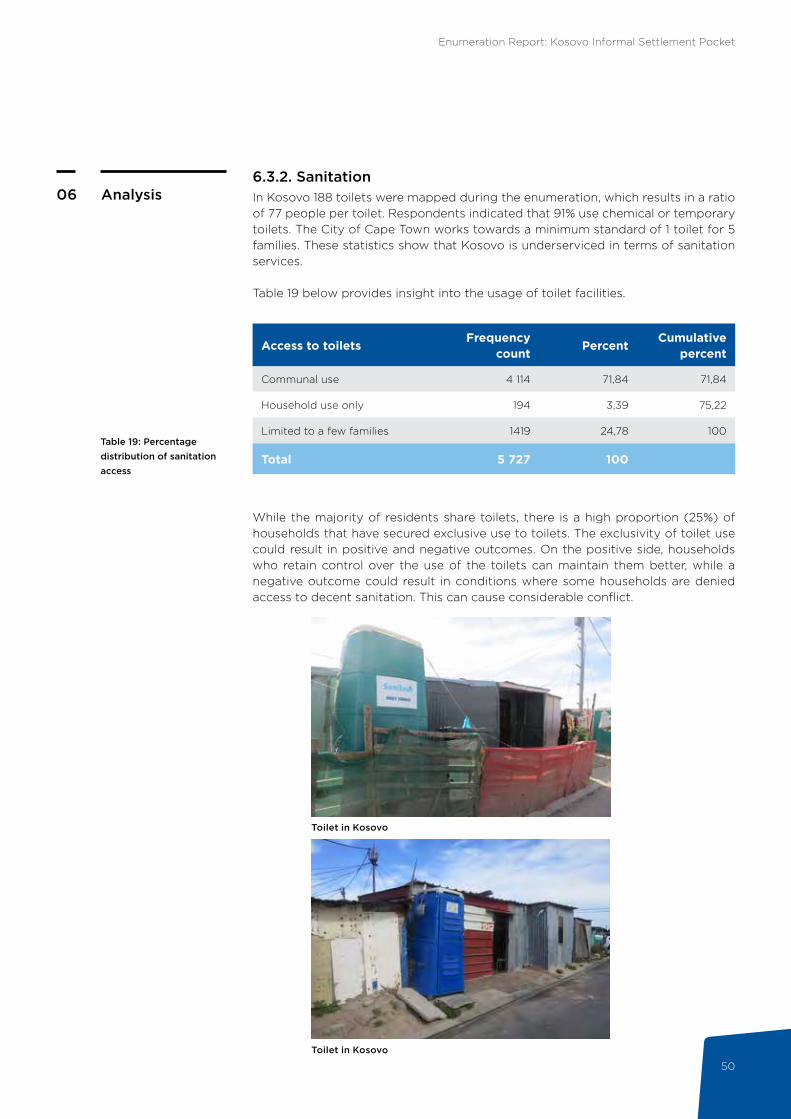
6.3.2. SanitationIn Kosovo 188 toilets were mapped during the enumeration, which results in a ratio of 77 people per toilet. Respondents indicated that 91% use chemical or temporary toilets. The City of Cape Town works towards a minimum standard of 1 toilet for 5 families. These statistics show that Kosovo is underserviced in terms of sanitation services.
Table 19 below provides insight into the usage of toilet facilities.
While the majority of residents share toilets, there is a high proportion (25%) of households that have secured exclusive use to toilets. The exclusivity of toilet use could result in positive and negative outcomes. On the positive side, households who retain control over the use of the toilets can maintain them better, while a negative outcome could result in conditions where some households are denied access to decent sanitation. This can cause considerable conflict.
Toilet in Kosovo
Toilet in Kosovo
Enumeration Report: Kosovo Informal Settlement Pocket
51
Analysis06
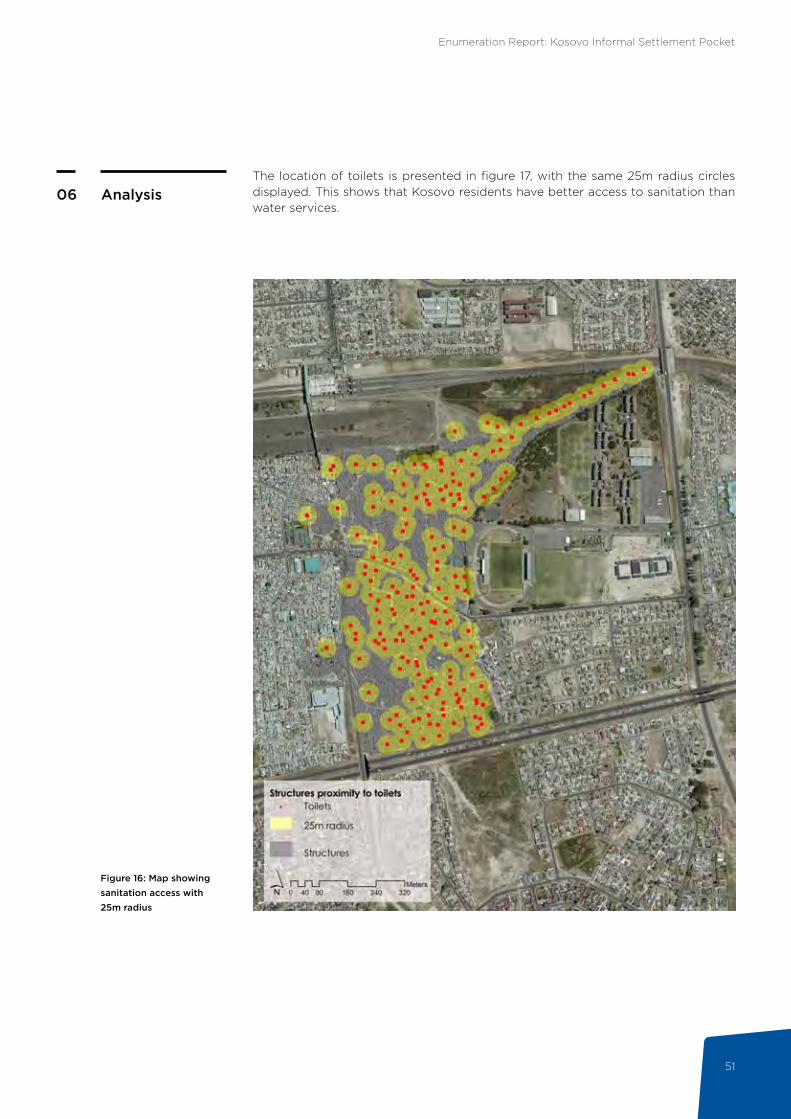
Figure 16: Map showing sanitation access with 25m radius
The location of toilets is presented in figure 17, with the same 25m radius circles displayed. This shows that Kosovo residents have better access to sanitation than water services.
Enumeration Report: Kosovo Informal Settlement Pocket
52
Analysis06
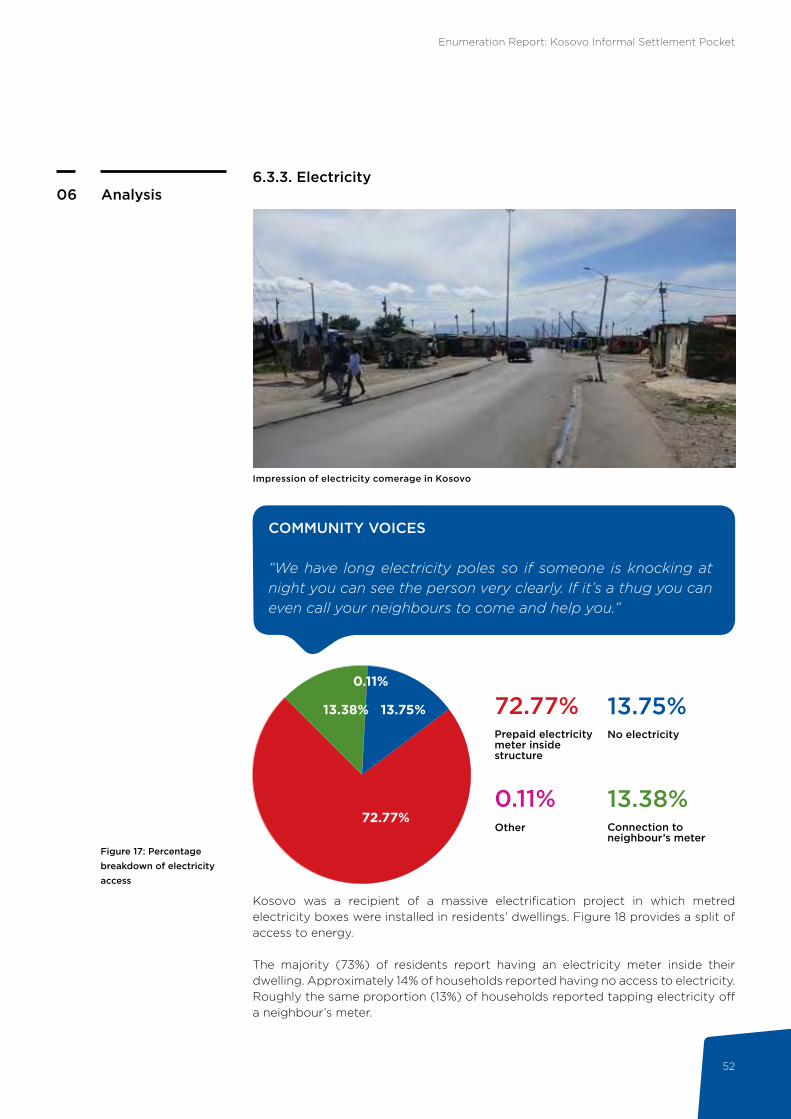
Figure 17: Percentage breakdown of electricity access
COMMUNITY VOICES
“We have long electricity poles so if someone is knocking at night you can see the person very clearly. If it’s a thug you can even call your neighbours to come and help you.”
72.77%
13.38% 13.75%
0.11%
No electricityPrepaid electricity meter inside structure
Connection to neighbour’s meter
Other
72.77% 13.75%
13.38%0.11%
6.3.3. Electricity
Kosovo was a recipient of a massive electrification project in which metred electricity boxes were installed in residents’ dwellings. Figure 18 provides a split of access to energy.
The majority (73%) of residents report having an electricity meter inside their dwelling. Approximately 14% of households reported having no access to electricity. Roughly the same proportion (13%) of households reported tapping electricity off a neighbour’s meter.
Impression of electricity comerage in Kosovo
Enumeration Report: Kosovo Informal Settlement Pocket
53
Analysis06
Figure 18: Map showing electricity access in Kosovo
A spatial analysis of figure 19 illustrates that the electricity grid has been extended deep into Kosovo. Some central areas reported to have no access to electricity. The portion of those with electricity meters and with connections to neighbours’ meters are spread throughout the settlement.
Impression of electricity connections in Kosovo

Enumeration Report: Kosovo Informal Settlement Pocket
54
Analysis066.3.4. Community services and local business
In conversation with community leaders, crime featured as an area of constant concern. Residents felt unsafe to conduct business in Kosovo and to look for opportunities elsewhere. The commercial uses are concentrated in areas with good footfall, such as major internal circulation routes and on the road that intersects Kosovo east – to – west namely White Hart Lane.
COMMUNITY VOICES
“We need people to do a neighbourhood watch. If we can have all these things we can fight crime together. On weekends people are not sleeping; they work till the morning (and this) is when they get murdered. Even if you are inside your house you are not safe. You will hear the guns at night and the bullets can even go through the zincs (sheets of your structure).”
COMMUNITY VOICES
“There is a thing that I want to ask from the municipality. As you know we live in shacks and there are also people selling alcohol. They (the municipality) must do licences so that the shebeens must know when to open and when to close their taverns. I think there will be less crime.”
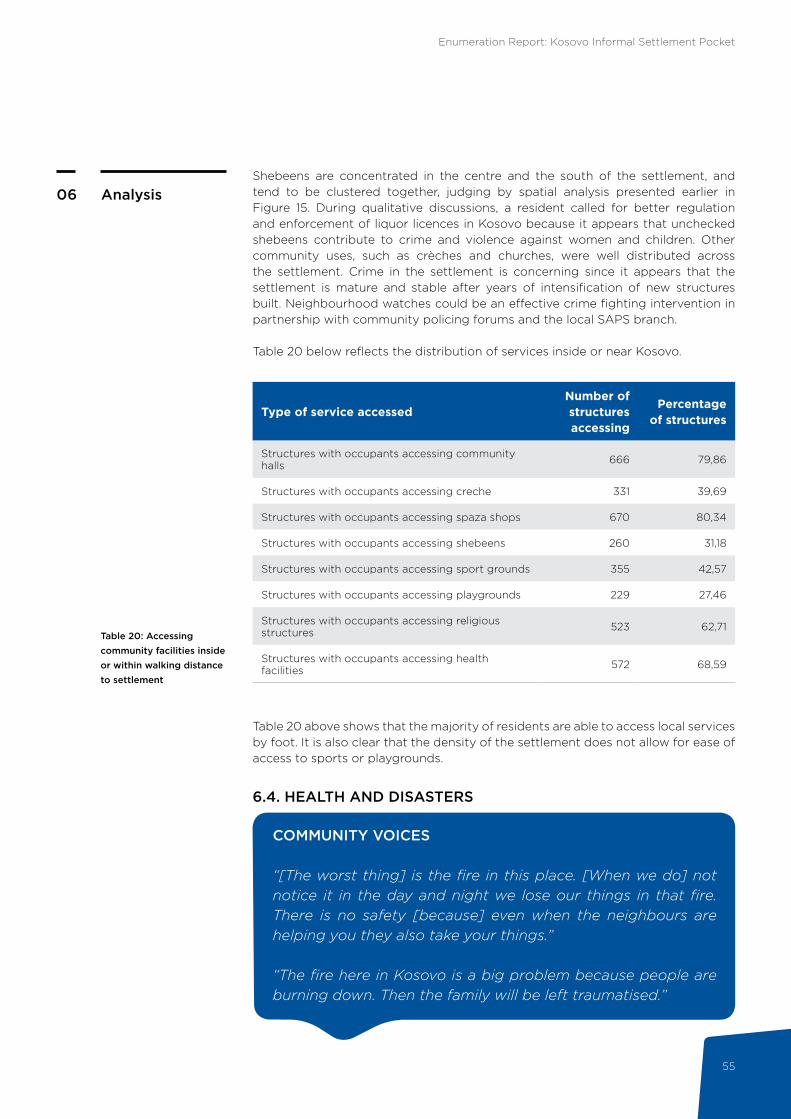
Enumeration Report: Kosovo Informal Settlement Pocket
55
Analysis06
Type of service accessedNumber of structures accessing
Percentage of structures
Structures with occupants accessing community halls 666 79,86
Structures with occupants accessing creche 331 39,69
Structures with occupants accessing spaza shops 670 80,34
Structures with occupants accessing shebeens 260 31,18
Structures with occupants accessing sport grounds 355 42,57
Structures with occupants accessing playgrounds 229 27,46
Structures with occupants accessing religious structures 523 62,71
Structures with occupants accessing health facilities 572 68,59
Shebeens are concentrated in the centre and the south of the settlement, and tend to be clustered together, judging by spatial analysis presented earlier in Figure 15. During qualitative discussions, a resident called for better regulation and enforcement of liquor licences in Kosovo because it appears that unchecked shebeens contribute to crime and violence against women and children. Other community uses, such as crèches and churches, were well distributed across the settlement. Crime in the settlement is concerning since it appears that the settlement is mature and stable after years of intensification of new structures built. Neighbourhood watches could be an effective crime fighting intervention in partnership with community policing forums and the local SAPS branch.
Table 20 below reflects the distribution of services inside or near Kosovo.
Table 20 above shows that the majority of residents are able to access local services by foot. It is also clear that the density of the settlement does not allow for ease of access to sports or playgrounds.
6.4. HEALTH AND DISASTERS
COMMUNITY VOICES
“[The worst thing] is the fire in this place. [When we do] not notice it in the day and night we lose our things in that fire. There is no safety [because] even when the neighbours are helping you they also take your things.”
“The fire here in Kosovo is a big problem because people are burning down. Then the family will be left traumatised.”
Table 20: Accessing community facilities inside or within walking distance to settlement
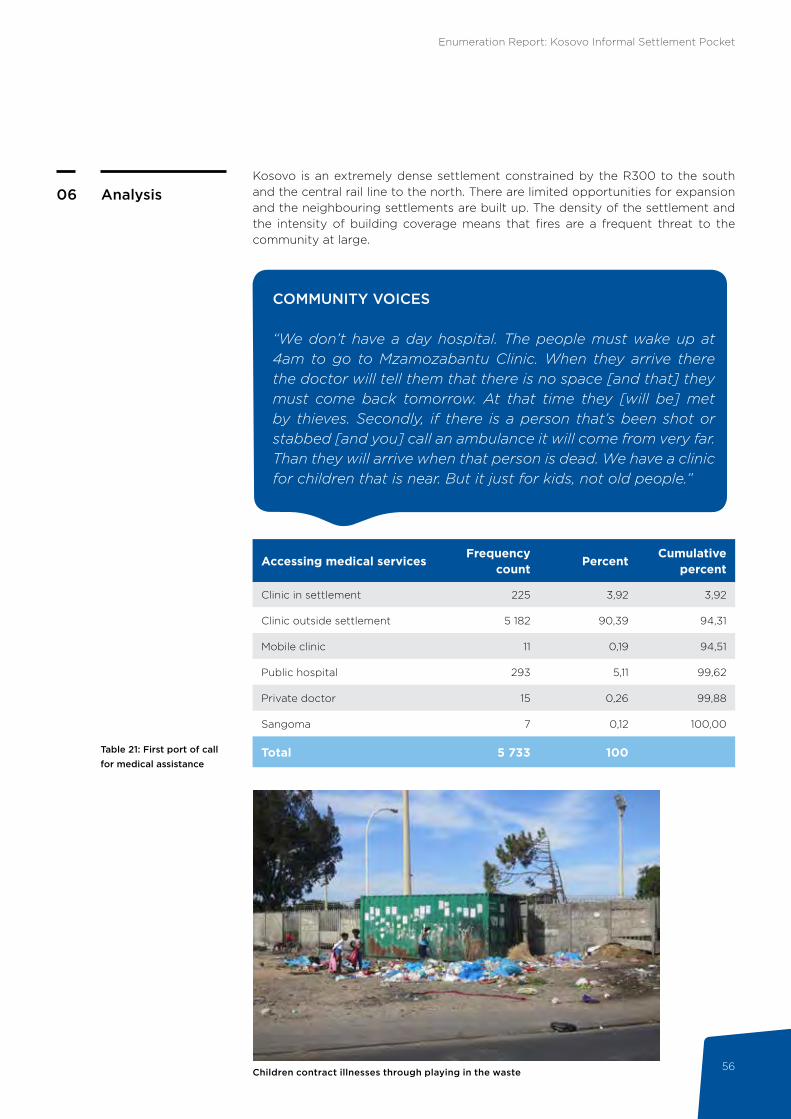
Enumeration Report: Kosovo Informal Settlement Pocket
56
Analysis06
Table 21: First port of call for medical assistance
Accessing medical servicesFrequency
countPercent
Cumulative percent
Clinic in settlement 225 3,92 3,92
Clinic outside settlement 5 182 90,39 94,31
Mobile clinic 11 0,19 94,51
Public hospital 293 5,11 99,62
Private doctor 15 0,26 99,88
Sangoma 7 0,12 100,00
Total 5 733 100
COMMUNITY VOICES
“We don’t have a day hospital. The people must wake up at 4am to go to Mzamozabantu Clinic. When they arrive there the doctor will tell them that there is no space [and that] they must come back tomorrow. At that time they [will be] met by thieves. Secondly, if there is a person that’s been shot or stabbed [and you] call an ambulance it will come from very far. Than they will arrive when that person is dead. We have a clinic for children that is near. But it just for kids, not old people.”
Kosovo is an extremely dense settlement constrained by the R300 to the south and the central rail line to the north. There are limited opportunities for expansion and the neighbouring settlements are built up. The density of the settlement and the intensity of building coverage means that fires are a frequent threat to the community at large.
Children contract illnesses through playing in the waste
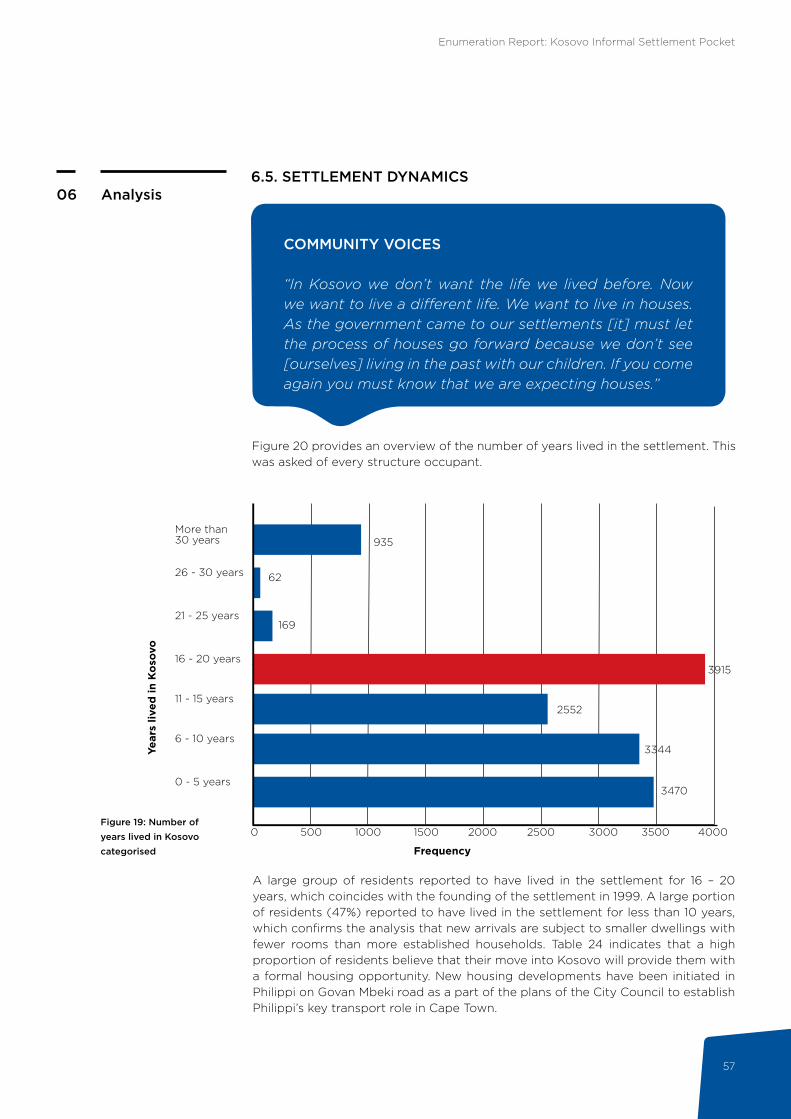
Enumeration Report: Kosovo Informal Settlement Pocket
57
Analysis066.5. SETTLEMENT DYNAMICS
COMMUNITY VOICES
“In Kosovo we don’t want the life we lived before. Now we want to live a different life. We want to live in houses. As the government came to our settlements [it] must let the process of houses go forward because we don’t see [ourselves] living in the past with our children. If you come again you must know that we are expecting houses.”
Figure 20 provides an overview of the number of years lived in the settlement. This was asked of every structure occupant.
A large group of residents reported to have lived in the settlement for 16 – 20 years, which coincides with the founding of the settlement in 1999. A large portion of residents (47%) reported to have lived in the settlement for less than 10 years, which confirms the analysis that new arrivals are subject to smaller dwellings with fewer rooms than more established households. Table 24 indicates that a high proportion of residents believe that their move into Kosovo will provide them with a formal housing opportunity. New housing developments have been initiated in Philippi on Govan Mbeki road as a part of the plans of the City Council to establish Philippi’s key transport role in Cape Town.
Frequency
Figure 19: Number of years lived in Kosovo categorised
26 - 30 years
21 - 25 years
16 - 20 years
11 - 15 years
6 - 10 years
0 - 5 years
935
62
169
39151140
2552
0 500 1000 1500 2000 2500 3000 3500 4000
3344
3470
Year
s liv
ed in
Ko
sovo
More than 30 years
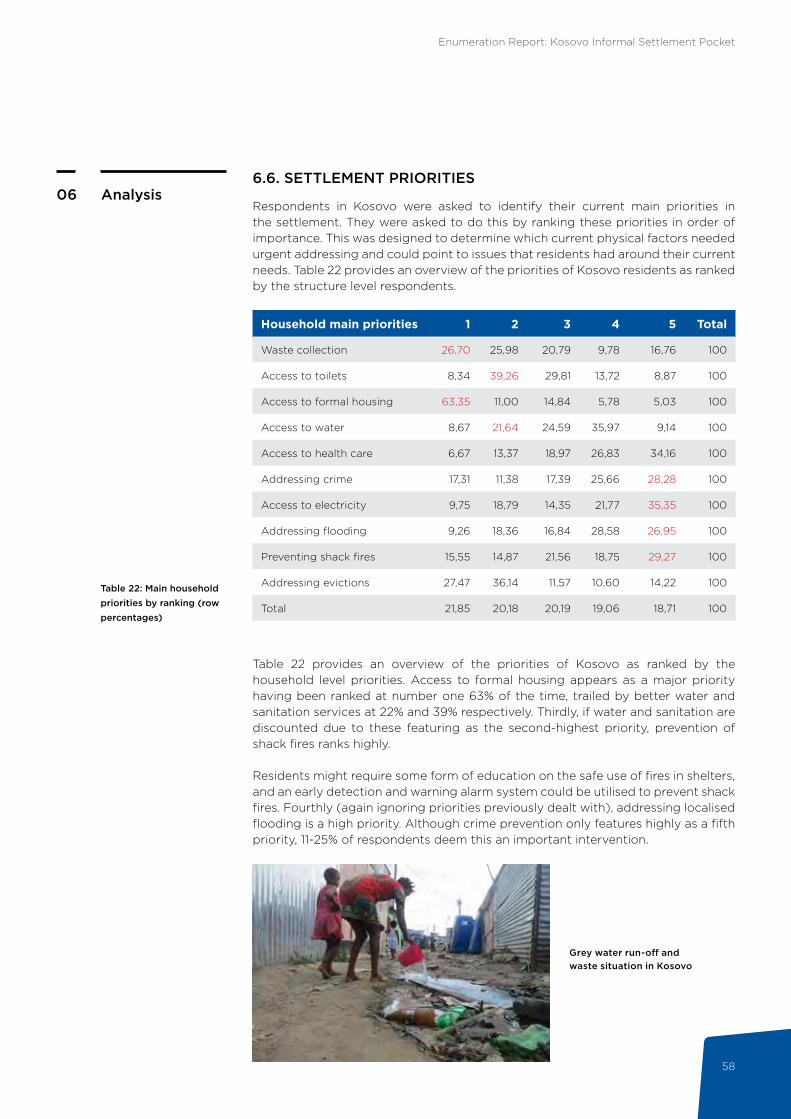
Enumeration Report: Kosovo Informal Settlement Pocket
58
Analysis06
Table 22: Main household priorities by ranking (row percentages)
Household main priorities 1 2 3 4 5 Total
Waste collection 26,70 25,98 20,79 9,78 16,76 100
Access to toilets 8,34 39,26 29,81 13,72 8,87 100
Access to formal housing 63,35 11,00 14,84 5,78 5,03 100
Access to water 8,67 21,64 24,59 35,97 9,14 100
Access to health care 6,67 13,37 18,97 26,83 34,16 100
Addressing crime 17,31 11,38 17,39 25,66 28,28 100
Access to electricity 9,75 18,79 14,35 21,77 35,35 100
Addressing flooding 9,26 18,36 16,84 28,58 26,95 100
Preventing shack fires 15,55 14,87 21,56 18,75 29,27 100
Addressing evictions 27,47 36,14 11,57 10,60 14,22 100
Total 21,85 20,18 20,19 19,06 18,71 100
6.6. SETTLEMENT PRIORITIES
Respondents in Kosovo were asked to identify their current main priorities in the settlement. They were asked to do this by ranking these priorities in order of importance. This was designed to determine which current physical factors needed urgent addressing and could point to issues that residents had around their current needs. Table 22 provides an overview of the priorities of Kosovo residents as ranked by the structure level respondents.
Table 22 provides an overview of the priorities of Kosovo as ranked by the household level priorities. Access to formal housing appears as a major priority having been ranked at number one 63% of the time, trailed by better water and sanitation services at 22% and 39% respectively. Thirdly, if water and sanitation are discounted due to these featuring as the second-highest priority, prevention of shack fires ranks highly.
Residents might require some form of education on the safe use of fires in shelters, and an early detection and warning alarm system could be utilised to prevent shack fires. Fourthly (again ignoring priorities previously dealt with), addressing localised flooding is a high priority. Although crime prevention only features highly as a fifth priority, 11-25% of respondents deem this an important intervention.
Grey water run-off and waste situation in Kosovo
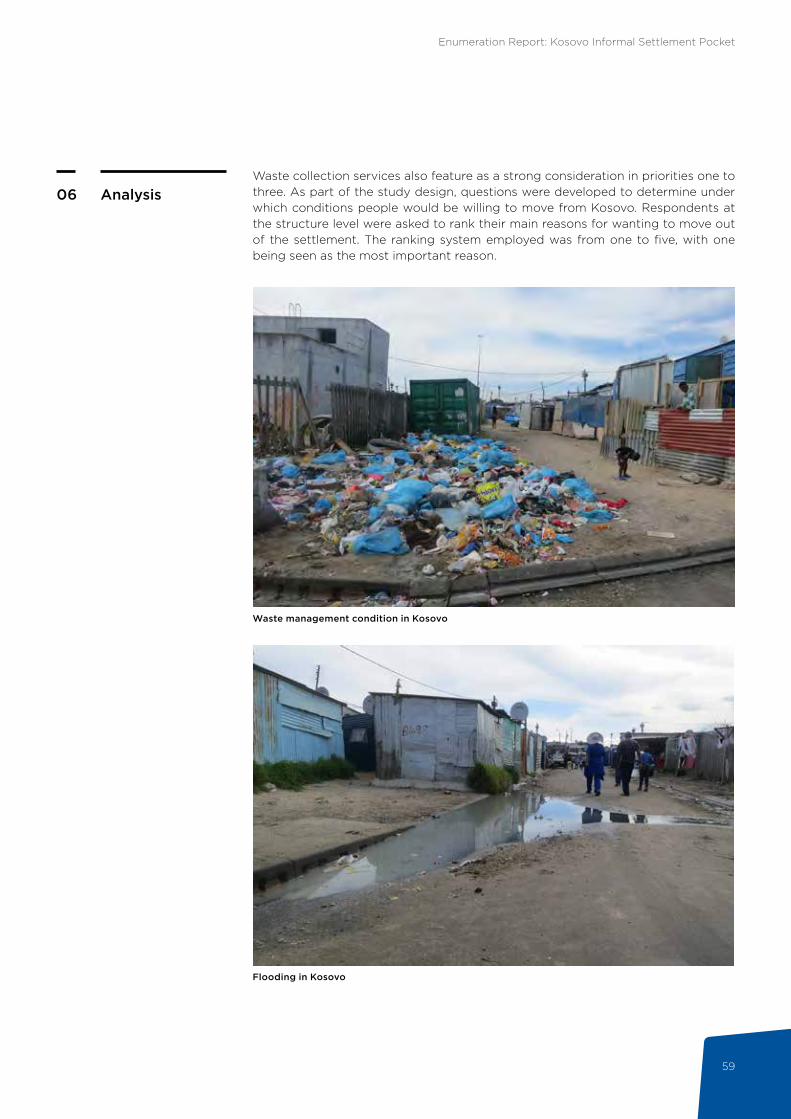
Enumeration Report: Kosovo Informal Settlement Pocket
59
Analysis06Waste collection services also feature as a strong consideration in priorities one to three. As part of the study design, questions were developed to determine under which conditions people would be willing to move from Kosovo. Respondents at the structure level were asked to rank their main reasons for wanting to move out of the settlement. The ranking system employed was from one to five, with one being seen as the most important reason.
Waste management condition in Kosovo
Flooding in Kosovo
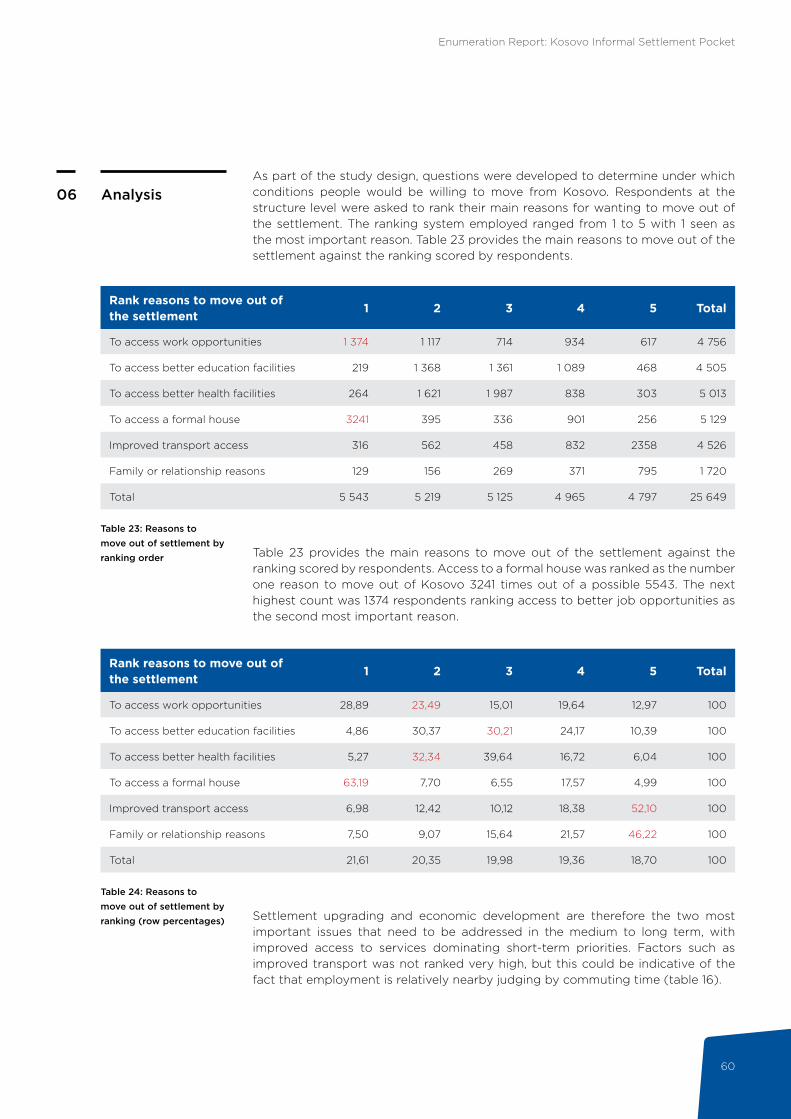
Enumeration Report: Kosovo Informal Settlement Pocket
60
Analysis06
Table 24: Reasons to move out of settlement by ranking (row percentages)
Rank reasons to move out of the settlement
1 2 3 4 5 Total
To access work opportunities 28,89 23,49 15,01 19,64 12,97 100
To access better education facilities 4,86 30,37 30,21 24,17 10,39 100
To access better health facilities 5,27 32,34 39,64 16,72 6,04 100
To access a formal house 63,19 7,70 6,55 17,57 4,99 100
Improved transport access 6,98 12,42 10,12 18,38 52,10 100
Family or relationship reasons 7,50 9,07 15,64 21,57 46,22 100
Total 21,61 20,35 19,98 19,36 18,70 100
Table 23 provides the main reasons to move out of the settlement against the ranking scored by respondents. Access to a formal house was ranked as the number one reason to move out of Kosovo 3241 times out of a possible 5543. The next highest count was 1374 respondents ranking access to better job opportunities as the second most important reason.
Settlement upgrading and economic development are therefore the two most important issues that need to be addressed in the medium to long term, with improved access to services dominating short-term priorities. Factors such as improved transport was not ranked very high, but this could be indicative of the fact that employment is relatively nearby judging by commuting time (table 16).
Table 23: Reasons to move out of settlement by ranking order
Rank reasons to move out of the settlement
1 2 3 4 5 Total
To access work opportunities 1 374 1 117 714 934 617 4 756
To access better education facilities 219 1 368 1 361 1 089 468 4 505
To access better health facilities 264 1 621 1 987 838 303 5 013
To access a formal house 3241 395 336 901 256 5 129
Improved transport access 316 562 458 832 2358 4 526
Family or relationship reasons 129 156 269 371 795 1 720
Total 5 543 5 219 5 125 4 965 4 797 25 649
As part of the study design, questions were developed to determine under which conditions people would be willing to move from Kosovo. Respondents at the structure level were asked to rank their main reasons for wanting to move out of the settlement. The ranking system employed ranged from 1 to 5 with 1 seen as the most important reason. Table 23 provides the main reasons to move out of the settlement against the ranking scored by respondents.
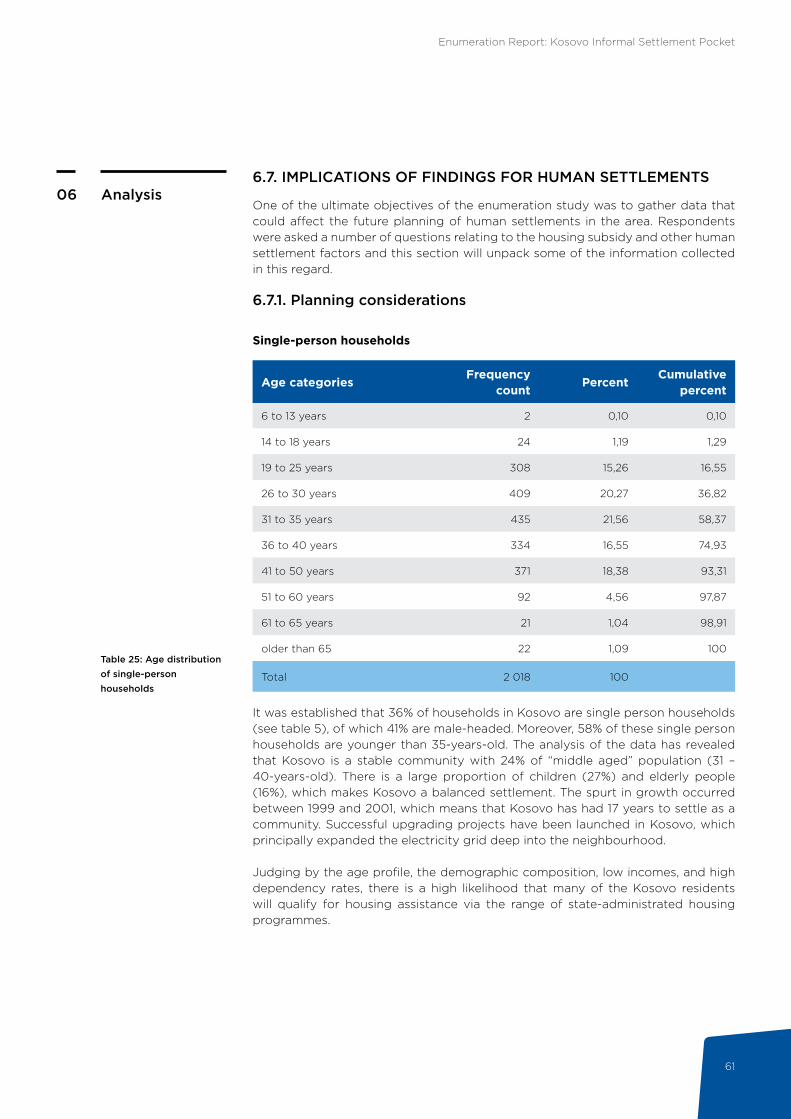
Enumeration Report: Kosovo Informal Settlement Pocket
61
Analysis066.7. IMPLICATIONS OF FINDINGS FOR HUMAN SETTLEMENTS
One of the ultimate objectives of the enumeration study was to gather data that could affect the future planning of human settlements in the area. Respondents were asked a number of questions relating to the housing subsidy and other human settlement factors and this section will unpack some of the information collected in this regard.
6.7.1. Planning considerations
Single-person households
It was established that 36% of households in Kosovo are single person households (see table 5), of which 41% are male-headed. Moreover, 58% of these single person households are younger than 35-years-old. The analysis of the data has revealed that Kosovo is a stable community with 24% of “middle aged” population (31 – 40-years-old). There is a large proportion of children (27%) and elderly people (16%), which makes Kosovo a balanced settlement. The spurt in growth occurred between 1999 and 2001, which means that Kosovo has had 17 years to settle as a community. Successful upgrading projects have been launched in Kosovo, which principally expanded the electricity grid deep into the neighbourhood.
Judging by the age profile, the demographic composition, low incomes, and high dependency rates, there is a high likelihood that many of the Kosovo residents will qualify for housing assistance via the range of state-administrated housing programmes.
Table 25: Age distribution of single-person households
Age categoriesFrequency
countPercent
Cumulative percent
6 to 13 years 2 0,10 0,10
14 to 18 years 24 1,19 1,29
19 to 25 years 308 15,26 16,55
26 to 30 years 409 20,27 36,82
31 to 35 years 435 21,56 58,37
36 to 40 years 334 16,55 74,93
41 to 50 years 371 18,38 93,31
51 to 60 years 92 4,56 97,87
61 to 65 years 21 1,04 98,91
older than 65 22 1,09 100
Total 2 018 100

Enumeration Report: Kosovo Informal Settlement Pocket
62
Analysis06Household sizeCORC was able to enumerate 92% of the 6110 structures numbered at when the enumeration commenced. A total of 5824 households was counted, residing in 5752 dwellings, which means that more than one household resides in 62 dwellings. By counting the number of people per household, the settlement population is 14380 people. The average household size was determined to be 2.5 persons per household.
Age profileAs discussed above, the age profile of Kosovo points to a relatively middle-aged population. Overall, 36% of the population is younger than 30 years while 35% is between 36 and 50 years old. From a planning perspective, this is important as the Department of Human Settlements has indicated that it would prioritise persons 40 years and older in terms of allocating housing opportunities.
Social cohesionThe residents of Kosovo show a very strong link to the local area. The majority of residents have lived in the settlement since it was founded in 1999. The majority (61%) of school or college going residents attend school or college in Philippi and Mitchells Plain. In total, 75% of residents reported that they commute by train, walking or minibus in less than an hour. Residents in Kosovo also indicated the use of facilities inside or near the settlement. Over 70% of respondents said they accessed facilities inside or near the settlement such as community halls, crèches, spaza shops, shebeens and religious structures. However, the lack of sports and playing fields in the near vicinity means that children are forced to play in streets. It is concerning that 21% of potential school goers are not going to school.
Income and expenditureThe majority of households (97%) indicated incomes of R3500 or less while 28% of households indicated they earn no income. It was also established that 97% of households indicated expenditure of R3500 or less. The data indicates that the majority of residents fall within the income range for housing subsidy qualification.
6.7.2. Pathway to qualificationThis section provides information about the process for subsidy qualification and highlights what criteria is considered by the Department of Human Settlements.
Subsidy qualification criteria
You qualify for a housing subsidy if:• You are a South African citizen or have a permanent residence permit.• You are 18 years or older.• You are married or living with a partner.• You are single or divorced, and have proven financial dependants
permanently residing with you (military veterans without any financial dependants can apply).
• Your maximum monthly household income is R3 500 or less before deductions (military veterans earning up to R10 416 per month can apply).
• You or your partner are not current or previous property owners.• You or your partner have never received a subsidy from the government.
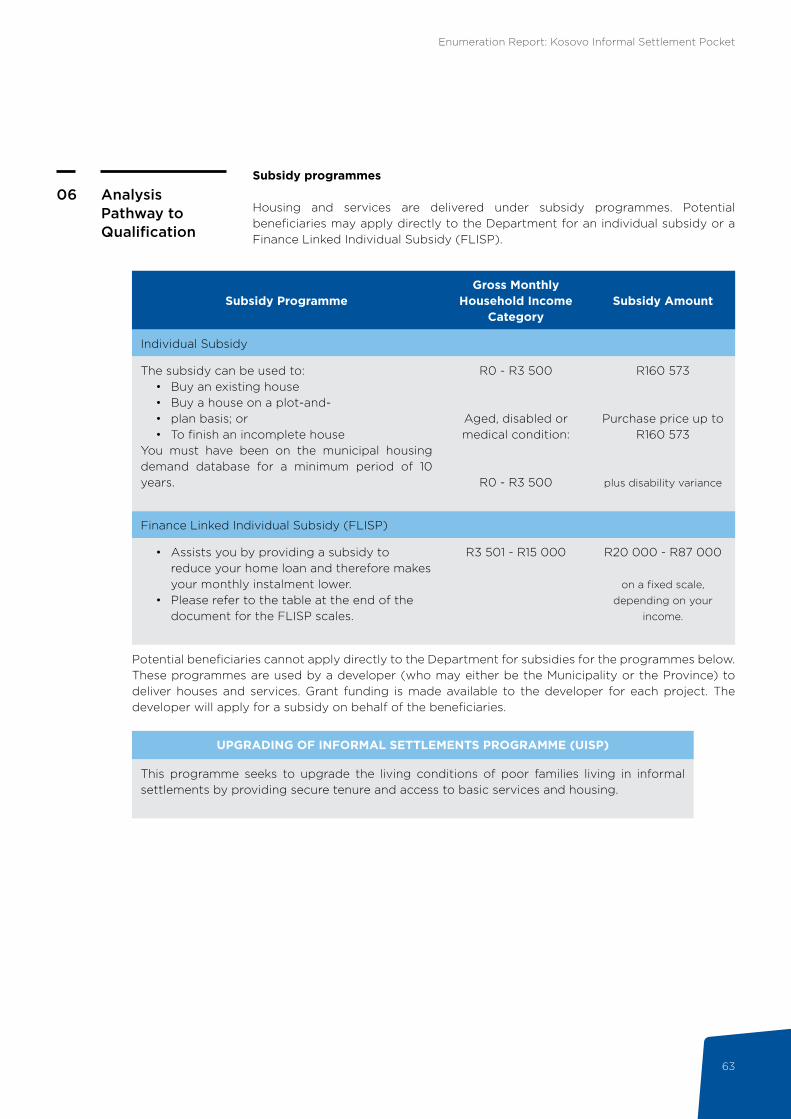
Enumeration Report: Kosovo Informal Settlement Pocket
63
AnalysisPathway to Qualification
06
Subsidy ProgrammeGross Monthly
Household IncomeCategory
Subsidy Amount
Individual Subsidy
The subsidy can be used to:• Buy an existing house• Buy a house on a plot-and-• plan basis; or• To finish an incomplete house
You must have been on the municipal housing demand database for a minimum period of 10 years.
R0 - R3 500
Aged, disabled or medical condition:
R0 - R3 500
R160 573
Purchase price up to R160 573
plus disability variance
Finance Linked Individual Subsidy (FLISP)
• Assists you by providing a subsidy to reduce your home loan and therefore makes your monthly instalment lower.
• Please refer to the table at the end of the document for the FLISP scales.
R3 501 - R15 000 R20 000 - R87 000
on a fixed scale, depending on your
income.
Potential beneficiaries cannot apply directly to the Department for subsidies for the programmes below. These programmes are used by a developer (who may either be the Municipality or the Province) to deliver houses and services. Grant funding is made available to the developer for each project. The developer will apply for a subsidy on behalf of the beneficiaries.
UPGRADING OF INFORMAL SETTLEMENTS PROGRAMME (UISP)
This programme seeks to upgrade the living conditions of poor families living in informal settlements by providing secure tenure and access to basic services and housing.
Subsidy programmes
Housing and services are delivered under subsidy programmes. Potential beneficiaries may apply directly to the Department for an individual subsidy or a Finance Linked Individual Subsidy (FLISP).
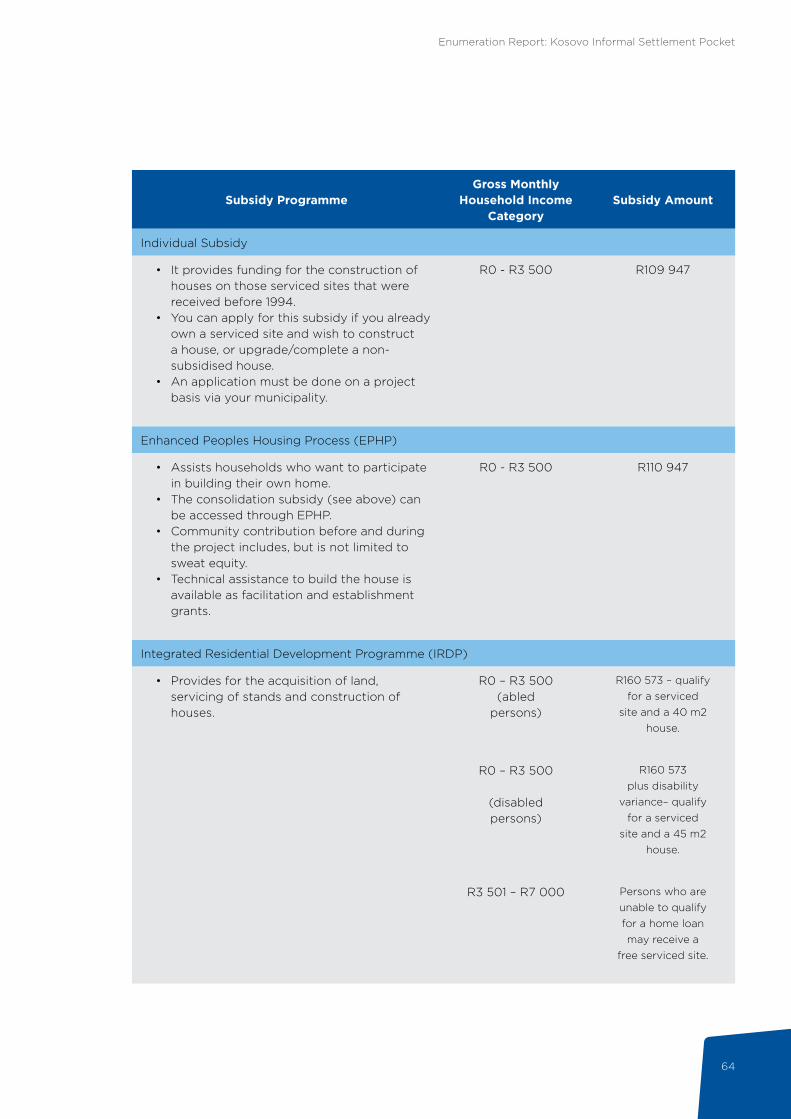
Enumeration Report: Kosovo Informal Settlement Pocket
64
Subsidy ProgrammeGross Monthly
Household IncomeCategory
Subsidy Amount
Individual Subsidy
• It provides funding for the construction of houses on those serviced sites that were received before 1994.
• You can apply for this subsidy if you already own a serviced site and wish to construct a house, or upgrade/complete a non- subsidised house.
• An application must be done on a project basis via your municipality.
R0 - R3 500 R109 947
Enhanced Peoples Housing Process (EPHP)
• Assists households who want to participate in building their own home.
• The consolidation subsidy (see above) can be accessed through EPHP.
• Community contribution before and during the project includes, but is not limited to sweat equity.
• Technical assistance to build the house is available as facilitation and establishment grants.
R0 - R3 500 R110 947
Integrated Residential Development Programme (IRDP)
• Provides for the acquisition of land, servicing of stands and construction of houses.
R0 – R3 500(abled
persons)
R160 573 – qualifyfor a serviced
site and a 40 m2house.
R0 – R3 500
(disabledpersons)
R160 573plus disability
variance– qualifyfor a serviced
site and a 45 m2house.
R3 501 – R7 000 Persons who areunable to qualifyfor a home loanmay receive a
free serviced site.
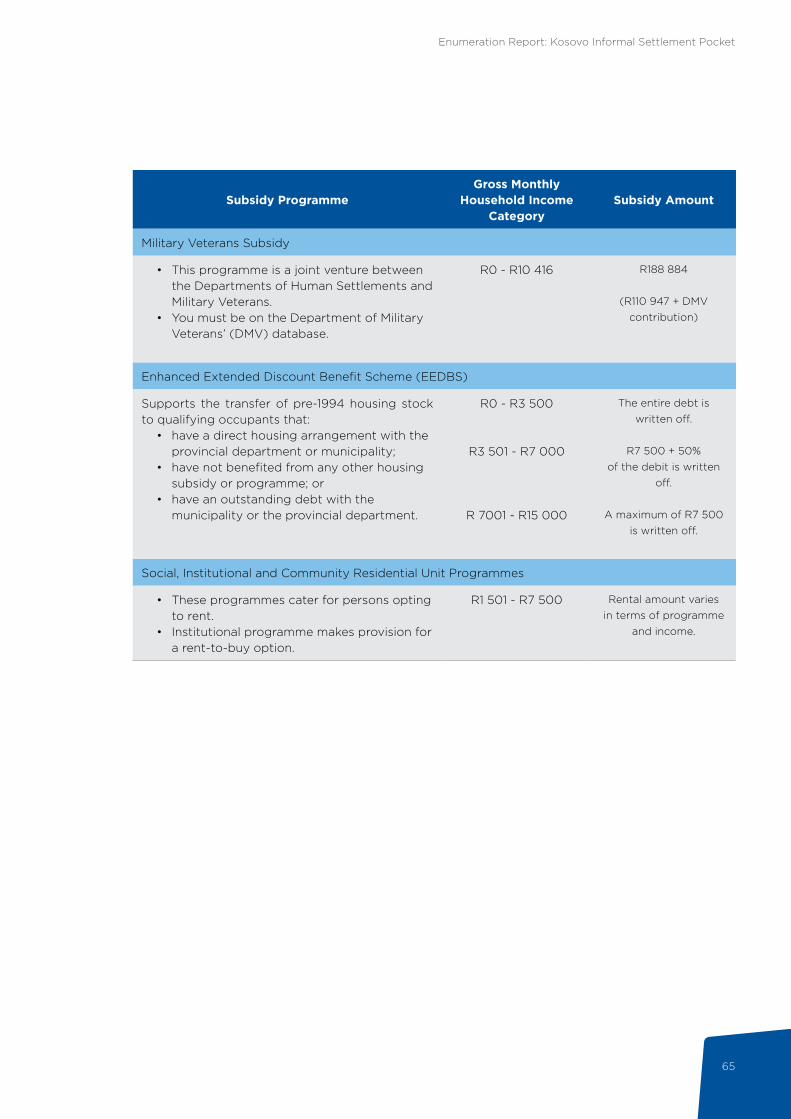
Enumeration Report: Kosovo Informal Settlement Pocket
65
Subsidy ProgrammeGross Monthly
Household IncomeCategory
Subsidy Amount
Military Veterans Subsidy
• This programme is a joint venture between the Departments of Human Settlements and Military Veterans.
• You must be on the Department of Military Veterans’ (DMV) database.
R0 - R10 416 R188 884
(R110 947 + DMVcontribution)
Enhanced Extended Discount Benefit Scheme (EEDBS)
Supports the transfer of pre-1994 housing stock to qualifying occupants that:
• have a direct housing arrangement with the provincial department or municipality;
• have not benefited from any other housing subsidy or programme; or
• have an outstanding debt with the municipality or the provincial department.
R0 - R3 500
R3 501 - R7 000
R 7001 - R15 000
The entire debt is written off.
R7 500 + 50% of the debit is written
off.
A maximum of R7 500 is written off.
Social, Institutional and Community Residential Unit Programmes
• These programmes cater for persons opting to rent.
• Institutional programme makes provision for a rent-to-buy option.
R1 501 - R7 500 Rental amount varies in terms of programme
and income.
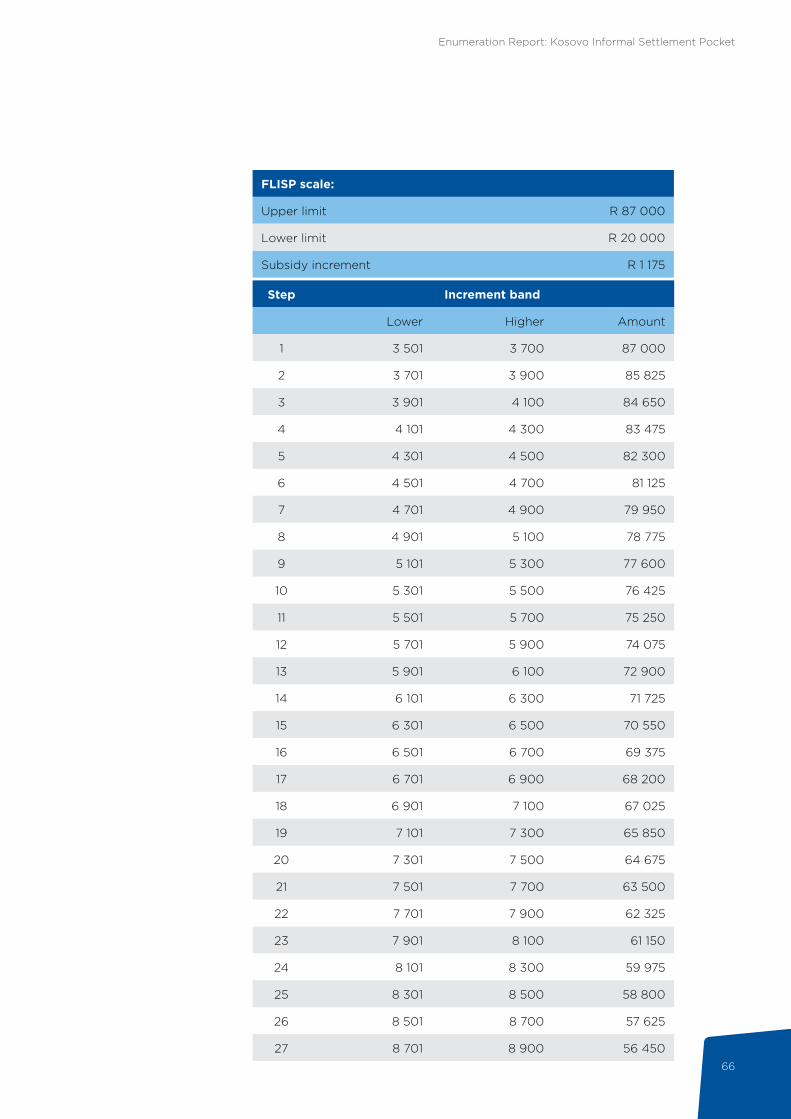
Enumeration Report: Kosovo Informal Settlement Pocket
66
Step Increment band
Lower Higher Amount
1 3 501 3 700 87 000
2 3 701 3 900 85 825
3 3 901 4 100 84 650
4 4 101 4 300 83 475
5 4 301 4 500 82 300
6 4 501 4 700 81 125
7 4 701 4 900 79 950
8 4 901 5 100 78 775
9 5 101 5 300 77 600
10 5 301 5 500 76 425
11 5 501 5 700 75 250
12 5 701 5 900 74 075
13 5 901 6 100 72 900
14 6 101 6 300 71 725
15 6 301 6 500 70 550
16 6 501 6 700 69 375
17 6 701 6 900 68 200
18 6 901 7 100 67 025
19 7 101 7 300 65 850
20 7 301 7 500 64 675
21 7 501 7 700 63 500
22 7 701 7 900 62 325
23 7 901 8 100 61 150
24 8 101 8 300 59 975
25 8 301 8 500 58 800
26 8 501 8 700 57 625
27 8 701 8 900 56 450
FLISP scale:
Upper limit R 87 000
Lower limit R 20 000
Subsidy increment R 1 175
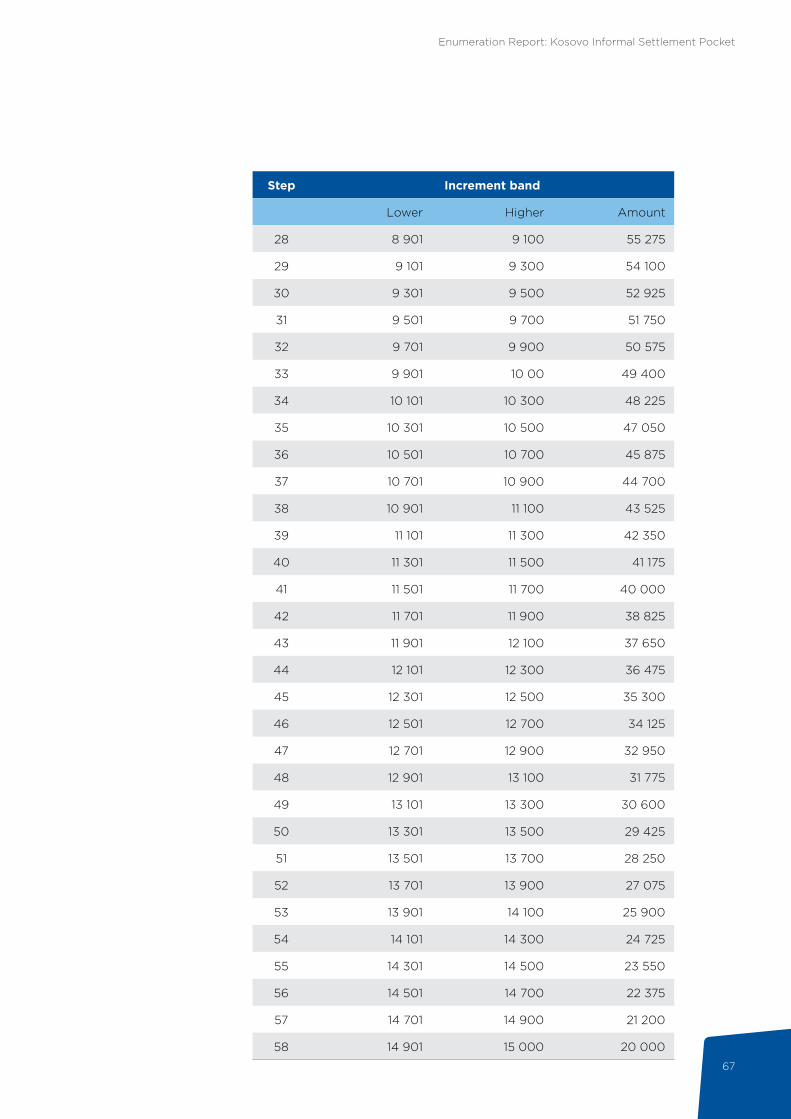
Enumeration Report: Kosovo Informal Settlement Pocket
67
Step Increment band
Lower Higher Amount
28 8 901 9 100 55 275
29 9 101 9 300 54 100
30 9 301 9 500 52 925
31 9 501 9 700 51 750
32 9 701 9 900 50 575
33 9 901 10 00 49 400
34 10 101 10 300 48 225
35 10 301 10 500 47 050
36 10 501 10 700 45 875
37 10 701 10 900 44 700
38 10 901 11 100 43 525
39 11 101 11 300 42 350
40 11 301 11 500 41 175
41 11 501 11 700 40 000
42 11 701 11 900 38 825
43 11 901 12 100 37 650
44 12 101 12 300 36 475
45 12 301 12 500 35 300
46 12 501 12 700 34 125
47 12 701 12 900 32 950
48 12 901 13 100 31 775
49 13 101 13 300 30 600
50 13 301 13 500 29 425
51 13 501 13 700 28 250
52 13 701 13 900 27 075
53 13 901 14 100 25 900
54 14 101 14 300 24 725
55 14 301 14 500 23 550
56 14 501 14 700 22 375
57 14 701 14 900 21 200
58 14 901 15 000 20 000

Enumeration Report: Kosovo Informal Settlement Pocket
68
Conclusion07The enumeration of Kosovo informal settlement pocket, which covered 91% of This enumeration study of Kosovo, which covered 92% of all 6110 structures numbered, has revealed some surprising statistics about the settlement overall. The analysis of the data indicates a middle-aged community who have been through an early rapid growth spurt, but now have settled into a more stable situation.
The history of the settlement relates to backyarders from Philippi who occupied the land in 1999, and satellite photos confirmed that by 2001 the majority of the settlement was formed. Subsequently, natural growth and limited land for community expansion has seen the last remaining open space occupied, and the intensity of structures built has increased substantially, which causes fire risk. The limitations for longer-term growth and consolidation are the proximity to the rail line and the R300 motorway, but a solid network of informal paths and roads could be the structuring elements of longer-term consolidation.
When taking the history of the settlement into account, the enumeration data gives an accurate portrayal of an initially young and single population who occupied the land, but subsequently family structure has emerged. The average household size of Kosovo is 2.50 persons per household.
The implications for settlement planning and upgrade are tremendous. To attain the high densities of 212 dwelling units per hectare over 28.64 hectare and cause minimal disruption to the population, a sensitive upgrading strategy needs to cater to the needs of an established community. Previous settlement upgrading initiatives have been successful judging by the extent to which the electricity grid has been rolled out in Kosovo.
The high density of the settlement will require innovative tenure types, street and open space design, and consolidation housing finance. However, addressing the needs through the conventional housing package will clearly be unrealistic given the current beneficiary criteria. In the short term, access to water and sanitation remains a pressing issue, while economic growth and crime prevention are also top priorities.
7. CONCLUSION
Enumeration Report: Kosovo Informal Settlement Pocket
69
References08
REFERENCES
• Department of Cooperative Governance and Traditional Affairs (COGTA). 2005. The Municipal Infrastructure Grant: Basic Levels of services and unit costs; a guide for municipalities. Online: http://www.cogta.gov.za/mig/docs/5.pdf
• Todes, A.; Kok, P.; Wntzel, M.; van Zyl, J.; & Cross, C. 2010. Contemporary South African Urbanisation Dynamics. Urban Forum (2010) 21:331–348
• Housing Development Agency (HDA). 2013a. Western Cape: Informal Settlements Status. Research Report, HDA
• Housing Development Agency (HDA). 2013b. South Africa: Informal Settlements Status 2013. Research Report, HDA
• NDHS (National Department of Human Settlements). 2014. Presentation made by the National Upgrading Support Programme at the Policy Consultative Workshop held on 5 September 2014 at the Townhouse Hotel, Cape Town.
• Statistics South Africa, 2016. Labour Force Survey• Western Cape Department of Human Settlements. 2015. Minister’s Budget
Vote speech for the 2015/16 financial year. Cape Town.
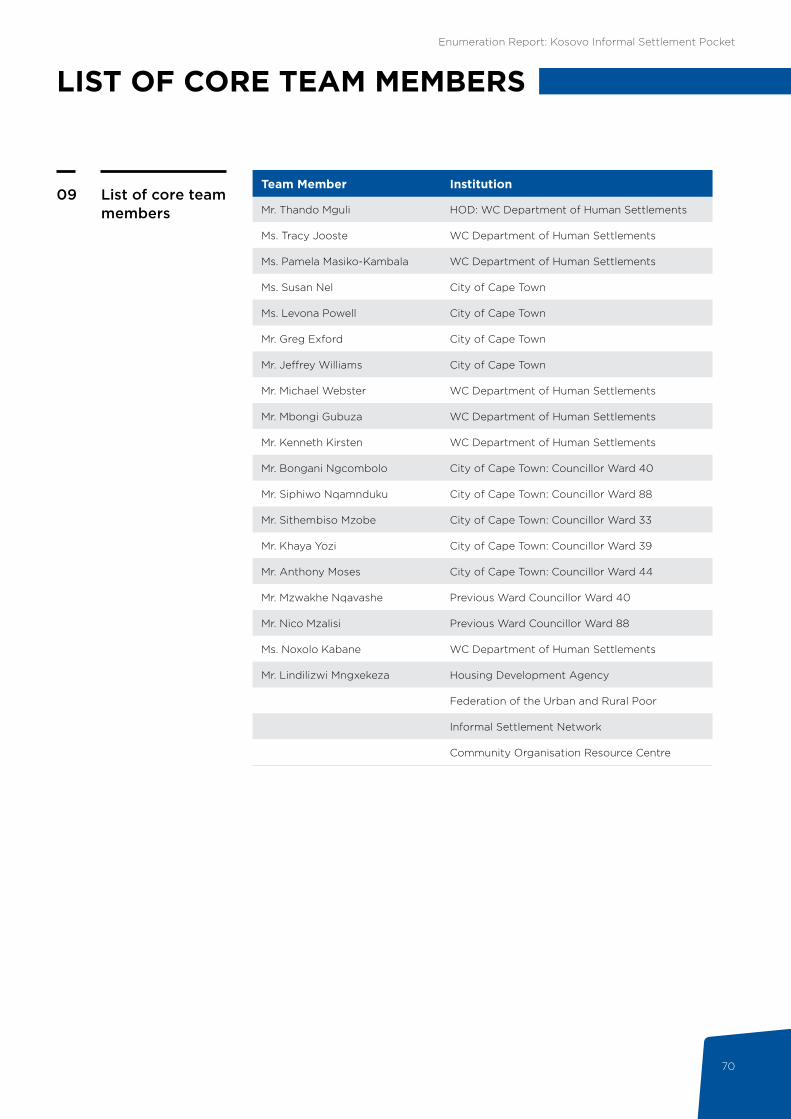
Enumeration Report: Kosovo Informal Settlement Pocket
70
List of core team members
09Team Member Institution
Mr. Thando Mguli HOD: WC Department of Human Settlements
Ms. Tracy Jooste WC Department of Human Settlements
Ms. Pamela Masiko-Kambala WC Department of Human Settlements
Ms. Susan Nel City of Cape Town
Ms. Levona Powell City of Cape Town
Mr. Greg Exford City of Cape Town
Mr. Jeffrey Williams City of Cape Town
Mr. Michael Webster WC Department of Human Settlements
Mr. Mbongi Gubuza WC Department of Human Settlements
Mr. Kenneth Kirsten WC Department of Human Settlements
Mr. Bongani Ngcombolo City of Cape Town: Councillor Ward 40
Mr. Siphiwo Nqamnduku City of Cape Town: Councillor Ward 88
Mr. Sithembiso Mzobe City of Cape Town: Councillor Ward 33
Mr. Khaya Yozi City of Cape Town: Councillor Ward 39
Mr. Anthony Moses City of Cape Town: Councillor Ward 44
Mr. Mzwakhe Nqavashe Previous Ward Councillor Ward 40
Mr. Nico Mzalisi Previous Ward Councillor Ward 88
Ms. Noxolo Kabane WC Department of Human Settlements
Mr. Lindilizwi Mngxekeza Housing Development Agency
Federation of the Urban and Rural Poor
Informal Settlement Network
Community Organisation Resource Centre
LIST OF CORE TEAM MEMBERS
sasdialliance.org.za
South African SDI Alliance
@SASDIAlliance
vimeo.com/sasdialliance
w
e
A member of the SA SDI Alliance