Korea - Republic of North Korea Food Grain Situation in MY ... GAIN Publications/North Korea...
13
THIS REPORT CONTAINS ASSESSMENTS OF COMMODITY AND TRADE ISSUES MADE BY USDA STAFF AND NOT NECESSARILY STATEMENTS OF OFFICIAL U.S. GOVERNMENT POLICY - Date: GAIN Report Number: Post: Report Categories: Approved By: Prepared By: Report Highlights: Based on data from the Democratic People’s Republic of Korea (DPRK) and United Nations agencies, the estimated net deficiency in food grains and other crops on a grain equivalent basis (potatoes and soybeans) increased dramatically from 29,000 metric tons in marketing year (MY) 2014/15 (November/October) to 392,000 metric tons in MY 2015/16. This estimated net shortage was primarily a result of lower rice production caused by drought and a continued trend in decreasing imports. Despite the food grain deficiency, food prices have remained relatively stable, which suggests the numbers here may not show a complete picture of food availability, as the total cross-border trade with China is difficult to estimate. While flooding occurred in August 2016, the effects will be seen in the potato crop for MY 2016/17. Although United Nations sanctions do not prohibit grain trade or humanitarian aid, the perceived increase in difficulty in doing business within the country has greatly limited the willingness of exporters and donors to focus on the North Korean market. Sunchul Choi/ Amanda F. Hinkle Ross G. Kreamer Agricultural Situation North Korea Food Grain Situation in MY 2015-2016 Seoul Korea - Republic of KS1707 3/6/2017 Public Voluntary
Transcript of Korea - Republic of North Korea Food Grain Situation in MY ... GAIN Publications/North Korea...

THIS REPORT CONTAINS ASSESSMENTS OF COMMODITY AND TRADE ISSUES MADE BY
USDA STAFF AND NOT NECESSARILY STATEMENTS OF OFFICIAL U.S. GOVERNMENT
POLICY
-
Date:
GAIN Report Number:
Post:
Report Categories:
Approved By:
Prepared By:
Report Highlights:
Based on data from the Democratic People’s Republic of Korea (DPRK) and United Nations agencies,
the estimated net deficiency in food grains and other crops on a grain equivalent basis (potatoes and
soybeans) increased dramatically from 29,000 metric tons in marketing year (MY) 2014/15
(November/October) to 392,000 metric tons in MY 2015/16. This estimated net shortage was primarily
a result of lower rice production caused by drought and a continued trend in decreasing
imports. Despite the food grain deficiency, food prices have remained relatively stable, which suggests
the numbers here may not show a complete picture of food availability, as the total cross-border trade
with China is difficult to estimate. While flooding occurred in August 2016, the effects will be seen in
the potato crop for MY 2016/17. Although United Nations sanctions do not prohibit grain trade or
humanitarian aid, the perceived increase in difficulty in doing business within the country has greatly
limited the willingness of exporters and donors to focus on the North Korean market.
Sunchul Choi/ Amanda F. Hinkle
Ross G. Kreamer
Agricultural Situation
North Korea Food Grain Situation in MY 2015-2016
Seoul
Korea - Republic of
KS1707
3/6/2017
Public Voluntary

General Information:
Production
On April 27, 2016 the World Food Program (WFP) released data covering staple food production in the
Democratic People’s Republic of Korea (DPRK) for marketing year (MY) 2015/16
(November/October). This data was based on calendar year 2015 official fall harvest estimates and
2016 early season crop production estimates by the DPRK Ministry of Agriculture (MoA) as well as
2015 crop production estimates of sloping lands and kitchen gardens (grown in upland areas) by the
WFP and the Food and Agriculture Organization of the United Nations (FAO). DPRK food production
is generally managed by the government on state-owned property. However, upland food production is
managed by private individuals looking to supplement their incomes.
In MY 2015/16, total production of grain and other crops on a grain equivalent basis (potatoes and
soybeans) reached an estimated 5.42 million metric tons (in cereal equivalent basis for potatoes and
paddy basis for rice), down 9.2 percent from the previous marketing year. Sharply declining rice
production after a severe drought in the planting season of 2015 (April – June 2015) accounts for most
of this total decline (see table 2).
Low precipitation in 2014 culminated in a severe drought during the 2015 planting season and a
shortage of water for irrigation, and led to an 11 percent reduction in harvested rice area from the
previous year. As a result, total rice production was down 26 percent from the previous year,
amounting to only 1.95 million metric tons (paddy rice basis). The drought especially impacted
irrigated rice planting in the important production areas of South Hwanghae and North Hwanghae
provinces, resulting in a 23 percent decline in harvested rice area in both provinces (see figure 1 & table
1).
Planted area for corn increased after land suffering from drought was converted from rice to corn
cultivation. However, despite an increase in corn planted area of five percent over the previous year,
corn production in the government-owned collective farms was estimated at 2.29 million metric tons,
down 2.6 percent from the previous year due to dry weather.
Drought-afflicted irrigated rice land was also converted to other crops. This increase in available arable
land led to an estimated increase in production of soybeans and other crops such as sorghum, millet and
buckwheat.
MoA and FAO both forecast the production of 2016 summer crops on government-managed lands at
around 363,000 metric tons, 35 percent higher than the 2015 summer harvest (see table 2). The 2016
summer crop projections include 297,000 metric tons of potatoes (cereal equivalent) and 66,000 metric
tons of wheat and barley. Severe flooding along the Tumen River in July 2016 did not impact
MY2015/2016 potato production, as this data includes harvests in November 2015 and June
2016. However, the flooding is expected to have severely impacted potatoes produced in the North
Hamyong province that were harvested in November 2016. As data becomes available, the flooding
and its impacts and will be discussed further in future GAIN reports.

FAO forecasts that in MY 2015/16 crop production outside of government management decreased from
the previous year to 203,000 metric tons of corn from sloping lands (terraced upland) farming and
75,000 metric tons from household gardens (50,000 tons of potatoes (cereal equivalent) and 25,000 MT
of corn).
Figure 1

Table 1
DPRK: 2015 Paddy Rice Crop Production
Province Planned Area
(HA)*
Harvested Area
(HA)
Yield
(Paddy,
Kg/HA)
Production
(MT,
Paddy)
Pyongyang 15,045 13,000 5,731 74,500
South Pyongan 84,234 74,100 5,532 409,900
North Pyongan 104,084 97,000 4,920 477,200
Chagang 6,284 5,900 4,712 27,800
South Hwanghae 144,500 121,900 3,081 375,600
North Hwanghae 48,889 27,200 2,871 78,100
Kangwon 27,856 21,800 3,592 78,300
South
Hamgyong
60,372 54,500 4,206 229,200
North
Hamgyong
23,402 26,000 4092 106,400
Ryangyang 1,412 1,300 3,000 3,900
Nampo 27,420 22,600 3,765 85,100
Total 543,498 465,200 4,183 1,945,800 Source: Ministry of Agriculture (MoA, DPRK)
*Planned area refers to land originally designated for rice production, but may include land that was not actually planted with
rice.
Table 2
DPRK: Food Crops Production
(1,000 Hectare, 1,000 Metric Tons)
Marketing Year MY 2013/2014
(November/October)
MY 2014/2015
(November/October)
MY 2015/2016
(November/October)
Commodity Area Production Area Production Area Production
Rice, Paddy 547 2,901 525 2,626 465 1,946
Corn 527 2,002 532 2,349 560 2,288
Others (wheat and other
grains)
26 66 26 54 45 156
Potatoes a/ 29 135 28 158 32 168
Soybeans 116 163 143 160 159 222
Fall Harvest Sub Total 1,245 5,267 1,254 5,347 1,261 4,780
Wheat and Barley 54 53 44 36 47 66b/
Potatoes a/ 122 290 100 233 126 297
b/
Summer Harvest Sub
Total
176 342 144 269 173 363b/
National Total 1,421 5,609 1,398 5,616 1,434 5,143
Sloping Land c/ 550 220 550 220 550 203
Household Gardens d/
25 75 25 75 25 75
Grand Total 1,996 5,909 1,973 5,911 2,009 5,421

Source: WFP/FAO
a/ On a 4:1 cereal equivalent basis
b/ Projection to harvest in summer 2016
c/ Corn grown in the upland areas
d/ Composed of 50,000 MT of potatoes and 25,000 MT of corn
Table 3
DPRK: Comparison between Projection and Production of Summer Harvest Crops
(1,000 Metric Ton)
Marketing Year
(Nov./Oct)
MY 2013/14 MY 2014/15 MY 2015/16
Commodity Projection Production Projection Production Projection Production
Wheat and Barley 105 53 60 36 66 Na
Potatoes 316 290 241 233 297 Na
Total 421 342 301 269 363 Na
Accomplishment
(%)
81 89 Na
Source: WFP/FAO
Projections are made during the fall season before planting. Production numbers are made available after harvesting in the
spring.
Table 4
DPRK: Grain/Staple Food Production in Cereal Equivalent
(1,000 MT, milled)
Marketing Year
(Nov/Oct)
Grand
Total
Soybeans 5/
Potatoes 1/
Grains
Total Rice 2/
Corn3/
Others 4/
2010/11 4,251 185 469 3,597 1,601 1,858 138
2011/12 4,475 294 324 3,857 1,635 2,102 120
2012/13 4,821 202 430 4,189 1,769 2,285 135
2013/14 4,952 196 475 4,281 1,915 2,247 119
2014/15 (A) 5,050 192 441 4,433 1,733 2,594 90
2015/16 (B) 4,803 266 515 4,022 1,284 2,516 222
Change (B-A) -247 -74 +74 -411 -449 -78 +132
Source: WFP/FAO
1/ Potatoes are measured on a 4:1 cereal equivalent basis
2/ Milled basis with 66 percent of paddy to rice milling rate 3/ includes corn production from sloping land and household
gardens 4/ Other grains such as wheat, barley, sorghum and millet 5/ cereal equivalent using a factor of 1.2
Table 5
DPRK: Fertilizer Supply Status for 2008-2015
(Metric Tons)
Year Domestic Production Import/
Assistance
Carried- Over Stocks Application Ending Stocks

2008 274,640 181,157 1,400 456,297 900
2009 181,266 266,817 900 445,983 3,000
2010 198,066 299,250 3,000 498,816 1,500
2011 199,357 548,108 1,500 745,965 3,000
2012 243,041 483,586 3,000 726,627 3,000
2013 na na na 707,199 na
2014 na na na 749,670 na
2015 na na na 622,606 na
Source: North Korean Ministry of Agriculture, WFP/FAO Report (2014)
Table 6
DPRK: Fertilizer Imports from China for 2008-2016
(Metric Tons)
Year Jan-Mar Apr-Jun Jul-Sep Oct-Dec Total
2008 7,098 14,390 6,442 3,703 31,633
2009 27,553 31,420 46,534 480 105,987
2010 40,677 58,911 183,444 4,271 287,303
2011 25,467 164,979 164,317 324 355,087
2012 6,531 207,343 38,278 638 252,790
2013 28,725 110,436 46,408 21,765 207,334
2014 69,085 40,446 6,007 26,510 142,048
2015 16,684 30,978 22,235 1,084 70,981
2016 148,654 3,576 na na 152,230
Source: (Korea International Trade Association) KITA, Global Trade Atlas (GTA)
Consumption
For MY 2015/16 (Nov/Oct), WFP/FAO estimated that total DPRK utilization of grain and other crops
on a grain equivalent basis was 5.50 million tons. Converting total domestic crop production into grain
equivalent yields 4.8 million metric tons, which consists of 1.3 million metric tons of milled rice, 2.5
million metric tons of corn, 0.52 million tons of potatoes (cereal equivalent), 0.27 million metric tons of
soybeans (cereal equivalent) and 0.2 million metric tons of other grains. Therefore, the estimated gap
between production and utilization is 692,000 metric tons. As expected DPRK imports were only
300,000 metric tons during this marketing year, the unmet deficit of food grains is estimated to be
392,000 metric tons (see table 7). This shortage is significantly greater than the shortage of 29,000
metric tons in MY 2014/15. While this shortage is significant, food prices in the DPRK have remained
stable as marketization has taken hold in the country. The stability of prices, along with the difficulty of
estimating true trade across the DPRK-China border, leads Post to conclude that the grains shortage
reported here may be being tempered by movement of foods and money throughout the country.

Table 7
DPRK: Food Balance Sheet
(November/October, 1,000 MT)
Marketing Year MY2012/13 MY2013/14 MY2014/15 MY2015/16
Production, Total (A) 4,821 4,952 5,050 4,803
Rice 1/
1,769 1,915 1,733 1,284
Corn 2/
2,285 2,247 2,594 2,516
Wheat/Barley 76 53 36 66
Other Grains 59 66 54 156
Potatoes 3/
430 475 441 515
Soybeans 4/
202 196 192 266
Utilization, Total (B) 5,291 5,370 5,489 5,495
-Food 4,298 4,315 4,341 4,383
-Feed 120 120 120 120
-Seed 210 209 225 238
-Loss 663 726 803 754
Balance (A-B) -470 -418 -439 -692
Import 330 3005/
4105/
3005/
Shortage -140 -118 -29 -392 Source: WFP/FAO
1/ Milled basis with 66 percent of paddy to rice milling rate 2/ includes corn production from sloping land and household
gardens 3/ Potatoes are measured on a 4:1 cereal equivalent basis 4/ cereal equivalent using a factor of 1.2
5/ Forecast commercial imports including food aid
Table 8
DPRK: Food Balance Sheet for MY 2015/16
(November/October, 1,000 MT)
Commodity Rice 1/
Corn Wheat/
Barley
Others Potatoes 2/
Soybeans 3/
Total
Total Supply 1,284 2,516 66 156 515 266 4,803
Fall Harvest 1,284 2,288 - 156 168 266 4,162
Summer Harvest - - 66 - 2297 - 363
Slope Farm (Upland) - 203 - - - - 203
Garden Farm (Upland) - 25 - - 50 - 75
Total Use 1,705 2,654 182 165 515 275 5,495
Food 1,455 2,052 156 133 336 251 4,383
Feed - 100 - - 20 - 120
Seed 50 74 16 7 81 22 238
Loss 200 428 11 26 77 13 754
Deficiency 421 138 116 9 0 11 694
Imports 4/
- - - - - - 300

Net Deficiency - - - - - - 394
Source: WFP/FAO
1/ Applicable paddy to rice milling rate at 66 percent
2/ Cereal equivalent at 25 percent
3/ Cereal equivalent at 120 percent
4/ Forecast
Imports & Humanitarian Aid
In CY 2015, DPRK imported 107,000 metric tons of food grains in the form of commercial imports and
food aid. Commercial imports totaled 79,000 metric tons, consisting mainly of wheat flour, corn, rice
and soybeans from China and Ukraine. Food aid was primarily given as multilateral food assistance
from WFP/FAO (see Table 9), and totaled 28,204 metric tons.
In CY 2016, total reported food grain imports including food aid are forecast at only 100,000 metric
tons. This number is significantly lower than the number of forecast imports (table 8) because it
represents only the official reported number. One major change that has been taking place in recent
years is an increase in marketization of North Korea, which has led to more trade in grains in an
unofficial capacity.
The decrease in both food aid and commercial imports may have been caused inadvertently by
tightening UN sanctions policies. While commercial food trade and humanitarian aid are not restricted
by current sanctions, humanitarian agencies have reported that banks are reluctant to make money
transfers to North Korea, and shipments of humanitarian goods are sometimes blocked. The perception
that these types of difficulties are inevitable has also prevented would-be donors from contributing.
Despite these constraints, in recent years the DPRK has increased marketization of commodities and
developed a distribution industry. These changes have resulted in a more competitive market with
relatively stable prices. Commodities are able to move relatively unimpeded from the border region to
other areas throughout the country. These market forces, combined with high demand for food coming
from China that may not be reflected in official trade numbers, suggest that the food deficit in the
DPRK may not be as great as the numbers here imply.
Table 9
DPRK: Estimated Grains1/
Import by Origin
(Unit: 1,000 Metric Tons)
Commercial Imports Food Aid
Cal.
Year
Chin
a
Russi
a
US
A
Ukrain
e
Austral
ia
Braz
il
Sub
Tota
l
Other
s 2/
Korea Gran
d
Total Go
v
Privat
e
2009 204 2 0 0 0 15 221 31 0 0 253
2010 314 0 7 0 0 0 321 37 0 0 358
2011 376 60 0 0 21 0 457 408 0 0 865
2012 282 1 0 0 0 0 283 400 0 0 683
2013 298 0 0 4 0 27 329 102 0 0 427

2014 161 46 0 12 0 0 219 65 0 0 272
2015 48 3 0 28 0 0 79 28 0 0 107
2016
a/
35 7 0 14 0 0 56
27 0 0 83
Source: Global Trade Atlas (GTA); Data based on export data from supplying countries; WFP/FAO; KOTRA
1/ includes wheat flour and pulses.
2/ ‘Others’ includes grains supplied through international organizations such as WFP on marketing year (November/October)
basis.
a/ January – September. Note that this import number is different from that in Table 8 due to different reporting periods
(MY versus FY) and different sources used.
Table 10
DPRK: Food Grain and Oilseeds Import from China
(Calendar year, Metric Ton)
Commodity 2011 2012 2013 2014 2015 2016a/
Wheat 0 0 0 0 0 0
Rye 0 0 0 0 0 0
Barley 1 600 0 1 0 0
Oats 0 0 0 0 0 0
Corn 135,751 54,444 76,572 15,658 9,891 1,758
Rice 92,242 49,010 49,528 63,884 17,138 30,169
Sorghum 0 0 0 24 0 0
Others 3,302 637 960 720 120 0
Subtotal, Grains 231,296 104,691 127,060 80,287 27,149 31,927
Wheat Flour 124,963 157,704 155,886 78,967 14,437 3,022
Soybeans 20,171 19,236 15,311 2,019 6,015 147
Grand Total 376,430 281,631 298,257 161,273 47,601 35,096 Source: Global Trade Atlas, China Customs
a/ January - September
Appendix
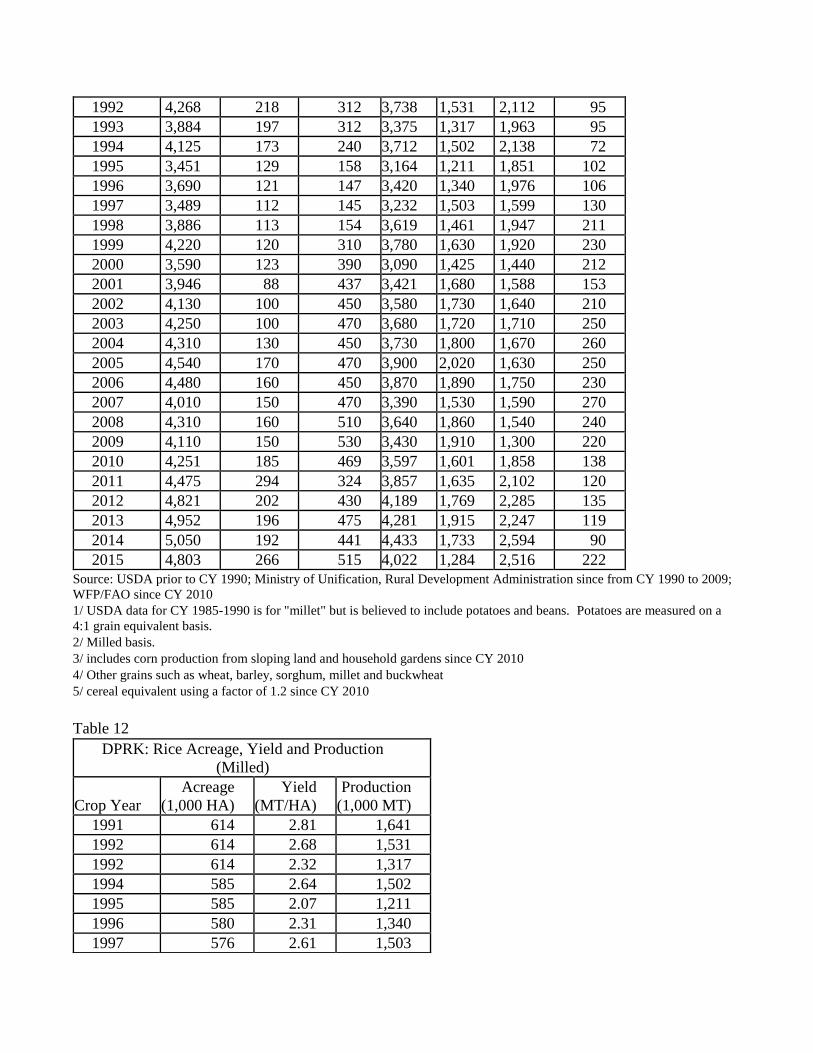
Table 11
DPRK: Grain/Staple Food Production
(1,000 MT)
Crop Year
Grand
Total
Beans1/ 5/
Potatoes1/
Grains
Total Rice2/
Corn3/
Others4/
1985 5,311 535 4,776 2,113 2,536 127
1986 5,939 545 5,394 2,387 2,864 143
1987 5,575 560 4,015 2,219 2,663 133
1988 5,376 565 4,811 2,129 2,554 128
1989 5,516 565 4,951 2,142 2,680 129
1990 4,861 565 4,296 1,800 2,380 116
1991 4,427 207 373 3,847 1,641 2,120 86
1992 4,268 218 312 3,738 1,531 2,112 95
1993 3,884 197 312 3,375 1,317 1,963 95
1994 4,125 173 240 3,712 1,502 2,138 72
1995 3,451 129 158 3,164 1,211 1,851 102
1996 3,690 121 147 3,420 1,340 1,976 106
1997 3,489 112 145 3,232 1,503 1,599 130
1998 3,886 113 154 3,619 1,461 1,947 211
1999 4,220 120 310 3,780 1,630 1,920 230
2000 3,590 123 390 3,090 1,425 1,440 212
2001 3,946 88 437 3,421 1,680 1,588 153
2002 4,130 100 450 3,580 1,730 1,640 210
2003 4,250 100 470 3,680 1,720 1,710 250
2004 4,310 130 450 3,730 1,800 1,670 260
2005 4,540 170 470 3,900 2,020 1,630 250
2006 4,480 160 450 3,870 1,890 1,750 230
2007 4,010 150 470 3,390 1,530 1,590 270
2008 4,310 160 510 3,640 1,860 1,540 240
2009 4,110 150 530 3,430 1,910 1,300 220
2010 4,251 185 469 3,597 1,601 1,858 138
2011 4,475 294 324 3,857 1,635 2,102 120
2012 4,821 202 430 4,189 1,769 2,285 135
2013 4,952 196 475 4,281 1,915 2,247 119
2014 5,050 192 441 4,433 1,733 2,594 90
2015 4,803 266 515 4,022 1,284 2,516 222
Source: USDA prior to CY 1990; Ministry of Unification, Rural Development Administration since from CY 1990 to 2009;
WFP/FAO since CY 2010
1/ USDA data for CY 1985-1990 is for "millet" but is believed to include potatoes and beans. Potatoes are measured on a
4:1 grain equivalent basis.
2/ Milled basis.
3/ includes corn production from sloping land and household gardens since CY 2010
4/ Other grains such as wheat, barley, sorghum, millet and buckwheat
5/ cereal equivalent using a factor of 1.2 since CY 2010
Table 12
DPRK: Rice Acreage, Yield and Production
(Milled)
Crop Year
Acreage
(1,000 HA)
Yield
(MT/HA)
Production
(1,000 MT)
1991 614 2.81 1,641
1992 614 2.68 1,531
1992 614 2.32 1,317
1994 585 2.64 1,502
1995 585 2.07 1,211
1996 580 2.31 1,340
1997 576 2.61 1,503

1998 576 2.54 1,461
1999 580 2.81 1,630
2000 545 2.61 1,425
2001 572 2.94 1,680
2002 576 3.00 1,730
2003 582 2.96 1,720
2004 582 3.09 1,800
2005 584 3.46 2,020
2006 586 3.23 1,890
2007 587 2.60 1,530
2008 587 3.17 1,860
2009 587 3.26 1,910
2010 570 2.77 1,577
2011 571 2.81 1,610
2012 563 3.14 1,769
2013 547 3.55 1,915
2014 525 3.30 1,733
2015 465 2.76 1,284
Source: Ministry of Unification (MOU), Rural Development Administration (RDA) from CY 1991 to 2009; WFO/FAO
since CY 2010.
Table 13
DPRK: Corn Acreage, Yield and Production
Crop Year
Acreage
(1,000 HA)
Yield
(MT/HA)
Production
(1,000 MT)
1991 670 3.16 2,120
1992 660 3.20 2,112
1992 650 3.02 1,963
1994 650 3.29 2,138
1995 650 2.85 1,851
1996 600 3.29 1,976
1997 641 2.49 1,599
1998 629 3.10 1,947
1999 570 3.37 1,920
2000 543 2.65 1,440
2001 543 2.93 1,588
2002 527 3.11 1,639
2003 526 3.25 1,710
2004 526 3.17 1,670
2005 526 3.10 1,630
2006 526 3.33 1,750
2007 526 3.02 1,590
2008 526 2.89 1,540

2009 526 2.48 1,300
2010 503 3.35 1,683
2011 503 3.70 1,857
2012 531 3.80 2,040
2013 527 3.80 2,002
2014 532 4.42 2,349
2015 560 4.09 2,288
Source: Ministry of Unification (MOU), Rural Development Administration (RDA) from CY 1991 to 2009; WFO/FAO
since CY 2010, which doesn’t include corn production from sloping land and household gardens.
Table 14
DPRK: Estimated Grain1/
Imports by Origin
(Unit: 1,000 Metric Ton)
Commercial Imports Food Aid
Cal
.
Yea
r
Chi
na
Syri
a
Thaila
nd
Cana
da
Japa
n
E
U
Braz
il
Sub
Tot
al
Other
s1
Korea Gran
d
Tota
l
Go
v
Priva
te
199
1
300 0 90 350 0 0 na 740
550 0 0 1,29
0
199
2
620 0 20 80 0 0 na 720
110 0 0 830
199
2
740 0 78 160 0 0 na 978
115 0 0 1,09
3
199
4
305 0 52 0 0 0 na 357
133 0 0 490
199
5
153 0 162 0 370 0 na 685
277 15
1
4 1,11
7
199
6
547 140 30 0 132 11
5
na 964
301 0 0 1,26
5
199
7
867 34 38 0 0 82 na 1,02
1
576 0 80 1,67
7
199
8
288 104 0 0 59 20 na 471
579 0 77 1,12
7
199
9
238 61 0 0 0 40 na 339
751 0 9 1,09
9
200
0
283 0 284 0 106 22 na 695
512 0 0 1,20
7
200
1
436 5 0 0 500 0 553 1,49
4
437 0 0 1,93
1
200
2
219 0 200 0 0 0 52 471
586 35
8
0 1,41
5
200
3
349 0 95 51 0 10 76 581
304 44
2
0 1,32
7
200 90 0 184 0 0 3 138 415 304 10 0 824

4 5
200
5
327 0 100 14 0 15 0 456
404 40
0
0 1,26
0
200
6
79 0 2 0 0 0 111 192
19 90 0 301
200
7
136 0 212 1 0 0 18 367
30 16
1
0 558
200
8
119 0 14 0 20 0 0 153
129 0 0 282
Source: Korea Trade-Investment Promotion Agency (KOTRA), and Ministry of Unification (MOU).
1/ Excludes grain flours and pulses.
Note: ‘Others’ includes grains supplied through international organization such as WFP.