KORDI Environmental Study_Juwon Son
36
The Current Activities of KORDI’s Environmental Study for Deep-Sea Mining The Current Activities of KORDI’s Environmental Study for Deep-Sea Mining June 7, 2011 June 7, 2011 Ju-Won Son K orea Ocean R esearch & Development Institute Deep-S ea & Marine Geores ources Researc h Department K orea Ocean R esearch & Development Institute Deep- Sea & Marine Geore sourc es Researc h Department
-
Upload
seni-nabou -
Category
Documents
-
view
221 -
download
0
Transcript of KORDI Environmental Study_Juwon Son

8/6/2019 KORDI Environmental Study_Juwon Son
http://slidepdf.com/reader/full/kordi-environmental-studyjuwon-son 1/38
The Current Activities of KORDI’sEnvironmental Study for Deep-Sea Mining
The Current Activities of KORDI’sEnvironmental Study for Deep-Sea Mining
June 7, 2011June 7, 2011
Ju-Won Son
K orea Ocean R esearch & Development Institute
Deep-Sea & Marine Georesources Research Department
K orea Ocean R esearch & Development Institute
Deep-Sea & Marine Georesources Research Department

8/6/2019 KORDI Environmental Study_Juwon Son
http://slidepdf.com/reader/full/kordi-environmental-studyjuwon-son 2/38
ContentsContents
1. Case study 1: Equatorial Pacific for Mn nodule
Mining Program
2. Case study 2: Southwest Pacific & Central IndianRidge for Sulfide Deposits Mining Program (SDMP)
K orea Ocean R esearch & Development Institute
Deep-Sea & Marine Georesources Research Department
K orea Ocean R esearch & Development Institute
Deep-Sea & Marine Georesources Research Department

8/6/2019 KORDI Environmental Study_Juwon Son
http://slidepdf.com/reader/full/kordi-environmental-studyjuwon-son 3/38
Mn nodule Mining Programin the Equatorial Pacific
Case study 1

8/6/2019 KORDI Environmental Study_Juwon Son
http://slidepdf.com/reader/full/kordi-environmental-studyjuwon-son 4/38
1. Deep-Sea Mn nodule Mining Program –
Environmental study (KODOS)
§ Objective
- To understand the physical, chemical, biological, and geological
properties of the interesting areas
- To evaluate the environmental impacts of the deep-sea floor mining
activities in northeast Equatorial Pacific
§ Summary
- Multi-year research program (from 1989 to current) & to be continued
- Field observations, mainly focused on the deep-sea Mn mining
development

8/6/2019 KORDI Environmental Study_Juwon Son
http://slidepdf.com/reader/full/kordi-environmental-studyjuwon-son 5/38
Detail sampling protocols were described at Chapter 10, Data Standards utilized in the environmental studies of KORDI.In: Standardization of environmental data and information-Development of guidelines (ISA, 2002)
Group Environmental items Methods and Instruments
PhysicalOceanography
- Surface oceanographic structure - CTD
- Current condition - Current meter and ADCP
- Particulate matter in discharge depth - Filteration
- Satellite-data analysis - SeaWiFS satellite image
Chemical
Oceanography
- D.O., pH, Inorganic Nutrients - Titration, pH meter, Nutrients auto analyzer
- Total organic carbon - TOC analyzer
- Chemical exchange between the sediment and the water
column- ? Benthic Chamber
- Trace metals in water column - ? ICP-MS
Sediment
properties
- Geotechnical properties- MC, Pycnometer, motorised vane system, automatic grain size
analyzer
- Pore chemistry, Organic carbon - IC, Elemental analyzer
- Metal contents of manganese nodule - ICP-AES
Biological
Communities
- Microorganism at water column and sediments - Scint il la tion counter, Microscope, Luminometer
- Pelagic communities- Flow cytometric analysis, Microscope, Net, Scintillation counter,
Elemental analyzer
- Benthic fauna - MC, BC, Microscope, Deep sea camera
- Nodule fauna - MC, BC, Microscope, Deep sea camera
- Demersal scavenger - ? Freefall benthos observation system
- Benthic impact experiments - ?
Bioturbation- Sediments-mixing rate - MC, BC, 210Pb
- Rate of bioturbation - MC, BC, 210Pb
Sedimentation - Vertical mass flux - Sediments Trap
Environmental items (ISA recommended)Environmental items (ISA recommended)

8/6/2019 KORDI Environmental Study_Juwon Son
http://slidepdf.com/reader/full/kordi-environmental-studyjuwon-son 6/38
KOMO1 CTD3 CTD4
CTD5
CTD6
CTD2CTD1
CTD7
CTD8
133.0 132.0 131.0 130.0
Longitude (OW)
9.0
10.0
11.0
12.0
L a t i t u d e ( O N )
KR5
KR2
131.0 130.5
Longitude(O
W)
16.0
16.5
L a t i t u d e ( O N )
CTD9
CTD10
CTD12
CTD LADCP
BC, MC
KORDI Environmental surveysKORDI Environmental surveysuu survey areassurvey areas
nn 19951995~~2010 : 131.32010 : 131.3OOW, 10.5W, 10.5OON (KOMO, LongN (KOMO, Long--term Monitoring St. )term Monitoring St. )
nn 1998, 1999, 2000, 2003, 2005 : 01998, 1999, 2000, 2003, 2005 : 0OO~~1717OON, along 131.5N, along 131.5OOW (Latitudinal, n=18)W (Latitudinal, n=18)
nn 2001, 2002, 2004 : 1282001, 2002, 2004 : 128OO~~136136OOW, along 10.5W, along 10.5OON (Longitudinal, n=9)N (Longitudinal, n=9)
nn 20062006~~2010 : KR2 (n=14) and KR52010 : KR2 (n=14) and KR5 (n=70)(n=70)
Map showing mining contracted areas in thenortheast equatorial Pacific.
136 134 132 130 128 1260
2
4
6
8
10
12
14
16
Longitude (OW)
L a t i t u d e ( O N )
1998
1999
2000
2001
2002
2003
2004
2005
2006
2007
2008
2009
2010
1998-2010 2010
KOMO2 CTD11

8/6/2019 KORDI Environmental Study_Juwon Son
http://slidepdf.com/reader/full/kordi-environmental-studyjuwon-son 7/38
§ Research Activities
Ø Zooplankton sampling
Ø Multiple Corer Ø Box Corer
Ø CTD Ø Sediment trapØ Sediment trap
Ø Mesocosm experiments

8/6/2019 KORDI Environmental Study_Juwon Son
http://slidepdf.com/reader/full/kordi-environmental-studyjuwon-son 8/38
Case study 1- ResultsCase study 1- Results

8/6/2019 KORDI Environmental Study_Juwon Son
http://slidepdf.com/reader/full/kordi-environmental-studyjuwon-son 9/38
nn South Equatorial Current (SEC) : 10South Equatorial Current (SEC) : 10oS~3S~3oNN
nn
North Equatorial Counter Current (NECC) : 3North Equatorial Counter Current (NECC) : 3
o
N~8N~8
o
NNnn North Equatorial Current (NEC) : 8North Equatorial Current (NEC) : 8oN~20N~20oNN
Divergence
Convergence
Meridional distributions of 3 major currents in the northeastern
equatorial Pacific in 1996, 1998, 1999, 2000, 2003, 2005, and 2007
Physical properties - LatitudinalPhysical properties - Latitudinal
5 6 7 8 9 10 11 12
0
50
100
150
200
D e p t h ( m )
(D)KODOS0310
12
14
16
18
20
22
24
26
28
Divergence
NECC NEC
Convergence
Latitude( N)o
10
12
14
16
18
20
22
24
26
28
200
150
100
50
0
D e p t h ( m )
(C)KODOS001 0
1 2
1 4
1 6
1 8
2 0
2 2
2 4
2 6
2 8
NECC NEC
Divergence
Convergence
200
150
100
50
0
D e p t h ( m )
(B)KODOS991 0
1 2
1 4
1 6
1 8
2 0
2 2
2 4
2 6
2 8
Divergence
NECC NEC
Convergence
200
150
100
50
D e p t h ( m )
0
(A)KODOS98
NECC NECSEC
Convergence
Temperature( C)o
Divergence
Meridional distributions of temperature in the northeastern
equatorial Pacific in 1998, 1999, 2000, and 2003

8/6/2019 KORDI Environmental Study_Juwon Son
http://slidepdf.com/reader/full/kordi-environmental-studyjuwon-son 10/38
Physical properties - bottom currentPhysical properties - bottom current
Summarize of the bottom current velocities and main directions
Water Depth/
Altitude
(m)
Current velocityProgressive vector current
velocity
Average
(cm/s)
Maximum
(cm/s)
Average
(m/day)
Main
direction
1,254 / 3,765 4.4 15.3 1,228 NE
5,004 / 15 3.5 10.6 1,044 NE, SE
nn LongLong--term monitoring results of the bottom currentterm monitoring results of the bottom current
(Jul. 2008 to Jul. 2009)(Jul. 2008 to Jul. 2009)
Stick plots of current velocity(15 m above the bottom)
Progressive vector diagram of currentvelocity (15 m above the bottom)

8/6/2019 KORDI Environmental Study_Juwon Son
http://slidepdf.com/reader/full/kordi-environmental-studyjuwon-son 11/38
Chemical properties – DO & TOCChemical properties – DO & TOC
nn Vertical distribution of dissolved oxygen (DO) and total Vertical distribution of dissolved oxygen (DO) and total
organic carbon (TOC)organic carbon (TOC)
0
500
1000
1500
2000
2500
3000
3500
4000
0.0 0.5 1.0 1.5 2.0
Total Organic Carbon (mg/l)
TOC=1.56×e-0.1006×Ln(D)
TOC (mg/L)
Vertical distribution of DO in studyarea shows general pattern of open ocean
Vertical structure of TOC in studyarea (ROM = 0.7 mg/L)
Oxygen Minimum layer
0
1
2
3
4
5
0 10 20 30
Temperature (oC)
Deeper layer
Sea floor
Middle layer
(permanent thermocline )
Surface layer
Typical structure of watercolumn in the northeastEquatorial Pacific.

8/6/2019 KORDI Environmental Study_Juwon Son
http://slidepdf.com/reader/full/kordi-environmental-studyjuwon-son 12/38
Chemical properties - NutrientsChemical properties - Nutrients
nn Vertical distribution of inorganic nutrients (2007) Vertical distribution of inorganic nutrients (2007)
((nitrate+nitritenitrate+nitrite , phosphate, silicate) , phosphate, silicate)
Vertical distribution of inorganic nutrient in study area shows general pattern of open ocean. The greencolor bar indicate a permanent thermocline
Nitrite+Nitrate
0
500
1000
1500
2000
2500
3000
3500
4000
4500
0 20 40 60
Concentration (μM)
Phosphate
0
500
1000
1500
2000
2500
3000
3500
4000
4500
0 1 2 3 4
Concentration (μM)
Silicate
0
500
1000
1500
2000
2500
3000
3500
4000
4500
0 50 100 150
Concentration (μM)
Permanent thermocline

8/6/2019 KORDI Environmental Study_Juwon Son
http://slidepdf.com/reader/full/kordi-environmental-studyjuwon-son 13/38
nn Vertical distributions of nutrients Vertical distributions of nutrients
Spatial distribution of nutrientsSpatial distribution of nutrients
Latitudinal vertical distributions of nutrients (N, P, and Si) (2003,2005)
NorthSouthLatitude ( N)
200
150
100
50
0
D e p t h ( m )
5 6 7 8 9 10 11 12 13 14 15 16 17
2
6
10
14
18
22
26
30
34
Nitrite+Nitrate (mM)
Latitude ( N)
200
150
100
50
0
D e p t h ( m )
5 6 7 8 9 10 11 12 13 14 15 16 17
0.2
0.6
1.0
1.4
1.8
2.2
2.6
3.0
3.4
Phosphate (mM)
Latitude ( N)
200
150
100
50
0
D e p t h ( m )
5 6 7 8 9 10 11 12 13 14 15 16 17
2
6
10
14
18
22
26
30
34
Silicate (mM)
Latitude ( N)
200
150
100
50
0
D e p t h ( m )
0 1 2 3 4 5 6 7 8 9 10 11 12
2
6
10
14
18
22
26
30
34
Nitrite+Nitrate (mM)
Latitude ( N)
200
150
100
50
0
D e p t h ( m )
0 1 2 3 4 5 6 7 8 9 10 11 12
0.2
0.6
1.0
1.4
1.8
2.2
2.6
3.0
3.4
Phosphate (mM)
Latitude ( N)
200
150
100
50
0
D e p t h ( m )
0 1 2 3 4 5 6 7 8 9 10 11 12
2
6
10
14
18
22
26
30
34
Silicate (mM)
N
P
Si
N
P
Si2003
NorthSouth
2005
Longitude ( W)
200
150
100
50
0
D e p t h ( m )
Nitrate + Nitrite (μ M)
136 135 134 133 132 131 130 129 128
2.0
6.0
10.0
14.0
18.0
22.0
26.0
30.0
34.0
38.0
Longitude ( W)
200
150
100
50
0
D e p t h ( m )
Phosphate (μ M)
136 135 134 133 132 131 130 129 128
0.0
0.4
0.8
1.2
1.6
2.0
2.4
Longitude ( W)
200
150
100
50
0
D e p t h ( m )
Silicate (μ M)
136 135 134 13 3 132 131 130 12 9 128
2.0
6.0
10.0
14.0
18.0
22.0
26.0
30.0
N
P
Si 2004
East West
Longitudinal vertical distributions of nutrients (N, P, and Si) (2004)
Divergence
Convergence
DivergenceDivergence
Convergence
8/6/2019 KORDI Environmental Study_Juwon Son
http://slidepdf.com/reader/full/kordi-environmental-studyjuwon-son 14/38
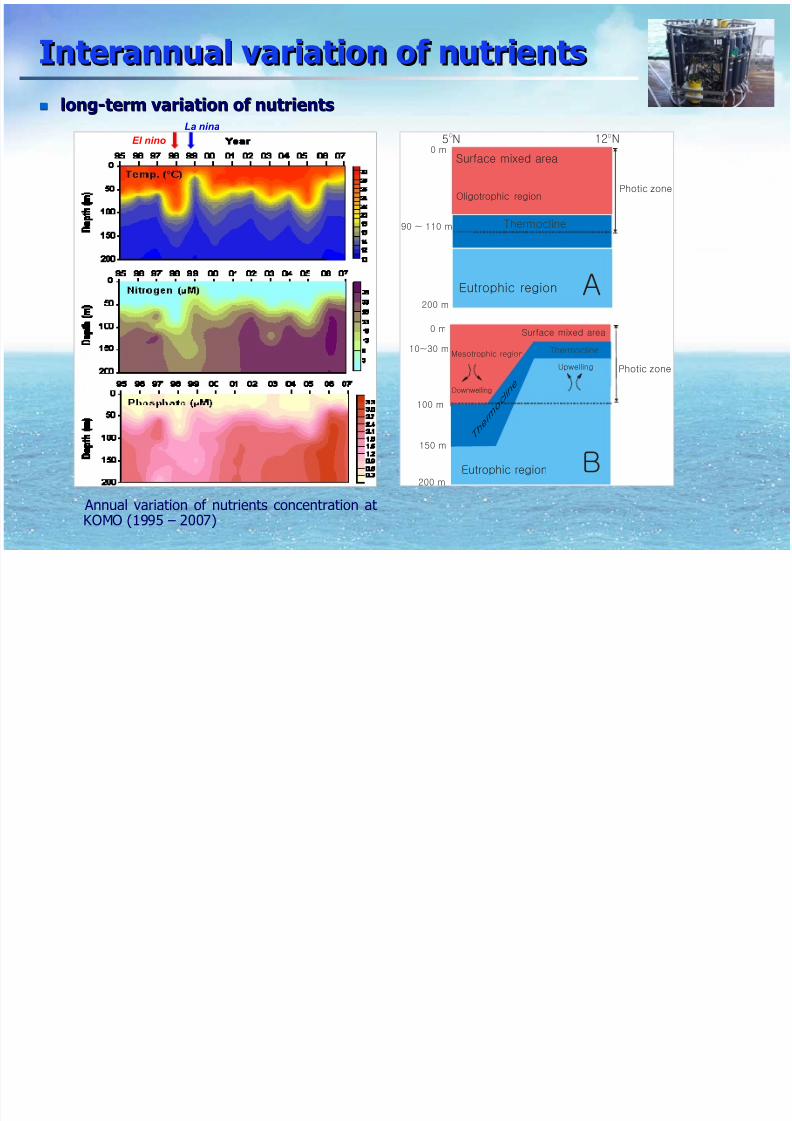
nn longlong--term variation of nutrientsterm variation of nutrients
Interannual variation of nutrientsInterannual variation of nutrients
El nino
La nina
Annual variation of nutrients concentration atKOMO (1995 – 2007)
200 m
90 ~ 110 m
100 m
150 m
200 m
0 mSurface mixed area
Surface mixed area
AEutrophic region
Thermocline
10~30 m
0 m
Oligotrophic regionPhotic zone
Photic zone
BEutrophic region
Mesotrophic region
5 N 12 N
O O
T h e r m
o c l i n e
Thermocline
Upwelling
Downwelling

8/6/2019 KORDI Environmental Study_Juwon Son
http://slidepdf.com/reader/full/kordi-environmental-studyjuwon-son 15/38

8/6/2019 KORDI Environmental Study_Juwon Son
http://slidepdf.com/reader/full/kordi-environmental-studyjuwon-son 16/38
nn Composition and abundance of zooplankton (2005)Composition and abundance of zooplankton (2005)
Latitudinal distribution of mesozooplankton abundance insurface mixed layer and lower layer
Percentage of taxonomic groups in mesozooplankton atsurface mixed layer and lower layer
surface mixed layer
0
10,000
20,000
30,000
40,000
50,000
60,000
70,000
0° 1°N 2°N 4°N 5°N 6°N 7°N 9°N 10°N 10.5°N 11°N 12°N
lower layer
0
2,000
4,000
6,000
8,000
10,000
12,000
14,000
16,000
18,000
0° 2°N 4°N 5°N 6°N 7°N 9°N 10°N 10.5°N 11°N 12°N
Others
Larvae
Thaliaceans
Appendicularians
Copepods
Ostracods
Chaetognaths
Siphonophores
Foraminiferans &
Radiolarians
Pelagic ecosystem - zooplanktonPelagic ecosystem - zooplankton
Surface mixed layer
Ostracods
7.9%
Chaetognaths
6.6%
Siphonophores
2.3%
Foraminiferans &
Radiolarians
10.3%
Others
4.3%Larvae
4.1%Thaliaceans
1.7%
Appendicularians
7.6%
Copepods
55.3%
Lower layer
Appendicularians
3.3%
Thaliaceans
1.4%
Larvae
3.5%
Others
4.1%Foraminiferans &
Radiolarians
12.2%Siphonophores
1.7%
Ostracods
7.1%
Chaetognaths
5.3%
Copepods
61.3%

8/6/2019 KORDI Environmental Study_Juwon Son
http://slidepdf.com/reader/full/kordi-environmental-studyjuwon-son 17/38
0
5
10
15
20
25
30
35
40
45
50
S t. 1 S t. 2 S t. 5 S t. 7 S t. 9 S t.1 1 S t. 15 S t. 17 S t. 19 S t. 21 S t. 23 S t. 25 S t. 27 S t. 29 S t. 30
Nematodes Harpacticoids Nauplius Tardigrades Others
Benthic ecosystem - meiofaunaBenthic ecosystem - meiofauna
nn Species composition and abundance of Species composition and abundance of meiofaunameiofauna (2003)(2003)
Latitudinal abundance of dominant meiofauna groups
Comparison of abundance of total meiofauna in theKR5 area
Major meiofauna taxa in the KR5 area (A:Desmoscolex sp. (Nematodes), B: Tricoma sp.(Nematodes), C: Harpacticoid copepods, D:
Tardigrada)

8/6/2019 KORDI Environmental Study_Juwon Son
http://slidepdf.com/reader/full/kordi-environmental-studyjuwon-son 18/38
0
100
200
300
400
500
5 6 8 9 12 13 14 17
Latitude(oN)
Other
Nematoda
Foraminifera
Benthic ecosystem - macrofaunaBenthic ecosystem - macrofauna
nn Species composition and abundance of Species composition and abundance of macrofaunamacrofauna (2003)(2003)
Latitudinal abundance of dominant macrofaunagroups
Actinaria Foraminifera Deep-sea cucumber
Isopoda Polychaeta Macrura
Ophiuroidea Ostracoda Sea Anemone
Ø According to these biological results, the distribution of zooplankton andbenthos is mainly affected by their food source (the surface primaryproduction).
ØØ According to these biological results, the distribution of zoopl According to these biological results, the distribution of zooplankton andankton and
benthos is mainly affected by their food source (the surface pribenthos is mainly affected by their food source (the surface primarymary
production).production).

8/6/2019 KORDI Environmental Study_Juwon Son
http://slidepdf.com/reader/full/kordi-environmental-studyjuwon-son 19/38
Photographic examination - megafaunaPhotographic examination - megafauna
nn The photographs of The photographs of megafaunamegafauna obtained by deepobtained by deep--sea camera (2008)sea camera (2008)
Observation of species in the substrate at each photographing line
Fish
Species and Lines in KR5 DSC08-01 DSC08-02
Sea cucumber * *
Sea anemone * *
Sea star * *
Sea pen * *
Fish * *
Bivalve * -
Crustacean * *
Faecal cast * *
Phytodetritus * *
Burrow openings * *
Locomotion trace * *
Fish Sea anemone
Crustacean & Bivalve Sea Cucumber
Sea Star Jellyfish

8/6/2019 KORDI Environmental Study_Juwon Son
http://slidepdf.com/reader/full/kordi-environmental-studyjuwon-son 20/38
Latitudinal variation of sediment types in the study area
Sediment type characteristics in relation to latitude (2003)
Sediment propertiesSediment properties

8/6/2019 KORDI Environmental Study_Juwon Son
http://slidepdf.com/reader/full/kordi-environmental-studyjuwon-son 21/38
nn LongLong--term monitoring (at KOMO St.) of the particle massterm monitoring (at KOMO St.) of the particle mass
flux using sediment trap (2003flux using sediment trap (2003--2009)2009)
Particle Mass fluxParticle Mass flux
Ø The monthly variation of total mass flux (grey bar) was well matched with Chl-a concentration(green circle), and the mass flux also showed a seasonal variation.
Ø The moderate El Niño was accompanied by a significant reduction in total mass flux, and theopposite trend was observed for the moderate La Niña.

8/6/2019 KORDI Environmental Study_Juwon Son
http://slidepdf.com/reader/full/kordi-environmental-studyjuwon-son 22/38
SummarySummary
uu Seasonal andSeasonal and interannualinterannual variation of variation of physicophysico--chemical propertieschemical properties
have been detected in our study area.have been detected in our study area.
uu Strong spatial heterogeneity of pelagic and benthic communityStrong spatial heterogeneity of pelagic and benthic community
were found and benthic production were well coupled with pelagicwere found and benthic production were well coupled with pelagic
production.production.
uu Particle mass flux was well correlated with surface primaryParticle mass flux was well correlated with surface primary
production, particularly during episodic events.production, particularly during episodic events.
uu All of the result of baseline study not only provide useful All of the result of baseline study not only provide useful
information for the formulation of the mining code of the ISA buinformation for the formulation of the mining code of the ISA buttalso necessary to support the stable deepalso necessary to support the stable deep--sea mining.sea mining.

8/6/2019 KORDI Environmental Study_Juwon Son
http://slidepdf.com/reader/full/kordi-environmental-studyjuwon-son 23/38
Sulfide Deposits Mining Programin the Southwest Pacific & Central Indian Ridge
Case study 2

8/6/2019 KORDI Environmental Study_Juwon Son
http://slidepdf.com/reader/full/kordi-environmental-studyjuwon-son 24/38
2. Sulfide Deposits Mining Program (SDMP)
§ Objective
- To examine the tectonic properties of the active hydrothermal
site and establish the mining site of the sulfide deposits in the
southwest Pacific and Indian Ocean
- This research program started from 2000 & to be continued.
- Research mainly focused on the submarine hydrothermal system
in the study area (ex. Towing CTD-TOYO)
- Environmental monitoring study was also conducted to providethe basis for understanding the existing environment
§ Summary

8/6/2019 KORDI Environmental Study_Juwon Son
http://slidepdf.com/reader/full/kordi-environmental-studyjuwon-son 25/38
Hydrothermal vents
SW MARKEPR
21 N
Juan de
Fuca
Temp. 2 350 351 224-285
pH 7.8 3.9 3.4 3.2
SO42- (mM) 26.1 0 0 0
H2S (uM) 0 5.9 7.3 3.5
Ca (uM) 10.2 9.9 15.6 96.4
Mg (mM) 52.7 0 0 0
Ba (uM) 0.14 8
Al (uM) 0.01 5
Fe (uM) 0.001 2180 1664 3585
NO3 (uM) 40 uM 0
Si (mM) 0.16 18.2 17.6 23.3
Mn (uM) 0 491 1,024 3,585
CH4 (mM) 0.001 1.6
K 9.8 23.6 23.2 51.6
ATP < 5 pM 90 pM
Comparison of the composition of a typical Mid-ocean ridge
hydrothermal vent fluid on the Mid-Atlantic Ridge (MARK), 21 N
East Pacific Rise and Southern Juan de Fuca Ridge.
Schematic diagram of a hydrothermal plume and the underlying hydrothermal
system at a ridge crest spreading center. Note the warm and high-temp. vent
sources, buoyant plume, neutrally buoyant proximal plume, and the
discontinuous distal plume (from Massoth et al. 1988)
Active hydrothermal vent area: Mid ocean ridge, Back-arc basin,
Rifted arcs, Volcanoes (Tivey 2007)
St d

8/6/2019 KORDI Environmental Study_Juwon Son
http://slidepdf.com/reader/full/kordi-environmental-studyjuwon-son 26/38
Study area
Indian
Ocean
SouthPacific
Ocean
Back-arc spreading
Mid Ocean Ridge

8/6/2019 KORDI Environmental Study_Juwon Son
http://slidepdf.com/reader/full/kordi-environmental-studyjuwon-son 27/38
§ Research Equipments
CTD-TOYOCTD-casting
MAPR Single and multi-beam echosounder
Proxima (for Nutrients)
GC/SCD (for Methane)
Luminometer (for ATP)
Pl d t ti d it i

8/6/2019 KORDI Environmental Study_Juwon Son
http://slidepdf.com/reader/full/kordi-environmental-studyjuwon-son 28/38
* Controlled by Traction Winch,
* Body weight : 700 kg, with Sea-Bird's 911plus CTD
* Sensor : Primary & Secondary Transmissometer,Depth, T, S, Altimeter, Fluorometer
* H/W : IBM 586 computer, Traction Winch Controller
* S/W : Seasoft program
Plume detection and monitoring
Anomaly of light transmission
R/V
bathy distance
TW start
0
TOYO
Winch(m)
CTD(m)
Schematic diagram of towing

8/6/2019 KORDI Environmental Study_Juwon Son
http://slidepdf.com/reader/full/kordi-environmental-studyjuwon-son 29/38
Case study 2- ResultsCase study 2- Results
Pl d t ti L B i

8/6/2019 KORDI Environmental Study_Juwon Son
http://slidepdf.com/reader/full/kordi-environmental-studyjuwon-son 30/38
Plume detection - Lau Basin
CTD-TOYO (KORDI)
Pl d i L B i

8/6/2019 KORDI Environmental Study_Juwon Son
http://slidepdf.com/reader/full/kordi-environmental-studyjuwon-son 31/38
MAPR (Miniature
AutonomousPlume
Recorder, NOAA)
Plume detection - Lau Basin
Pl d i b li i h CTD

8/6/2019 KORDI Environmental Study_Juwon Son
http://slidepdf.com/reader/full/kordi-environmental-studyjuwon-son 32/38
Plume detection by water sampling with CTD
CTD Vertical profiles of T, S, DO and Tr.
Continuous survey : Temp., Salinity, DO, Transparency
76 80 84 88 92 96Transparency(%)
1500
1300
1100
900
D e p t h ( m )
2.8 3.2 3.6 4 4.4 4.8Temperature(oC)
0 0.4 0.8 1.2 1.6
H2S (mM)
Effluent layer
A
Increasedtemperatureanomaly
Transparency
H2S
Temperature
3.6 3.8 4
1200
1180
1160
1140
1120
1100
A
Measuredtemperature
Temp. ( C)
D e p t h ( m )
Predictedtemperature
Bi h i l t i t l

8/6/2019 KORDI Environmental Study_Juwon Son
http://slidepdf.com/reader/full/kordi-environmental-studyjuwon-son 33/38
Biogeochemical tracers in water sample
Plume detection Central Indian Ridge

8/6/2019 KORDI Environmental Study_Juwon Son
http://slidepdf.com/reader/full/kordi-environmental-studyjuwon-son 34/38
34
Plume detection - Central Indian Ridge
Detected anomaly conc. of NH4, ATP,and Methane
Detected anomaly conc. of NH4, ATP,and Methane
Plume detection - Central Indian Ridge

8/6/2019 KORDI Environmental Study_Juwon Son
http://slidepdf.com/reader/full/kordi-environmental-studyjuwon-son 35/38
Plume detection - Central Indian Ridge
Potential mining impacts

8/6/2019 KORDI Environmental Study_Juwon Son
http://slidepdf.com/reader/full/kordi-environmental-studyjuwon-son 36/38
Potential mining impacts
(From Nautilus)
Implication to Environmetal studyImplication to Environmetal study

8/6/2019 KORDI Environmental Study_Juwon Son
http://slidepdf.com/reader/full/kordi-environmental-studyjuwon-son 37/38
Implication to Environmetal studyImplication to Environmetal study
uu Define the existing environment before miningDefine the existing environment before mining
uu Evaluate impacts of mining activity to environmentEvaluate impacts of mining activity to environment
uu
Develop strategies to minimize mining impactsDevelop strategies to minimize mining impacts

8/6/2019 KORDI Environmental Study_Juwon Son
http://slidepdf.com/reader/full/kordi-environmental-studyjuwon-son 38/38
Thank you ! Thank you !