Kopernik Global Investors, LLC -...
24
Kopernik Global Investors, LLC 1Q 2017 Conference Call Presented by: David B. Iben, CFA CIO & Lead Portfolio Manager .
Transcript of Kopernik Global Investors, LLC -...
Kopernik Global Investors, LLC1Q 2017 Conference Call
Presented by:
David B. Iben, CFA
CIO & Lead Portfolio Manager
.
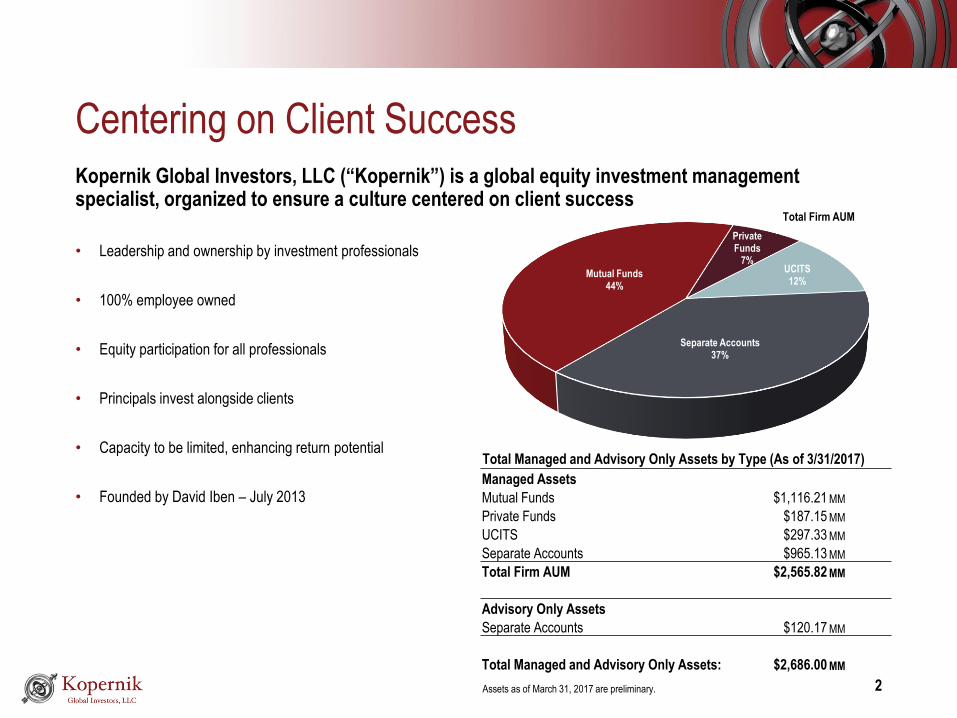
Kopernik Global Investors, LLC (“Kopernik”) is a global equity investment management specialist, organized to ensure a culture centered on client success
• Leadership and ownership by investment professionals
• 100% employee owned
• Equity participation for all professionals
• Principals invest alongside clients
• Capacity to be limited, enhancing return potential
• Founded by David Iben – July 2013
Mutual Funds44%
Private Funds
7%UCITS12%
Separate Accounts37%
Centering on Client Success
2
Total Managed and Advisory Only Assets by Type (As of 3/31/2017)
Assets as of March 31, 2017 are preliminary.
Managed Assets
Mutual Funds $1,116.21 MM
Private Funds $187.15 MM
UCITS $297.33 MM
Separate Accounts $965.13 MM
Total Firm AUM $2,565.82 MM
Advisory Only Assets
Separate Accounts $120.17 MM
Total Managed and Advisory Only Assets: $2,686.00 MM
Total Firm AUM
3
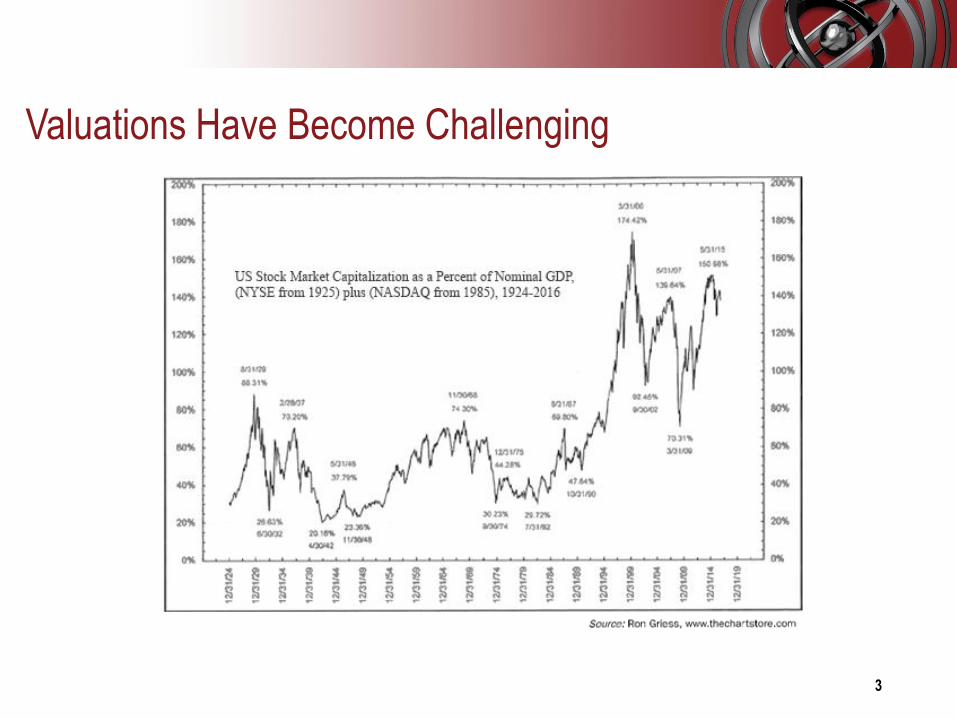
Valuations Have Become Challenging
4
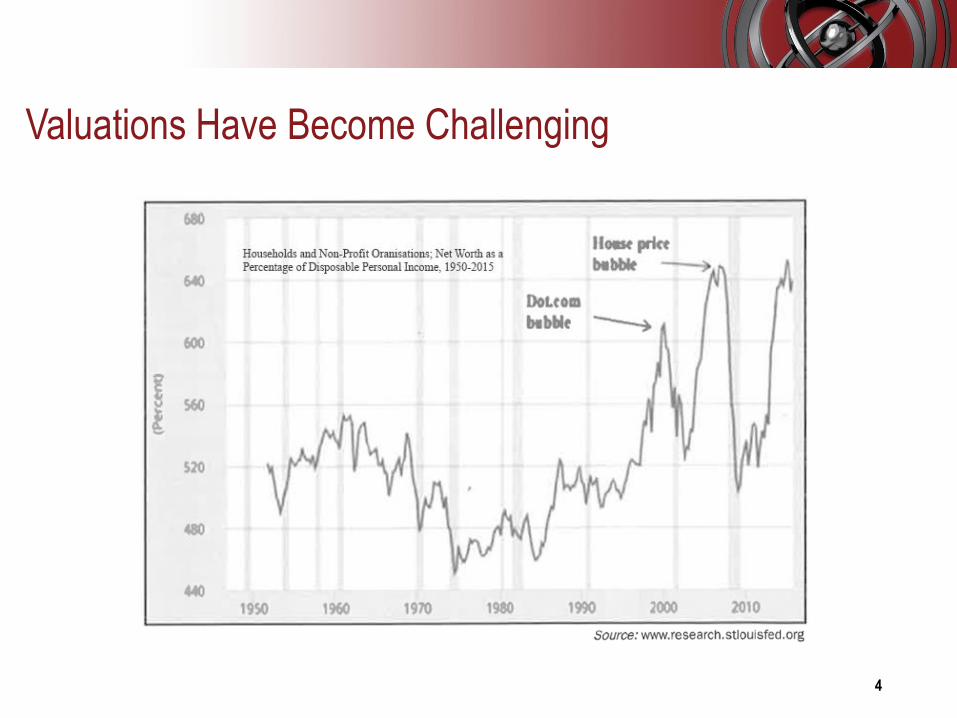
Valuations Have Become Challenging
5
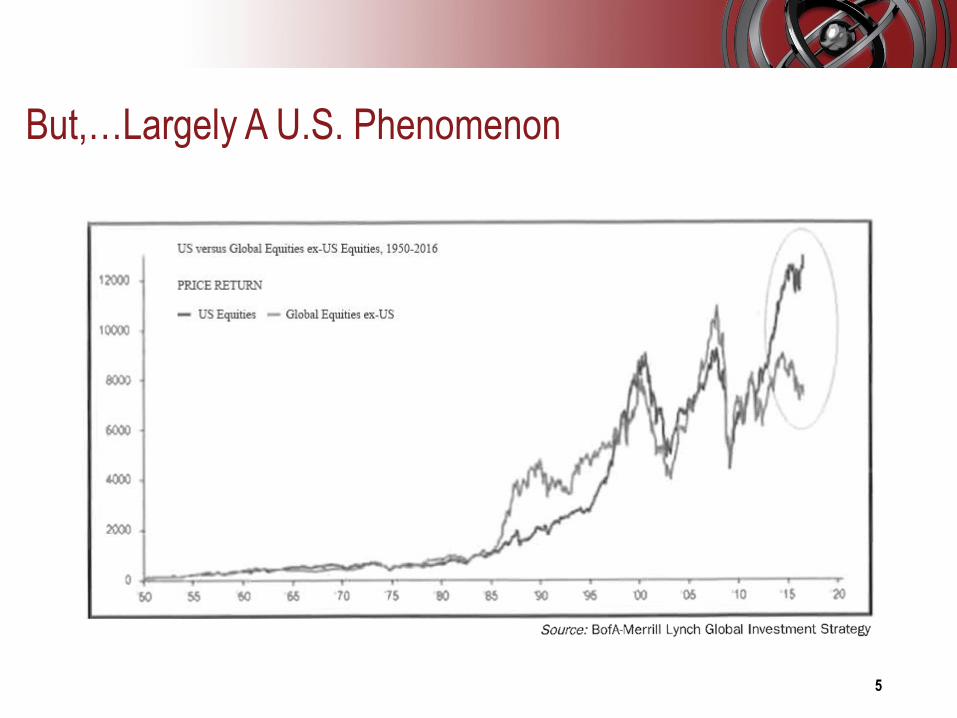
But,…Largely A U.S. Phenomenon

6
Everything Has a Season! The World is Cyclical
7
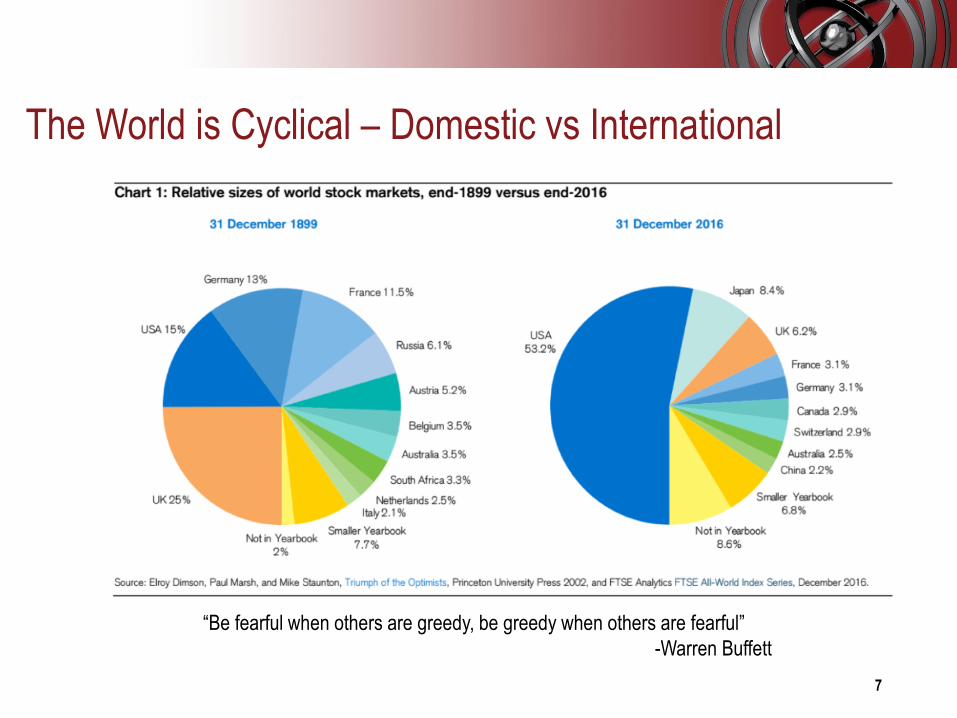
The World is Cyclical – Domestic vs International
“Be fearful when others are greedy, be greedy when others are fearful”
-Warren Buffett
8
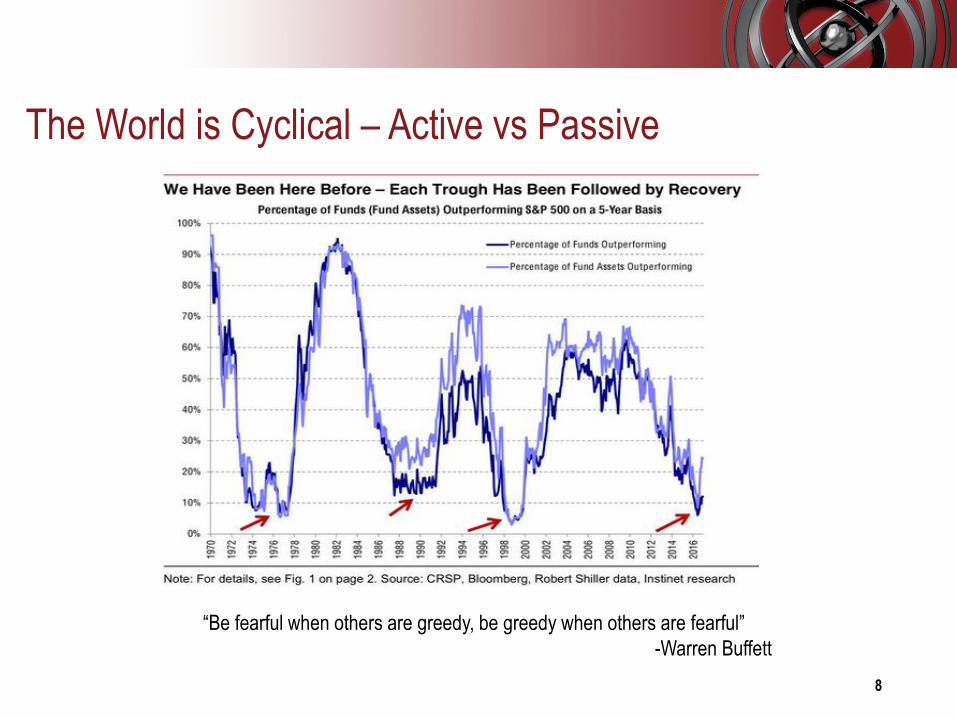
The World is Cyclical – Active vs Passive
“Be fearful when others are greedy, be greedy when others are fearful”
-Warren Buffett
9
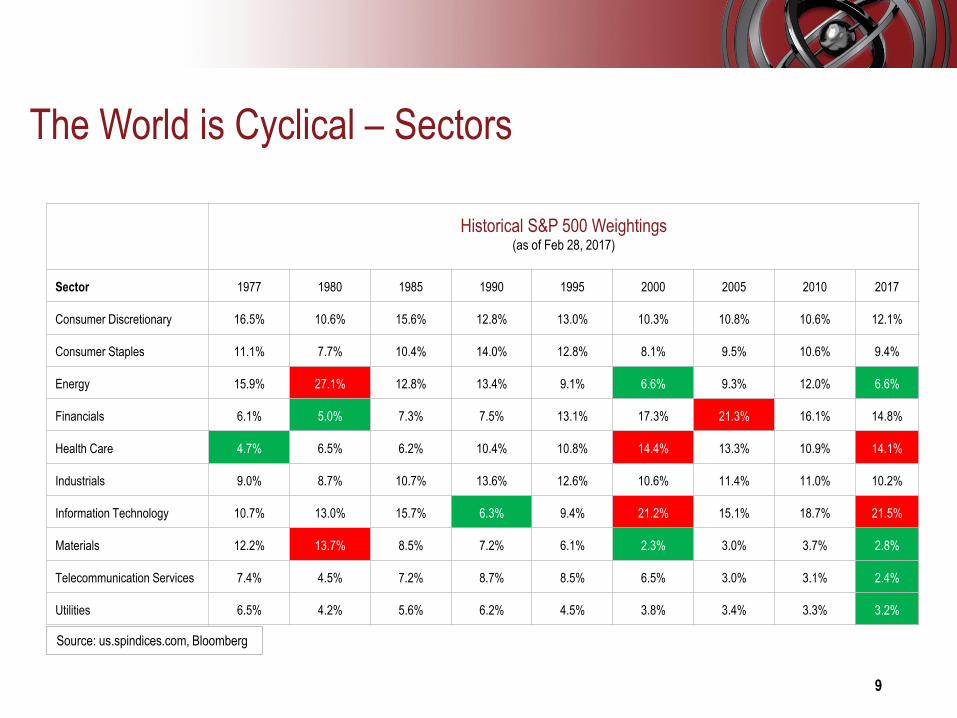
Historical S&P 500 Weightings (as of Feb 28, 2017)
Sector 1977 1980 1985 1990 1995 2000 2005 2010 2017
Consumer Discretionary 16.5% 10.6% 15.6% 12.8% 13.0% 10.3% 10.8% 10.6% 12.1%
Consumer Staples 11.1% 7.7% 10.4% 14.0% 12.8% 8.1% 9.5% 10.6% 9.4%
Energy 15.9% 27.1% 12.8% 13.4% 9.1% 6.6% 9.3% 12.0% 6.6%
Financials 6.1% 5.0% 7.3% 7.5% 13.1% 17.3% 21.3% 16.1% 14.8%
Health Care 4.7% 6.5% 6.2% 10.4% 10.8% 14.4% 13.3% 10.9% 14.1%
Industrials 9.0% 8.7% 10.7% 13.6% 12.6% 10.6% 11.4% 11.0% 10.2%
Information Technology 10.7% 13.0% 15.7% 6.3% 9.4% 21.2% 15.1% 18.7% 21.5%
Materials 12.2% 13.7% 8.5% 7.2% 6.1% 2.3% 3.0% 3.7% 2.8%
Telecommunication Services 7.4% 4.5% 7.2% 8.7% 8.5% 6.5% 3.0% 3.1% 2.4%
Utilities 6.5% 4.2% 5.6% 6.2% 4.5% 3.8% 3.4% 3.3% 3.2%
Source: us.spindices.com, Bloomberg
The World is Cyclical – Sectors
10
0.90
1.00
1.10
1.20
1.30
1.40
1.50
1.60
1.70
1.80
1.90
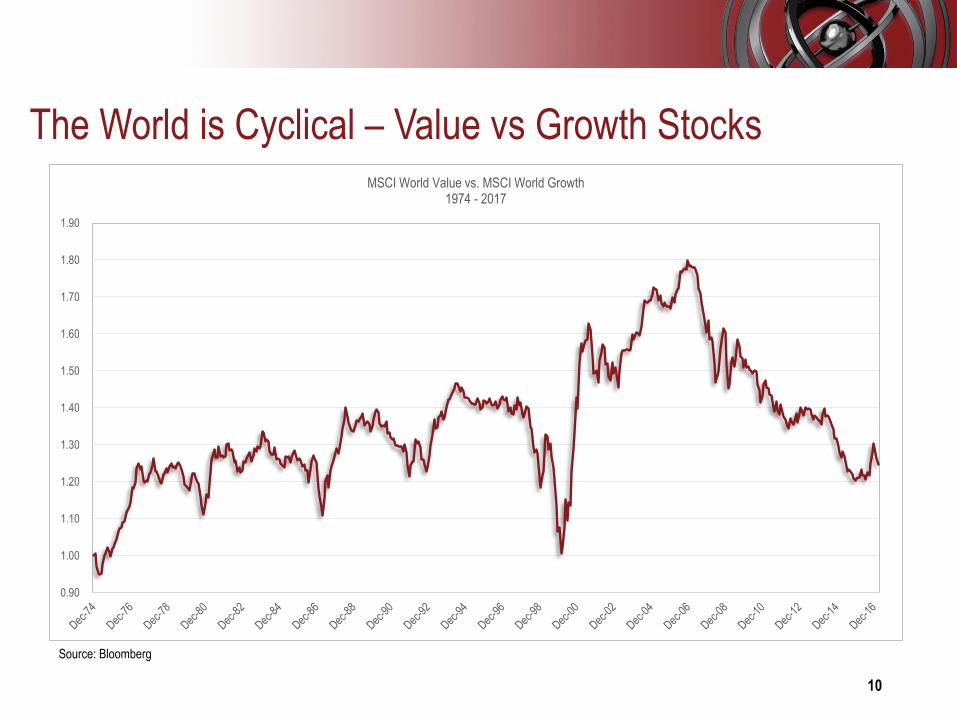
MSCI World Value vs. MSCI World Growth 1974 - 2017
Source: Bloomberg
The World is Cyclical – Value vs Growth Stocks
11
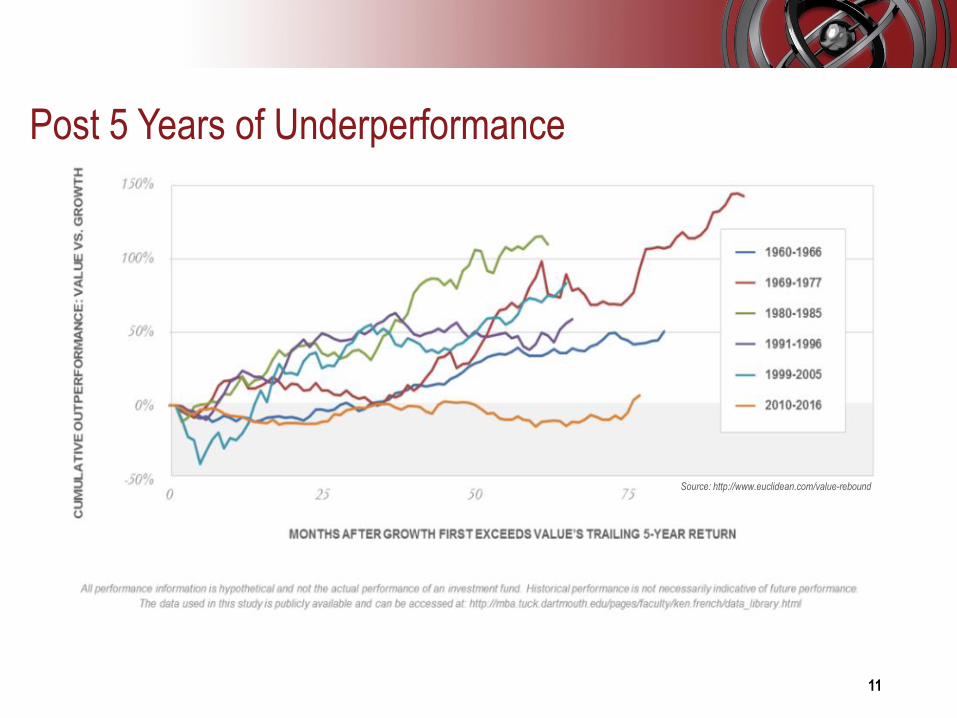
Source: http://www.euclidean.com/value-rebound
Post 5 Years of Underperformance
12
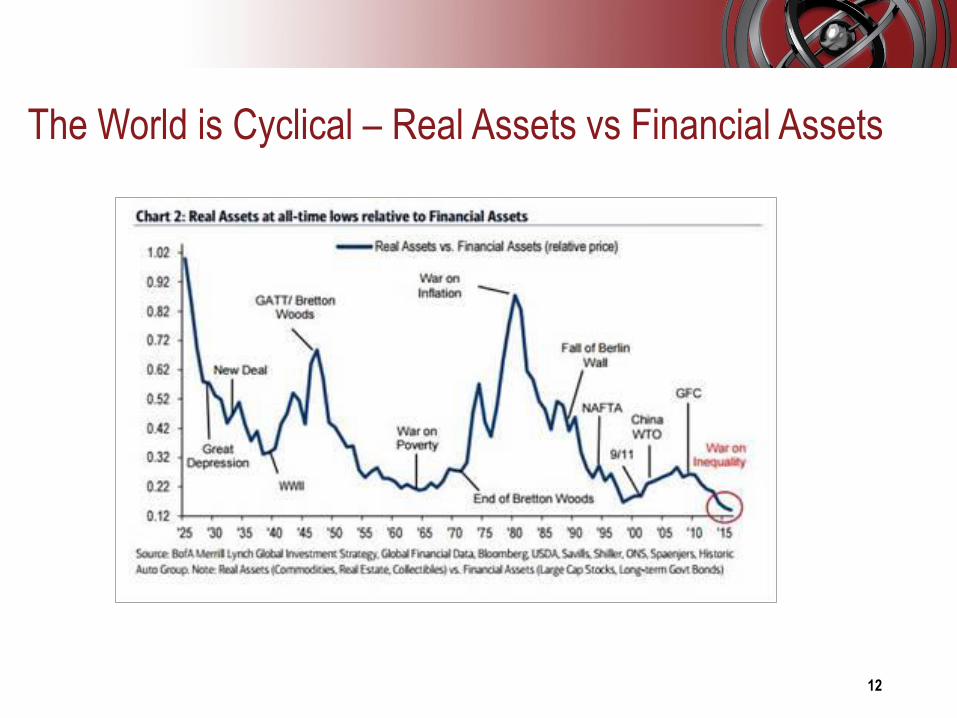
The World is Cyclical – Real Assets vs Financial Assets
13
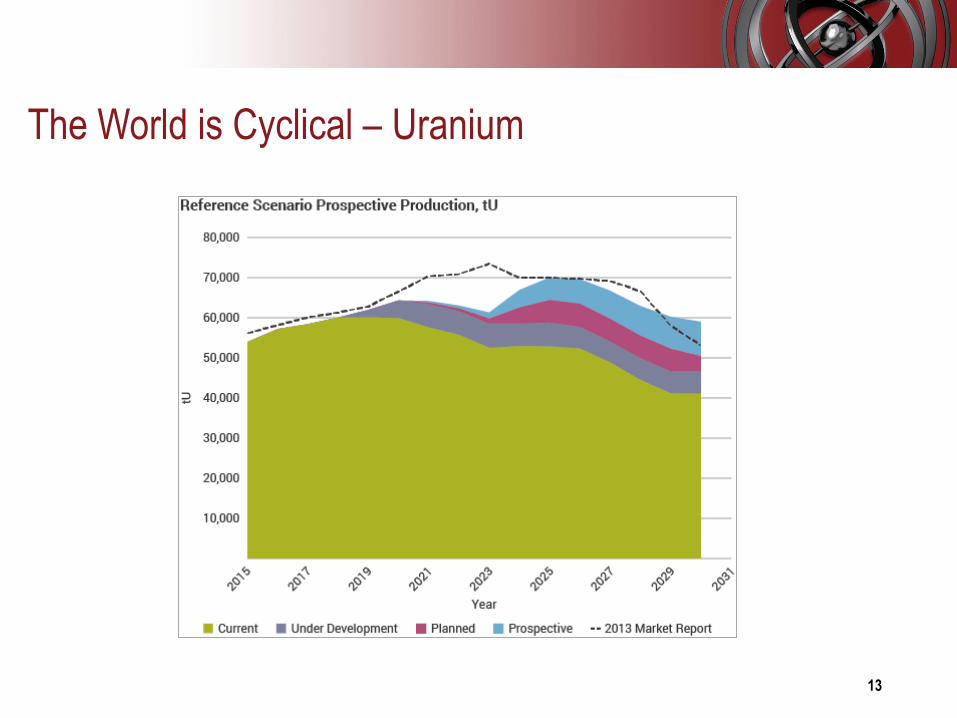
The World is Cyclical – Uranium
14
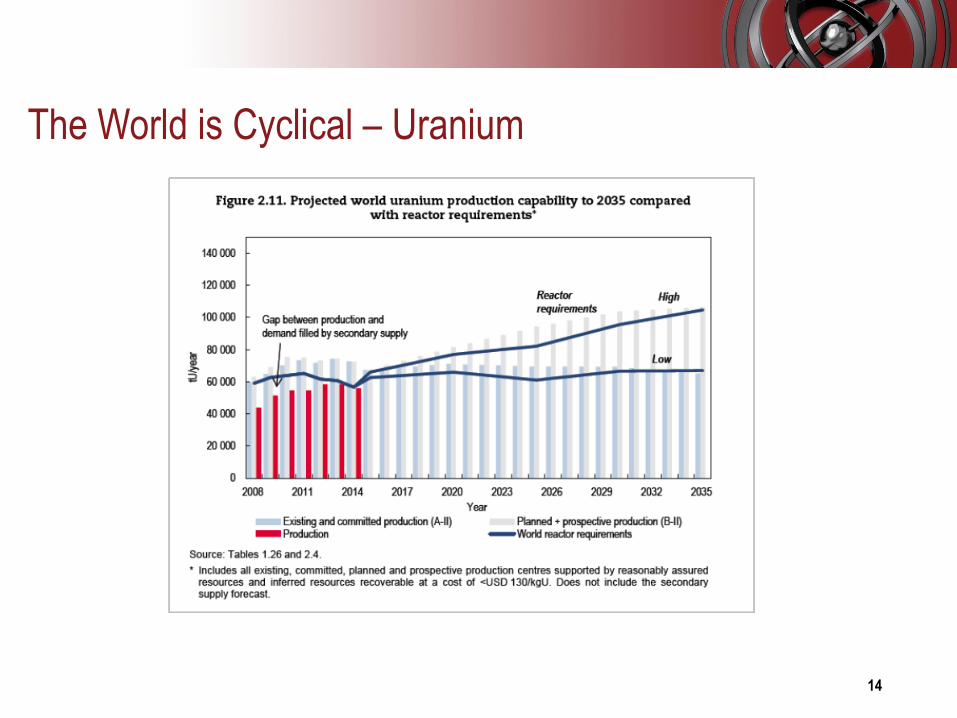
The World is Cyclical – Uranium
15
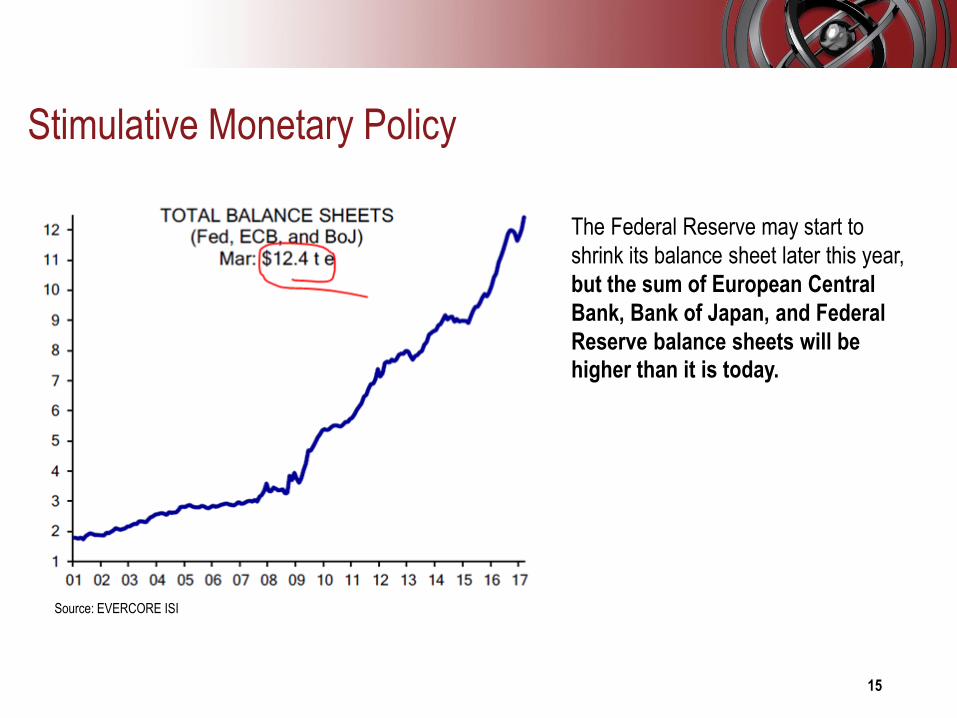
Stimulative Monetary Policy
The Federal Reserve may start to
shrink its balance sheet later this year,
but the sum of European Central
Bank, Bank of Japan, and Federal
Reserve balance sheets will be higher than it is today.
Source: EVERCORE ISI
16
-
100
200
300
400
500
600
700
800
900
1,000
$0
$500
$1,000
$1,500
$2,000
$2,500
$3,000
$3,500
$4,000
$4,500
US
Gol
d R
eser
ves
(mili
ons
oz)
US
D M
onet
ary
Bas
e (I
n $
Bili
ons)
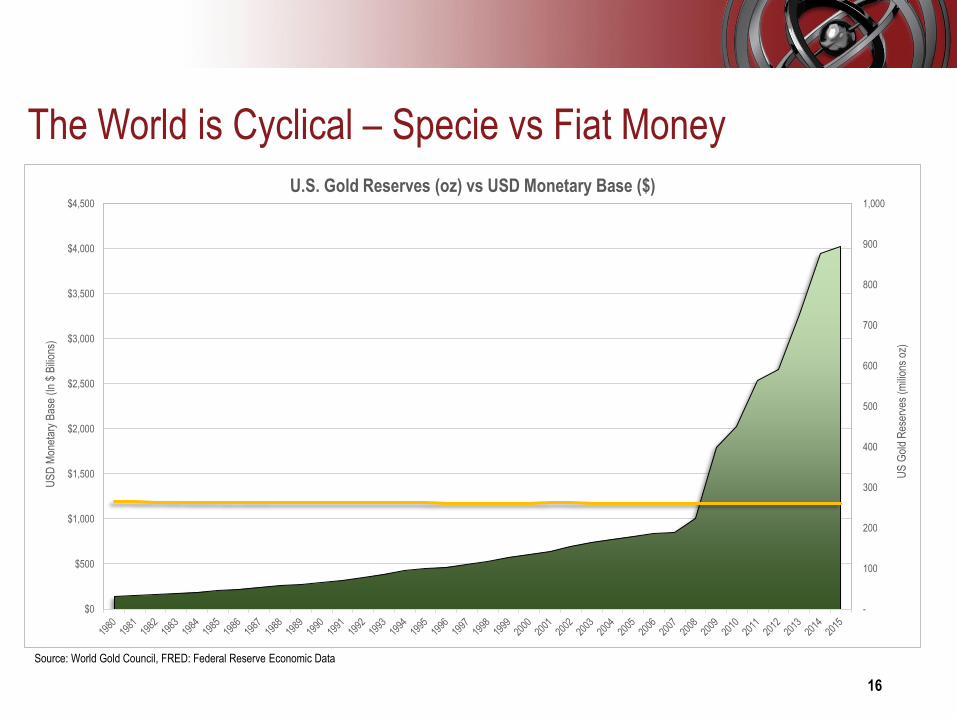
U.S. Gold Reserves (oz) vs USD Monetary Base ($)
The World is Cyclical – Specie vs Fiat Money
Source: World Gold Council, FRED: Federal Reserve Economic Data
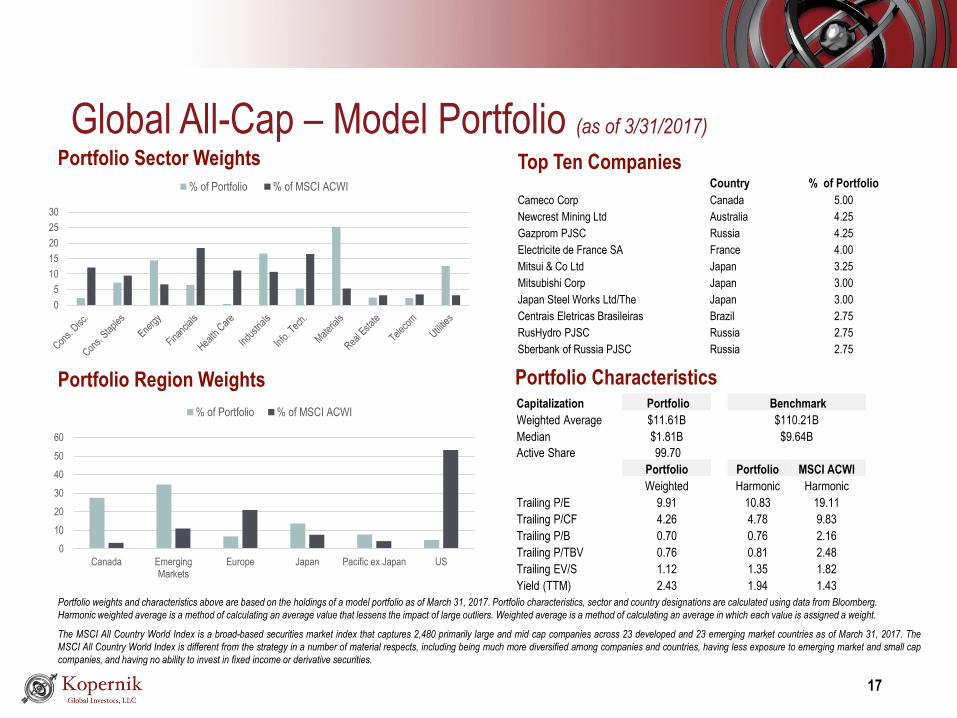
Global All-Cap – Model Portfolio (as of 3/31/2017)
Portfolio weights and characteristics above are based on the holdings of a model portfolio as of March 31, 2017. Portfolio characteristics, sector and country designations are calculated using data from Bloomberg.
Harmonic weighted average is a method of calculating an average value that lessens the impact of large outliers. Weighted average is a method of calculating an average in which each value is assigned a weight.
The MSCI All Country World Index is a broad-based securities market index that captures 2,480 primarily large and mid cap companies across 23 developed and 23 emerging market countries as of March 31, 2017. The
MSCI All Country World Index is different from the strategy in a number of material respects, including being much more diversified among companies and countries, having less exposure to emerging market and small cap
companies, and having no ability to invest in fixed income or derivative securities.
Top Ten CompaniesCountry % of Portfolio
Cameco Corp Canada 5.00
Newcrest Mining Ltd Australia 4.25
Gazprom PJSC Russia 4.25
Electricite de France SA France 4.00
Mitsui & Co Ltd Japan 3.25
Mitsubishi Corp Japan 3.00
Japan Steel Works Ltd/The Japan 3.00
Centrais Eletricas Brasileiras Brazil 2.75
RusHydro PJSC Russia 2.75
Sberbank of Russia PJSC Russia 2.75
Portfolio Characteristics
17
0
5
10
15
20
25
30
% of Portfolio % of MSCI ACWI
0
10
20
30
40
50
60
Canada EmergingMarkets
Europe Japan Pacific ex Japan US
% of Portfolio % of MSCI ACWI
Portfolio Region Weights
Portfolio Sector Weights
Capitalization Portfolio Benchmark
Weighted Average $11.61B $110.21B
Median $1.81B $9.64B
Active Share 99.70
Portfolio Portfolio MSCI ACWI
Weighted Harmonic Harmonic
Trailing P/E 9.91 10.83 19.11
Trailing P/CF 4.26 4.78 9.83
Trailing P/B 0.70 0.76 2.16
Trailing P/TBV 0.76 0.81 2.48
Trailing EV/S 1.12 1.35 1.82
Yield (TTM) 2.43 1.94 1.43
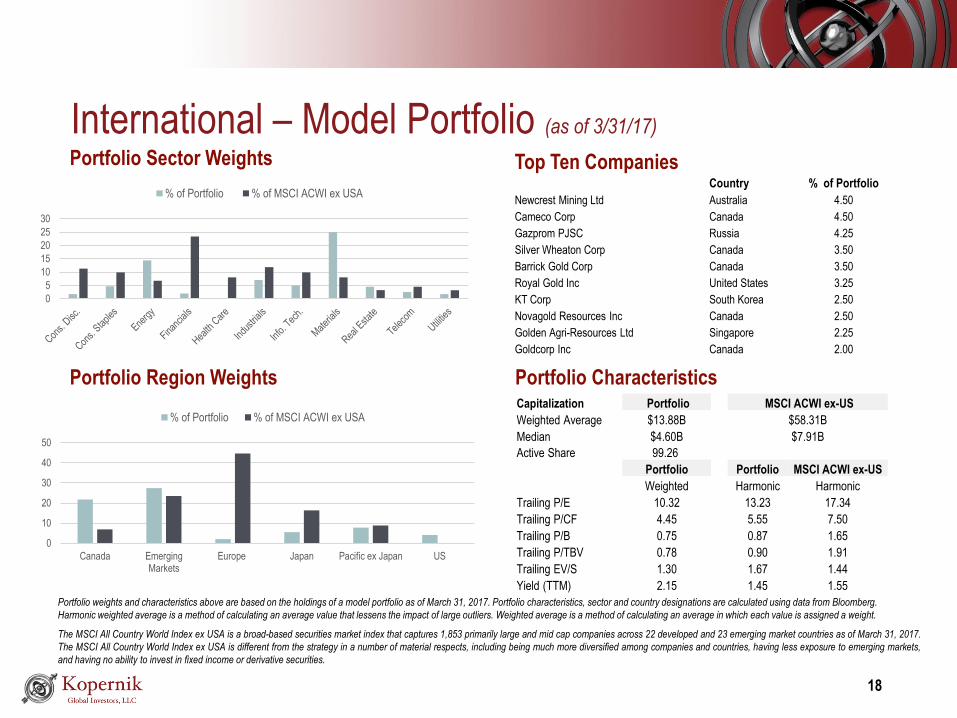
International – Model Portfolio (as of 3/31/17)
Portfolio weights and characteristics above are based on the holdings of a model portfolio as of March 31, 2017. Portfolio characteristics, sector and country designations are calculated using data from Bloomberg.
Harmonic weighted average is a method of calculating an average value that lessens the impact of large outliers. Weighted average is a method of calculating an average in which each value is assigned a weight.
The MSCI All Country World Index ex USA is a broad-based securities market index that captures 1,853 primarily large and mid cap companies across 22 developed and 23 emerging market countries as of March 31, 2017.
The MSCI All Country World Index ex USA is different from the strategy in a number of material respects, including being much more diversified among companies and countries, having less exposure to emerging markets,
and having no ability to invest in fixed income or derivative securities.
Top Ten CompaniesCountry % of Portfolio
Newcrest Mining Ltd Australia 4.50
Cameco Corp Canada 4.50
Gazprom PJSC Russia 4.25
Silver Wheaton Corp Canada 3.50
Barrick Gold Corp Canada 3.50
Royal Gold Inc United States 3.25
KT Corp South Korea 2.50
Novagold Resources Inc Canada 2.50
Golden Agri-Resources Ltd Singapore 2.25
Goldcorp Inc Canada 2.00
Portfolio Characteristics
18
Portfolio Region Weights
Portfolio Sector Weights
Capitalization Portfolio MSCI ACWI ex-US
Weighted Average $13.88B $58.31B
Median $4.60B $7.91B
Active Share 99.26
Portfolio Portfolio MSCI ACWI ex-US
Weighted Harmonic Harmonic
Trailing P/E 10.32 13.23 17.34
Trailing P/CF 4.45 5.55 7.50
Trailing P/B 0.75 0.87 1.65
Trailing P/TBV 0.78 0.90 1.91
Trailing EV/S 1.30 1.67 1.44
Yield (TTM) 2.15 1.45 1.55
0
10
20
30
40
50
Canada EmergingMarkets
Europe Japan Pacific ex Japan US
% of Portfolio % of MSCI ACWI ex USA
0
5
10
15
20
25
30
% of Portfolio % of MSCI ACWI ex USA
19
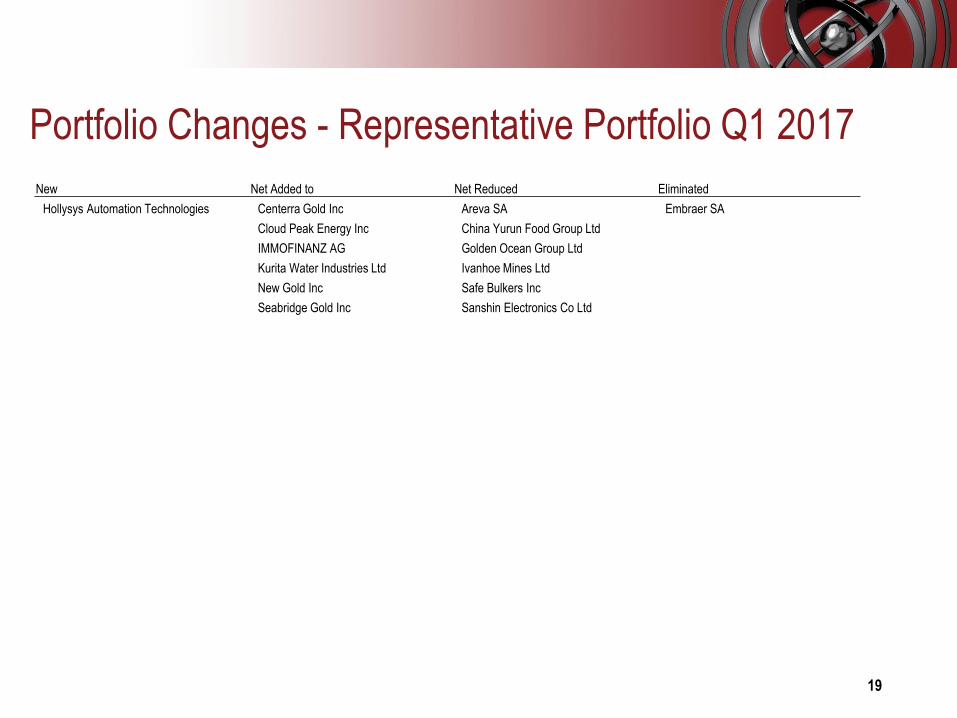
New Net Added to Net Reduced Eliminated
Hollysys Automation Technologies Centerra Gold Inc Areva SA Embraer SA
Cloud Peak Energy Inc China Yurun Food Group Ltd
IMMOFINANZ AG Golden Ocean Group Ltd
Kurita Water Industries Ltd Ivanhoe Mines Ltd
New Gold Inc Safe Bulkers Inc
Seabridge Gold Inc Sanshin Electronics Co Ltd
Portfolio Changes - Representative Portfolio Q1 2017

THANK YOU
Q&A Session
20
A copy of this presentation is available on www.kopernikglobal.com.
Appendix
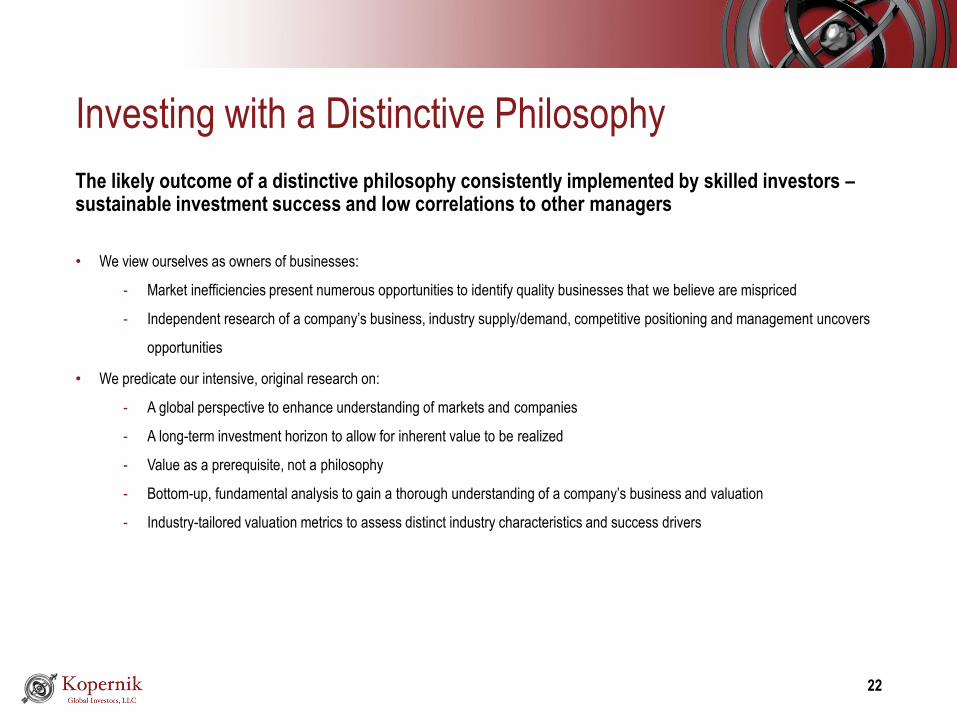
Investing with a Distinctive Philosophy
The likely outcome of a distinctive philosophy consistently implemented by skilled investors –sustainable investment success and low correlations to other managers
• We view ourselves as owners of businesses:
- Market inefficiencies present numerous opportunities to identify quality businesses that we believe are mispriced
- Independent research of a company’s business, industry supply/demand, competitive positioning and management uncovers
opportunities
• We predicate our intensive, original research on:
- A global perspective to enhance understanding of markets and companies
- A long-term investment horizon to allow for inherent value to be realized
- Value as a prerequisite, not a philosophy
- Bottom-up, fundamental analysis to gain a thorough understanding of a company’s business and valuation
- Industry-tailored valuation metrics to assess distinct industry characteristics and success drivers
22
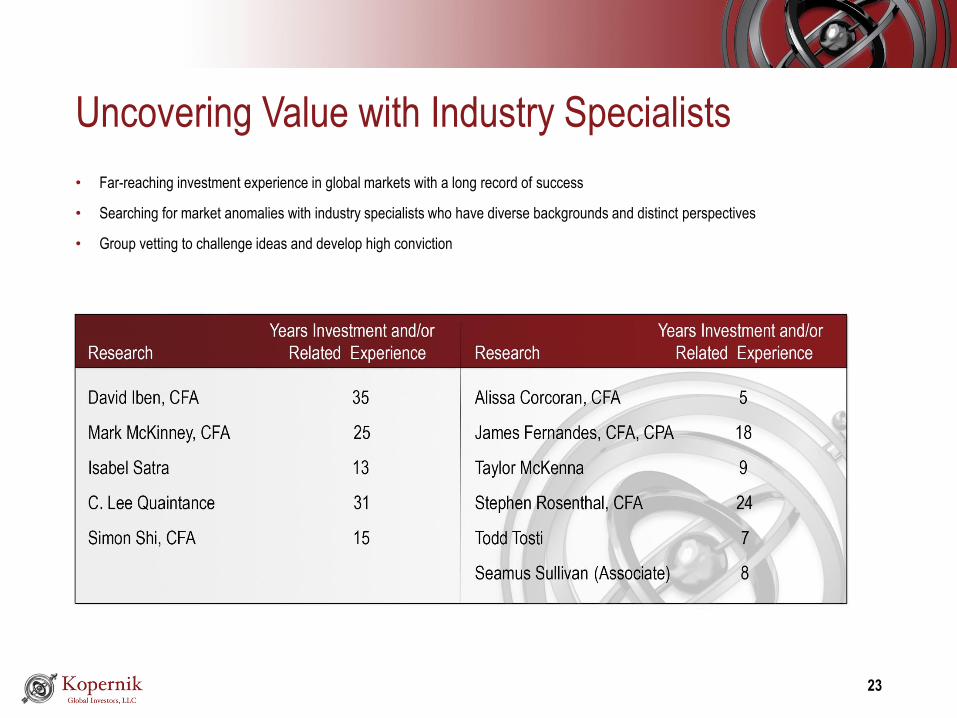
Uncovering Value with Industry Specialists
• Far-reaching investment experience in global markets with a long record of success
• Searching for market anomalies with industry specialists who have diverse backgrounds and distinct perspectives
• Group vetting to challenge ideas and develop high conviction
23
The information presented herein is proprietary to Kopernik Global Investors, LLC. This material is approved for a presentation to authorized individuals only and,
accordingly, this material is not to be reproduced in whole or in part or used for any purpose except as authorized by Kopernik Global Investors, LLC.
Please consider all risks carefully before investing. The accounts managed according to the Global All-Cap investment strategy are subject to certain risks such as
market, investment style, interest rate, deflation, and illiquidity risk. Investments in small and mid-capitalization companies also involve greater risk and portfolio
price volatility than investments in larger capitalization stocks. Investing in non-U.S. markets, including emerging and frontier markets, involves certain additional
risks, including potential currency fluctuations and controls, restrictions on foreign investments, less governmental supervision and regulation, less liquidity, less
disclosure, and the potential for market volatility, expropriation, confiscatory taxation, and social, economic and political instability. Investments in energy and
natural resources companies are especially affected by developments in the commodities markets, the supply of and demand for specific resources, raw materials,
products and services, the price of oil and gas, exploration and production spending, government regulation, economic conditions, international political
developments, energy conservation efforts and the success of exploration projects. There can be no assurances that investment objectives will be achieved.
Kopernik Global Investors, LLC is an investment adviser registered under the Investment Advisers Act of 1940, as amended.
This document, as of April 20, 2017 is descriptive of how the Kopernik team manages the Global All-Cap strategy. There is no guarantee that any strategy’s
investment performance objectives will be achieved. This profile is not legally binding on Kopernik Global Investors, LLC or its affiliates.
© 2017 Kopernik Global Investors, LLC | Two Harbour Place | 302 Knights Run Avenue Suite 1225 | Tampa, Florida 33602 | 813.314.6100 | www.kopernikglobal.com
Important Information
24