Konica Minolta, Inc.Medium Term Business Plan · Establish a customer response team to support GMA...
27
Konica Minolta, Inc. Medium Term Business Plan - Announced on May 9th, 2014 - Shoei Yamana, President and CEO Konica Minolta, Inc.
Transcript of Konica Minolta, Inc.Medium Term Business Plan · Establish a customer response team to support GMA...

Konica Minolta, Inc.Medium Term Business Plan
- Announced on May 9th, 2014 -
Shoei Yamana, President and CEOKonica Minolta, Inc.

1
New Medium Term Business Plan

1-1. Basic Policy
2
Evolve the “genre-top” strategy and create value
Have customer insight and understand their needs
All actions and business processes of Konica Minolta should be based on pursuing customer value
Build a strong corporate structure by pursuing sturdy production operations and restructuring of corporate administration
Realize sustainable profit growth
Establish a strong corporate structure
Transform into a customer-centric company

1-2. Financial Targets
FY2014 outlook
FY2016 targets
Operating income ¥90.0bn
8% or more
10% or more
Operating incomeratio
ROE
Net sales ¥1.1 trillion or more
Assumed FOREX U.S. dollar = ¥100euro = ¥135
FY2013 results
¥58.1bn
6.2%
4.6%
¥943.8bn
U.S. dollar = ¥100euro = ¥134
3
¥1 trillion
¥62.0bn
6.2%
U.S. dollar = ¥100euro = ¥135
5.6%
(International Financial Reporting Standards, IFRS)
(Japanese Generally Accepted Accounting Principles, J-GAAP )
(Japanese Generally Accepted Accounting Principles, J-GAAP )

1-3. Financial Targets -by Segment
4
[¥billions]
Business Technologies 729.8 800.0 917.0
Office Services 567.1 600.0 680.0
Commercial/Industrial print 162.8 200.0 237.0
Industrial Business 116.1 110.0 140.0
Performance Materials 58.3 49.0 60.0
Industrial Optical Systems 57.8 61.0 80.0
Healthcare 82.4 90.0 100.0
Group Overall 943.8 1,000.0 1,100.0
Business Technologies 63.9 8.8% 72.0 9.0% 90.0 9.8%
Industrial Business 15.2 13.1% 12.0 10.9% 17.5 12.5%
Healthcare 4.5 5.5% 7.0 7.8% 10.0 10.0%
Group Overall 58.1 6.2% 62.0 6.2% 90.0 8.2%
Operating income
Net Sales
Mar 2016
Targets
Mar 2015Mar 2014
Results Outlook
Results Outlook Targets
Mar 2014 Mar 2015 Mar 2016
FY 2013results
FY 2013results
FY 2014outlook
FY 2016targets
FY 2014outlook
FY 2016targets

Strategies and Policies for Each Business
5

FY13 FY14 FY18
2-1. Strategy Overview for Office Services Business
Strengthen ability to provide OPS/GMA/ITS services
Establish a customer response team to support GMA cases
Strengthen operations at GSC (Global Support Center)
Customer response capabilities (customize, multi-vendor, etc.)
Strengthen system at APAC
Increase OPS/GMA sales
(vs FY13)
FY16 ¥60.0bn
Expand IT service business
Gain BPM know-how (horizontally deploy vertical solutions)
Strengthen foundation of KM cloud
Use BIC to provide new services
Percentage of hybrid proposals
100% (direct sales in Japan, US, Europe)
Strengthen solution-proposing capacity and reinforce sales channels to increase MIF and color PV
Ratio of MFP sales/color PVs
(FY13 = 100 in this index)
FY16 118 / 130
Sales (¥bn)
6
Office products
600.0567.1
680.0
FY13 FY14 FY16
OPS/GMA
IT service solutions
Strategy ScenarioBusiness Framework
Enhance solution proposal capabilities by providing services and solutions for digital workflows of customers
Consequently increase MIF and PV disruptively

2-2. Strategy Overview for Commercial/Industrial Print Business
7
Develop and launch new production printing products
Get mid-size and up Commercial Print customers with MPP machines
Expand KM PV with High Volume users
Ratio of PP machine sales/color PVs
(FY13 = 100 in this index)
FY16 125/150
Global development of MPM service
Expand to US and AP region
Use Charterhouse’s know-how and M&A
Increase MPM sales
(vs FY13)
FY16 ¥20.0bn
Full-scale launch of industrial printing business
Gain “Genre-top” applications
Show synergy with capital tie-up partner MGI
Enter industrial printing market by using electrophotographictechnology
Bring KM-1 to market, cultivate customers
Increase industrial printing sales
(vs FY13)
FY16 ¥20.0bn
FY13 FY14 FY16
162.8
200.0
237.0
Production Print
FY13 FY14 FY16
Industrial Printing
Sales (¥bn)
MPM
(MPP)
Strategy ScenarioBusiness Framework
Drastically increase PV at printing companies disruptively by transforming current printing order flows through KM’s unique MPM and Kinko’s
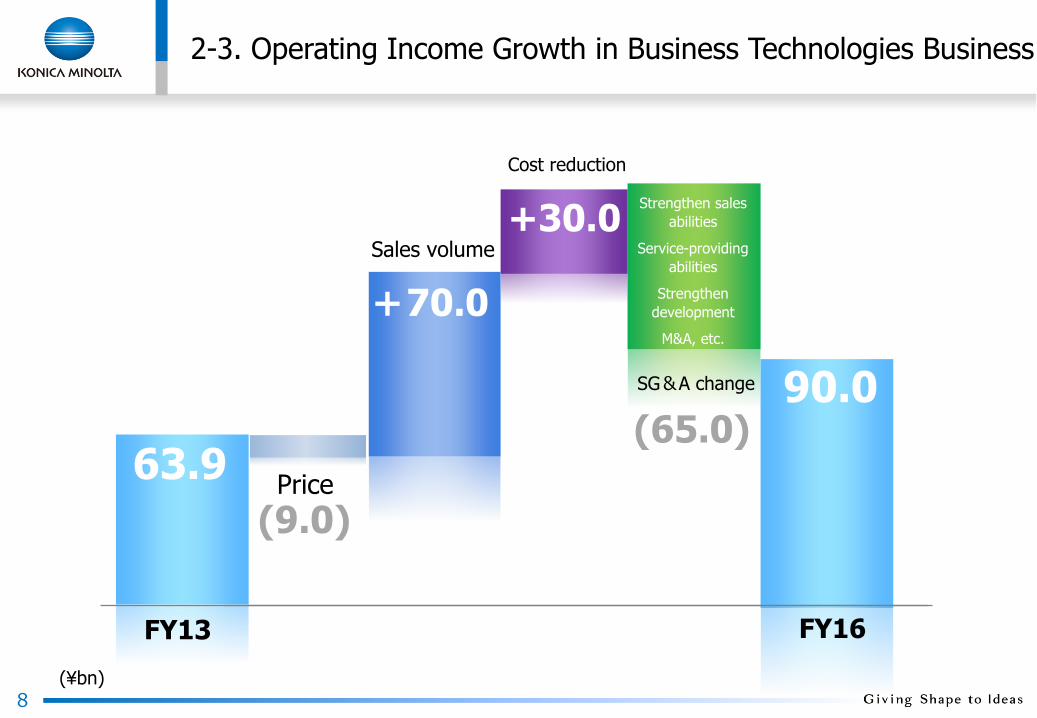
2-3. Operating Income Growth in Business Technologies Business
8
Sales volume
SG&A change
(65.0)
FY13 FY16
63.9
90.0
Price
Cost reduction
(9.0)
+70.0
+30.0Strengthen sales
abilities
Service-providing
abilities
Strengthen
development
M&A, etc.
(¥bn)

2-4. Strategy Overview for Healthcare Business
9
Gain “genre-top” position in cassette-type DR systems
Increase rate of participation in business negotiations (e.g., package sales that include X-ray systems)
Provide new diagnostic value (video, Talbot, etc.)
Expand B2B business, invest in sales channels
Increase DR sales
(vs FY13)
FY16 ¥14.0 bn
Increase sales of ultrasound diagnostic imaging systems
Develop markets and channels by marketing portable products
Establish top of market with high-picture-quality probes (orthopedic, mammary gland, and internal medicine market)
Increase US sales
(vs FY13)
FY16 ¥7.0bn
Strengthen medical IT services
Cloud services
(digital medical charts, receipt computers, PACS)
Expand information portal service menu
Increase customers under contract with regional partnerships, at-home solutions
Increase IT service sales
(vs FY13)
FY16 ¥8.0bn
FY13 FY14 FY16
82.4
90.0
100.0
FY13 FY14 FY16
CR, film, purchase
Modality growth area: DR, ultrasound
Medical IT
New domains
Sales (¥bn)
Strategy ScenarioBusiness Framework
Increase MIF by providing integrated solutions combining advanced diagnostic performance modality (DR and ultrasound) and medical information (diagnostic information and medical documents)
Provide one-stop locally connected solutions to small- and medium-sized hospitals and clinics

2-5. Strategy Overview for Industrial Optical Systems Business
Sensing business
Obtain GMA for light-source color measuring device (mobile, lighting, automobile manufacturers)
Strengthen product development capacity through synergy with IS
Increase sensing business sales
(vs FY13)
FY16 ¥15.0bn
Industrial and professional lenses and components
Concentrate management resources (replacement lenses, projectors)
Improve customer intimacy
Increase replacement lens and projector sales
(vs FY13)
FY16 ¥13.0 bn
US売上増(対FY13)
FY16 70億円
Transform business portfolio
Cultivate new fields using optical and micromachining technology
Accelerate business development in partnership with Corporate R&D department
FY16 ¥5.0bn
Create ¥10bn business in
five years
FY13 FY14 FY16
10
FY13 FY14 FY16
80.0
61.057.8
Lenses, components
Sensing instruments
Optical systems
Sales (¥bn)
Strategy ScenarioBusiness Framework
Evolve proposal capabilities cultivated in the sensing business and create new value through devices and systems, including solutions and services, for major customers in industrial fields with high growth potential

(¥50bn by FY20)
2-6. Strategy Overview for Performance Materials Business
11
Window film
Cultivate sales channels (in-company, B2B)
Barrier film
Gain display customers
TAC film
Use membrane technology to gain customers for small and medium-sized mobile applications, develop new fields
Gain customers with new products that respond more strongly to TV needs
Cut costs by enhancing production efficiency
Ratio of new products to TAC sales
FY16 60%
Increase sales of new performance materials
(vs FY13)
FY16 ¥15.0bn
OLED
Develop applications taking advantage of characteristics, gain customers
Establish mass-production technology, cut costs
FY13 FY14 FY16
60.0
New functional film
TAC film
58.3
49.0
FY13 FY14 FY16
Sales (¥bn)
Strategy ScenarioBusiness Framework
Anticipate customer needs in growth fields and create new businesses based on our unique technologies accumulated through areas ranging from photo film development to OLED development

12
Transform to a strong corporate structure
Maximize profitabilityof product by implementing PLM
Reduce production costs
Consolidated gross margin ratio
Target 50% or more+2% over FY13
Consolidated SG&A expense ratio
Target 40% or less-2% over FY13
Reduce ¥5.0 bn
Manufacturing reform
Increase efficiency of business SG&A expenses
Corporate reform
SG&A expenses structure reform
3-1. Manufacturing Reform, SG&A Expenses Reform

Mass productionProduct prototyping
Design prototyping
3-2. Maximize Profitability of Products by Introducing PLM
13
MaintenanceSalesProductionDesigning
MaintenanceSalesProductionDesigning
MaintenanceSalesProductionDesigning
• Maximize profitability throughout each product’s life cycle, with a view to total optimization.
• Calculate life cycle profit or loss for each model and link it to the business’s overall plans.
Develo
pm
ent
depart
ment
Pro
duct
ion
depart
ment
Sale
s co
mpany
Sale
s co
mpany
Profitability management through entire process from start of development to end of sales
Product A
Product B
Product C
Profitability management by function, as practiced up to now(Profitability management by
function)
Product-specific PLM leader
2007 2008 2009 2010 2011 2012 2013 2014 2015
Development
Sales
Costs
Development costs
Development costs
Development costs Production costs
Non-hardware
Manufacturing costs
Manufacturing costs Sales costs
Development costs
Hardware
Non-hardware
Hardware
Non-hardware
Hardware
Non-hardware
Hardware
Non-hardware
Hardware
Production costs
Sales costs
Development costs
Production costs
Sales costs
Production costs
Sales costs
Production costs
Sales costsDevelopment costs
Sales
Costs
Cumulative profit or loss
Profitability structure over a product’s life cycle

14
Achieve cost competitiveness and restore our strength as a manufacturer by
leveraging innovative technical capabilities and practicing all-out global procurement.
Strategy
Enhance productivity and lower
costs through process innovation
Strengthen manufacturing through
production technology capabilities
and disruptive technical innovation
Expand global procurement and
optimize business locations
Major Policies
Establish design-in and front-loading processes in
collaboration with R&D divisions and suppliers
Boost work efficiency and reduce loss by using
ICT
Greatly reduce component costs through new
production technologies
Cut costs by letting suppliers use our internal
technologies (strengthen technology procurement
capabilities)
Reduce costs by practicing optimal purchasing
worldwide
Achieve the best production efficiency of any Japanese company based in China and stabilize procurement and production by not overly focusing operations on China
3-3. Reduce Production Costs Through Manufacturing Reform

15
Make fundamental changes to the corporate functions necessary
to survive the intense global competition
Strategy Scenario
Enhance management mechanisms
and optimize from a global
perspective
Increase efficiency of functions and
work, reduce costs by optimizing
system scale
Build up global platform
Transform corporate functions so
they can contribute directly to
business
Major Policies
Optimize responsibilities and authorities associated with
function and localize appropriately, and practice borderless
organizational collaboration
Achieve efficiency by standardizing work and
reconsidering functions
Unify (build) foundations and mechanisms, e.g., IT
infrastructure, global HR system, and project management
Maintain foundation for global management analysis
Build and promote innovation mechanisms
Carry out a Group HR enhancement program
Carry out program to transform corporate culture and
organization
Increase brand value
3-4. Corporate Reform

Key Points of the New Medium Term Business Plan
16

4-1. Aiming for 10% ROE
17
FY2016FY2013
Net income ratio
5.0%or more
Total assets turnover ratio
100%or more
Total assets turnover ratio
97%
Financial leverage
206%Financial leverage
200%
Net income ratio
2.3%
×
×
×
×
4.6%
10% or more
Pro
fita
bili
tyEff
icie
ncy
Soundness
・Proceed with the business portfolio transformation, improve profitability of existing businesses, and achieve an operating income ratio of 8% or more
・Increase non-operating/extraordinary income
・From the perspective of financial soundness, maintain an equity ratio of 50% or more and a net D/E ratio of zero
・Maintain a credit rating of A
・Improve asset efficiency through measures such as selling off idle assets and reducing inventories with an awareness of balance sheet management
・Actively provide returns to shareholders
Focus on ROE as an important management benchmark and aim to achieve an ROE of 10% or more in FY2016

72.5 71.5 71.280.0
9.4% 8.8% 7.5% 7.5%
-50.0%
-40.0%
-30.0%
-20.0%
-10.0%
0.0%
10.0%
0
200
400
600
800
1,000
1,200
11年度 12年度 13年度 14-16年度
平均
4-2-1. Investment Plan for Achieving Transform (R&D Expenses)
18
Keeping these expenses at 8% or less of net sales, work to strengthen existing businesses and cultivate new ones
R&D expenses to net sales ratio
R&D expenses ¥240bn (three-year cumulative total)
New Medium Term Business Plan
TRANSFORM 2016Results
• Strengthen technologies which compliment cloud andmobile applications
• Develop new low-cost engine
• Develop industrial inkjet hardware, ink, etc.
Business Technologies
Industrial
Healthcare
Others
• Develop differentiating functions for DR/ultrasound
• Develop high-sensitivity detection (sample, pathology) technology, etc.
• Strengthen existing performance materials business, develop new fields
• Strengthen industrial/professional optical units, etc.
• Develop integrated sensor/image processing systems
• Develop next-generation office systems, etc.
[¥billions]
FY11 FY12 FY13 FY14-FY16
Average

4-2-2. Investment Plan for Achieving Transform (Capital expenditure/Investment and financing)
19
Make priority investments in FY14, produce results by FY16.
Concentrate investment in growth fields and new business areas to swiftly transform businesses.
Business Technologies
Industrial
Healthcare
Others
Capital expenditure/ Investment and financing
¥240bn (three-year cumulative total)
ResultsNew Medium Term Business Plan
TRANSFORM 2016
FY13
¥61.9bn
FY12
¥68.0bn
FY11
¥44.9bn
¥174.8bn
FY14
¥100.0bn
FY15 to FY16
¥140.0bn
¥240.0bn • Invest in new product production equipment and IT systems
• Expand MFP channels, strengthen IT services and MPM, etc.
• Scintillator and diagnostic ultrasound probe production equipment
• Expand channels to clinics, strengthen medical IT, etc.
• Strengthen existing fields in performance materials and launch new ones
• Expand sensing instrument business field, etc.
• New R&D building, maintain business sites, etc.

1520
15 15 15 15 15
2.5
0
10
20
30
FY07 FY08 FY09 FY10 FY11 FY12 FY13 FY14 FY15 FY16
Common dividend Commemorative dividend
4-3. Stance Towards Returns to Shareholders
20
Acquisition oftreasury stocks
Proper judgments will be made in consideration of factors such as the progress of investment for growth, the free cash flow outlook, and stock prices
Consider returns to shareholders as an important management issueand work towards expanding and improving these returns
Trend of dividends per share
Stable dividend
Link to performance
20
Dividend policyAim to increase dividends while working towards the certain attainment of the goals in the new Medium Term Business Plan
Results Forecast

4-4-1. March 2015 (FY2014) Forecasts
21
Net sales : ¥1 trillion(YoY +6%)
Net income : ¥26.0 bn (YoY +19%)
Operating income : ¥62.0 bn (YoY +7%)
FOREX assumption: 1 US$ = ¥100 1 euro = ¥135
Dividend forecast : Increase by ¥2.5 per share on a year-on-year basis for a total of ¥20 per share (total annual)*Interim and year-end dividends: ¥10 per share each

Upfront investment
(8.0)
4-4-2. Key Points of FY2014 Performance Forecast
22
Achieve increased profitability while investing to speed up our transformation and achieve sustained growth.
Provide service ¥4bnHuman investment in service businesses, building GMA support system, strengthening OPS growth countries, strengthening BIC
R&D ¥2bnStrengthening next-generation engine, developing technology that coexists with the cloud and mobile applications, developing high-picture-quality probes
New business ¥2bn Developing new performance materials businesses
Sales volume
SG & A change
FY13 FY14
58.162.0
Price
Cost reduction
(9.0)
+44.6
+12.0
(43.7)
(¥bn)
Breakdown of ¥8bn in upfront investment
Analysis of operating income factors, FY13 vs FY14

Supplementary Information
23

Full-Year Forecasts for Year Ending March 2015(FY2014)
– Group Highlights
24
[¥billions]
Forecasts Results
Mar 2015 Mar 2014 YoY
Net sales(a) 1,000.0 943.8 6%
Operating income 62.0 58.1 7%
Operating income ratio 6.2% 6.2%
Ordinary income 57.0 54.6 4%
Net income 26.0 21.9 19%
Net income ratio 2.6% 2.3%
EPS [Yen] 50.49 41.38
CAPEX 60.0 47.4
Depreciation 55.0 47.4
R&D expenses 75.0 71.2
FCF 2.0 34.2
Investment and lending 40.0 14.5
FOREX [Yen] USD 100.00 100.24
euro 135.00 134.37
Net sales Operating
income
USD 3.0 0.3
euro 1.6 0.8
FOREX impact per 1yen movement(Full year/billions of yen)

Full-Year Forecasts for Year Ending March 2015 (FY2014)
– Segment Highlights
25
[\ billions]
YOY
Business Technologies 800.0 739.9 8%
Office Services 600.0 567.1 6%
Commercial/Industrial print 200.0 172.9 16%
Healthcare 90.0 82.4 9%
Industrial Business 110.0 116.1 -5%
Industrial Optical Systems 61.0 57.8 5%
Performance Materials 49.0 58.3 -16%
Others 0.0 5.3 -
Group Overall 1,000.0 943.8 6%
Business Technologies 72.0 9.0% 66.6 9.0% 8%
Healthcare 7.0 7.8% 4.5 5.5% 56%
Industrial Business 12.0 10.9% 15.2 13.1% -21%
Eliminations and Corporate -29.0 - -28.2 - -
Group Overall 62.0 6.2% 58.1 6.2% 7%
Operating incomeOutlook Results
Mar 2015 Mar 2014
Mar 2014Net Sales
Outlook Results
Mar 2015