Konica Minolta, Inc.3rd Quarter/FY2016 ending in March ... · © 2016 Konica Minolta, Inc. Konica...
45
© 2016 Konica Minolta, Inc. Konica Minolta, Inc. 3 rd Quarter/FY2016 ending in March 2017 Consolidated Financial Results - Earnings - Three months: October 1, 2016 – December 31, 2016 Nine months: April 1, 2016 – December 31, 2016 - Announced on January 31, 2017 - - Measurement – Shoei Yamana President and CEO Konica Minolta, Inc. - Earnings – Seiji Hatano Senior Executive Officer Chief Financial Officer Konica Minolta, Inc.
Transcript of Konica Minolta, Inc.3rd Quarter/FY2016 ending in March ... · © 2016 Konica Minolta, Inc. Konica...
© 2016 Konica Minolta, Inc.
Konica Minolta, Inc.3rd Quarter/FY2016 ending in March 2017
Consolidated Financial Results - Earnings -
Three months: October 1, 2016 – December 31, 2016Nine months: April 1, 2016 – December 31, 2016- Announced on January 31, 2017 -
- Measurement –
Shoei YamanaPresident and CEOKonica Minolta, Inc.
- Earnings –
Seiji HatanoSenior Executive OfficerChief Financial OfficerKonica Minolta, Inc.
© 2016 Konica Minolta, Inc.
Konica Minolta, Inc.3rd Quarter/FY2016 ending in March 2017
Consolidated Financial Results - Earnings -
Three months: October 1, 2016 – December 31, 2016Nine months: April 1, 2016 – December 31, 2016- Announced on January 31, 2017 -
Seiji HatanoSenior Executive OfficerChief Financial OfficerKonica Minolta, Inc.
© 2016 Konica Minolta, Inc.© 2016 Konica Minolta, Inc.
Revenue
2
[¥ billions]
FY2016 3Q Overview
Revenue
Busin
ess
Technolo
gie
sK
onic
aM
inolt
a
Profit*
US$
euroForex
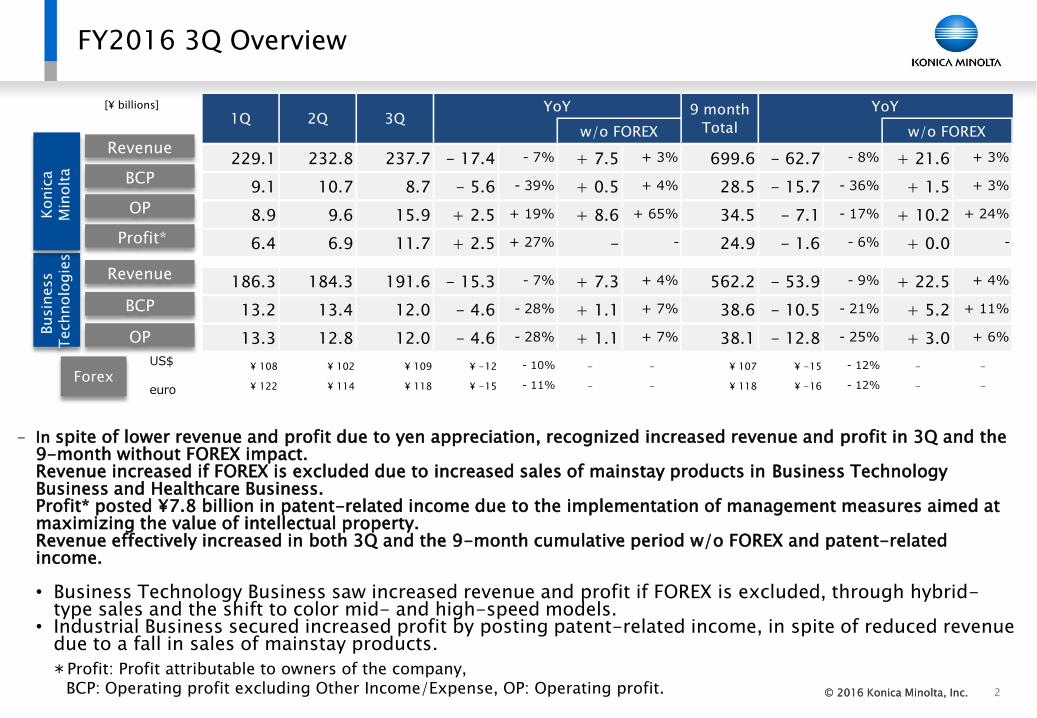
*Profit: Profit attributable to owners of the company, BCP: Operating profit excluding Other Income/Expense, OP: Operating profit.
BCP
OP
BCP
OP
- In spite of lower revenue and profit due to yen appreciation, recognized increased revenue and profit in 3Q and the 9-month without FOREX impact. Revenue increased if FOREX is excluded due to increased sales of mainstay products in Business Technology Business and Healthcare Business. Profit* posted ¥7.8 billion in patent-related income due to the implementation of management measures aimed at maximizing the value of intellectual property.Revenue effectively increased in both 3Q and the 9-month cumulative period w/o FOREX and patent-related income.
• Business Technology Business saw increased revenue and profit if FOREX is excluded, through hybrid-type sales and the shift to color mid- and high-speed models.
• Industrial Business secured increased profit by posting patent-related income, in spite of reduced revenue due to a fall in sales of mainstay products.
229.1 232.8 237.7 - 17.4 - 7% + 7.5 + 3% 699.6 - 62.7 - 8% + 21.6 + 3%
9.1 10.7 8.7 - 5.6 - 39% + 0.5 + 4% 28.5 - 15.7 - 36% + 1.5 + 3%
8.9 9.6 15.9 + 2.5 + 19% + 8.6 + 65% 34.5 - 7.1 - 17% + 10.2 + 24%
6.4 6.9 11.7 + 2.5 + 27% - - 24.9 - 1.6 - 6% + 0.0 -
186.3 184.3 191.6 - 15.3 - 7% + 7.3 + 4% 562.2 - 53.9 - 9% + 22.5 + 4%
13.2 13.4 12.0 - 4.6 - 28% + 1.1 + 7% 38.6 - 10.5 - 21% + 5.2 + 11%
13.3 12.8 12.0 - 4.6 - 28% + 1.1 + 7% 38.1 - 12.8 - 25% + 3.0 + 6%
¥ 108 ¥ 102 ¥ 109 ¥ -12 - 10% - - ¥ 107 ¥ -15 - 12% - -
¥ 122 ¥ 114 ¥ 118 ¥ -15 - 11% - - ¥ 118 ¥ -16 - 12% - -
1Q 2Qw/o FOREX
3Q9 month
Total w/o FOREX
YoYYoY
© 2016 Konica Minolta, Inc.© 2016 Konica Minolta, Inc. 3
FY2016 3Q / 9months Operating Profit Analysis
[¥ billions]
BF* ESF*
FY15/9M Business
Technologies
Healthcare Industrial
business
Corporate FOREX Other income
and expense
FY16/9M
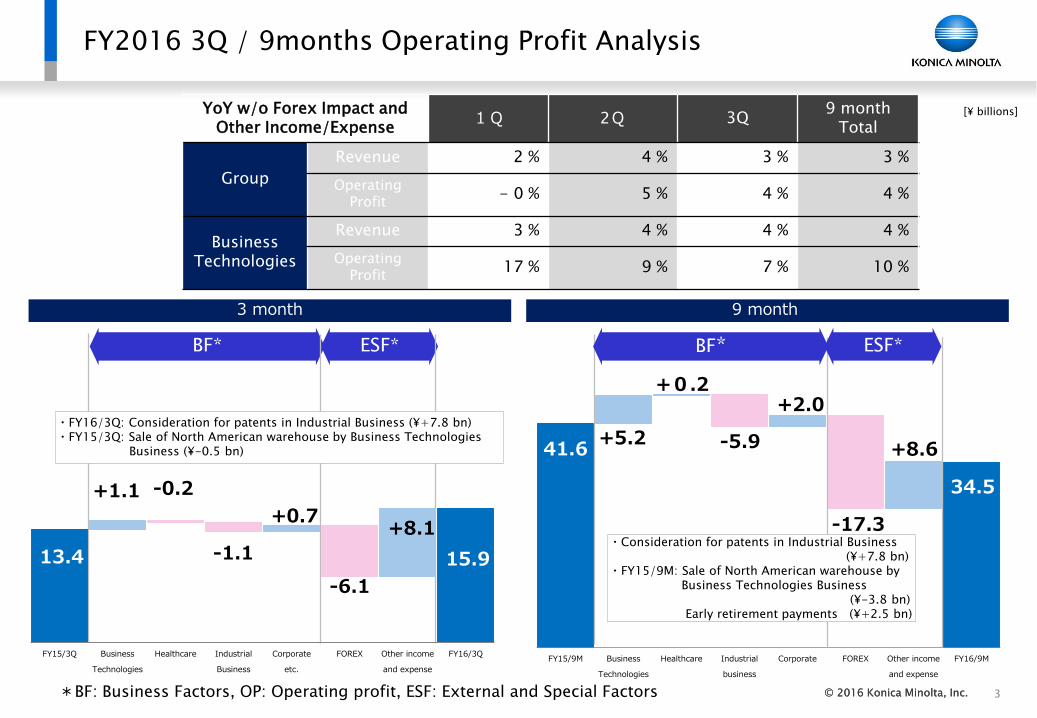
+5.2 -5.9
+0.2+2.0
-17.3
+8.641.6
34.5
BF* ESF*
YoY w/o Forex Impact and Other Income/Expense
1Q 2Q 3Q9 month
Total
Group
Revenue 2 % 4 % 3 % 3 %
Operating Profit
- 0 % 5 % 4 % 4 %
BusinessTechnologies
Revenue 3 % 4 % 4 % 4 %
Operating Profit
17 % 9 % 7 % 10 %
FY15/3Q Business
Technologies
Healthcare Industrial
Business
Corporate
etc.
FOREX Other income
and expense
FY16/3Q
+1.1
-1.1
-0.2
+0.7
-6.1
+8.1
13.4 15.9
・FY16/3Q: Consideration for patents in Industrial Business (¥+7.8 bn)・FY15/3Q: Sale of North American warehouse by Business Technologies
Business (¥-0.5 bn)
・Consideration for patents in Industrial Business (¥+7.8 bn)
・FY15/9M: Sale of North American warehouse by Business Technologies Business
(¥-3.8 bn)Early retirement payments (¥+2.5 bn)
3 month 9 month
*BF: Business Factors, OP: Operating profit, ESF: External and Special Factors
© 2016 Konica Minolta, Inc.© 2016 Konica Minolta, Inc. 4
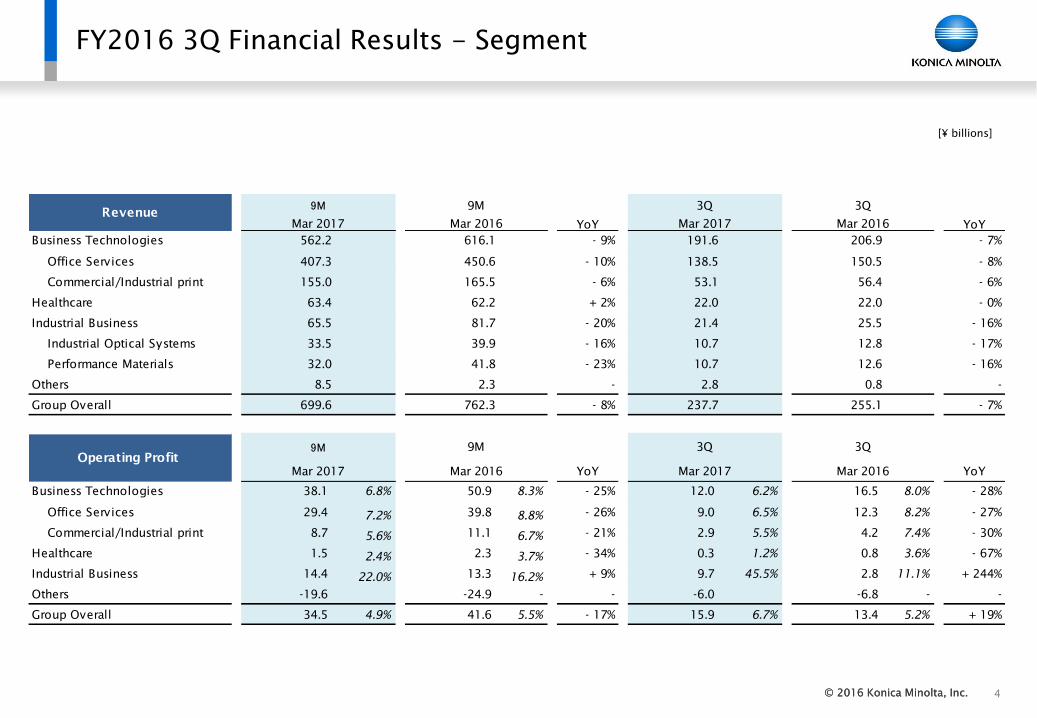
FY2016 3Q Financial Results - Segment
[¥ billions]
YoY YoY
Business Technologies 562.2 616.1 - 9% 191.6 206.9 - 7%
Office Services 407.3 450.6 - 10% 138.5 150.5 - 8%
Commercial/Industrial print 155.0 165.5 - 6% 53.1 56.4 - 6%
Healthcare 63.4 62.2 + 2% 22.0 22.0 - 0%
Industrial Business 65.5 81.7 - 20% 21.4 25.5 - 16%
Industrial Optical Systems 33.5 39.9 - 16% 10.7 12.8 - 17%
Performance Materials 32.0 41.8 - 23% 10.7 12.6 - 16%
Others 8.5 2.3 - 2.8 0.8 -
Group Overall 699.6 762.3 - 8% 237.7 255.1 - 7%
YoY YoY
Business Technologies 38.1 6.8% 50.9 8.3% - 25% 12.0 6.2% 16.5 8.0% - 28%
Office Services 29.4 7.2% 39.8 8.8% - 26% 9.0 6.5% 12.3 8.2% - 27%
Commercial/Industrial print 8.7 5.6% 11.1 6.7% - 21% 2.9 5.5% 4.2 7.4% - 30%
Healthcare 1.5 2.4% 2.3 3.7% - 34% 0.3 1.2% 0.8 3.6% - 67%
Industrial Business 14.4 22.0% 13.3 16.2% + 9% 9.7 45.5% 2.8 11.1% + 244%
Others -19.6 -24.9 - - -6.0 -6.8 - -
Group Overall 34.5 4.9% 41.6 5.5% - 17% 15.9 6.7% 13.4 5.2% + 19%
3Q
Mar 2017 Mar 2016
3Q
Mar 2016Mar 2017
3Q 3Q
Operating Profit
9M 9M
Mar 2017 Mar 2016
9M 9M
Mar 2017 Mar 2016
Revenue
© 2016 Konica Minolta, Inc.© 2016 Konica Minolta, Inc. 5
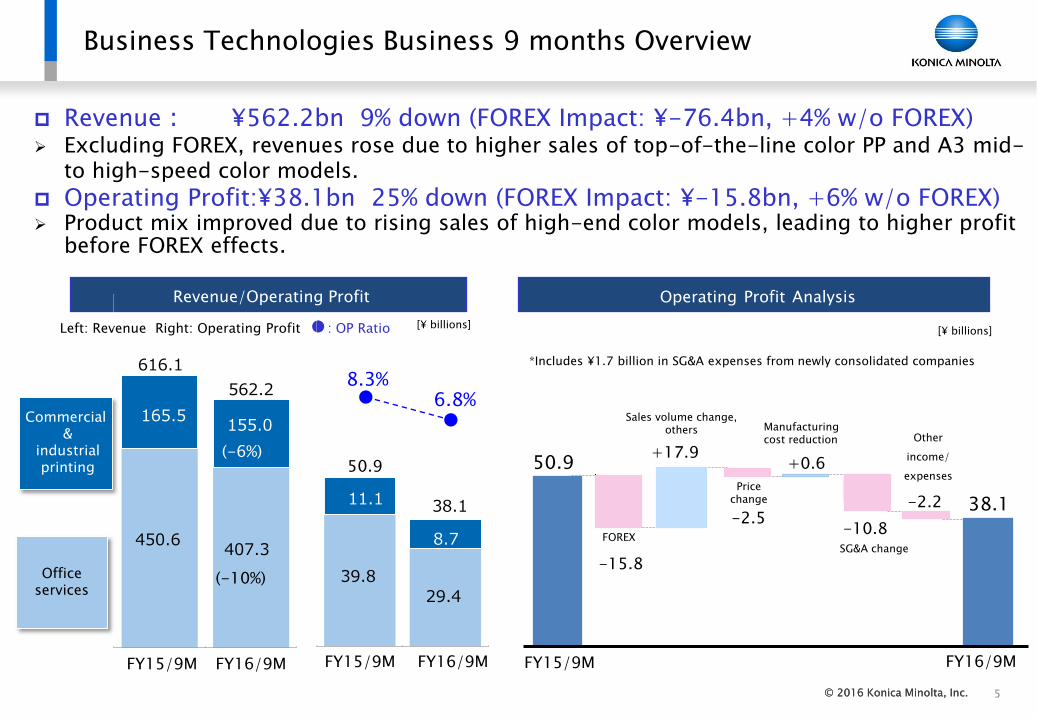
Business Technologies Business 9 months Overview
Revenue: ¥562.2bn 9% down (FOREX Impact: ¥-76.4bn, +4% w/o FOREX) Excluding FOREX, revenues rose due to higher sales of top-of-the-line color PP and A3 mid-
to high-speed color models.
Operating Profit:¥38.1bn 25% down (FOREX Impact: ¥-15.8bn, +6% w/o FOREX) Product mix improved due to rising sales of high-end color models, leading to higher profit
before FOREX effects.
*Includes ¥1.7 billion in SG&A expenses from newly consolidated companies
Operating Profit Analysis
Left: Revenue Right: Operating Profit ●: OP Ratio [¥ billions]
Revenue/Operating Profit
[¥ billions]
450.6407.3
165.5155.0
562.2
616.1
39.8
29.4
11.1
8.7
38.1
FY16/9MFY15/9M
(-6%)
(-10%)
8.3%6.8%
FY16/9M
50.9
FY15/9M
+0.6
-10.8
-15.8
38.1-2.5
+17.950.9
-2.2
FY15/9M FY16/9M
Manufacturing cost reduction
Sales volume change, others
SG&A changeFOREX
Price change
Other
income/
expenses
Officeservices
Commercial&
industrialprinting
© 2016 Konica Minolta, Inc.© 2016 Konica Minolta, Inc. 6
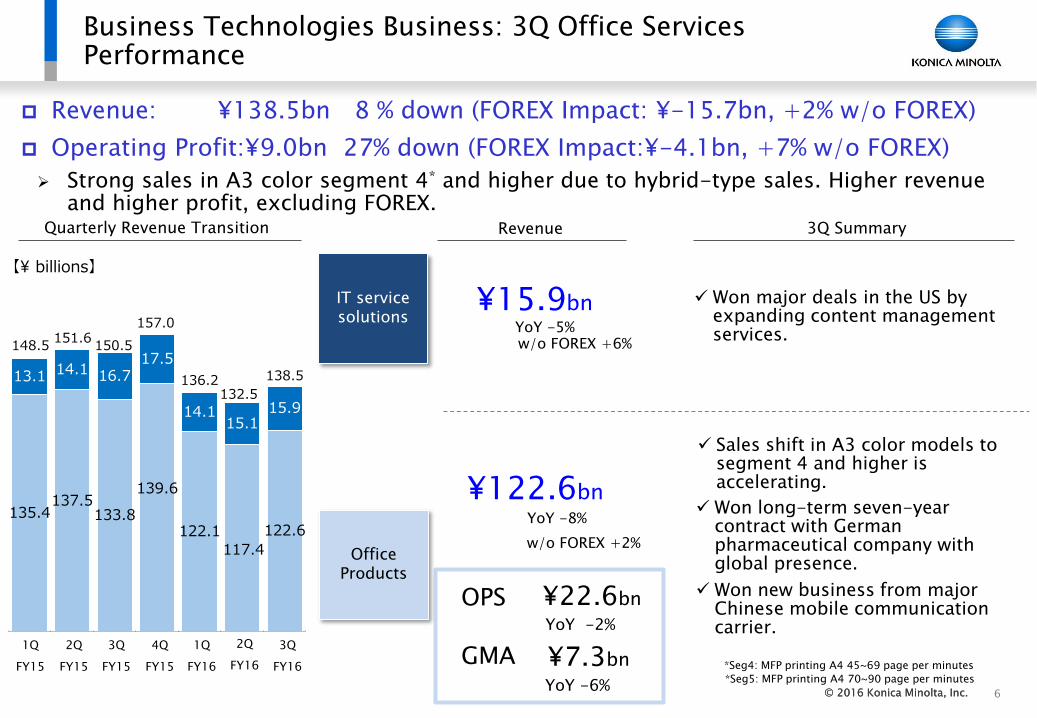
Business Technologies Business: 3Q Office Services Performance
Quarterly Revenue Transition Revenue
¥15.9bnYoY -5%w/o FOREX +6%
¥122.6bnYoY -8%
w/o FOREX +2%
【¥ billions】
¥7.3bn
YoY -6%
¥22.6bn
YoY -2%
GMA
OPS
OfficeProducts
IT servicesolutions
Revenue: ¥138.5bn 8 % down (FOREX Impact: ¥-15.7bn, +2% w/o FOREX)
Operating Profit:¥9.0bn 27% down (FOREX Impact:¥-4.1bn, +7% w/o FOREX)
3Q Summary
*Seg4: MFP printing A4 45~69 page per minutes
*Seg5: MFP printing A4 70~90 page per minutes
Strong sales in A3 color segment 4* and higher due to hybrid-type sales. Higher revenue and higher profit, excluding FOREX.
Won major deals in the US by expanding content management services.
Won long-term seven-year contract with German pharmaceutical company with global presence.
Won new business from major Chinese mobile communication carrier.
Sales shift in A3 color models to segment 4 and higher is accelerating.
135.4137.5
133.8
139.6
122.1
117.4
122.6
13.1 14.1 16.717.5
14.115.1
15.9
148.5151.6
150.5
157.0
136.2132.5
138.5
1Q
FY15
2Q
FY15
3Q
FY15
4Q
FY15
2Q
FY16
3Q
FY16
1Q
FY16
© 2016 Konica Minolta, Inc.© 2016 Konica Minolta, Inc. 7
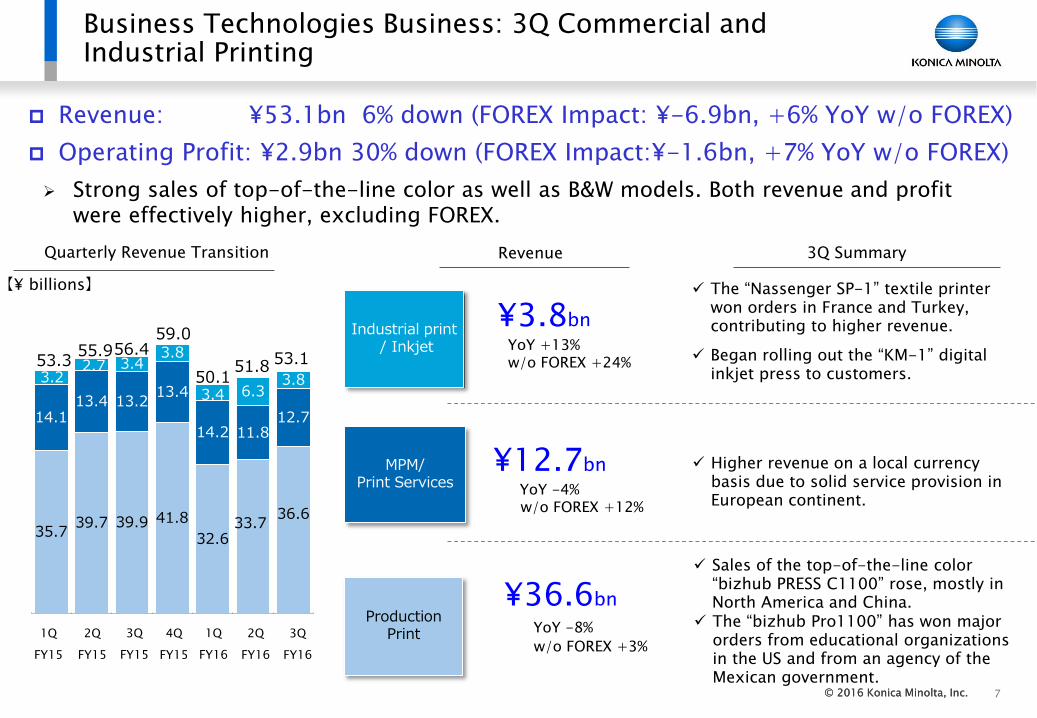
Business Technologies Business: 3Q Commercial and Industrial Printing
¥3.8bn
YoY +13%w/o FOREX +24%
¥12.7bn
YoY -4%w/o FOREX +12%
¥36.6bn
YoY -8%
w/o FOREX +3%
【¥ billions】
Revenue: ¥53.1bn 6% down (FOREX Impact: ¥-6.9bn, +6% YoY w/o FOREX)
Operating Profit: ¥2.9bn 30% down (FOREX Impact:¥-1.6bn, +7% YoY w/o FOREX)
Quarterly Revenue Transition Revenue
ProductionPrint
MPM/Print Services
Industrial print/ Inkjet
3Q Summary
Strong sales of top-of-the-line color as well as B&W models. Both revenue and profit were effectively higher, excluding FOREX.
Sales of the top-of-the-line color “bizhub PRESS C1100” rose, mostly in North America and China.
The “Nassenger SP-1” textile printer won orders in France and Turkey, contributing to higher revenue.
The “bizhub Pro1100” has won major orders from educational organizations in the US and from an agency of the Mexican government.
Higher revenue on a local currency basis due to solid service provision in European continent.
Began rolling out the “KM-1” digital inkjet press to customers.
35.739.7 39.9 41.8
32.633.7
36.6
14.113.4 13.2
13.4
14.2 11.812.7
3.22.7 3.4
3.8
3.4 6.33.8
53.355.956.4
59.0
50.151.8 53.1
1Q
FY15
2Q
FY15
3Q
FY15
4Q
FY15
1Q
FY16
2Q
FY16
3Q
FY16
© 2016 Konica Minolta, Inc.© 2016 Konica Minolta, Inc. 8
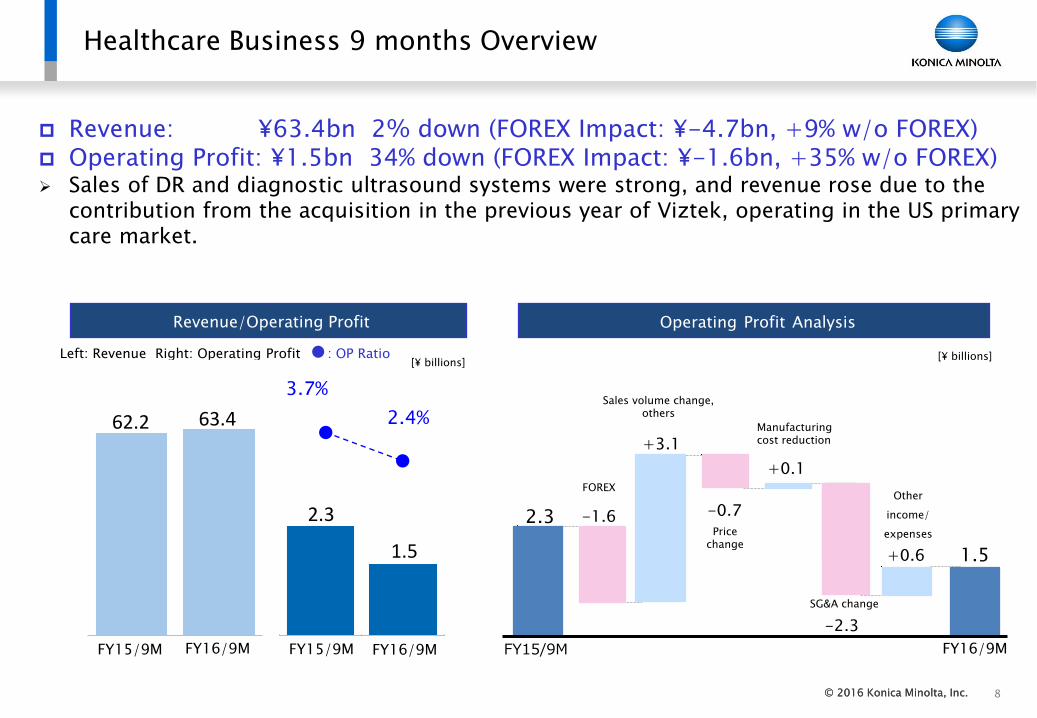
Healthcare Business 9 months Overview
Operating Profit AnalysisRevenue/Operating Profit
Left: Revenue Right: Operating Profit ●: OP Ratio [¥ billions][¥ billions]
Manufacturing cost reduction
Sales volume change, others
SG&A change
FOREX
Price change
Other
income/
expenses
Revenue: ¥63.4bn 2% down (FOREX Impact: ¥-4.7bn, +9% w/o FOREX) Operating Profit: ¥1.5bn 34% down (FOREX Impact: ¥-1.6bn, +35% w/o FOREX) Sales of DR and diagnostic ultrasound systems were strong, and revenue rose due to the
contribution from the acquisition in the previous year of Viztek, operating in the US primary care market.
2.3
1.5
3.7%
2.4%62.2 63.4
FY15/9M FY16/9M FY15/9M FY16/9M
+0.1
-2.3
+3.1
-0.72.3
+0.6 1.5
FY16/9M
-1.6
FY15/9M
© 2016 Konica Minolta, Inc.© 2016 Konica Minolta, Inc. 9
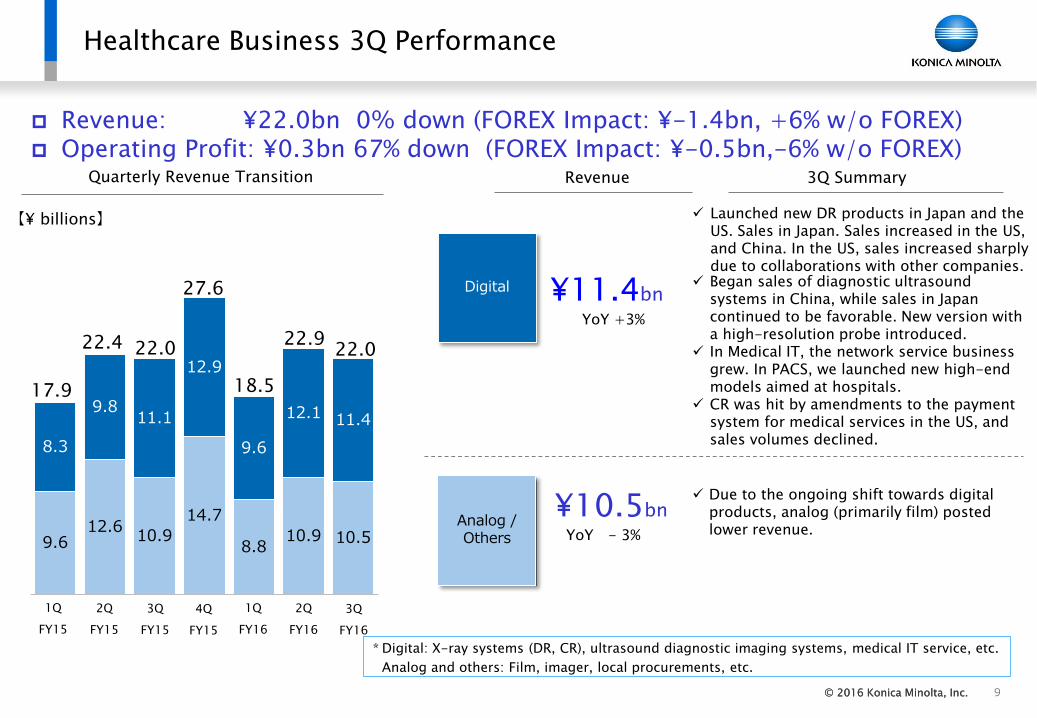
Healthcare Business 3Q Performance
【¥ billions】
¥11.4bn
YoY +3%
¥10.5bn
YoY - 3%
Quarterly Revenue Transition Revenue
* Digital: X-ray systems (DR, CR), ultrasound diagnostic imaging systems, medical IT service, etc.
Analog and others: Film, imager, local procurements, etc.
Digital
Analog /Others
3Q Summary
Revenue: ¥22.0bn 0% down (FOREX Impact: ¥-1.4bn, +6% w/o FOREX) Operating Profit: ¥0.3bn 67% down (FOREX Impact: ¥-0.5bn,-6% w/o FOREX)
Launched new DR products in Japan and the US. Sales in Japan. Sales increased in the US, and China. In the US, sales increased sharply due to collaborations with other companies.
Due to the ongoing shift towards digital products, analog (primarily film) posted lower revenue.
Began sales of diagnostic ultrasound systems in China, while sales in Japan continued to be favorable. New version with a high-resolution probe introduced.
In Medical IT, the network service business grew. In PACS, we launched new high-end models aimed at hospitals.
CR was hit by amendments to the payment system for medical services in the US, and sales volumes declined.
1Q
FY15
2Q
FY15
3Q
FY15
4Q
FY15
1Q
FY16
2Q
FY16
9.612.6
10.9
14.7
8.810.9 10.5
8.3
9.811.1
12.9
9.6
12.1 11.4
18.517.9
22.4 22.0
27.6
22.922.0
3Q
FY16
© 2016 Konica Minolta, Inc.© 2016 Konica Minolta, Inc.
13.314.4
16.3% 22.0%
41.832.0
39.9
33.5
81.7
65.5
10
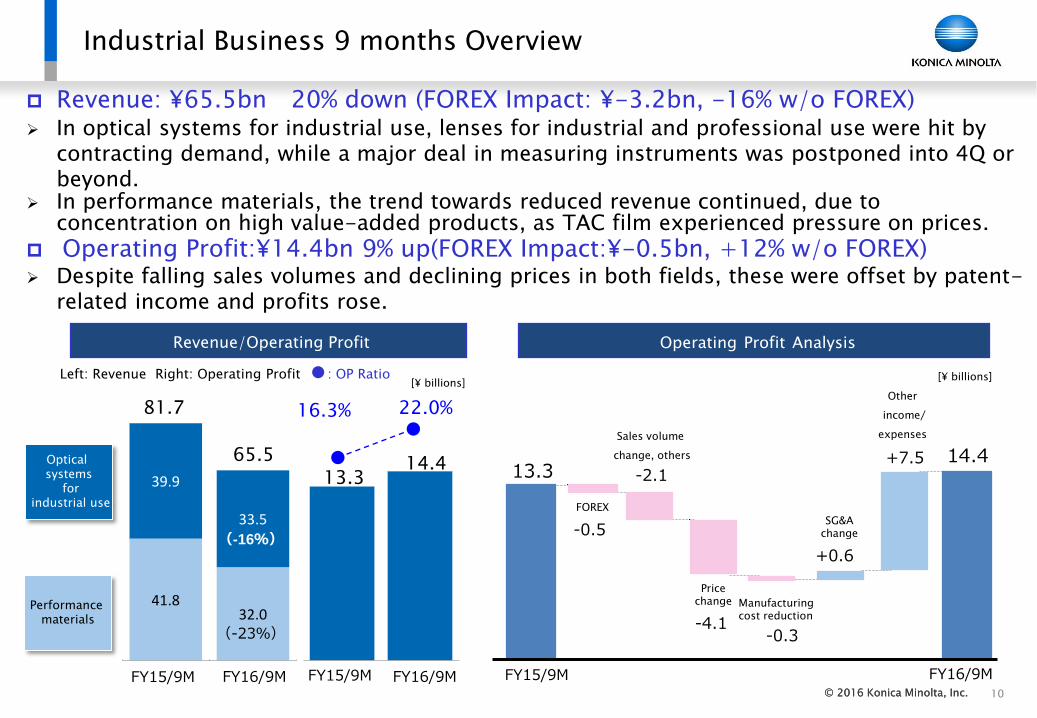
Industrial Business 9 months Overview
Performance materials
Optical systems
forindustrial use
Revenue: ¥65.5bn 20% down (FOREX Impact: ¥-3.2bn, -16% w/o FOREX) In optical systems for industrial use, lenses for industrial and professional use were hit by
contracting demand, while a major deal in measuring instruments was postponed into 4Q or beyond.
In performance materials, the trend towards reduced revenue continued, due to concentration on high value-added products, as TAC film experienced pressure on prices.
Operating Profit:¥14.4bn 9% up(FOREX Impact:¥-0.5bn, +12% w/o FOREX) Despite falling sales volumes and declining prices in both fields, these were offset by patent-
related income and profits rose.
Operating Profit AnalysisRevenue/Operating Profit
Left: Revenue Right: Operating Profit ●: OP Ratio [¥ billions][¥ billions]
Manufacturing
cost reduction
Sales volume
change, others
SG&A
change
FOREX
Price
change
Other
income/
expenses
FY15/9M FY16/9M
-0.3
+0.6
-0.5
-4.1
-2.1+7.5
13.314.4
FY15/9M FY16/9M FY15/9M FY16/9M
(-16%)
(-23%)
© 2016 Konica Minolta, Inc.© 2016 Konica Minolta, Inc. 11
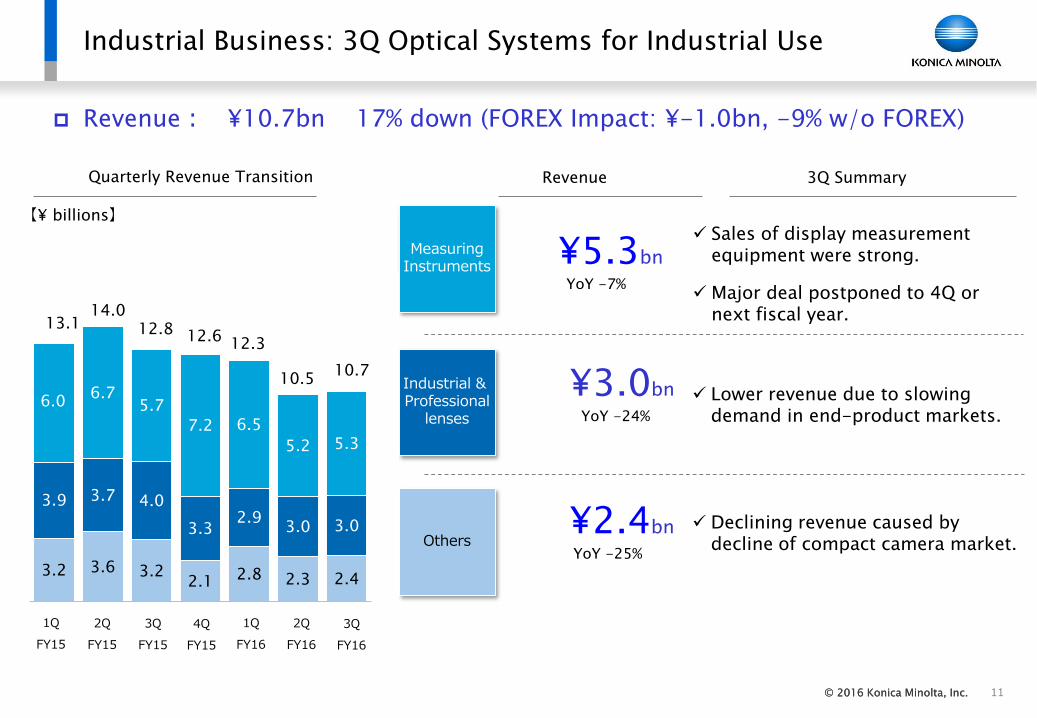
Industrial Business: 3Q Optical Systems for Industrial Use
【¥ billions】
¥5.3bn
YoY -7%
¥2.4bn
YoY -25%
¥3.0bn
YoY -24%
Quarterly Revenue Transition Revenue
Industrial & Professional
lenses
MeasuringInstruments
Others
3Q Summary
Revenue: ¥10.7bn 17% down (FOREX Impact: ¥-1.0bn, -9% w/o FOREX)
Sales of display measurement equipment were strong.
Major deal postponed to 4Q or next fiscal year.
Lower revenue due to slowing demand in end-product markets.
Declining revenue caused by decline of compact camera market.
1Q
FY15
2Q
FY15
3Q
FY15
4Q
FY15
1Q
FY16
2Q
FY16
3Q
FY16
3.2 3.6 3.22.1 2.8 2.3 2.4
3.9 3.7 4.0
3.32.9
3.0 3.0
6.06.7
5.7
7.2 6.5
5.2 5.3
12.613.1
14.012.8
10.7
12.3
10.5
© 2016 Konica Minolta, Inc.© 2016 Konica Minolta, Inc. 12
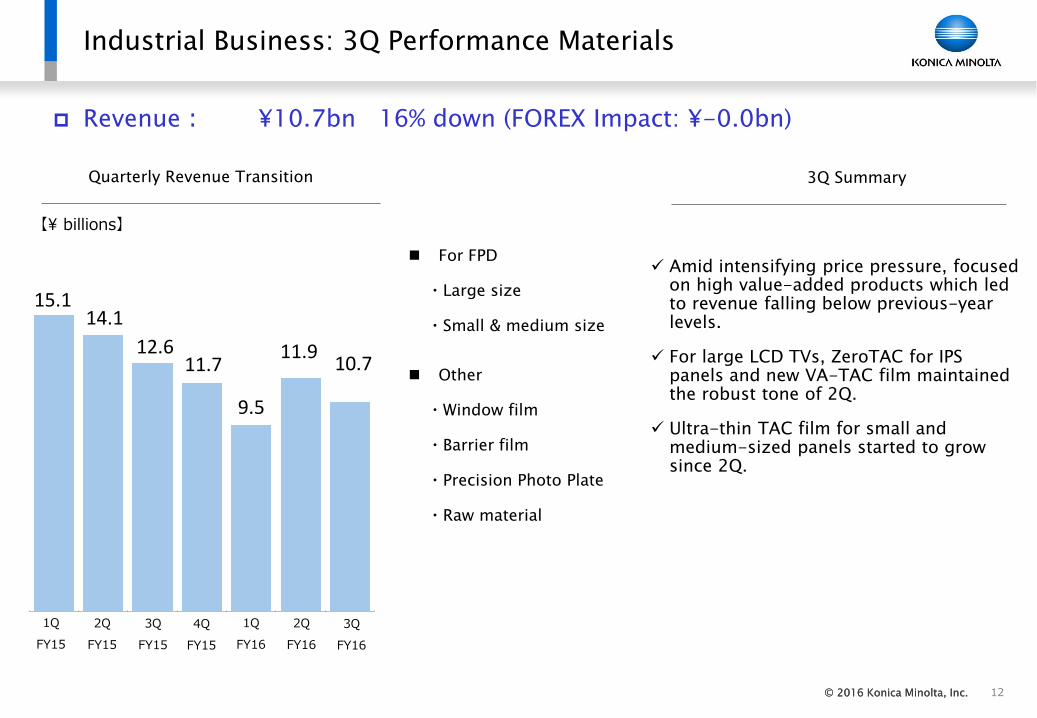
Industrial Business: 3Q Performance Materials
【¥ billions】
Quarterly Revenue Transition 3Q Summary
Revenue: ¥10.7bn 16% down (FOREX Impact: ¥-0.0bn)
For FPD
・Large size
・Small & medium size
Other
・Window film
・Barrier film
・Precision Photo Plate
・Raw material
Amid intensifying price pressure, focused on high value-added products which led to revenue falling below previous-year levels.
For large LCD TVs, ZeroTAC for IPS panels and new VA-TAC film maintained the robust tone of 2Q.
Ultra-thin TAC film for small and medium-sized panels started to grow since 2Q.
15.1 14.1
12.6 11.7
9.5
11.9 10.7
1Q
FY15
2Q
FY15
3Q
FY15
4Q
FY15
1Q
FY16
2Q
FY16
3Q
FY16
© 2016 Konica Minolta, Inc.© 2016 Konica Minolta, Inc.
31.1
48.7
-77.5
-58.4 -46.4
-9.7
FY15 FY16
12.7 13.0
-18.7
-8.7
-6.0
4.2
FY15 FY16
13
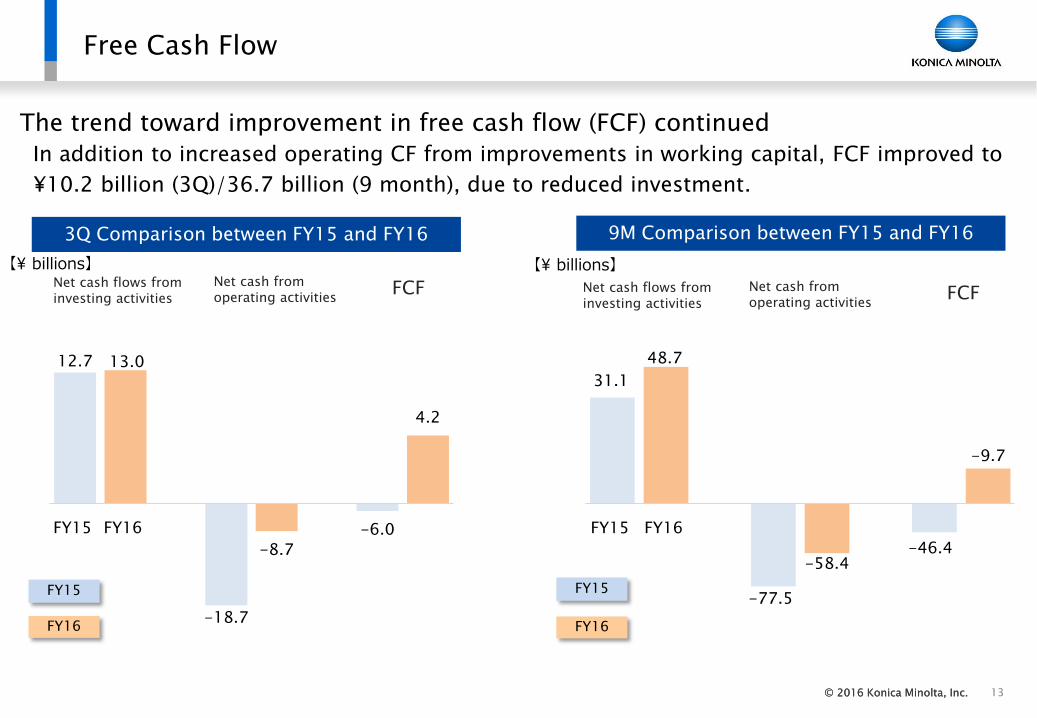
Free Cash Flow
The trend toward improvement in free cash flow (FCF) continued
In addition to increased operating CF from improvements in working capital, FCF improved to
¥10.2 billion (3Q)/36.7 billion (9 month), due to reduced investment.
Net cash flows from investing activities
FCFNet cash from operating activities
3Q Comparison between FY15 and FY16 9M Comparison between FY15 and FY16
Net cash flows from investing activities
FCFNet cash from operating activities
FY15
FY16
FY15
FY16
【¥ billions】 【¥ billions】
© 2016 Konica Minolta, Inc.© 2016 Konica Minolta, Inc. 14
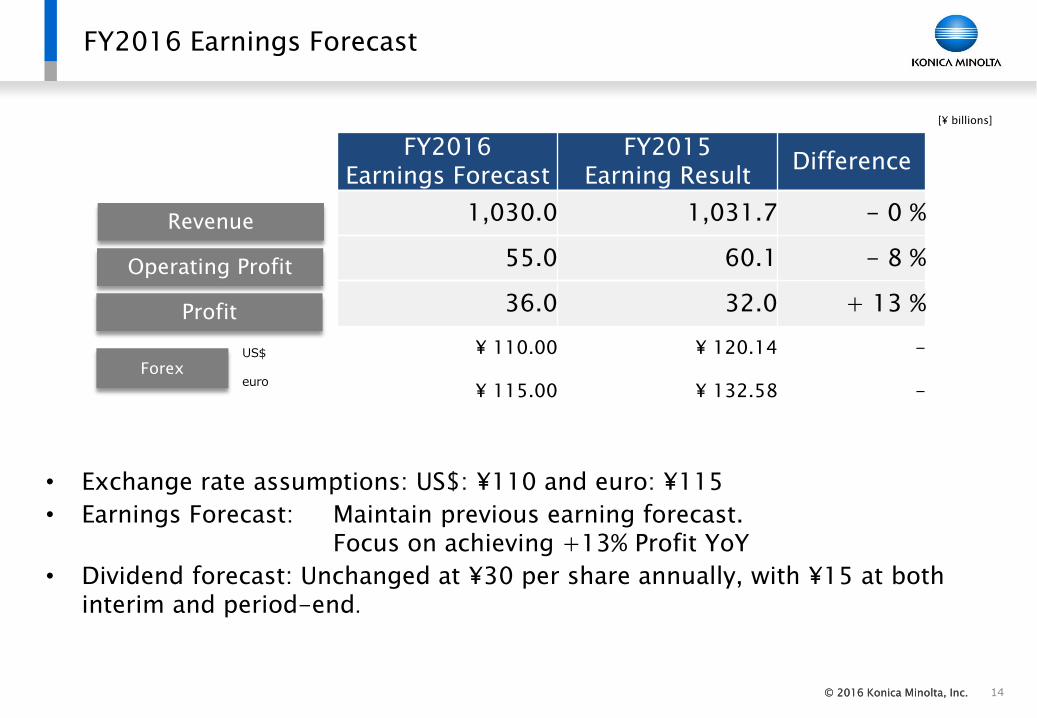
FY2016 Earnings Forecast
[¥ billions]
US$
euro
Operating Profit
Revenue
Profit
Forex
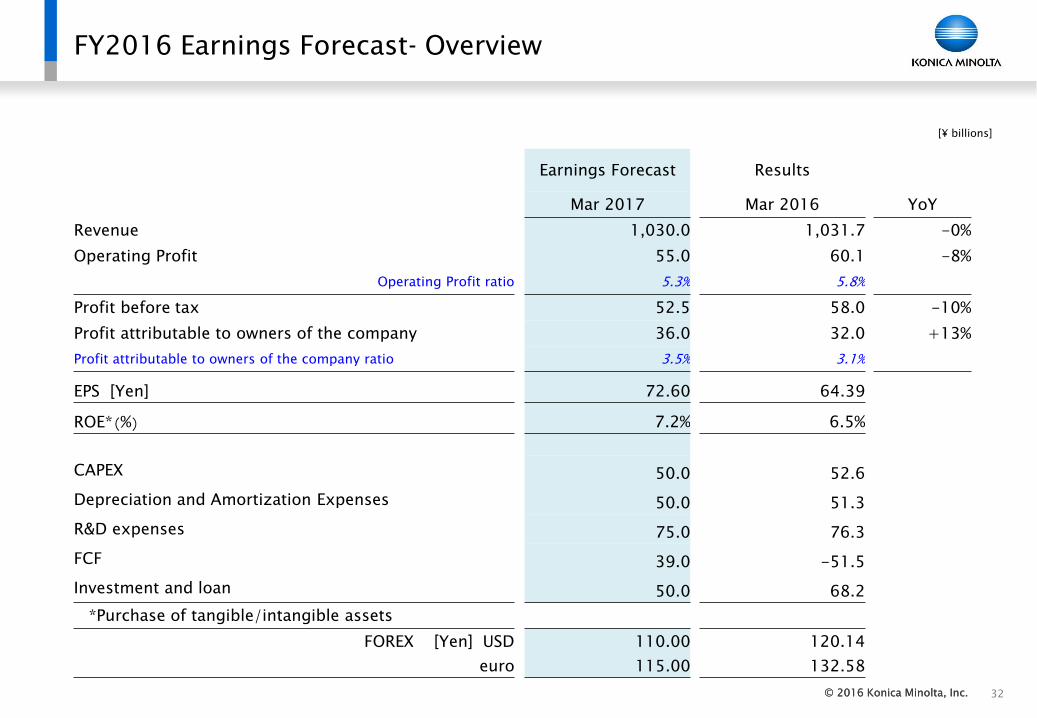
• Exchange rate assumptions: US$: ¥110 and euro: ¥115
• Earnings Forecast: Maintain previous earning forecast.Focus on achieving +13% Profit YoY
• Dividend forecast: Unchanged at ¥30 per share annually, with ¥15 at both interim and period-end.
FY2016Earnings Forecast
FY2015 Earning Result
Difference
1,030.0 1,031.7 - 0 %
55.0 60.1 - 8 %
36.0 32.0 + 13 %
¥ 110.00 ¥ 120.14 -
¥ 115.00 ¥ 132.58 -
© 2016 Konica Minolta, Inc.© 2016 Konica Minolta, Inc. 15
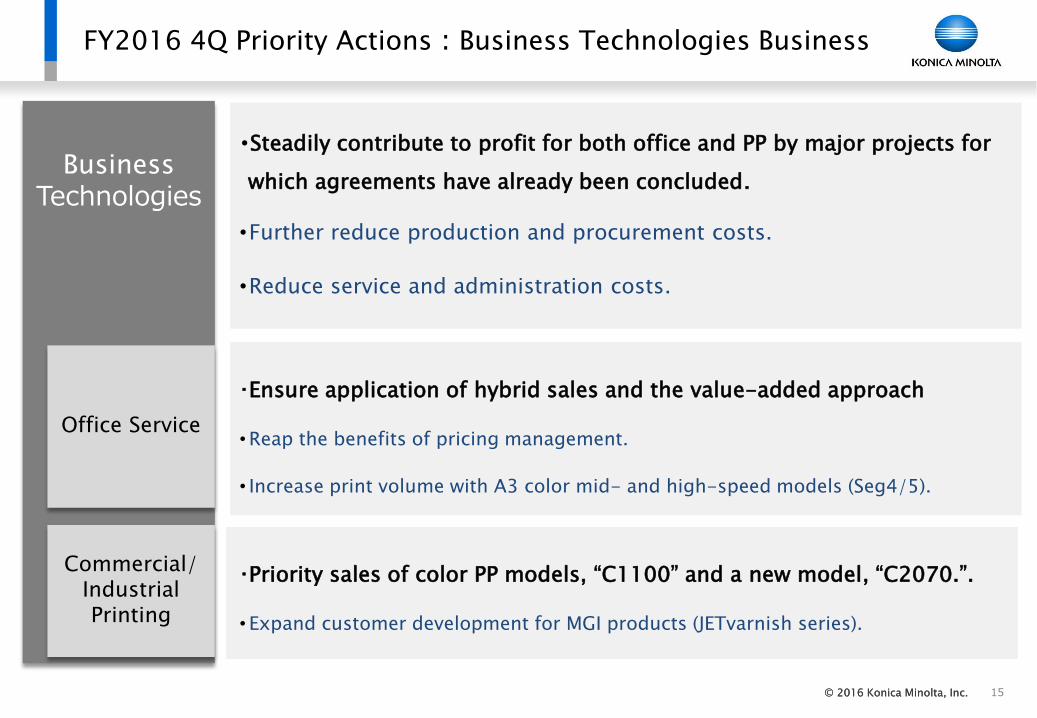
FY2016 4Q Priority Actions:Business Technologies Business
・Ensure application of hybrid sales and the value-added approach
•Reap the benefits of pricing management.
• Increase print volume with A3 color mid- and high-speed models (Seg4/5).
・Priority sales of color PP models, “C1100” and a new model, “C2070.”.
• Expand customer development for MGI products (JETvarnish series).
BusinessTechnologies
・Steadily contribute to profit for both office and PP by major projects for
which agreements have already been concluded.
•Further reduce production and procurement costs.
•Reduce service and administration costs.
Commercial/Industrial Printing
Office Service
© 2016 Konica Minolta, Inc.© 2016 Konica Minolta, Inc. 16
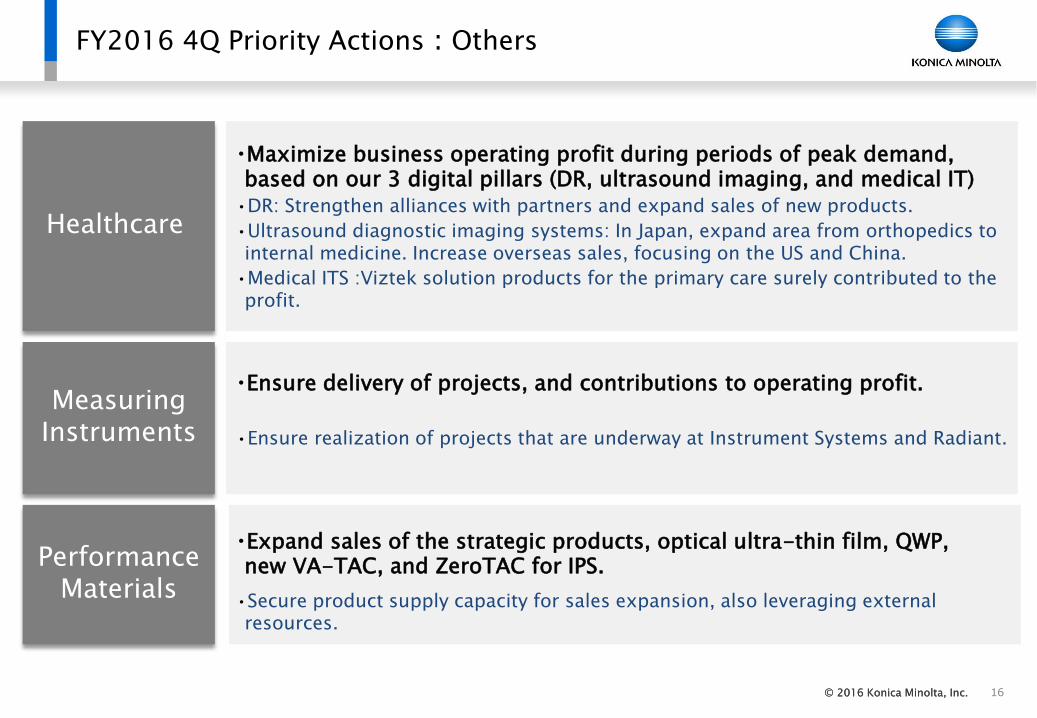
FY2016 4Q Priority Actions:Others
・Maximize business operating profit during periods of peak demand, based on our 3 digital pillars (DR, ultrasound imaging, and medical IT)
•DR: Strengthen alliances with partners and expand sales of new products.
•Ultrasound diagnostic imaging systems: In Japan, expand area from orthopedics to internal medicine. Increase overseas sales, focusing on the US and China.
•Medical ITS :Viztek solution products for the primary care surely contributed to the profit.
Healthcare
Performance Materials
・Ensure delivery of projects, and contributions to operating profit.
•Ensure realization of projects that are underway at Instrument Systems and Radiant.
Measuring Instruments
・Expand sales of the strategic products, optical ultra-thin film, QWP, new VA-TAC, and ZeroTAC for IPS.
•Secure product supply capacity for sales expansion, also leveraging external resources.
© 2016 Konica Minolta, Inc.
Konica Minolta, Inc.3rd Quarter/FY2016 ending in March 2017
Consolidated Financial Results - Measurement -
Three months: October 1, 2016 – December 31, 2016Nine months: April 1, 2016 – December 31, 2016- Announced on January 31, 2017 -
Shoei YamanaPresident and CEOKonica Minolta, Inc.
© 2016 Konica Minolta, Inc.
Intellectual Property Value Maximized through Signing of Patent Licensing Agreement
18
© 2016 Konica Minolta, Inc.© 2016 Konica Minolta, Inc.
Intellectual Property Value Maximized through Signing of Patent Licensing Agreement
19
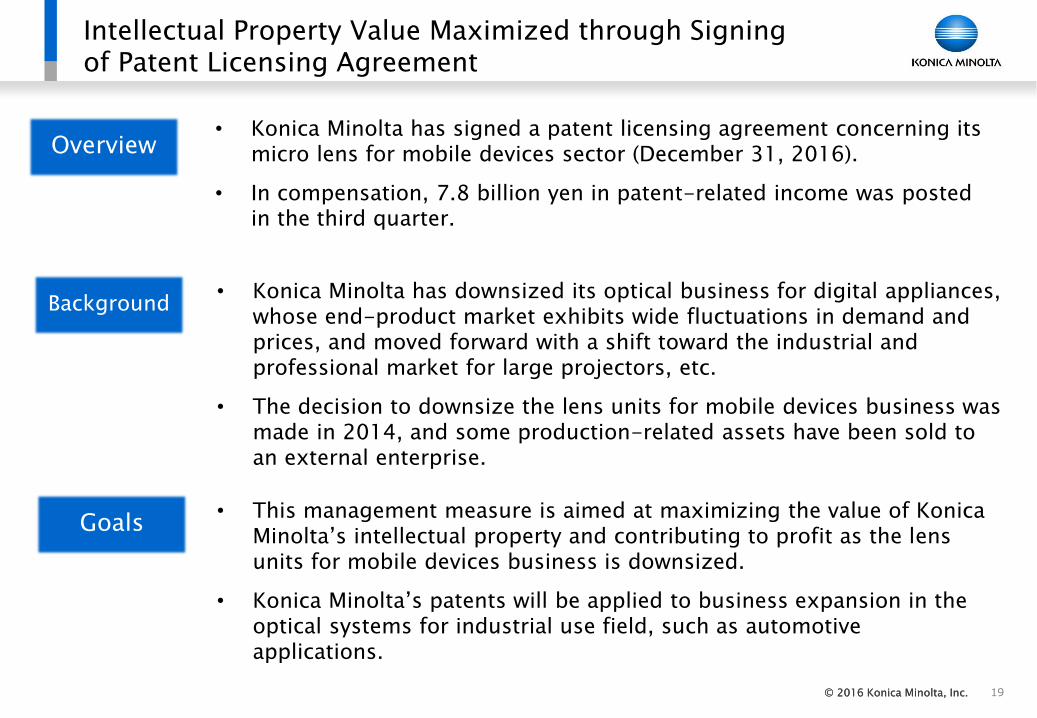
• Konica Minolta has signed a patent licensing agreement concerning its micro lens for mobile devices sector (December 31, 2016).
• In compensation, 7.8 billion yen in patent-related income was posted in the third quarter.
• This management measure is aimed at maximizing the value of Konica Minolta’s intellectual property and contributing to profit as the lens units for mobile devices business is downsized.
• Konica Minolta’s patents will be applied to business expansion in the optical systems for industrial use field, such as automotive applications.
• Konica Minolta has downsized its optical business for digital appliances, whose end-product market exhibits wide fluctuations in demand and prices, and moved forward with a shift toward the industrial and professional market for large projectors, etc.
• The decision to downsize the lens units for mobile devices business was made in 2014, and some production-related assets have been sold to an external enterprise.
Overview
Goals
Background
© 2016 Konica Minolta, Inc.
Strengthening OLED lighting business
20
© 2016 Konica Minolta, Inc.
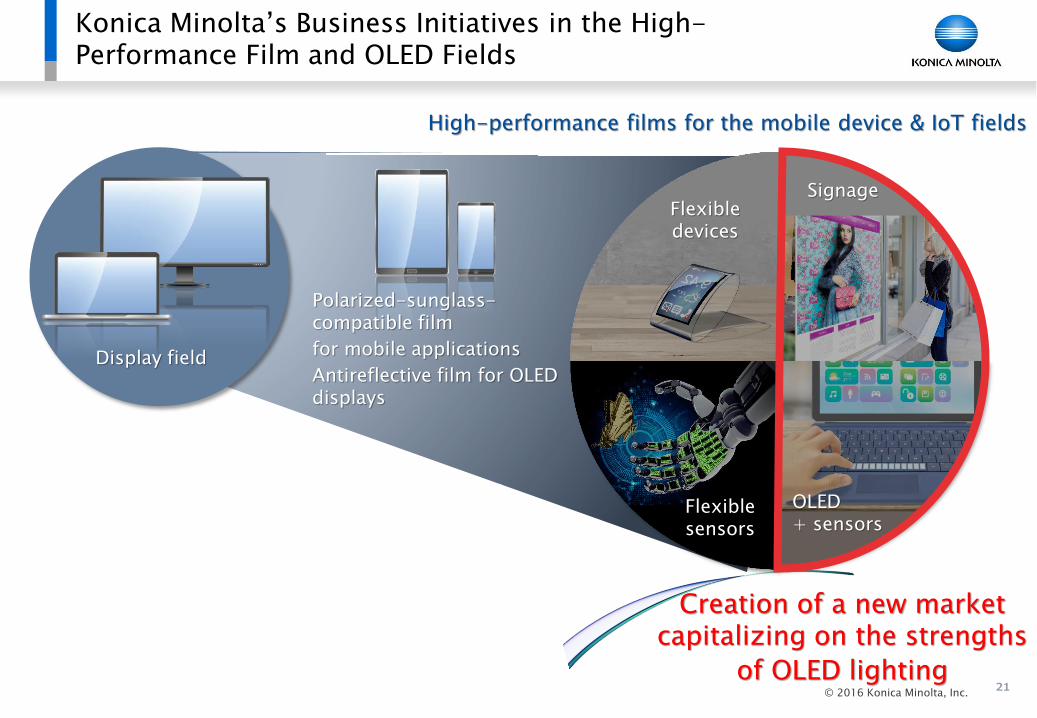
Display field
Polarized-sunglass-compatible film
for mobile applications
Antireflective film for OLED displays
Creation of a new market capitalizing on the strengths
of OLED lighting
SignageFlexibledevices
OLED+ sensors
21
High-performance films for the mobile device & IoT fields
Konica Minolta’s Business Initiatives in the High-Performance Film and OLED Fields
Flexiblesensors
© 2016 Konica Minolta, Inc. 22
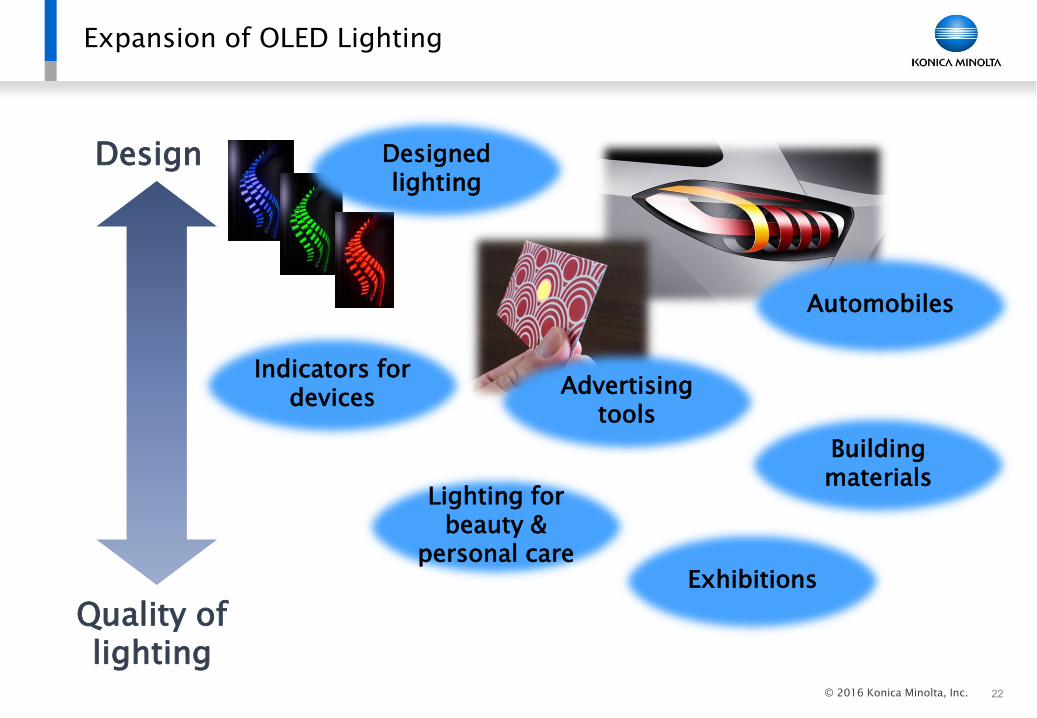
Expansion of OLED Lighting
Design
Quality oflighting
Lighting for beauty &
personal careExhibitions
Indicators fordevices
Building materials
Automobiles
Advertisingtools
Designedlighting
© 2016 Konica Minolta, Inc.© 2016 Konica Minolta, Inc.
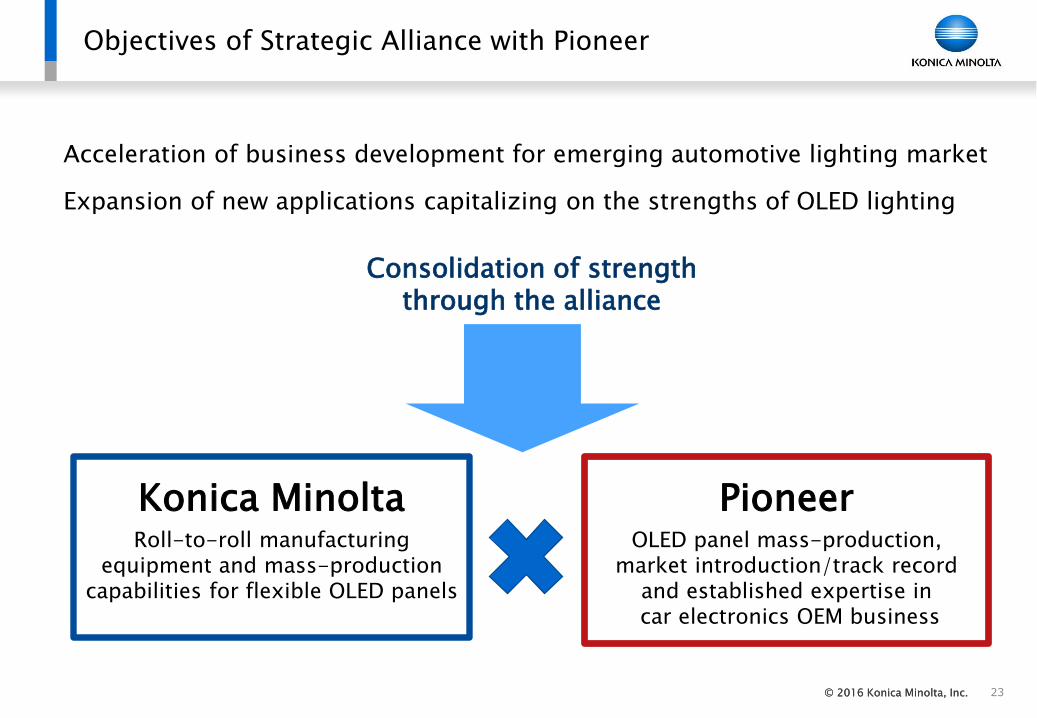
Objectives of Strategic Alliance with Pioneer
23
Konica MinoltaRoll-to-roll manufacturing
equipment and mass-production capabilities for flexible OLED panels
PioneerOLED panel mass-production,
market introduction/track record and established expertise incar electronics OEM business
Acceleration of business development for emerging automotive lighting market
Expansion of new applications capitalizing on the strengths of OLED lighting
Consolidation of strengththrough the alliance
© 2016 Konica Minolta, Inc.© 2016 Konica Minolta, Inc. 24
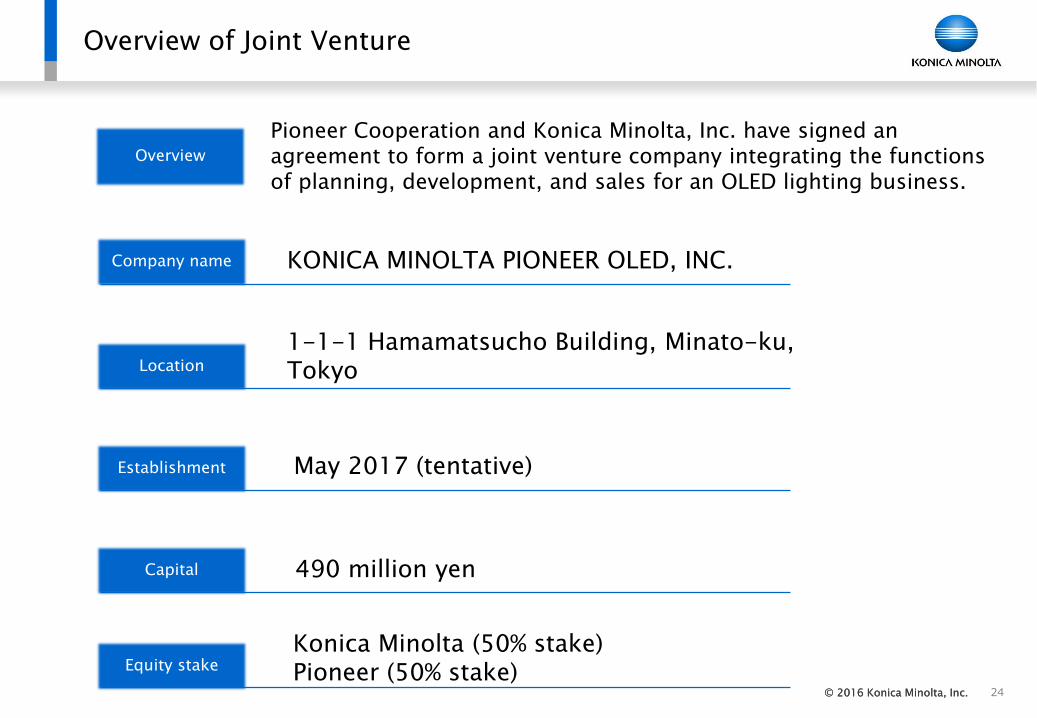
Pioneer Cooperation and Konica Minolta, Inc. have signed an agreement to form a joint venture company integrating the functions of planning, development, and sales for an OLED lighting business.
Overview
Overview of Joint Venture
May 2017 (tentative)
490 million yen
KONICA MINOLTA PIONEER OLED, INC.Company name
Location
Establishment
Capital
Equity stakeKonica Minolta (50% stake)Pioneer (50% stake)
1-1-1 Hamamatsucho Building, Minato-ku, Tokyo
© 2016 Konica Minolta, Inc.© 2016 Konica Minolta, Inc. 25
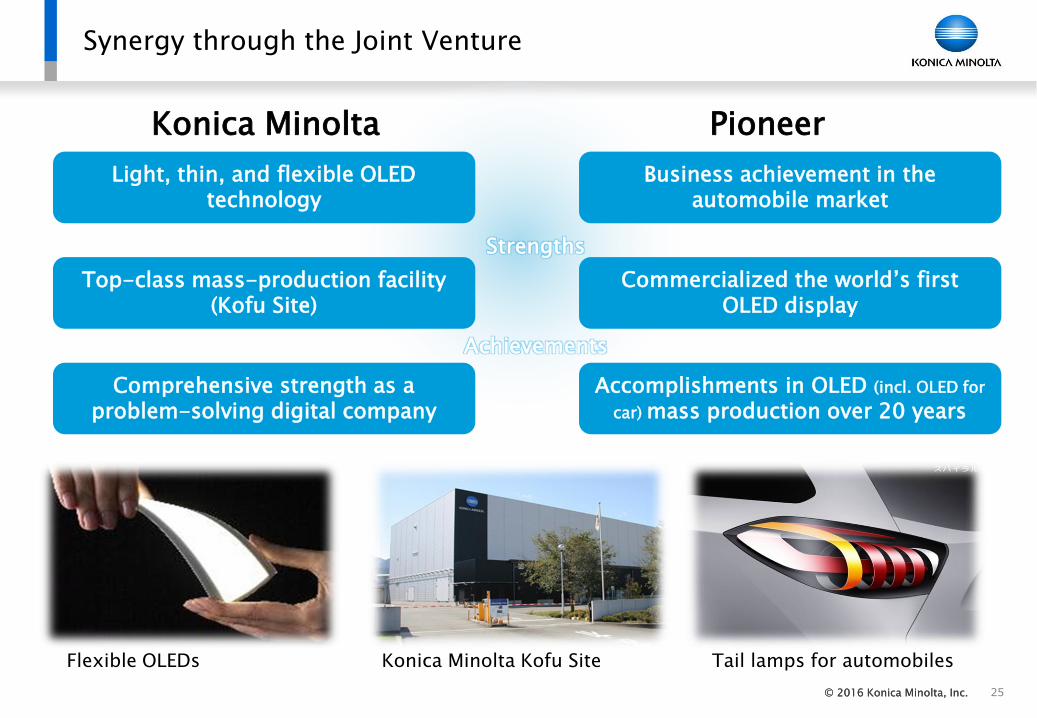
Konica Minolta Pioneer
Light, thin, and flexible OLED technology
Top-class mass-production facility (Kofu Site)
Business achievement in the automobile market
Accomplishments in OLED (incl. OLED for
car) mass production over 20 years
Strengths
Achievements
Commercialized the world’s firstOLED display
Comprehensive strength as a problem-solving digital company
Flexible OLEDs Konica Minolta Kofu Site Tail lamps for automobiles
Synergy through the Joint Venture

© 2016 Konica Minolta, Inc.© 2016 Konica Minolta, Inc. 26
Major Business Targets
Automotiveuse
Market size forecast※ High grade greeting card market
¥50 bill. (2025)
Market size forecast
¥50 bill. (2025)
Advertising tools
Beauty care
© 2016 Konica Minolta, Inc.© 2016 Konica Minolta, Inc.
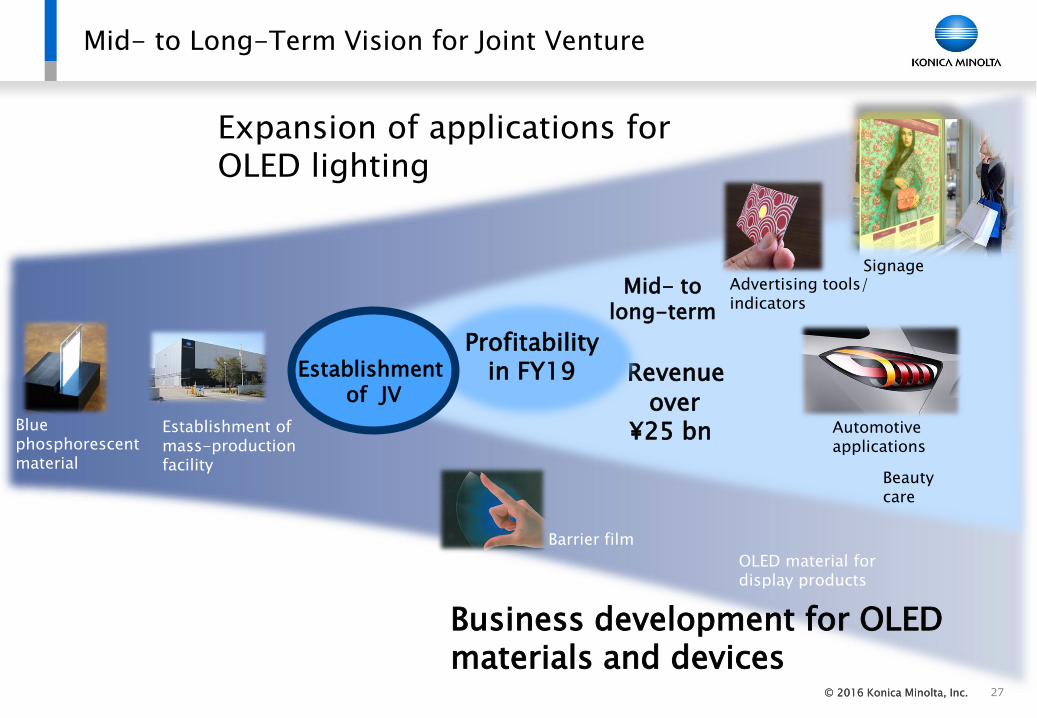
Mid- tolong-term
Revenue
over ¥25 bn
27
Mid- to Long-Term Vision for Joint Venture
Expansion of applications for OLED lighting
Profitability in FY19Establishment
of JV
Business development for OLED materials and devices
Advertising tools/indicators
Automotive applications
Signage
Blue phosphorescent material
Establishment of mass-production facility
Barrier film
OLED material for display products
Beauty care
© 2016 Konica Minolta, Inc.
Appendix
28
© 2016 Konica Minolta, Inc.© 2016 Konica Minolta, Inc. 29
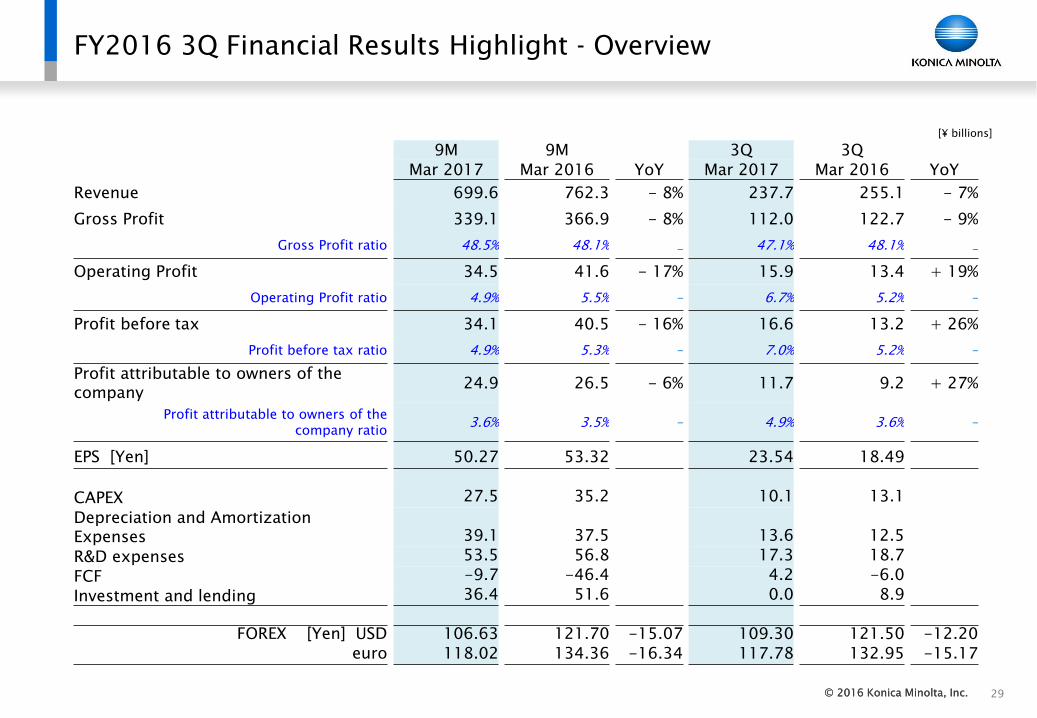
FY2016 3Q Financial Results Highlight - Overview
[¥ billions]
9M 9M 3Q 3Q
Mar 2017 Mar 2016 YoY Mar 2017 Mar 2016 YoY
Revenue 699.6 762.3 - 8% 237.7 255.1 - 7%
Gross Profit 339.1 366.9 - 8% 112.0 122.7 - 9%
Gross Profit ratio 48.5% 48.1% - 47.1% 48.1% -
Operating Profit 34.5 41.6 - 17% 15.9 13.4 + 19%
Operating Profit ratio 4.9% 5.5% - 6.7% 5.2% -
Profit before tax 34.1 40.5 - 16% 16.6 13.2 + 26%
Profit before tax ratio 4.9% 5.3% - 7.0% 5.2% -
Profit attributable to owners of the company
24.9 26.5 - 6% 11.7 9.2 + 27%
Profit attributable to owners of thecompany ratio
3.6% 3.5% - 4.9% 3.6% -
EPS [Yen] 50.27 53.32 23.54 18.49
CAPEX 27.5 35.2 10.1 13.1
Depreciation and Amortization Expenses 39.1 37.5 13.6 12.5
R&D expenses 53.5 56.8 17.3 18.7
FCF -9.7 -46.4 4.2 -6.0
Investment and lending 36.4 51.6 0.0 8.9
FOREX [Yen] USD 106.63 121.70 -15.07 109.30 121.50 -12.20 euro 118.02 134.36 -16.34 117.78 132.95 -15.17
© 2016 Konica Minolta, Inc.© 2016 Konica Minolta, Inc.
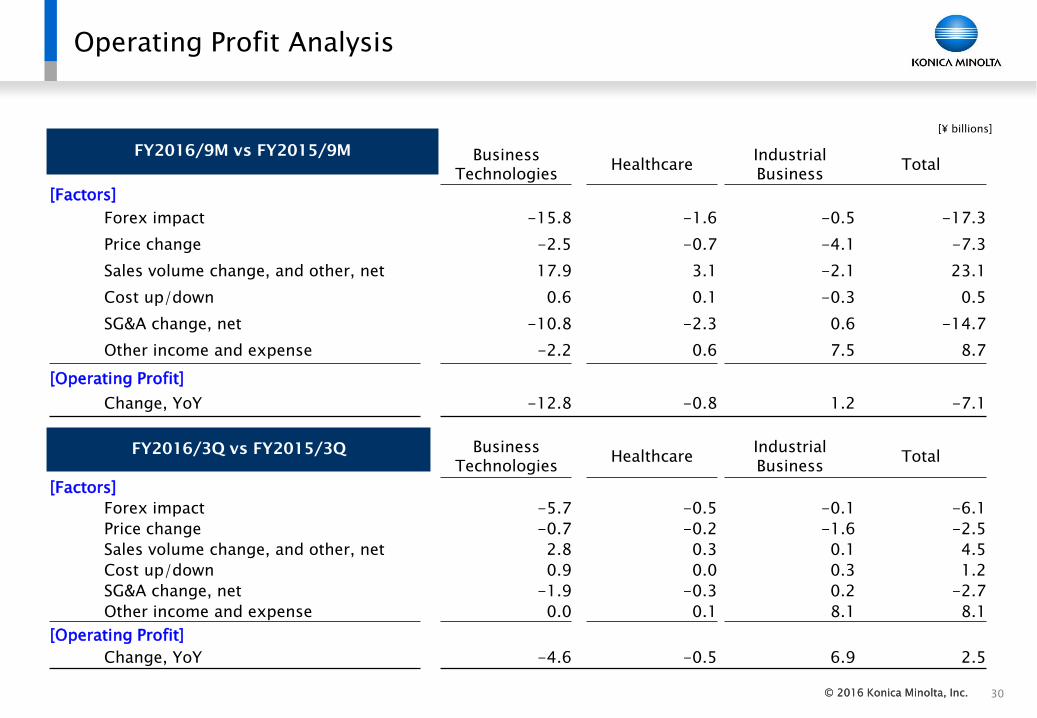
Business Technologies
HealthcareIndustrial Business
Total
[Factors]
Forex impact -15.8 -1.6 -0.5 -17.3
Price change -2.5 -0.7 -4.1 -7.3
Sales volume change, and other, net 17.9 3.1 -2.1 23.1
Cost up/down 0.6 0.1 -0.3 0.5
SG&A change, net -10.8 -2.3 0.6 -14.7
Other income and expense -2.2 0.6 7.5 8.7
[Operating Profit]
Change, YoY -12.8 -0.8 1.2 -7.1
Business Technologies
HealthcareIndustrial Business
Total
[Factors]
Forex impact -5.7 -0.5 -0.1 -6.1
Price change -0.7 -0.2 -1.6 -2.5
Sales volume change, and other, net 2.8 0.3 0.1 4.5
Cost up/down 0.9 0.0 0.3 1.2
SG&A change, net -1.9 -0.3 0.2 -2.7
Other income and expense 0.0 0.1 8.1 8.1
[Operating Profit]
Change, YoY -4.6 -0.5 6.9 2.5
30
Operating Profit Analysis
FY2016/9M vs FY2015/9M
[¥ billions]
FY2016/3Q vs FY2015/3Q
© 2016 Konica Minolta, Inc.© 2016 Konica Minolta, Inc. 31
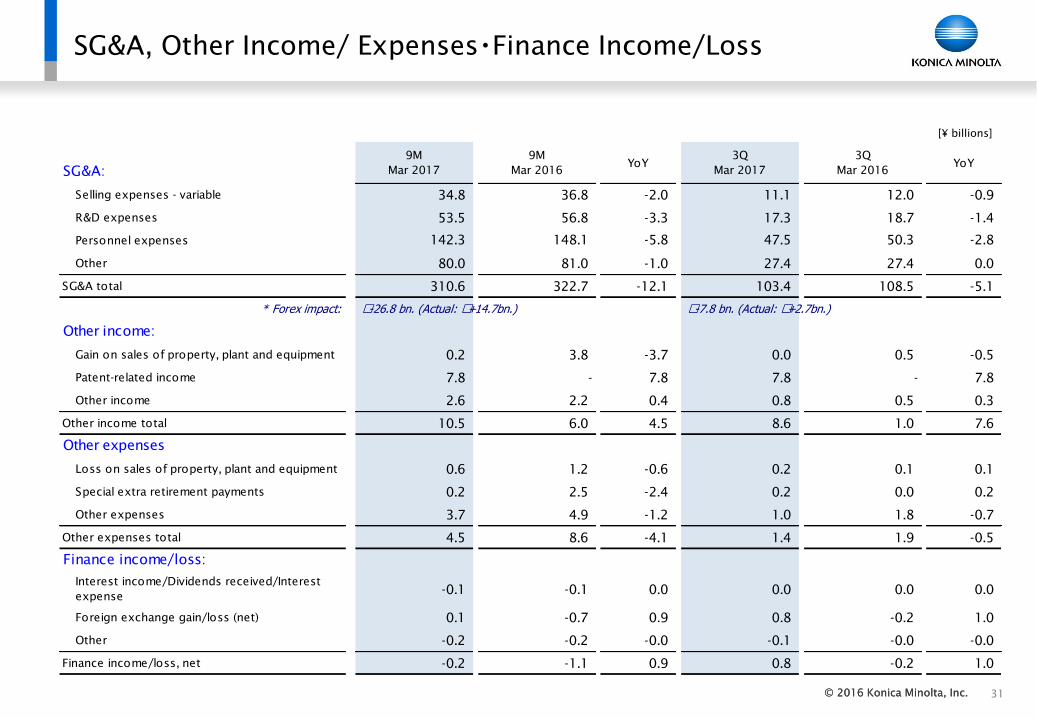
SG&A, Other Income/ Expenses・Finance Income/Loss
[¥ billions]
SG&A:
9M
Mar 2017
9M
Mar 2016YoY
3Q
Mar 2017
3Q
Mar 2016YoY
Selling expenses - variable 34.8 36.8 -2.0 11.1 12.0 -0.9
R&D expenses 53.5 56.8 -3.3 17.3 18.7 -1.4
Personnel expenses 142.3 148.1 -5.8 47.5 50.3 -2.8
Other 80.0 81.0 -1.0 27.4 27.4 0.0
SG&A total 310.6 322.7 -12.1 103.4 108.5 -5.1
* Forex impact: \-26.8 bn. (Actual: \+14.7bn.) \-7.8 bn. (Actual: \+2.7bn.)
Other income:
Gain on sales of property, plant and equipment 0.2 3.8 -3.7 0.0 0.5 -0.5
Patent-related income 7.8 - 7.8 7.8 - 7.8
Other income 2.6 2.2 0.4 0.8 0.5 0.3
Other income total 10.5 6.0 4.5 8.6 1.0 7.6
Other expenses
Loss on sales of property, plant and equipment 0.6 1.2 -0.6 0.2 0.1 0.1
Special extra retirement payments 0.2 2.5 -2.4 0.2 0.0 0.2
Other expenses 3.7 4.9 -1.2 1.0 1.8 -0.7
Other expenses total 4.5 8.6 -4.1 1.4 1.9 -0.5
Finance income/loss:
Interest income/Dividends received/Interest
expense-0.1 -0.1 0.0 0.0 0.0 0.0
Foreign exchange gain/loss (net) 0.1 -0.7 0.9 0.8 -0.2 1.0
Other -0.2 -0.2 -0.0 -0.1 -0.0 -0.0
Finance income/loss, net -0.2 -1.1 0.9 0.8 -0.2 1.0
© 2016 Konica Minolta, Inc.© 2016 Konica Minolta, Inc. 32
FY2016 Earnings Forecast- Overview
[¥ billions]
Earnings Forecast Results
Mar 2017 Mar 2016 YoY
Revenue 1,030.0 1,031.7 -0%
Operating Profit 55.0 60.1 -8%
Operating Profit ratio 5.3% 5.8%
Profit before tax 52.5 58.0 -10%
Profit attributable to owners of the company 36.0 32.0 +13%
Profit attributable to owners of the company ratio 3.5% 3.1%
EPS [Yen] 72.60 64.39
ROE*(%) 7.2% 6.5%
CAPEX 50.0 52.6
Depreciation and Amortization Expenses 50.0 51.3
R&D expenses 75.0 76.3
FCF 39.0 -51.5
Investment and loan 50.0 68.2
*Purchase of tangible/intangible assets
FOREX [Yen] USD 110.00 120.14
euro 115.00 132.58
© 2016 Konica Minolta, Inc.© 2016 Konica Minolta, Inc. 33
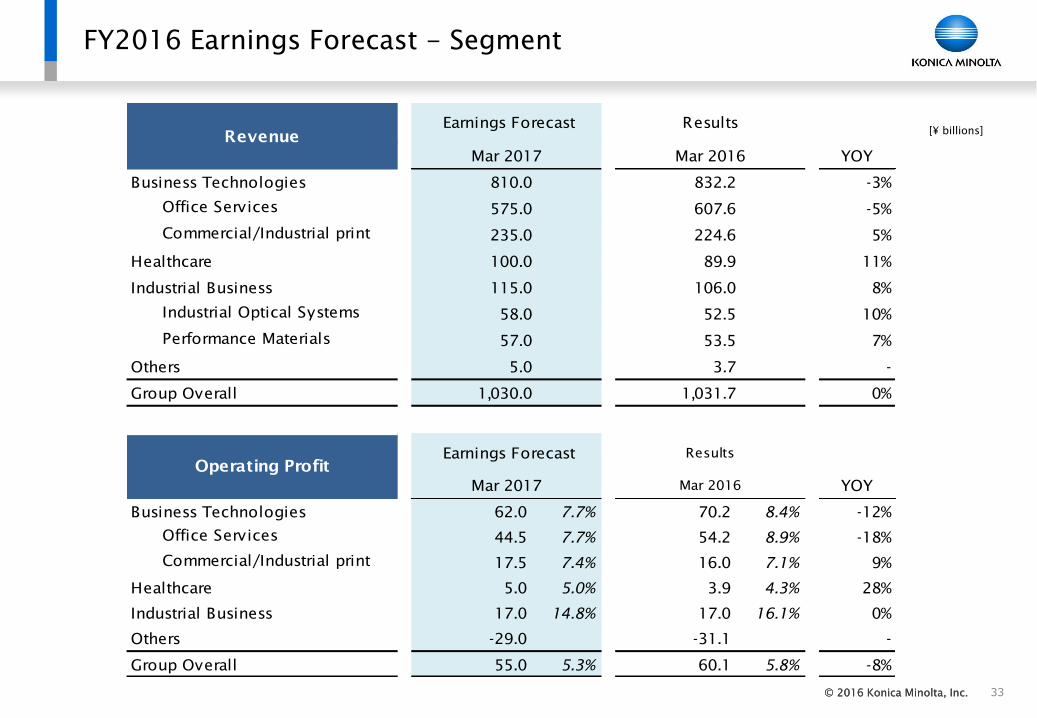
FY2016 Earnings Forecast - Segment
[¥ billions]
YOY
Business Technologies 810.0 832.2 -3%
Office Services 575.0 607.6 -5%
Commercial/Industrial print 235.0 224.6 5%
Healthcare 100.0 89.9 11%
Industrial Business 115.0 106.0 8%
Industrial Optical Systems 58.0 52.5 10%
Performance Materials 57.0 53.5 7%
Others 5.0 3.7 -
Group Overall 1,030.0 1,031.7 0%
YOY
Business Technologies 62.0 7.7% 70.2 8.4% -12%
Office Services 44.5 7.7% 54.2 8.9% -18%
Commercial/Industrial print 17.5 7.4% 16.0 7.1% 9%
Healthcare 5.0 5.0% 3.9 4.3% 28%
Industrial Business 17.0 14.8% 17.0 16.1% 0%
Others -29.0 -31.1 -
Group Overall 55.0 5.3% 60.1 5.8% -8%
Revenue
Results Earnings Forecast
Mar 2017
Results
Mar 2016
Mar 2016
Operating Profit
Earnings Forecast
Mar 2017
© 2016 Konica Minolta, Inc.© 2016 Konica Minolta, Inc.
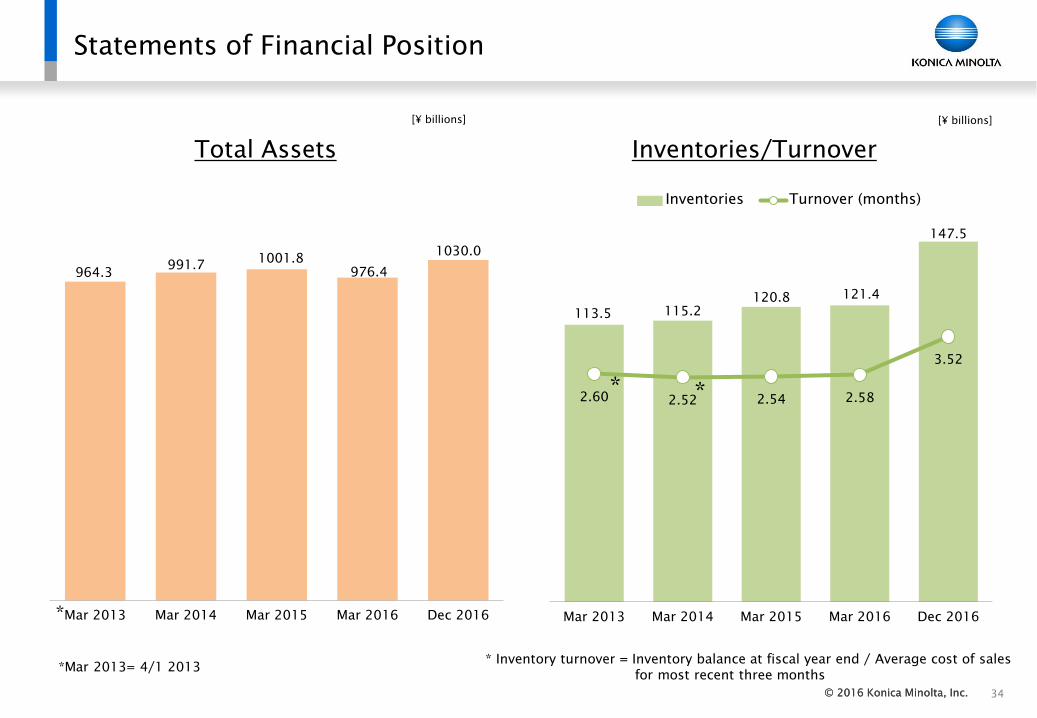
113.5 115.2 120.8 121.4
147.5
2.60 2.52 2.54 2.58
3.52
Mar 2013 Mar 2014 Mar 2015 Mar 2016 Dec 2016
Inventories Turnover (months)
964.3 991.7
1001.8 976.4
1030.0
Mar 2013 Mar 2014 Mar 2015 Mar 2016 Dec 2016
34
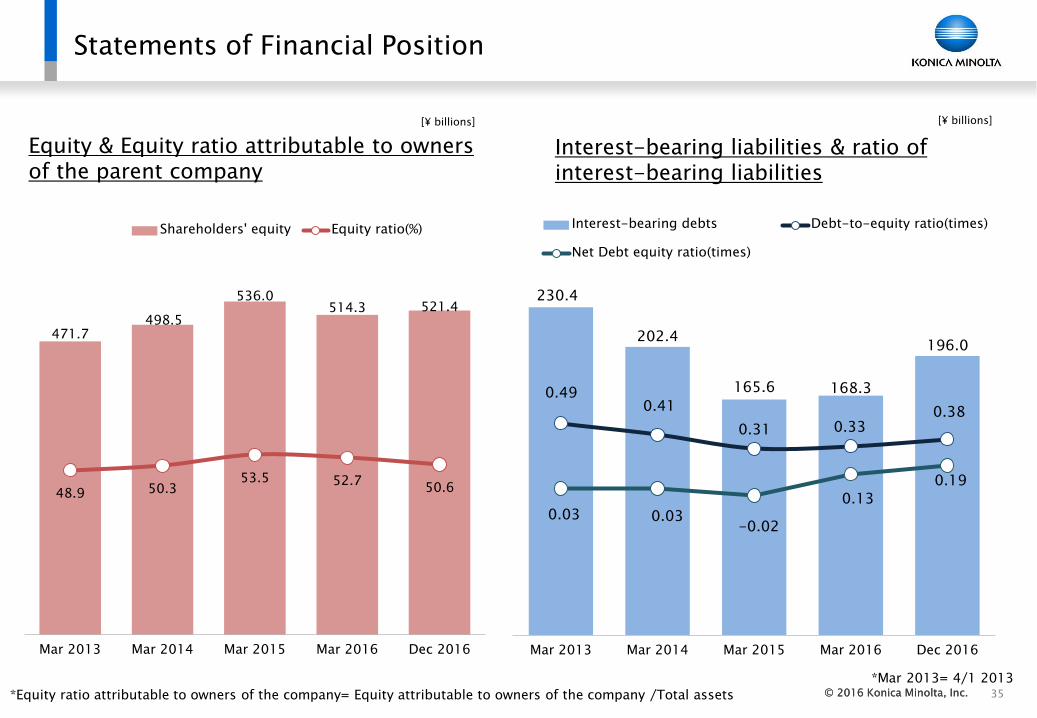
Statements of Financial Position
Total Assets Inventories/Turnover
* Inventory turnover = Inventory balance at fiscal year end / Average cost of sales
for most recent three months
*
*Mar 2013= 4/1 2013
*
[¥ billions]
*
[¥ billions]
© 2016 Konica Minolta, Inc.© 2016 Konica Minolta, Inc.
230.4
202.4
165.6 168.3
196.0
0.49 0.41
0.31 0.33 0.38
0.03 0.03 -0.02
0.13
0.19
Mar 2013 Mar 2014 Mar 2015 Mar 2016 Dec 2016
Interest-bearing debts Debt-to-equity ratio(times)
Net Debt equity ratio(times)
35
Statements of Financial Position
Interest-bearing liabilities & ratio of interest-bearing liabilities
[¥ billions]
Equity & Equity ratio attributable to owners of the parent company
*Equity ratio attributable to owners of the company= Equity attributable to owners of the company /Total assets
*Mar 2013= 4/1 2013
471.7 498.5
536.0 514.3 521.4
48.9 50.3 53.5 52.7
50.6
Mar 2013 Mar 2014 Mar 2015 Mar 2016 Dec 2016
Shareholders' equity Equity ratio(%)
[¥ billions]
© 2016 Konica Minolta, Inc.© 2016 Konica Minolta, Inc.
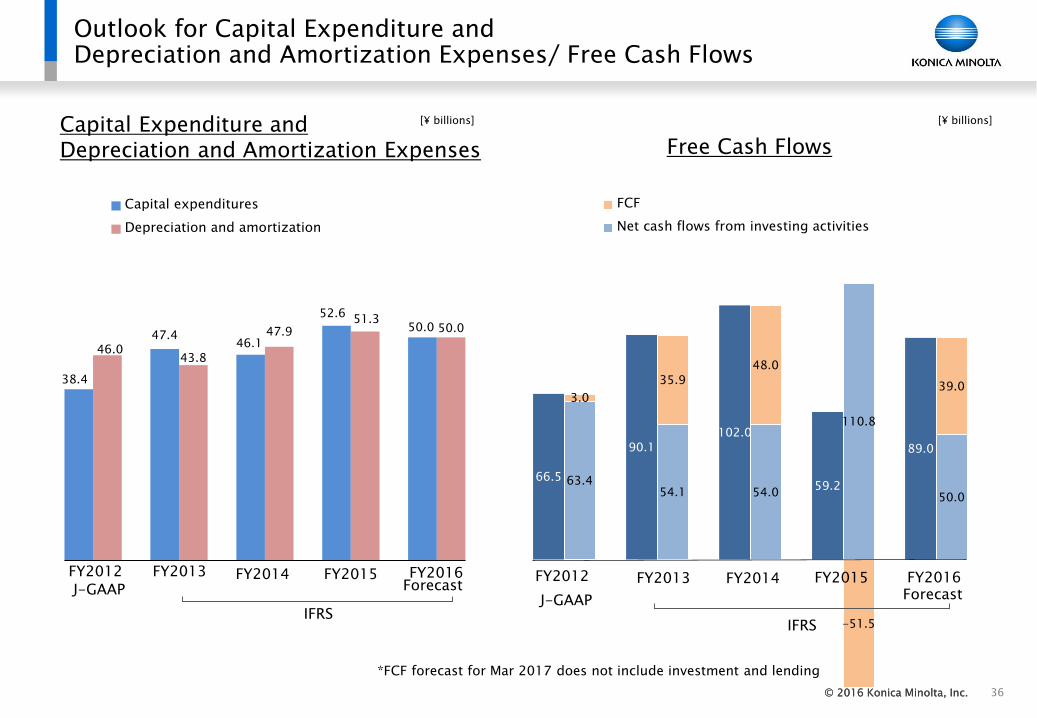
66.5
90.1
102.0
59.2
89.0
63.4 54.1 54.0
110.8
50.0
3.0
35.9
48.0
-51.5
39.0
FCF
Net cash flows from investing activities
38.4
47.4 46.1
52.6 50.0
46.0 43.8
47.9 51.3
50.0
Capital expenditures
Depreciation and amortization
36
Outlook for Capital Expenditure and
Depreciation and Amortization Expenses/ Free Cash Flows
FY2012 FY2013 FY2014 FY2015 FY2016J-GAAP Forecast
Free Cash FlowsCapital Expenditure andDepreciation and Amortization Expenses
FY2012 FY2013 FY2014 FY2015Forecast
IFRSJ-GAAP
IFRS
FY2016
*FCF forecast for Mar 2017 does not include investment and lending
[¥ billions][¥ billions]
© 2016 Konica Minolta, Inc.© 2016 Konica Minolta, Inc.
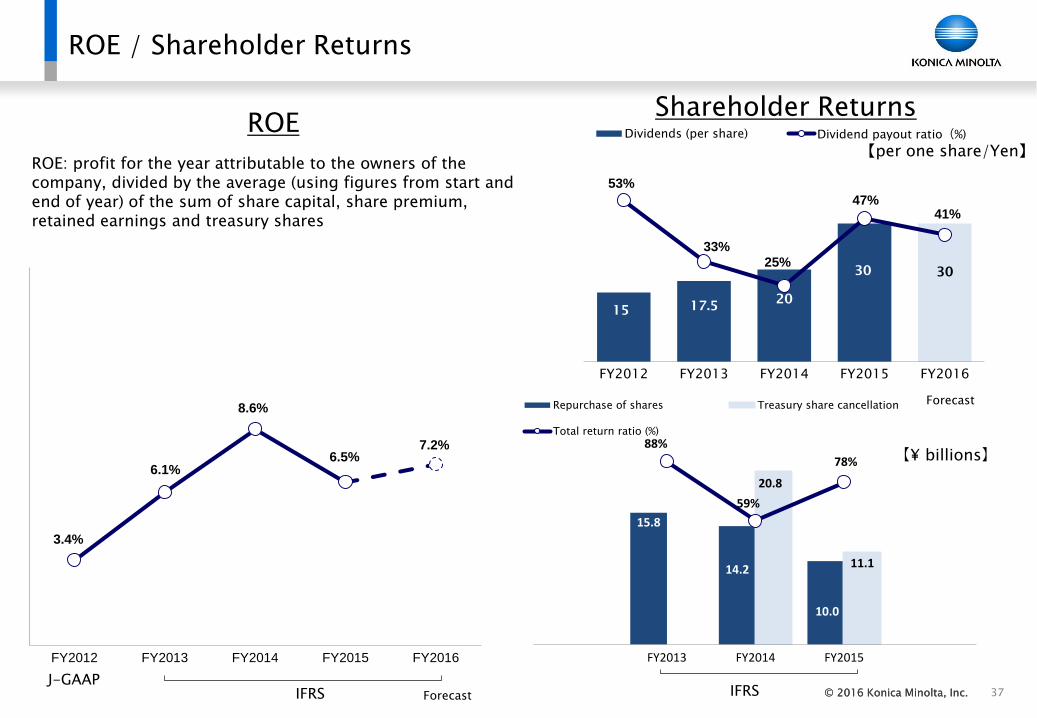
1517.5
20
30 30
53%
33%
25%
47%41%
FY2012 FY2013 FY2014 FY2015 FY2016
Dividends (per share) Dividend payout ratio(%)
3.4%
6.1%
8.6%
6.5%7.2%
FY2012 FY2013 FY2014 FY2015 FY2016
37
ROE / Shareholder Returns
15.8
14.2
10.0
20.8
11.1
88%
59%
78%
FY2013 FY2014 FY2015
Repurchase of shares Treasury share cancellation
Total return ratio (%)
Shareholder ReturnsROE
J-GAAP
ROE: profit for the year attributable to the owners of the company, divided by the average (using figures from start and end of year) of the sum of share capital, share premium, retained earnings and treasury shares
IFRS
【per one share/Yen】
Forecast
Forecast
【¥ billions】
IFRS
© 2016 Konica Minolta, Inc.© 2016 Konica Minolta, Inc.
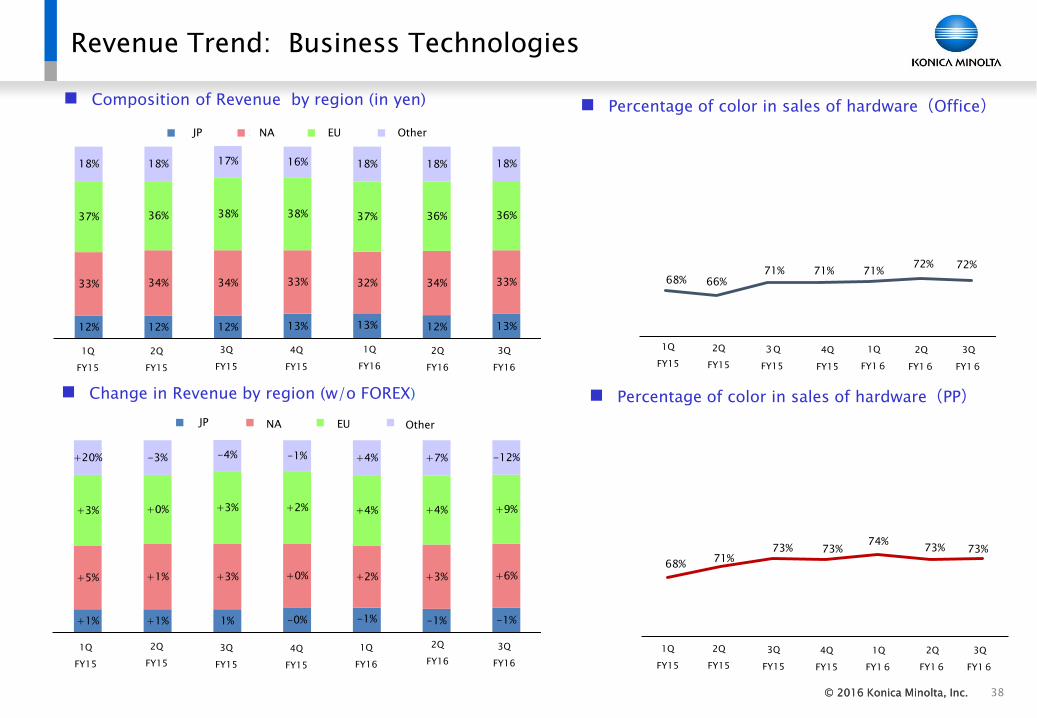
+1% +1% 1% -0% -1% -1% -1%
+5% +1% +3% +0% +2% +3% +6%
+3% +0% +3% +2% +4% +4% +9%
+20% -3% -4% -1% +4% +7% -12%
日本 北米 欧州 その他
12% 12% 12% 13% 13% 12% 13%
33% 34% 34% 33% 32% 34% 33%
37% 36% 38% 38% 37% 36% 36%
18% 18% 17% 16% 18% 18% 18%
日本 北米 欧州 その他
68%71%
73% 73%74%
73% 73%
4Q
FY15
3Q
FY15
2Q
FY15
1Q
FY15
38
Percentage of color in sales of hardware(Office)
Percentage of color in sales of hardware(PP)
Composition of Revenue by region (in yen)
Change in Revenue by region (w/o FOREX)
JP NA EU Other
OtherJP NA EU
4Q
FY15
3Q
FY15
2Q
FY15
1Q
FY15
Revenue Trend: Business Technologies
1Q
FY15
2Q
FY15
3Q
FY15
4Q
FY15
1Q
FY16
1Q
FY16
1Q
FY16
2Q
FY16
2Q
FY16
1Q
FY15
2Q
FY15
3Q
FY15
4Q
FY15
1Q
FY16
2Q
FY16
2Q
FY16
68% 66%71% 71% 71%
72% 72%
3Q
FY16
3Q
FY16
3Q
FY16
3Q
FY16
© 2016 Konica Minolta, Inc.© 2016 Konica Minolta, Inc.
100
133
116
160
100
132
125
1Q 2Q 3Q 4Q
Mar 2016 Mar 2017
100
138
99
144
98
136 132
1Q 2Q 3Q 4Q
Mar 2016 Mar 2017
100 106 94 103
89 102
90
0 1Q 2Q 3Q 4Q
Mar 2016 Mar 2017
100
130 124
168
101
130 122
1Q 2Q 3Q 4Q
Mar 2016 Mar 2017
100 104
97
116
97
108
101
1Q 2Q 3Q 4Q
Mar 2016 Mar 2017
100 103 100
129
104 114 111
0 1Q 2Q 3Q 4Q
Mar 2016 Mar 2017
39
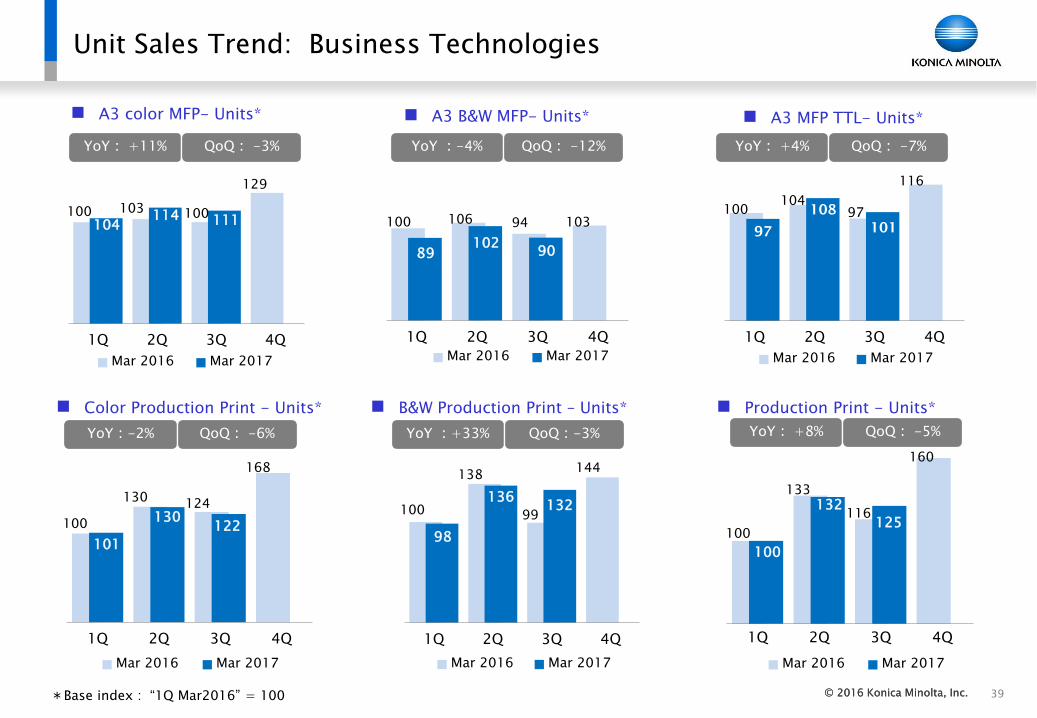
Unit Sales Trend: Business Technologies
A3 color MFP- Units* A3 B&W MFP- Units* A3 MFP TTL- Units*
Color Production Print - Units* B&W Production Print – Units* Production Print - Units*
*Base index : “1Q Mar2016” = 100
YoY: +11% QoQ: -3% YoY :-4% QoQ: -12% YoY: +4% QoQ: -7%
YoY:-2% QoQ: -6% YoY :+33% QoQ:-3% YoY: +8% QoQ: -5%
© 2016 Konica Minolta, Inc.© 2016 Konica Minolta, Inc.
20.6 20.1 21.9 19.7 19.4 18.2 20.1
58%
51%55%
47%
60%54% 55%
71.5 70.0 69.7 67.8 65.0 60.2 64.8
53%51% 52%
49%
53%51%
53%
-2%
5%4%
-2%
0%2%
8.8%
5.7%
3.2%4.5%
5.4%6.6%
4.5%
1.8% 1.5%0.5%
-0.3% -0.2%0.2%
1.4%
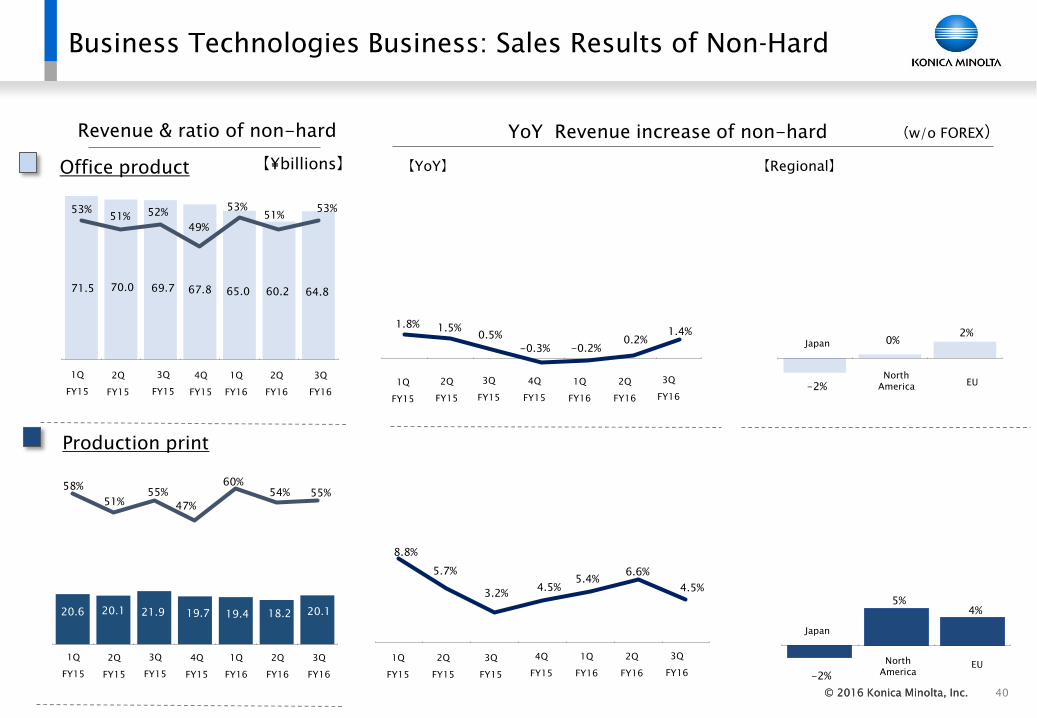
Business Technologies Business: Sales Results of Non-Hard
YoY Revenue increase of non-hardRevenue & ratio of non-hard (w/o FOREX)
【YoY】【¥billions】
1Q
FY15
Office product
2Q
FY15
Production print
3Q
FY15
1Q
FY15
2Q
FY15
3Q
FY15
4Q
FY15
1Q
FY16
40
4Q
FY15
1Q
FY16
Japan
North
AmericaEU
【Regional】
Japan
EU
1Q
FY15
2Q
FY15
3Q
FY15
4Q
FY15
1Q
FY16
North
America
2Q
FY16
2Q
FY16
2Q
FY16
3Q
FY16
3Q
FY16
3Q
FY16
1Q
FY15
2Q
FY15
3Q
FY15
4Q
FY15
1Q
FY16
2Q
FY16
3Q
FY16
© 2016 Konica Minolta, Inc.© 2016 Konica Minolta, Inc. 41
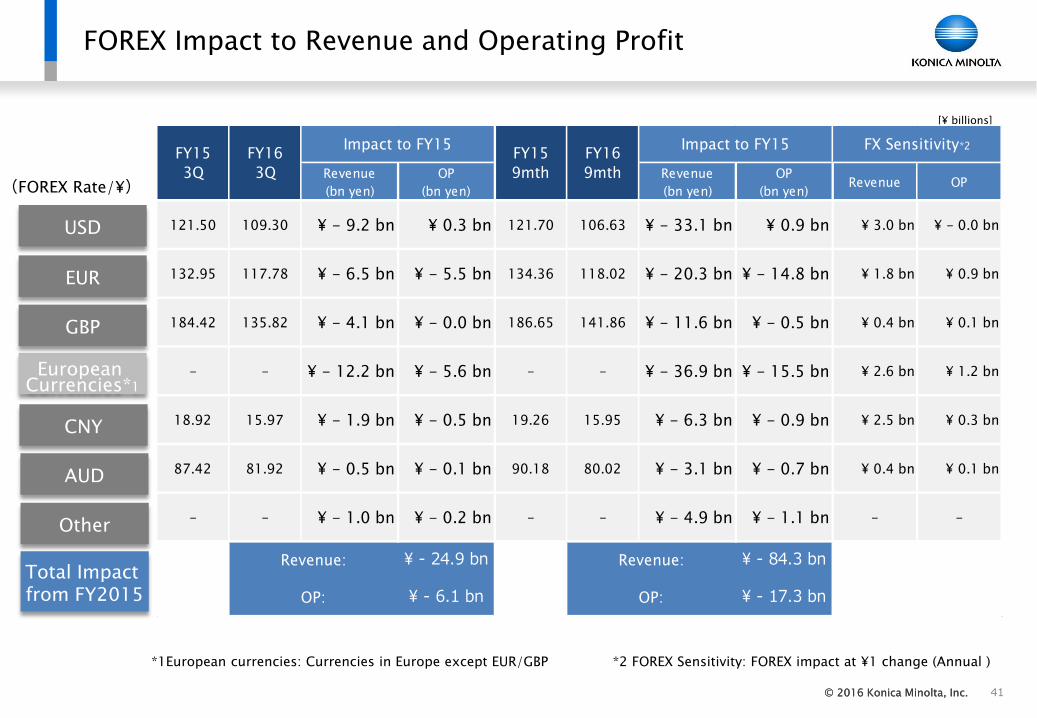
FOREX Impact to Revenue and Operating Profit
[¥ billions]
EUR
CNY
USD
AUD
Total Impact from FY2015
(FOREX Rate/¥)
European Currencies*1
Other
*1European currencies: Currencies in Europe except EUR/GBP *2 FOREX Sensitivity: FOREX impact at ¥1 change (Annual )
GBP
Revenue
(bn yen)
OP
(bn yen)
Revenue
(bn yen)
OP
(bn yen)Revenue OP
121.50 109.30 ¥ - 9.2 bn ¥ 0.3 bn 121.70 106.63 ¥ - 33.1 bn ¥ 0.9 bn ¥ 3.0 bn ¥ - 0.0 bn
132.95 117.78 ¥ - 6.5 bn ¥ - 5.5 bn 134.36 118.02 ¥ - 20.3 bn ¥ - 14.8 bn ¥ 1.8 bn ¥ 0.9 bn
184.42 135.82 ¥ - 4.1 bn ¥ - 0.0 bn 186.65 141.86 ¥ - 11.6 bn ¥ - 0.5 bn ¥ 0.4 bn ¥ 0.1 bn
- - ¥ - 12.2 bn ¥ - 5.6 bn - - ¥ - 36.9 bn ¥ - 15.5 bn ¥ 2.6 bn ¥ 1.2 bn
18.92 15.97 ¥ - 1.9 bn ¥ - 0.5 bn 19.26 15.95 ¥ - 6.3 bn ¥ - 0.9 bn ¥ 2.5 bn ¥ 0.3 bn
87.42 81.92 ¥ - 0.5 bn ¥ - 0.1 bn 90.18 80.02 ¥ - 3.1 bn ¥ - 0.7 bn ¥ 0.4 bn ¥ 0.1 bn
- - ¥ - 1.0 bn ¥ - 0.2 bn - - ¥ - 4.9 bn ¥ - 1.1 bn - -
¥ - 24.9 bn ¥ - 84.3 bn
¥ - 6.1 bn ¥ - 17.3 bn
FY15
3Q
FY16
3Q
FX Sensitivity*2FY16
9mth
Revenue:
Impact to FY15FY15
9mth
OP:
Revenue:
OP:
Impact to FY15
© 2016 Konica Minolta, Inc.© 2016 Konica Minolta, Inc. 42
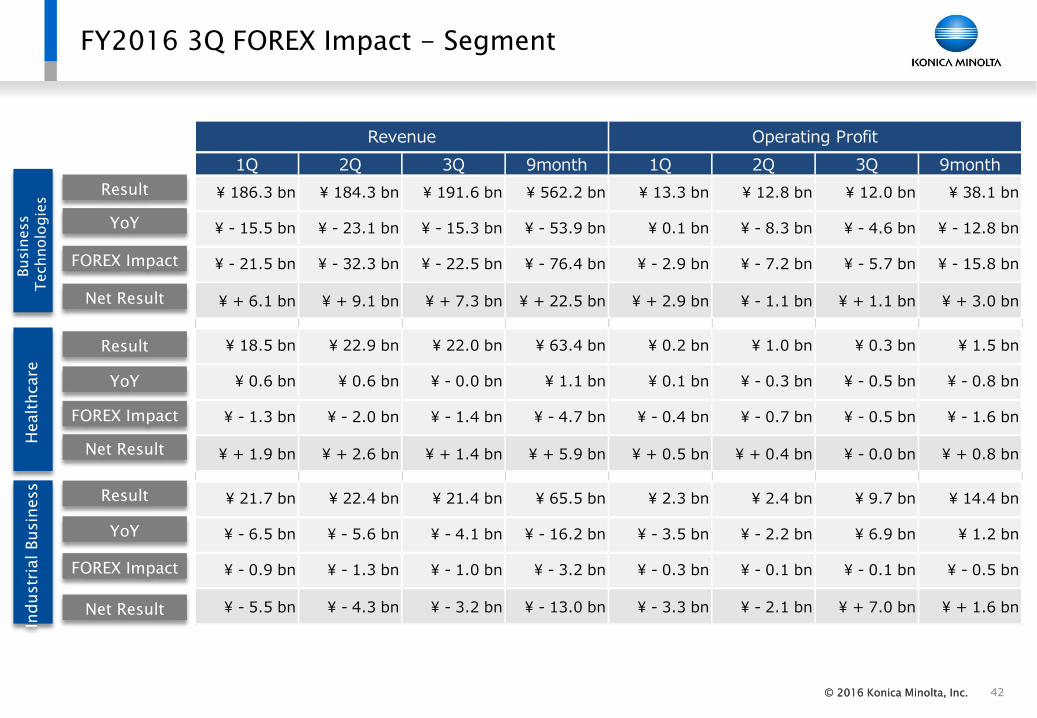
FY2016 3Q FOREX Impact - Segment
YoY
FOREX Impact
Net Result
Result
Busin
ess
Technolo
gie
sH
ealt
hcare
Industr
ial Busin
ess
YoY
FOREX Impact
Net Result
Result
YoY
FOREX Impact
Net Result
Result
1Q 2Q 3Q 9month 1Q 2Q 3Q 9month
¥ 186.3 bn ¥ 184.3 bn ¥ 191.6 bn ¥ 562.2 bn ¥ 13.3 bn ¥ 12.8 bn ¥ 12.0 bn ¥ 38.1 bn
¥ - 15.5 bn ¥ - 23.1 bn ¥ - 15.3 bn ¥ - 53.9 bn ¥ 0.1 bn ¥ - 8.3 bn ¥ - 4.6 bn ¥ - 12.8 bn
¥ - 21.5 bn ¥ - 32.3 bn ¥ - 22.5 bn ¥ - 76.4 bn ¥ - 2.9 bn ¥ - 7.2 bn ¥ - 5.7 bn ¥ - 15.8 bn
¥ + 6.1 bn ¥ + 9.1 bn ¥ + 7.3 bn ¥ + 22.5 bn ¥ + 2.9 bn ¥ - 1.1 bn ¥ + 1.1 bn ¥ + 3.0 bn
¥ 18.5 bn ¥ 22.9 bn ¥ 22.0 bn ¥ 63.4 bn ¥ 0.2 bn ¥ 1.0 bn ¥ 0.3 bn ¥ 1.5 bn
¥ 0.6 bn ¥ 0.6 bn ¥ - 0.0 bn ¥ 1.1 bn ¥ 0.1 bn ¥ - 0.3 bn ¥ - 0.5 bn ¥ - 0.8 bn
¥ - 1.3 bn ¥ - 2.0 bn ¥ - 1.4 bn ¥ - 4.7 bn ¥ - 0.4 bn ¥ - 0.7 bn ¥ - 0.5 bn ¥ - 1.6 bn
¥ + 1.9 bn ¥ + 2.6 bn ¥ + 1.4 bn ¥ + 5.9 bn ¥ + 0.5 bn ¥ + 0.4 bn ¥ - 0.0 bn ¥ + 0.8 bn
¥ 21.7 bn ¥ 22.4 bn ¥ 21.4 bn ¥ 65.5 bn ¥ 2.3 bn ¥ 2.4 bn ¥ 9.7 bn ¥ 14.4 bn
¥ - 6.5 bn ¥ - 5.6 bn ¥ - 4.1 bn ¥ - 16.2 bn ¥ - 3.5 bn ¥ - 2.2 bn ¥ 6.9 bn ¥ 1.2 bn
¥ - 0.9 bn ¥ - 1.3 bn ¥ - 1.0 bn ¥ - 3.2 bn ¥ - 0.3 bn ¥ - 0.1 bn ¥ - 0.1 bn ¥ - 0.5 bn
¥ - 5.5 bn ¥ - 4.3 bn ¥ - 3.2 bn ¥ - 13.0 bn ¥ - 3.3 bn ¥ - 2.1 bn ¥ + 7.0 bn ¥ + 1.6 bn
Revenue Operating Profit
© 2016 Konica Minolta, Inc.© 2016 Konica Minolta, Inc. 43
Glossary
● Business Technologies:OPS/ Optimized Print Services
OPS provides services to boost efficiency and reduce costs through optimization of the customer's print environment
(output and document management environment).
● Business Technologies:GMA/ Global Major Account
Refers to our major enterprise customers (businesses) that operate on a global scale.
● Business Technologies:MPM/ Marketing Production Management
MPM provides services optimizing the production cost of marketing materials for customers using our own supplier network.
KonicaMinolta consolidated Charterhouse(U.K.) from 2012 and Ergo(Australia) from 2014.
● Healthcare:DR/ Digital Radiography
A technique that detects the intensity distribution of the X-rays that pass through the body when an X-ray is taken, and then
converts the data to a digital signal, which is processed by computer.
● Healthcare:PACS/ Picture Archiving and Communication System
An image storage and communication system for medical image processing. More generally, any system for managing a large
number of images, such as CT, MRI, and X-ray images from DR or CR.
● Industrial:ZeroTAC film
A TAC film with phase difference reduced to zero. Used primarily in IPS displays, with characteristics that improve visibility.
● Industrial - Performance materials: OLED / Organic Light Emitting Diode
Also known as organic EL (organic electroluminescence). OLED applies the phenomenon of organic compounds producing
light when voltage is applied to lighting and display products.
44