Konica Minolta, Inc. 4th Quarter/FY2017 ended in … · Konica Minolta, Inc. Konica Minolta, Inc....
45
Konica Minolta, Inc. Konica Minolta, Inc. 4 th Quarter/FY2017 ended in March 2018 Consolidated Financial Results Three months: January 1, 2018 – March 31, 2018 Fiscal Year 2017: April 1, 2017 – March 31, 2018 - Announced on May 14, 2018 - Evolution Shoei Yamana President and CEO Konica Minolta, Inc.
Transcript of Konica Minolta, Inc. 4th Quarter/FY2017 ended in … · Konica Minolta, Inc. Konica Minolta, Inc....
Konica Minolta, Inc.
Konica Minolta, Inc.4th Quarter/FY2017 ended in March 2018
Consolidated Financial ResultsThree months: January 1, 2018 – March 31, 2018Fiscal Year 2017: April 1, 2017 – March 31, 2018
- Announced on May 14, 2018 -
Evolution
Shoei YamanaPresident and CEOKonica Minolta, Inc.

Konica Minolta, Inc.Konica Minolta, Inc.
Operating
Profit
FY2017 Performance Overview
1
Revenue
There was a 7% YoY increase for the Group as a whole, with all business segments recording growth in revenue.
In the Office Business, North America and China, etc. remained solid, while in Professional Print Europe and China grew, and sales of DR continued to increase in North America. Measuring instruments remained solid in the Industrial Business, posting significant increases, while Performance Materials revenues also grew.
There was a 7% YoY increase for the Group as a whole, with all business segments recording growth in profit.
The trend of improved profitability seen in Office and Professional Print since 2Q continued, resulting in a turnaround to profit growth for the fiscal year.
[¥ billions]
12MMar 2018
12MMar 2017
YoYYoY
(W/O Forex)4Q
Mar 20184Q
Mar 2017YoY
YoY(W/O Forex)
Revenue 1,031.3 962.6 + 7% (+ 3%) 281.0 262.9 + 7% (+ 5%)
Operating Profit 53.8 50.1 + 7% (- 2%) 24.8 15.7 + 58% (+ 39%)
Profit attributable to owners of the company 32.2 31.5 + 2% 13.6 6.6 + 106%
FOREX [Yen]
USD 110.85 108.38 2% 108.30 113.64 -5%Euro 129.70 118.79 9% 133.22 121.08 10%

Konica Minolta, Inc.Konica Minolta, Inc.
FY2017 4Q Revenue by Segment
2
[¥ billions]
Revenue 12MMar 2018
12MMar 2017
YoY YoY(W/O Forex)
4QMar 2018
4QMar 2017
YoY YoY(W/O Forex)
Office 583.9 558.2 + 5% (- 0%) 156.2 150.9 + 3% (+ 1%)
Professional Print 214.3 204.0 + 5% (+ 1%) 59.2 55.8 + 6% (+ 4%)
Healthcare 96.5 89.9 + 7% 29.6 26.6 + 11%
Industrial 118.2 101.6 + 16% 28.1 27.5 + 2%
Optical systems for industrial use 43.1 29.3 + 47% 8.8 10.5 - 17%
Materials and components 75.1 72.2 + 4% 19.4 17.0 + 14%
New business / corporate, etc. 18.4 8.9 + 107% 7.8 2.1 + 270%
Company overall 1031.3 962.6 + 7% 281.0 262.9 + 7%

Konica Minolta, Inc.Konica Minolta, Inc. 3
FY2017 4Q Operating Profit by Segment
[¥ billions]
Operating profit 12MMar 2018
12MMar 2017
YoYYoY
(W/O Forex)
4QMar 2018
4QMar 2017
YoYYoY
(W/O Forex)
Office 44.9 44.3 + 1% (-3%) 15.0 13.1 + 15% (-5%)
Professional Print 9.3 8.3 + 12% (-13%) 4.2 1.5 + 189% (+153%)
Healthcare 5.6 2.9 + 95% 1.7 1.4 + 25%
Industrial 23.5 22.0 *+ 6% 5.9 5.3 + 11%
New business / corporate, etc. -29.4 -27.4 - -2.0 -5.5 -
Company overall 53.8 50.1 + 7% 24.8 15.7 + 58%
Operating profit margine4Q
Mar 2018 4Q
Mar 2017Increase or decrease
Office 9.6% 8.7% + 0.9%
Professional Print 7.1% 2.6% + 4.5%
Healthcare 5.7% 5.1% + 0.8%
Industrial 20.8% 19.1% + 1.6%
New business / corporate, etc. - - -
Company overall 8.8% 6.0% + 2.8%
*YoY +65% : Without previous year’s special factor in Industrial Business.

Konica Minolta, Inc.Konica Minolta, Inc.
5%8%
5%
30%
FY17-12M FY17 4Q
Color TTL
MPP
4
High value-added sales solid in Office and Production Print
Office Production Print
Year-on-year growth rate in A3 color MFP shipments
Year-on-year growth rate in Color Production Print models
New 65/75 PPM products released at latter half of FY2017 have seen significant growth, primarily in North America and China.
The strategy of differentiating by means of the IQ-501 option, which automatically controls output and improves the efficiency of customer workflows, bore fruit, leading to higher PV and contributing to higher revenue.Sales volumes grew significantly in Europe and China in particular
・A3 monochrome MFP sales volumes +3% YoY
-10%
9% 8%6%
-8%
11%
14%
20%
FY17 1Q FY17 2Q FY17 3Q FY17 4Q
A3 color
A3 color Seg4+

Konica Minolta, Inc.Konica Minolta, Inc. 5
Growth rate of MIF & PV in Office/PP(JPN,USA,GBR,DEU,FRA)
Office Production Print
8% 7%
3%4%
FY16 FY17
Year-on-year growth rate in Office MIF
6%
8%
1%
3%
FY16 FY17
Year-on-year growth rate in Office PV
Color Total
9%
5%5%
3%
FY16 FY17
Year-on-year growth rate in PP MIF
7%
5%5%
4%
FY16 FY17
Year-on-year growth rate in PP PV
Color Total

Konica Minolta, Inc.Konica Minolta, Inc.
10
%
23
%
38
%
85
%
FY17 通期 FY17 4Q
TAC
VA+IPS
6
Profit growth in the Industrial Business
Measuring instruments Performance Materials
Won orders from multiple customers by providing solutions in response to innovation in mobile equipment, thus achieving significant revenue growth.
The momentum that had continued since 4Q FY2016 slowed, but there was a continued broadening of the customer base and applications.
Picked up the trend to larger displays and diversification of manufacturers early on, increased sales of higher value-added products resulting in higher revenue.
After 3Q revenues began to trend upwards, contributing to earnings.
Performance Materials revenue (¥ billions)
6.5
5.2 5.3
9.7
11.0 10.9 10.7
7.8
1Q 2Q 3Q 4Q
FY16
FY17
9.6
12.0
10.8
9.79.0
12.011.1 11.4
1Q 2Q 3Q 4Q
FY16 FY17
YoY growth rate in TAC film shipment
Measuring instruments revenue (¥ billions)
FY17-12M

Konica Minolta, Inc.
FY2018 Financial Forecast
7

Konica Minolta, Inc.Konica Minolta, Inc. 8
Looking back at FY2017 Priority initiatives for FY2018
Core
Results
Office, Production Print profitability recovered (3Q, 4Q)
In measuring instruments, the customer base and applications expanded
Fundamental strengthening of profitability✓ Creating factors that appeal from the
customer's perspective✓ Making manufacturing/service cost
reductions bear fruit✓ Human resources shift resulting from
increased productivityIssues
Office, Production Print to demonstrate their profitability over the full year
Growth
Results
Growth in industrial printing top line Tests at customers to demonstrate value
of measuring instruments, visual inspection
Increased scale, leading to contribution to earnings in FY2019
✓ Expanding industrial printing top line✓ Expanding visual inspection business by
leveraging existing customer base in measuring instruments
Issues Increase specialist and experts for
selling industrial print
New
Results
Established business foundation/structure for Bio-Healthcare
Verified value of Workplace Hub to customers
Efficient investment aimed at implementing medium- to long-term growth
✓ Solid launch for Workplace Hub✓ Making Bio-Healthcare tripartite operating
structure bearing fruit (KM, Ambry, Invicro)Issues Adding final touches to Workplace Hub
Priority initiatives for FY2018
Konica Minolta, Inc.Konica Minolta, Inc. 9
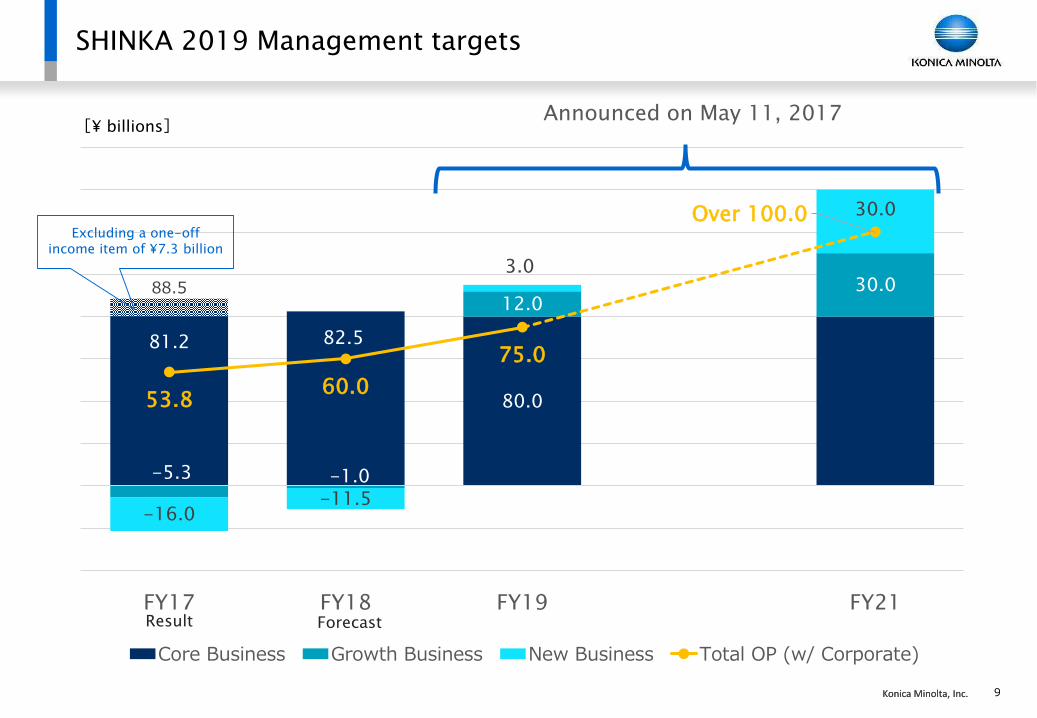
81.2 82.5
80.0
88.5
-5.3 -1.0
12.030.0
-16.0-11.5
3.0
30.0
53.860.0
75.0
Over 100.0
FY17 FY18 FY19 FY21
Core Business Growth Business New Business Total OP (w/ Corporate)
SHINKA 2019 Management targets
Announced on May 11, 2017
Excluding a one-off income item of ¥7.3 billion
[¥ billions]
Result Forecast

Konica Minolta, Inc.Konica Minolta, Inc. 10
Dividend
forecast Actual figures for FY2017 have been used unchanged at ¥30 per share.
Full-year
forecast
As the interim year of the Medium Term Business Plan SHINKA 2019, FY2018 will be used to pave the way to achieving the management target of operating profit of ¥75 billion in the final year of FY2019.
We will tackle “increasing the earning capacity of our core business” and “accelerating transformation” as priority initiatives.
Incorporating the risk of the stronger yen against the US dollar and the euro, our forex assumptions have been set at [¥105 to the US dollar and ¥125 to the euro].
FY2018 Performance Forecast
[¥ billions]
Mar 2019estimates
Mar 2018results
YoY
Revenue 1,080.0 1,031.3 + 5%
Operating Profit 60.0 53.8 + 11%
Profit attributable to owners of the company
37.0 32.2 + 15%
FOREX [Yen]
USD 105 110.9
Euro 125 129.7

Konica Minolta, Inc.11
FY2018 Earnings Forecast- Segments
[¥ billions]
*Figures for FY2017 have been recalculated based on business segmentation for FY2018.
RevenueMar 2019estimates
Mar 2018results
YoY
Office 585.0 583.9 + 0%Professional Print 232.5 214.3 + 9%Healthcare 92.5 96.5 - 4%Industrial 120.0 118.2 + 1%
Optical systems for industrial use 40.0 43.1 - 7%
Materials and components 80.0 75.1 + 6%
New business 50.0 17.3 + 188%Bio-Healthcare 35.0 9.0 + 290%Other 15.0 8.4 + 79%
Corporate, etc. 0 1.0 -Company overall 1080.0 1031.3 + 5%
Operating profit /OPMMar 2019estimates
Mar 2018results
YoY
Office 45.0 7.7% 44.9 7.7% + 0%Professional Print 12.5 5.4% 9.3 4.3% + 35%Healthcare 5.0 5.4% 5.6 5.8% -10%Industrial 19.0 15.8% 23.5 19.8% -19%New business -11.5 - 23.0% -16.0 -92.0% -Corporate, etc. -10.0 - -13.4 - -Company overall 60.0 5.6% 53.8 5.2% + 11%
*1
*1: YoY +4% excluding impact from terminating OEM business approx. ¥5 billion
*2: YoY +14% excluding one-off earnings in FY17
*2
*3: YoY +42% excluding one-off earnings in FY17
*3

Konica Minolta, Inc.
-6.1
7.09.9 10.9
8.0
1.9
2.6
2.1
6.6
6.0
5.5
3.1
5.0
13.7
16.0
1.3
12.8
17.1
31.130.0
FY17
実績
FY18
見通し
FY19
見通し
3ヵ年
見通し
17/5/11
公表値
管理間接
サービス原価
製造原価
Strengthening profitability in the Core Business
12
• Extend digital manufacturing to all factories and suppliers.
• Concurrent engineering for reducing costs for new products.
• Strategic disposition of manufacturing allocation, expanded local procurement.
• Mold-free production matched to the part lot.
• Automated production of consumables.
Manufacturing costs
reduction
• Long-life consumable/parts
• Reduce costs per MIF by predictive maintenance
• Remote maintenance expansion
Servicecosts
reduction
• Conversion of fixed costs to variable costthrough structural reform(consolidation/outsourcing)
• Consolidation of locations/warehouses
• Utilize RPA to automate routine operations
Administrative
/indirect operations
【¥ billions】
Indirect operations
Service costs
Manufacturing costs
Results Forecast Forecast
3-yearsForecast
May 11, 2017
Announced

Konica Minolta, Inc.Konica Minolta, Inc.
Measures to expand gross profit by selling high value-added products
13
Developed countries: expand color MIF → maintain momentum of rising PV
Growth countries: strengthen market position through expanding sales channels in Eastern Europe and China, where there is significant potential for expansion from the shift to color.
Decisively capture high-profitability medium-sized enterprises by strengthening pipeline management
Office
Business
Developed countries: increase average selling price per
customer × increase in units × increase in PV (expanded attachment ratio of IQ-501 and following PV increase)
Growth countries: expand in APAC, primarily in China and India where share is high
Product lineup: expand market by launching color 70/80 ppm models
Professional
Printing
Business
Using sales to shift high-profitability medium-sized enterprises to high value-added products, promoting reforms with the aim of improving earnings power
Meticulously provide high added value to commercial print customers, maintain top position in MPP color, strengthen cost competitiveness

Konica Minolta, Inc.Konica Minolta, Inc.
• Promotion of structural reforms in Japan and overseas continues as part of the strengthening of profitability in core businesses set out in Medium Term Business Plan SHINKA 2019
• Implement sale & leaseback as part of corporate real estate (CRE) strategy
14
Initiatives to Strengthen Medium-Term Profitability
Target and purpose
Impact on profit and loss
FY17-1H FY17-2H FY18
Structural reform expenses
Special early retirement program in Japan, consolidation of warehouses/outsourcing of back-office in Europe, consolidation of locations in North America, etc.
- ¥6.2bn - ¥3.8bn -¥2.0~3.0bn
CRE strategyGlobal optimization of facilities use (land/buildings)
¥11.5bn ¥9.4bn
¥10.0bn +(Including expenses related
to repairs/removals)

Konica Minolta, Inc.
New businesses
Growth businesses
15
Enhancing customer satisfactionthrough performance/cost
Providing customer experiencethat exceeds expectations
Indispensable provision ofsolutions to issues
Hardware
ITsolutions
Databusiness
Strengthening of customer relationships
Add
ed
valu
e incre
ased b
y d
igit
al
By building up “growth” and “new” on top of our Core business, we sustainably generate a large “surface”
Core businessSHINKA
Position of Growth and New Business

Konica Minolta, Inc.Konica Minolta, Inc. 16
Growing through core businesses/creating new businesses
Continuous expansion of color MIF in Office Business
(Expansion of customer base)
Hybrid sales, which include IT services, to the small and
medium-sized enterprises that make up our core customer base
(Deepening of customer base)
Providing customer experience that exceeds expectations /
indispensable solutions to issues, by means of the Workplace Hub
(Providing value to customer)

Konica Minolta, Inc.Konica Minolta, Inc.
Development of applications with partners and customers by design thinking method
17
Workplace Hub milestones
FY17 FY18 FY19
4Q 1Q 2Q 3Q 4Q 1Q
Sales of Workplace Hub itself, and applications, begin (managed IT, TEAM SPACE, IoT kits for manufacturing,
security, backup, etc.)
Local events hosted in Europe, the US, Japan
Prepare for launch of new-generation workplace Hub
Start deployment of decision support and industry-specific applications in turn

Konica Minolta, Inc.Konica Minolta, Inc. 18
Workplace Hub and the digitalization of small and medium-sized manufacturers
Business challenges
• Improving productivity through the digitalization of manufacturing sites
Pain points
• Know-how and resources
• Acquiring and communicating data from manufacturing facilities
• Manufacturing cost reductions
Customer Value
• Use All-in-One package solutions to support the deployment of IoT for small and medium-sized manufacturers
• Cover deployments from the consulting stage up to after-sales support
• Provide devices and software necessary for introducing IoT
• Predictive maintenance that uses data guaranteed to be secure (→ improved utilization rates)
Cloud
Conversion of existing facilities to IoT
Data Visualization
Plug-In camera
Dashboard
Manufacturing management
& execution system
Status monitoring
Instructions

Konica Minolta, Inc.Konica Minolta, Inc. 19
Workplace Hub and working style reforms for small and medium-sized customers (TEAM SPACE)
Business challenges
• Improving productivity/creativity through the digitalization of the workplace
Pain points
• IT skills and resources required for deployment
• One-way communications
(e-mail, intranet)
Customer Value
• Support improvements in productivity and creativity by enabling the easy deployment of a digital workplace
• Simple customization and maintenance based on templates
• Wide range of collaboration functions (internal SNS, team site, enterprise search, dashboards etc.)
• Release from specific workplace/work hours (→ improved intellectual productivity/creativity resulting from diversity of human resources)
Team site
Template manager
Multi-device
Enterprise search
Personaldashboard
Konica Minolta, Inc.Konica Minolta, Inc. 20
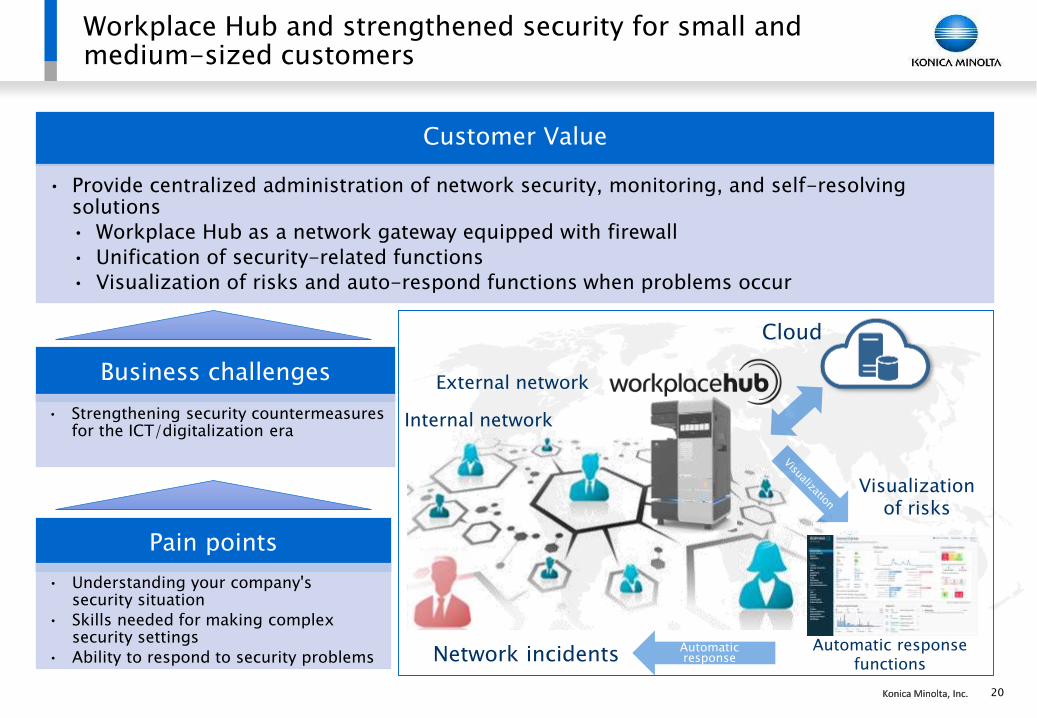
Workplace Hub and strengthened security for small and medium-sized customers
Business challenges
• Strengthening security countermeasures for the ICT/digitalization era
Pain points
• Understanding your company's security situation
• Skills needed for making complex security settings
• Ability to respond to security problems
Customer Value
• Provide centralized administration of network security, monitoring, and self-resolving solutions
• Workplace Hub as a network gateway equipped with firewall
• Unification of security-related functions
• Visualization of risks and auto-respond functions when problems occur
External network
Network incidents
Visualization of risks
Automatic response functions
Automatic response
Internal network
Cloud

Konica Minolta, Inc.Konica Minolta, Inc. 21
Domain Short term Medium to long term
Genetic diagnostics(Ambry)
Strengthen channels to specialist cancer doctors
Won comprehensive agreement with major hospital group
Strengthen marketing capabilities Strengthen the structure through
new senior sales management,and strengthen relationships of trust with major insurance companies
Strengthen genetic testing business for pharmaceuticals
Build a genetics database originating in Japan, accelerate the genetic testing business
Expand into the market for genetic testing (at one's own expense) in the Asia-Pacific region
Generate business synergies through joint “K-magic” projects between Konica Minolta, Ambry Genetics and Invicro
Drug discovery/support(Invicro)
Winning new projects Win long-term projects in
clinical trial support field
Strengthen clinical testing design function
Expand services lineup through clinical testing menu, and HSTT testing menu
FY2018 priority initiatives: Bio-Healthcare business

Konica Minolta, Inc.Konica Minolta, Inc. 22
FY2018 Earnings Forecast- Overview
ROE*: profit for the year attributable to the owners of the company, divided by the average (using figures from start and end of year) of the sum of share capital, share premium, retained earnings and treasury shares
[¥ billions]
Earning Forecast ResultsMar 2019 Mar 2018 YoY
Revenue 1,080.0 1,031.3 + 5%Operating Profit 60.0 53.8 + 11%
Operating Profit ratio 5.6% 5.2% -
Profit before tax 55.0 49.1 + 12%Profit attributable to owners of the company 37.0 32.2 + 15%
Profit attributable to owners of the company ratio 3.4% 3.1% -
EPS [Yen] 74.82 65.17ROE [%] 6.9% 6.1%ROE* [%] - 6.3%
CAPEX 55.0 38.7Depreciation and Amortization Expenses 60.0 56.3R&D expenses 80.0 77.0FCF (Mar 2019 forecast does not include investment and lending) 35.0 - 68.4Investment and lending 30.0 125.0
FOREX [Yen] USD 105.0 110.9euro 125.0 129.7
*)
*) -33.0 without contribution from INCJ for acquisition of Ambry Genetics Corporation

Konica Minolta, Inc.
Appendix
23

Konica Minolta, Inc.Konica Minolta, Inc. 24
Office Business
Revenue Operating Profit 4Q Summary
In the US, in addition to the effects of newly consolidated subsidiaries, growing sales of highly profitable security solutions also made a contribution, and revenues increased.
In Europe, sales of managed content services with improved margins rose due to enhancements to the service structure.
IT Service Solution
In North America, favorable sales of A3 color models continued, primarily for high-speed models, while sales of high-speed A3 color models grew year on year in Europe.
In China, sales rose significantly due to the shift to high-speed A3 color models while sales year on year declined overall.
Sales to existing customers were robust, in addition to which there was an increase in major new projects.
OPS revenue: ¥29.1 billion (+20% YoY)
GMA revenue: ¥9.4 billion (+10% YoY)
Office
44.3 44.9
7.9% 7.7%
-20.0%
-15.0%
-10.0%
-5.0%
0.0%
5.0%
10.0%
495.4 513.3
62.970.6
FY16 FY17
OfficeIT Service Solution
558.2583.9
(+4%)
(+12%)
(+1%)
(+5%)
FY16 FY17
[¥ billions][¥ billions]
Konica Minolta, Inc.Konica Minolta, Inc.
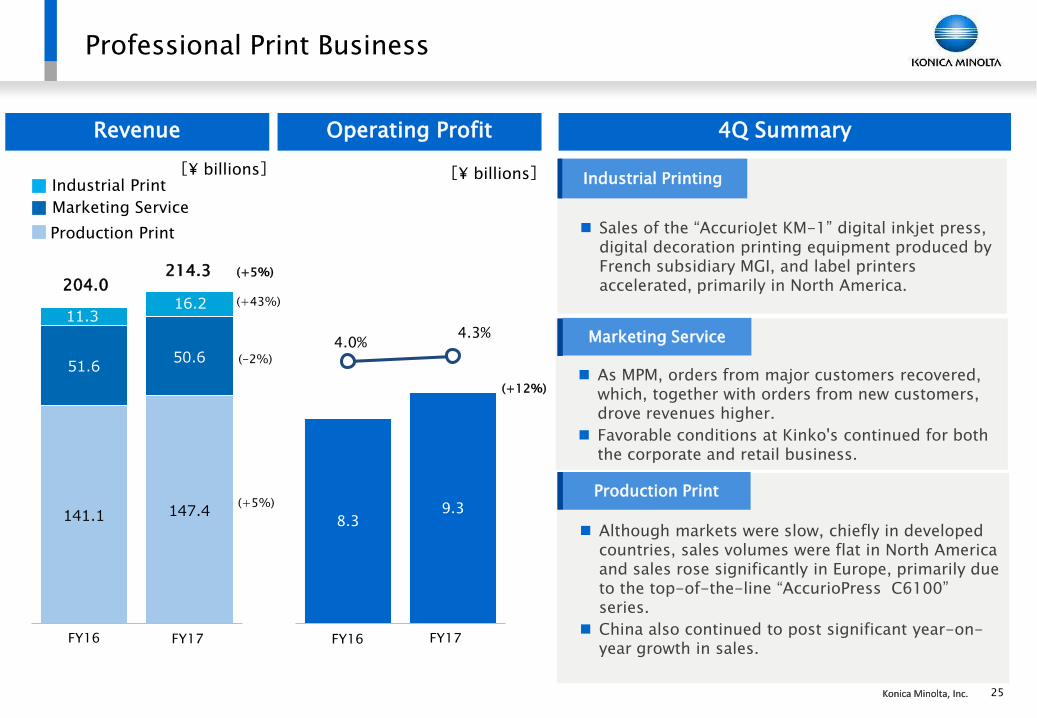
8.39.3
4.0%4.3%
-10.0%
-8.0%
-6.0%
-4.0%
-2.0%
0.0%
2.0%
4.0%
6.0%
8.0%
10.0%
141.1 147.4
51.650.6
11.316.2
Marketing Service
204.0214.3
(-2%)
(+5%)
(+43%)
(+5%)
Production Print
Industrial Print
FY16 FY17 FY16 FY17
Sales of the “AccurioJet KM-1” digital inkjet press, digital decoration printing equipment produced by French subsidiary MGI, and label printers accelerated, primarily in North America.
25
Professional Print Business
Revenue Operating Profit 4Q Summary
As MPM, orders from major customers recovered, which, together with orders from new customers, drove revenues higher.
Favorable conditions at Kinko's continued for both the corporate and retail business.
Marketing Service
Although markets were slow, chiefly in developed countries, sales volumes were flat in North America and sales rose significantly in Europe, primarily due to the top-of-the-line “AccurioPress C6100” series.
China also continued to post significant year-on-year growth in sales.
Industrial Printing
Production Print
(+12%)
[¥ billions][¥ billions]

Konica Minolta, Inc.Konica Minolta, Inc.
82.987.6
7.1
8.9
16.12M 17.12M
Healthcare Business
Revenue Operating Profit 4Q Summary
Higher sales volume in the US is contributing to
revenue.
Service contract revenue is also rising steadily.
Medical IT
DR: Despite Japan being flat year on year, sales
volumes expanded in the US due to strengthened
cooperation with an X-ray system manufacturer,
and also winning some major projects.
Diagnostic ultrasound systems: Due to establishing
a position as a "genre-top" product in the field of
orthopedics, and launching new products, sales in
Japan remained solid. Sales volumes also grew year
on year in Europe, the US, and China.
Service contracts also grew steadily.
Healthcare(Modality)
2.9
5.6
3.2%5.8%
0
10
20
30
40
50
60
70
Healthcare(Modality)
Medical IT
(+26%)
(+6%)
(+95%)
(+7%)
FY16 FY17 FY16 FY17
89.9
96.5
[¥ billions][¥ billions]
26

Konica Minolta, Inc.Konica Minolta, Inc.
72.2 75.1
29.3
43.1
22.0 23.5
21.7%19.8%
27
Industrial Business
Revenue Operating Profit 4Q Summary
Measuring instruments: In the light source color area,
revenues declined due to shipments for a major project
in the same period of the previous year, but the
broadening of the customer base and the range of
applications continued.
Sales in the object color area also grew.
Optical systems for industrial use
Performance materials: In line with the increasing size
of LCD TVs, we grew sales volumes of high value-
added film products such as water-resistant VA-TAC
films and ZeroTAC film for IPS panels, raising revenue
despite suffering from price pressure.
Optical components:
Revenues increased due to higher sales of projector
and interchangeable lenses.
IJ (inkjet) components:
Higher revenues were again driven by sales in
Europe/Asia.
Materials and components
Materials and components
Optical systems for industrial use
(+47%)
(+4%)
(+6%)
(+16%)
FY16 FY17 FY16 FY17
101.6
118.2
[¥ billions][¥ billions]

Konica Minolta, Inc.Konica Minolta, Inc.
41.8 43.3
20.9 21.19.5 10.7
2.6 2.7
26.7
40.4
28
Revenue in Industrial Business Sub-Segments: 12 Months
Optical systems for industrial use
Materials and components
Measuring Instruments
Performance Materials Optical Components IJ (inkjet) Component
Imaging Solutions
(+51%)
(+4%)
(+4%)
(+1%)
(+13%)
FY16 FY17 FY16 FY17
FY16 FY17 FY16 FY17 FY16 FY17
[¥ billions]

Konica Minolta, Inc.Konica Minolta, Inc.
Major Items from Statements of Financial Position
29
Total Assets Inventory/Turnover
* Inventory turnover, in months = Inventory balance at end of fiscal year / Average cost of sales for most recent three months
Increase in total assets caused by goodwill/intangible assets arising from Ambry/Invicro acquisitions
In Office/Professional Print, rising sales in high-end products and in emerging countries, and strong sales of measuring instruments led to higher sales, resulting in higher inventories
991.7 1001.8 976.4 1005.4
1203.9
Mar 2014 Mar 2015 Mar 2016 Mar 2017 Mar 2018
115.2 120.8 121.4
136.0 139.5
2.52 2.54 2.58 2.87 2.86
Mar 2014 Mar 2015 Mar 2016 Mar 2017 Mar 2018
Inventories Turnover (months)
[¥ billions][¥ billions]

Konica Minolta, Inc.Konica Minolta, Inc.
202.4
165.6 168.3 185.5
293.7
0.41 0.31
0.33 0.35
0.56
0.03 -0.02 0.13
0.18 0.27
Mar 2014 Mar 2015 Mar 2016 Mar 2017 Mar 2018
Interest-bearing debts
Debt-to-equity ratio (times)
Net Debt equity ratio (times)
Major Items from Statements of Financial Position
30
Equity & Equity RatioAttributable to owners of the parent company
Interest-Bearing Debts &D/E Ratio
(¥100.0bn of increased ¥108.2bnis for Hybrid-Loan)
Equity ratio = Equity attributable to owners of the company / Total assets
Interest-bearing debts increased due to hybrid loan borrowings, resulting in higher debt-to-equity and net debt equity ratios
Despite the decline in the equity ratio caused by borrowing the funds necessary for the acquisition of the bio-healthcare business, utilizing hybrid loans allowed us to maintain our credit rating at “A”
(For CompanyRating 47.6%)Equity = Equity attributable to owners of the company
498.5
536.0 514.3
524.3 524.5
50.3 53.5 52.7 52.1
43.6
Mar 2014 Mar 2015 Mar 2016 Mar 2017 Mar 2018
Shareholders' equity Equity ratio(%)
[¥ billions][¥ billions]
Konica Minolta, Inc.Konica Minolta, Inc. 31
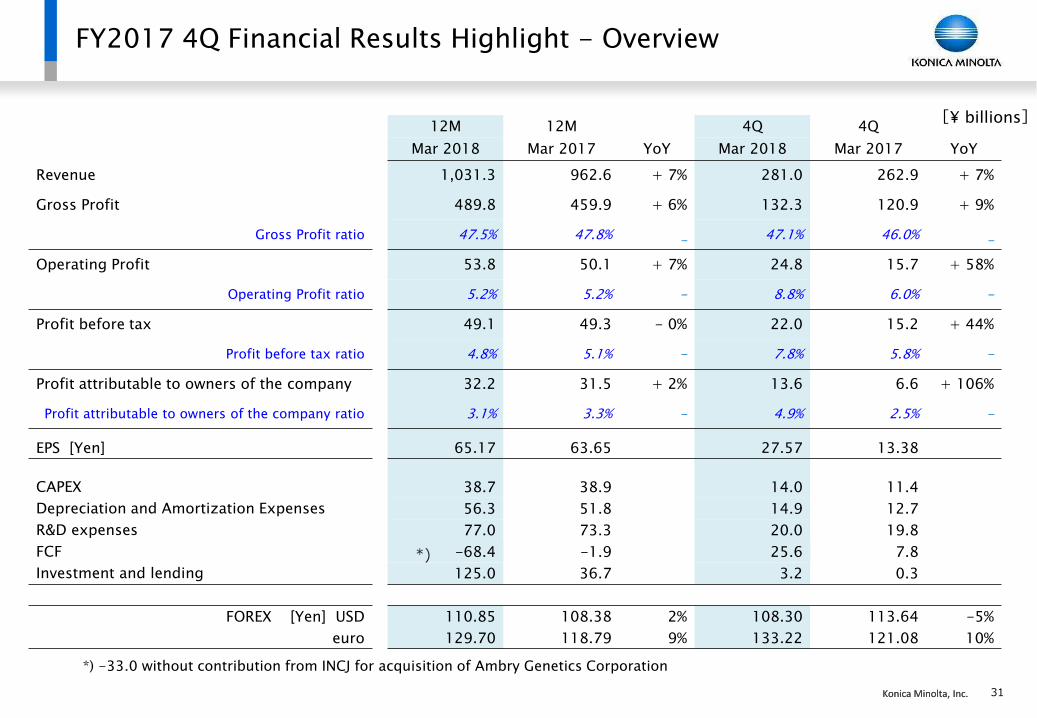
FY2017 4Q Financial Results Highlight - Overview
12M 12M 4Q 4Q
Mar 2018 Mar 2017 YoY Mar 2018 Mar 2017 YoY
Revenue 1,031.3 962.6 + 7% 281.0 262.9 + 7%
Gross Profit 489.8 459.9 + 6% 132.3 120.9 + 9%
Gross Profit ratio 47.5% 47.8% - 47.1% 46.0% -
Operating Profit 53.8 50.1 + 7% 24.8 15.7 + 58%
Operating Profit ratio 5.2% 5.2% - 8.8% 6.0% -
Profit before tax 49.1 49.3 - 0% 22.0 15.2 + 44%
Profit before tax ratio 4.8% 5.1% - 7.8% 5.8% -
Profit attributable to owners of the company 32.2 31.5 + 2% 13.6 6.6 + 106%
Profit attributable to owners of the company ratio 3.1% 3.3% - 4.9% 2.5% -
EPS [Yen] 65.17 63.65 27.57 13.38
CAPEX 38.7 38.9 14.0 11.4
Depreciation and Amortization Expenses 56.3 51.8 14.9 12.7
R&D expenses 77.0 73.3 20.0 19.8
FCF -68.4 -1.9 25.6 7.8
Investment and lending 125.0 36.7 3.2 0.3
FOREX [Yen] USD 110.85 108.38 2% 108.30 113.64 -5%
euro 129.70 118.79 9% 133.22 121.08 10%
[¥ billions]
*)
*) -33.0 without contribution from INCJ for acquisition of Ambry Genetics Corporation

Konica Minolta, Inc.Konica Minolta, Inc.
44.9 44.3
9.3 8.3
5.6 2.9
23.5 22.0
-29.4 -27.4
12M
Mar 2018
12M
Mar 2017
583.9 558.2
214.3 204.0
96.5 89.9
43.1
29.3
75.1
72.2
18.4
8.9
12M…12M…
Mar 2018
32
Revenue Operating Profit
1031.3962.6 53.8
Office
Professional Print
Healthcare
Optical systems for industrial use
Materials and components
New business / corporate, etc.
Office
Professional Print
Healthcare
Industrial
New business / corporate, etc.
(+47%)
(+7%)
(+107%)
(+5%)(+12%)
(+1%)
(+96%)
(+4%)
(+5%)
Mar 2017
(+6%)
50.1
FY2017-12M Revenue and Operating Profit by Segment
Mar 2018Mar 2017
[¥ billions]

Konica Minolta, Inc.Konica Minolta, Inc.
OfficeProfessional
PrintingHealthcare
Industrial Business
New business / corporate,
etc.Total
[Factors]
Forex impact 2.6 0.5 0.1 -0.1 0.0 3.0
Price change 1.2 -0.2 -0.7 -0.4 - 0.0
Sales volume change, and other, net -0.3 3.0 0.9 0.6 2.1 6.3
Cost up/down 0.4 -0.2 0.1 0.0 -0.2 0.2
SG&A change, net -1.0 0.6 0.0 0.9 -6.0 -5.5
Other income and expense -1.0 -1.1 0.1 -0.3 7.6 5.0
[Operating Profit]
Change, YoY 1.9 2.8 0.3 0.6 3.5 9.1 33
FY2017 4Q Operating Profit Analysis
FY2017/4Q vs FY2016/4Q
FY2017/12M vs FY2016/12M[¥ billions]
OfficeProfessional
PrintingHealthcare
Industrial Business
New business / corporate,
etc.Total
[Factors]
Forex impact 2.1 2.1 0.4 0.5 -0.2 4.9
Price change -2.2 -1.9 -2.0 -2.7 - -8.8
Sales volume change, and other, net -0.7 3.9 2.6 10.8 3.9 20.5
Cost up/down -0.3 -0.3 0.4 0.4 -0.3 0.0
SG&A change, net -1.2 -0.2 -0.6 0.6 -12.8 -14.2
Other income and expense 2.9 -2.5 1.8 -8.2 7.3 1.3
[Operating Profit]
Change, YoY 0.6 1.0 2.7 1.4 -2.0 3.7

Konica Minolta, Inc.Konica Minolta, Inc. 34
SG&A - Other Income/ Expenses-Finance Income/Loss
SG&A:
12M Mar 2018
12M Mar 2017
Increase or decrease
4Q Mar 2018
4Q Mar 2017
Increase or decrease
Selling expenses - variable 48.2 46.8 +1.4 11.1 12.0 -0.8
R&D expenses 77.0 73.3 +3.7 20.0 19.8 +0.3
Personnel expenses 202.8 192.1 +10.7 53.8 49.8 +4.0
Other 116.0 104.5 +11.5 28.1 24.5 +3.6
SG&A total 444.0 416.6 +27.4 113.0 106.0 +7.0
* Forex impact: ¥+13.2 bn. (Actual: ¥+14.2bn.) ¥+1.5 bn. (Actual: ¥+5.5bn.)
Other income:
Gain on sales of property, plant and equipment 20.9 1.0 +19.9 9.7 0.8 +8.8
Patent-related income - 7.8 -7.8 - - -
Other income 4.0 5.3 -1.3 1.6 2.8 -1.2
Other income total 24.9 14.1 +10.7 11.2 3.6 +7.6
Other expenses
Loss on sales of property, plant and equipment 1.0 1.0 -0.0 0.4 0.4 +0.0
Impairment losses on property 0.6 0.4 +0.2 0.6 0.3 +0.2
Special extra retirement payments 5.3 0.2 +5.2 - - -
Other expenses 9.9 5.8 +4.1 4.7 2.1 +2.7
Other expenses total 16.8 7.3 +9.5 5.7 2.8 +2.9
Finance income/loss:
Interest income/Dividends received/Interest expense
-1.8 -0.2 -1.7 -1.1 -0.1 -1.0
Foreign exchange gain/loss (net) -2.4 0.0 -2.4 -1.6 -0.2 -1.4
Other 0.2 -0.5 +0.7 0.4 -0.3 +0.7
Finance income/loss, net -4.1 -0.7 -3.3 -2.2 -0.5 -1.7
[¥ billions]

Konica Minolta, Inc.Konica Minolta, Inc.
102.0
59.2 68.7 65.4
90.0
54.0
110.8 70.6
133.7
55.0
48.0
-51.5
-1.9
-33.0
35.0
35.4
INCJ FCF
Net cash flows from investing activities Net cash flows from operating activities
35
FY2014 FY2015 FY2016 FY2017FY2018予想
FY2014
FY2015
FY2016
FY2017
FY2018Forecast
*
*Portion invested by INCJ
at time of AG acquisition
Outlook for Capital Expenditure andDepreciation and Amortization Expenses/ Free Cash Flows
Free Cash FlowsCapital Expenditure andDepreciation and Amortization Expenses
Forecast
[¥ billions]
INCJ : Innovation Network Corporation of Japan
46.1
52.6
38.9 38.7
55.0
47.9 51.3 51.8
56.3
60.0
Capital expenditures Depreciation and amortization
*FCF forecast for FY2018 does not include investment and lending
Konica Minolta, Inc.Konica Minolta, Inc.
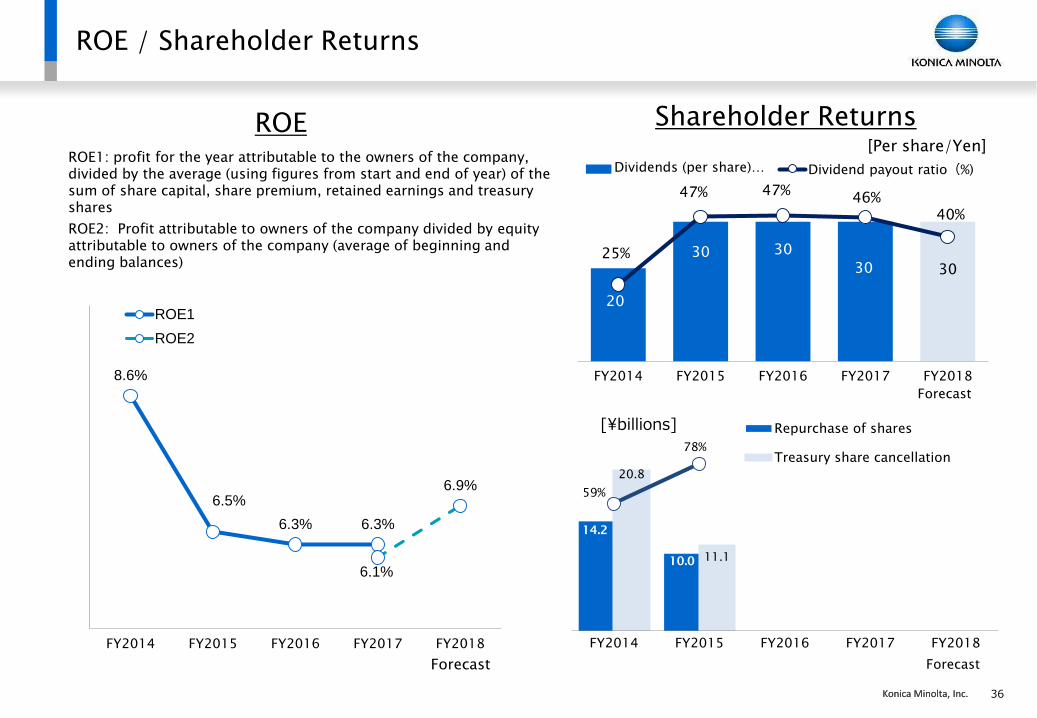
14.2
10.0
20.8
11.1
59%
78%
FY2014 FY2015 FY2016 FY2017 FY2018
Repurchase of shares
Treasury share cancellation
20
30 30
30 3025%
47% 47%46%
40%
FY2014 FY2015 FY2016 FY2017 FY2018
Dividends (per share)… Dividend payout ratio(%)
36
Forecast
[¥billions]
Forecast
ROE / Shareholder Returns
Shareholder ReturnsROEROE1: profit for the year attributable to the owners of the company, divided by the average (using figures from start and end of year) of the sum of share capital, share premium, retained earnings and treasury shares
[Per share/Yen]
Forecast
8.6%
6.5%
6.3% 6.3%
6.1%
6.9%
FY2014 FY2015 FY2016 FY2017 FY2018
ROE1
ROE2
ROE2: Profit attributable to owners of the company divided by equity attributable to owners of the company (average of beginning and ending balances)

Konica Minolta, Inc.Konica Minolta, Inc. 37
FY2015 FY2016 FY2017
1Q 2Q 3Q 4Q 1Q 2Q 3Q 4Q 1Q 2Q 3Q 4Q
Japan 12% 12% 12% 13% 13% 12% 13% 13% 13% 13% 12% 12%
N. America 33% 34% 34% 33% 32% 34% 33% 32% 34% 34% 33% 31%
Europe 37% 36% 38% 38% 37% 36% 36% 38% 36% 36% 38% 40%
Others 18% 18% 17% 16% 18% 18% 18% 16% 17% 17% 17% 17%
FY2015 FY2016 FY2017
1Q 2Q 3Q 4Q 1Q 2Q 3Q 4Q 1Q 2Q 3Q 4Q
Japan +1% +1% +1% -0% -1% -1% -1% -2% +2% +0% -1% -1%
N. America +5% +1% +3% +0% +2% +3% +6% -3% +2% +3% -3% +8%
Europe +3% +0% +3% +2% +4% +4% +9% +4% -1% +2% +1% +4%
Others +20% -3% -4% -1% +4% +7% -12% -1% -10% -8% -5% -2%
FY2015 FY2016 FY2017
1Q 2Q 3Q 4Q 1Q 2Q 3Q 4Q 1Q 2Q 3Q 4Q
Office 68% 66% 71% 71% 71% 72% 72% 72% 69% 72% 72% 72%
PP 68% 71% 73% 73% 74% 73% 73% 72% 78% 76% 80% 78%
Unit Sales Trends: Office/Professional Print
Composition of revenue by region (in yen)
Change in Revenue by region (w/o FOREX)
Percentage of color in sales of hardware

Konica Minolta, Inc.Konica Minolta, Inc.
100 110 107
125
90
120 116 132
1Q 2Q 3Q 4Q
FY16 FY17
YoY: +6%
38
QoQ: +14% YoY: - 2% QoQ: +9% YoY: +2% QoQ: +12%
YoY: +8% QoQ: +49% YoY: △12% QoQ: +21% YoY: +2% QoQ:+40%
担当:川杉
100 114
100 117
104 122
104 114
1Q 2Q 3Q 4QFY16 FY17
100
112 104
121
97
121 111
124
1Q 2Q 3Q 4QFY16 FY17
100
129 122
158
110 136
115
170
1Q 2Q 3Q 4QFY16 FY17
100
140 137 147
104 127
107
130
1Q 2Q 3Q 4QFY16 FY17
100
132 127
154
108
133
112
157
1Q 2Q 3Q 4QFY16 FY17
Unit Sales Trend: Office/Professional Print
A3 Color MFP- Units* A3 B&W MFP- Units*
Color Production Print - Units* B&W Production Print – Units* Production Print - Units*
*Base index : “1Q Mar2016” = 100
Konica Minolta, Inc.Konica Minolta, Inc.
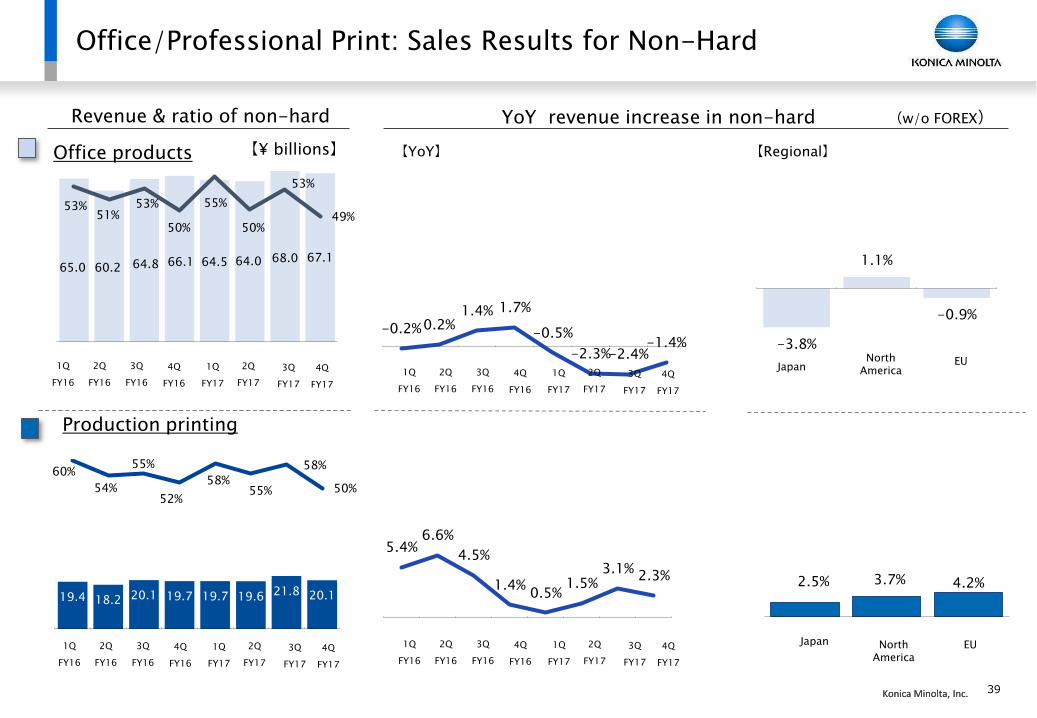
2.5% 3.7% 4.2%
-3.8%
1.1%
-0.9%
5.4%6.6%
4.5%
1.4%0.5%
1.5%3.1%
2.3%
-0.2%0.2%1.4% 1.7%
-0.5%
-2.3%-2.4%-1.4%
19.4 18.2 20.1 19.7 19.7 19.6 21.8 20.1
60%
54%
55%
52%
58%55%
58%
50%
65.0 60.2 64.8 66.1 64.5 64.0 68.0 67.1
53%51%
53%
50%
55%
50%
53%
49%
39
担当:川杉1Q
FY16
2Q
FY16
4Q
FY16
3Q
FY16
1Q
FY17
3Q
FY17
2Q
FY17
4Q
FY17
1Q
FY16
2Q
FY16
4Q
FY16
3Q
FY16
1Q
FY17
3Q
FY17
2Q
FY17
4Q
FY17
1Q
FY16
2Q
FY16
4Q
FY16
3Q
FY16
1Q
FY17
3Q
FY17
2Q
FY17
4Q
FY17
1Q
FY16
2Q
FY16
4Q
FY16
3Q
FY16
1Q
FY17
3Q
FY17
2Q
FY17
4Q
FY17
Office/Professional Print: Sales Results for Non-Hard
Office products 【¥ billions】 【YoY】 【Regional】
Revenue & ratio of non-hard YoY revenue increase in non-hard (w/o FOREX)
JapanNorth
AmericaEU
Production printing
Japan North America
EU

Konica Minolta, Inc.Konica Minolta, Inc. 40
FOREX Impact on Revenue and Operating Profit: 12M
[FOREX:¥][Impact, Sensitivity:¥ billions]
*1 European currencies: Currencies used in Europe excluding EUR/GBP
*2 FOREX Sensitivity: FOREX impact at ¥1 change (annual)
FY16 FY17 Impact to 2016 FX Sensitivity *2
12M 12M Revenue OP Revenue OP
USD 108.38 110.85 + 7.7 - 0.1 + 3.2 + 0.0
EUR 118.79 129.70 + 20.1 + 9.3 + 1.8 + 0.7
GBP 141.60 147.03 + 1.8 - 0.0 + 0.3 + 0.1
EuropeanCurrency*1
ー ー + 26.3 + 9.6 + 2.6 + 1.1
CNY 16.11 16.75 + 2.0 + 0.4 + 2.9 + 1.1
AUD 81.56 85.78 + 1.6 + 0.5 + 0.4 + 0.1
Other ー ー + 2.1 + 0.9 ー ー
Exchange contract effect ー ー - - 6.4 ー ー
Total impact from FY2016
+ 39.7 + 4.9

Konica Minolta, Inc.Konica Minolta, Inc. 41
Business Segments Update for FY 2018
Business Segments for FY 2018
IT Service Solutions Office
Business Segments for FY 2017
Office Business
Industrial Print Marketing Services Production Print
Professional Print Business
Healthcare (Modality) Medical IT
HealthcareBusiness
Measuring Instruments Visual Solutions (Planetariums)Industrial
Business
Optical Systemsfor Industrial Use
Performance Materials(+OLED/Raw materials)
Optical Components IJ Components
Materials/Components
New Businesses・Corporate etc.
Core Business Growth Business New Business
IT Service Solutions Office
Office Business
Industrial Print Marketing Services Production Print
Professional Print Business
Healthcare (Modality) Medical IT
HealthcareBusiness
Measuring Instruments Visual Solutions (Planetariums)Industrial
Business
Optical Systemsfor Industrial Use
Performance Materials(+OLED/Raw materials)
Optical Components IJ Components
Materials/Components
New Businesses・
Corporate etc.
New Businesses
Bio-Healthcare
Corporate etc.
Others(WPH, Monitoring, QOL,
Digital manufacturing)

Konica Minolta, Inc.Konica Minolta, Inc. 42
Financial Results: Segments(Quarterly: FY16/1Q~FY17/2Q)
[¥ billions]
FY 2016 FY 2017
Revenue1Q 2Q 3Q 4Q 1Q 2Q 3Q 4Q
Office Business 136.2 132.5 138.5 150.9 133.0 146.5 148.2 156.2
Professional Print Business 47.5 49.6 51.1 55.8 49.0 52.2 53.9 59.2
Healthcare Business 18.5 22.9 22.0 26.6 19.5 23.3 24.0 29.6
Industrial Business 24.9 25.1 24.1 27.5 28.7 31.3 30.1 28.1
Optical Systems for Industrial Use 7.0 5.7 6.1 10.5 11.7 11.5 11.1 8.8
Material and Components 17.9 19.4 18.0 17.0 17.0 19.8 19.0 19.4
New Business / Corporate etc. 2.1 2.6 2.0 2.1 2.1 2.5 6.0 7.8
Company Total 229.1 232.8 237.7 262.9 232.4 255.8 262.2 281.0
Operating Profit1Q 2Q 3Q 4Q 1Q 2Q 3Q 4Q
Office Business 11.4 10.3 9.6 13.1 5.3 14.8 9.8 15.0
Professional Print Business 1.6 2.7 2.5 1.5 1.6 0.9 2.6 4.2
Healthcare Business 0.2 1.0 0.3 1.4 -0.5 3.4 1.0 1.7
Industrial Business 3.4 3.0 10.4 5.3 6.1 5.9 5.6 5.9
New Business / Corporate etc. -7.7 -7.4 -6.8 -5.5 -3.8 -13.2 -10.3 -2.0
Company Total 8.9 9.6 15.9 15.7 8.7 11.8 8.6 24.8

Konica Minolta, Inc.Konica Minolta, Inc. 43
・MCS (Managed Content Service):(Office Business)
The collective term given to services for centrally managing paper or digital documents, e-mails, forms, diagrams, and other such
business content, and for building systems to properly use, store, and dispose of this content.
・OPS (Optimized Print Services):(Office Business)
OPS provides services to boost efficiency and reduce costs through optimization of the customer's print environment.
・GMA (Global Major Account): (Office Business)
Refers to our major enterprise customers (businesses) that operate on a global scale
・IQ-501 (Intelligent Quality Optimizer): (Professional Print Business)
An optional unit that implements constant monitoring/control during printing to automate color management and front/back
register control. This drastically cuts down on control times and increases production time.
・MGI (MGI Digital Graphic Technology): (Professional Print Business)
MGI is an output device manufacturer based in France. Konica Minolta formed a financial and strategic alliance with MGI in 2014, and
MGI became a consolidated subsidiary in 2016. MGI provides unique products requiring special techniques such as decorative
printing that are tailored to customer needs, and operates its global business in North America and Asia with a particular focus on
Europe.
・Precision Medicine: (New Business)
With this approach, advanced technology is used to perform genetic analyses of cells to match individual patients with the most
appropriate treatments and optimal drug dosages for their specific disease.
・DM (Digital Manufacturing):(New Business)
New manufacturing solutions based on ICT and the IoT that are not dependent on people, places, countries, or
fluctuations.
・Workplace Hub (WPH): (New Business)
This is a platform that will become the base for the IoT business that Konica Minolta plans to focus on. In addition to MFP functions,
a server is integrated to create a solution that drives efficiencies by reducing the overall costs of IT infrastructure management,
providing real-time data-driven visibility of IT usage patterns that help to improve business processes. This will link people and data,
and empower them to make smarter decisions and solve problems in the office.
Glossary

Cautionary Statement:
The forecasts mentioned in this material are the results of estimations based on currently
available information, and accordingly, contain risks and uncertainties. The actual results of
business performance may sometimes differ from those forecasts due to various factors.
Remarks:
Yen amounts are rounded to the nearest 100 million.