KONE H1 2019...H1/2019 3 Henrik Ehrnrooth, President and CEO: “In the second quarter, we had a...
34
Half-year Financial Report KONE H1 2019
Transcript of KONE H1 2019...H1/2019 3 Henrik Ehrnrooth, President and CEO: “In the second quarter, we had a...

Half-year Financial Report
KONE H1 2019

H1/20192
KONE’s January–June 2019 review: Continued strong orders received, well on track to meet full-year targets April–June 2019 Orders received grew by 9.0% to EUR 2,310 (4–6/2018: 2,119) million. At comparable exchange rates, orders
grew by 8.1%. Sales grew by 9.0% to EUR 2,541 (2,331) million. At comparable exchange rates, sales grew by 7.9%. Operating income (EBIT) was EUR 306.5 (280.5) million or 12.1% (12.0%) of sales. The adjusted EBIT was EUR
319.6 (300.4) million or 12.6% (12.9%) of sales.* IFRS 16 had a positive impact of EUR 2 million to the operating income.
Cash flow from operations (before financing items and taxes) was EUR 323.5 (366.2) million. IFRS 16 had a positive impact of EUR 29 million to the cash flow from operations.
January–June 2019 Orders received grew by 9.4% to EUR 4,404 (1–6/2018: 4,027) million. At comparable exchange rates, orders
grew by 8.0%. Sales grew by 9.2% to EUR 4,740 (4,339) million. At comparable exchange rates, sales grew by 7.7%. Operating income (EBIT) was EUR 521.8 (492.0) million or 11.0% (11.3%) of sales. The adjusted EBIT was EUR
548.0 (518.7) million or 11.6% (12.0%) of sales.* IFRS 16 had a positive impact of EUR 4 million to the operating income.
Cash flow from operations (before financing items and taxes) was EUR 701.1 (545.2) million. IFRS 16 had a positive impact of EUR 58 million to the cash flow from operations.
KONE has adopted the new IFRS 16 and IFRIC 23 effective January 1, 2019 using the modified retrospective approach and the comparative figures have not been restated. More information of the adoption of IFRS 16 and IFRIC 23 is presented on page 30.
Business outlook (specified)
In 2019, KONE’s sales is estimated to grow by 4–7% at comparable exchange rates as compared to 2018. The adjusted EBIT is expected to be in the range of EUR 1,170–1,250 million, assuming that foreign exchange rates would remain at the July 2019 level. Foreign exchange rates are estimated to impact EBIT positively by around EUR 20 million.
KONE previously estimated its sales to grow by 3–7% at comparable exchange rates as compared to 2018. The adjusted EBIT was expected to be in the range of EUR 1,160–1,260 million, assuming that foreign exchange rates would have remained at the April 2019 level. Foreign exchange rates were estimated to impact EBIT positively by around EUR 30 million.
KEY FIGURES 4–6/2019 4–6/2018 Change 1–6/2019 1–6/2018 Change 1–12/2018Orders received MEUR 2,310.1 2,118.6 9.0% 4,404.1 4,027.2 9.4% 7,797.0Order book MEUR 8,407.1 7,915.3 6.2% 8,407.1 7,915.3 6.2% 7,950.7Sales MEUR 2,540.8 2,330.6 9.0% 4,739.6 4,338.6 9.2% 9,070.7Operating income (EBIT) MEUR 306.5 280.5 9.3% 521.8 492.0 6.1% 1,042.4Operating income margin (EBIT margin) % 12.1 12.0 11.0 11.3 11.5Adjusted EBIT* MEUR 319.6 300.4 6.4% 548.0 518.7 5.6% 1,112.1Adjusted EBIT margin* % 12.6 12.9 11.6 12.0 12.3Income before tax MEUR 310.2 290.5 6.8% 530.6 514.1 3.2% 1,087.2Net income MEUR 238.8 223.7 6.8% 408.6 395.9 3.2% 845.2Basic earnings per share EUR 0.46 0.43 5.8% 0.78 0.77 2.3% 1.63Cash flow from operations (before financing items and taxes) MEUR 323.5 366.2 701.1 545.2 1,150.1Interest-bearing net debt MEUR -973.3 -1,254.8 -973.3 -1,254.8 -1,704.0Equity ratio % 42.2 45.5 42.2 45.5 49.9Return on equity % 28.6 28.0 28.6 28.0 27.7Net working capital (including financing items and taxes) MEUR -805.4 -725.7 -805.4 -725.7 -757.8Gearing % -36.6 -47.7 -36.6 -47.7 -55.3
* In September 2017, KONE introduced a new alternative performance measure, adjusted EBIT, to enhance comparability of the business performance between reporting periods during the Accelerate program. Restructuring costs related to the Accelerate program are excluded from the calculation of the adjusted EBIT.

3H1/2019
Henrik Ehrnrooth, President and CEO:
“In the second quarter, we had a good performance on many fronts. I’m especially pleased that our orders received continued to grow at a very good rate and that the margin of orders is now improving. Sales growth was balanced with all businesses and regions contributing to the positive development. We have returned to a solid growth path in adjusted EBIT this year and the actions we have taken to improve our margins are starting to produce results. While our adjusted EBIT margin was still slightly below that of last year, we are going in the right direction. Overall, our results were in line with our expectations and consistent with our full-year targets.
The solid growth in orders received, combined with the improving margin of orders received, is a demonstration of our overall competitiveness. We have continued to make good progress in driving improved differentiation with our solutions and services. In addition to our strong offering, one of our competitive edges continues to be consistent project execution as well as the service mindset of our people. We have continued to build on these capabilities with the objective to be the preferred partner for our customers. This year, we have focused among other things on further improving the quality of our field operations. We have developed our installation resource and project management, processes and tools to ensure that we can consistently do what we promise for our customers with improved quality and productivity. We have also continued to strengthen our network of training facilities, so that our employees have the necessary competences to deliver increasingly complex projects. I want to thank all KONE employees, for their hard work and accountability in strengthening these competitive advantages.
We have now half a year behind us with strong development in both orders received and sales. As a result, we can specify our full year guidance. We expect sales to grow by 4–7% at comparable exchange rates and the adjusted EBIT to be in the range of EUR 1,170–1,250 million in 2019. Our industry has faced several headwinds over past years. I’m pleased that the actions that we have taken and our strategic direction have strengthened us in this environment, and our result is again improving.”

H1/20194
Key Figures
Sales (MEUR)
Orders received (MEUR) In April–June 2019, orders received grew by 9.0% (at compa-rable exchange rates, orders received grew by 8.1%).
At comparable rates, new equipment orders received grew clearly with clear growth in the volume business and stable development in major projects. In modernization, orders received grew significantly with slight growth in the volume business and significant growth in major projects.
The margin of orders received improved slightly.
– – –
In January–June 2019, orders received grew by 9.4% (at com-parable exchange rates, orders received grew by 8.0%).
In April–June 2019, sales grew by 9.0% (7.9% at comparable exchange rates).
New equipment sales grew by 9.0% (8.1% at comparable exchange rates). Service (maintenance and modernization) sales grew by 9.1% (7.6% at comparable rates), with mainte-nance sales growing by 6.2% (5.0% at comparable rates) and modernization sales growing by 15.7% (13.7% at comparable rates).
Sales in the EMEA region grew by 6.8% (6.8% at compara-ble rates). In the Americas region, sales grew by 12.2% (6.6% at comparable rates). In the Asia-Pacific region, sales grew by 9.7% (9.6% at comparable rates).
– – –
In January–June 2019, sales grew by 9.2% (7.7% at compara-ble exchange rates).
10,000
8,000
6,000
4,000
2,000
0
10,000
8,000
6,000
4,000
2,000
0
Sales by businessSales by region
EMEA 41% (43%) Americas 20% (20%) Asia-Pacific 39% (37%)
1–6/2019 (1–6/2018)
New equipment 53% (52%) Maintenance 33% (34%) Modernization 15% (14%)
1–6/2019 (1–6/2018)
8,797
7,554 7,797
9,071
2,3312,337
2,1192,056
4,404
2,310
4,740
2,541
1–6/201920182017
1–6/201920182017
Q2 Q2
Q2Q2 Q2
Q2

5H1/2019
2) Cash flow from operations before financing items and taxes
1) Including financing items and taxes
Net working capital1 (MEUR)
Adjusted EBIT (MEUR)
Cash flow2 (MEUR)
In April–June 2019, operating income was 12.1% of sales (4–6/2018: 12.0%). The adjusted EBIT margin was 12.6% (12.9%).
Translation exchange rates had a positive impact of EUR 3 mil-lion on the operating income.
Restructuring costs related to the Accelerate program were EUR 13.1 million and are excluded from the calculation of the adjusted EBIT.
The adoption of IFRS 16 had a positive impact of EUR 2 million on the operating income.
– – –
In January–June 2019, operating income was 11.0% of sales (1–6/2018: 11.3%). The adjusted EBIT margin was 11.6% (12.0%).
At the end of June 2019, net working capital was at an improved level compared to the beginning of the year and to the end of June 2018.
The improvement was driven by strong development in advances received and progress payments from customers.
In April–June 2019, cash flow declined from a strong compari-son period.
The adoption of IFRS 16 had a positive impact of EUR 29 mil-lion on the cash flow from operations before financing items and taxes.
– – –
In January–June 2019, cash flow was strong at EUR 701.1 mil-lion.
IFRS 16 had a positive impact of EUR 58 million to the cash flow from operations.
1,500
1,250
1,000
750
500
250
0
0
-200
-400
-600
-800
-1,000
1,500
1,250
1,000
750
500
250
0
1,206
1,2631,150
1,112
1–6/201920182017
6/201912/20186/2018
1–6/201920182017
323
366320
Q2Q2Q2
Q2
Q2
-805-758
300336 320
548
701
-726
Q2

H1/20196
KONE’s January–June 2019 review
KONE’s operating environment
Operating environment by region
New equipment market in units
Maintenance market in units Modernization market
4–6/2019 1–6/2019 4–6/2019 1–6/2019 4–6/2019 1–6/2019
Total market + + + + + +
EMEA Stable Stable + + + +Central and North Europe + + + + + +South Europe – Stable + + + +Middle East – – + + ++ +
North America Stable Stable + + + +
Asia-Pacific + + ++ ++ +++ +++China + + ++ ++ +++ +++
– – – Significant decline (>10%), – – Clear decline (5–10%), – Slight decline (<5%), Stable, + Slight growth (<5%), ++ Clear growth (5–10%), +++ Significant growth (>10%)

7H1/2019
January–June 2019The global new equipment market grew slightly in units compared to the first half of 2018. In Asia-Pacific, the new equipment market grew slightly. In China, infra-structure segment developed positively while residential segment was rather stable and non-residential segment declined. Government continued to balance between supporting the economic activity and curbing specula-tion in the residential market. Overall, the Chinese new equipment market grew slightly in units. In the rest of Asia-Pacific, the new equipment markets were stable with growth in some Southeast Asian countries and in India and a decline in Australia. In the EMEA region, the new equipment market was stable. The new equipment market in Central and North Europe grew slightly from a high level. In South Europe, the market was stable. In the Middle East, the market continued to decline. In North America, the new equipment market was stable on a high level.
Global service markets continued to develop posi-tively. Both the maintenance and the modernization markets saw growth across the regions, with the stron-gest rate of growth seen in Asia-Pacific and a more mod-erate development in Europe and North America.
Pricing trends remained varied during January–June. In China, competition remained intense but pricing was rather stable in the new equipment market. In the EMEA region, the pricing environment was mixed. The Middle East region continued to be characterized by intense competition, while there were some signs of improving pricing environment in Europe. In North America, com-petition intensified somewhat.
April–June 2019The global new equipment market grew slightly in units compared to the second quarter of 2018. In Asia-Pacific, the new equipment market grew slightly. In China, infrastructure segment developed positively while residential segment was rather stable and non-residential segment declined. Government continued to balance between supporting the economic activity and curbing speculation in the residential market. Over-all, the Chinese new equipment market grew slightly in units. In the rest of Asia-Pacific, the new equipment markets were stable with growth in some Southeast Asian countries and in India and a decline in Austra-lia. In the EMEA region, the new equipment market was stable. The new equipment market in Central and North Europe grew slightly from a high level. In South Europe, the market declined slightly with varying development among the countries. In the Middle East, the market declined driven by Turkey, in particular. In North America, the new equipment market was stable on a high level.
Global service markets continued to develop positively. Both the maintenance and the moderniza-tion markets saw growth across the regions, with the strongest rate of growth seen in Asia-Pacific and a more moderate development in Europe and North America.
Pricing trends remained varied during April–June. In China, competition remained intense but pricing was rather stable in the new equipment market. In the EMEA region, the pricing environment was mixed. The Middle East region continued to be characterized by intense competition, while there were some signs of improving pricing environment in Europe. In North America, competition intensified somewhat.

H1/20198
Orders received and order book
Orders received
MEUR 4–6/2019 4–6/2018 ChangeComparable
change1) 1–6/2019 1–6/2018 ChangeComparable
change1) 1–12/2018
Orders received 2,310.1 2,118.6 9.0% 8.1% 4,404.1 4,027.2 9.4% 8.0% 7,797.0
1) Change at comparable foreign exchange rates
Orders received consist predominantly of new equipment and modernization orders. Maintenance contracts are not included in orders received, but the figure includes orders related to the maintenance business, such as repairs.
April–June 2019Orders received grew by 9.0% as compared to April–June 2018 and totaled EUR 2,310 million. At comparable exchange rates, KONE’s orders received grew by 8.1%.
At comparable rates, new equipment orders received grew clearly with clear growth in the volume business and stable development in major projects. In modernization, orders received grew significantly with slight growth in the volume business and significant growth in major projects.
The relative margin of orders received improved slightly compared to the comparison period. We have successfully taken focused pricing actions and continued to make progress in improving productivity to compensate for the cost pres-sures.
Orders received in the EMEA region were stable at com-parable exchange rates as compared to April–June 2018. Both new equipment and modernization orders were stable.
In the Americas region, orders received grew clearly at comparable rates as compared to April–June 2018. New equipment orders declined clearly while modernization orders grew significantly.
Orders received in the Asia-Pacific region grew signifi-cantly at comparable rates as compared to April–June 2018. In China, new equipment orders grew significantly in units and in monetary value. Like-for-like prices were slightly higher than in the comparison period and mix contributed positively. In the rest of Asia-Pacific, new equipment orders received were stable. Modernization orders continued to grow significantly in China, but declined significantly in the rest of Asia-Pacific in the quarter.
January–June 2019Orders received grew by 9.4% as compared to Janu-ary–June 2018 and totaled EUR 4,404 million. At com-parable exchange rates, KONE’s orders received grew by 8.0%.
At comparable rates, new equipment orders received grew clearly with clear growth both in the volume busi-ness and in major projects. In modernization, orders received grew clearly with clear growth in the volume business and significant growth in major projects.
The relative margin of orders received improved slightly compared to the comparison period. We have successfully taken focused pricing actions and contin-ued to make progress in improving productivity to com-pensate for the cost pressures.
Orders received in the EMEA region grew clearly at comparable exchange rates as compared to Janu-ary–June 2018. New equipment orders grew clearly and modernization orders grew slightly.
In the Americas region, orders received grew slightly at comparable rates as compared to January–June 2018. New equipment orders declined clearly, while modernization orders grew significantly.
Orders received in the Asia-Pacific region grew significantly at comparable rates as compared to Janu-ary–June 2018. In China, new equipment orders grew clearly in units and significantly in monetary value. Like-for-like prices were slightly higher than in the compari-son period and mix contributed also positively. In the rest of Asia-Pacific, new equipment orders received were stable. Modernization orders continued to grow signifi-cantly in China, but declined significantly in the rest of Asia-Pacific in the quarter.
Terminology: Slight <5%, clear 5–10%, significant >10%
9H1/2019
Order book
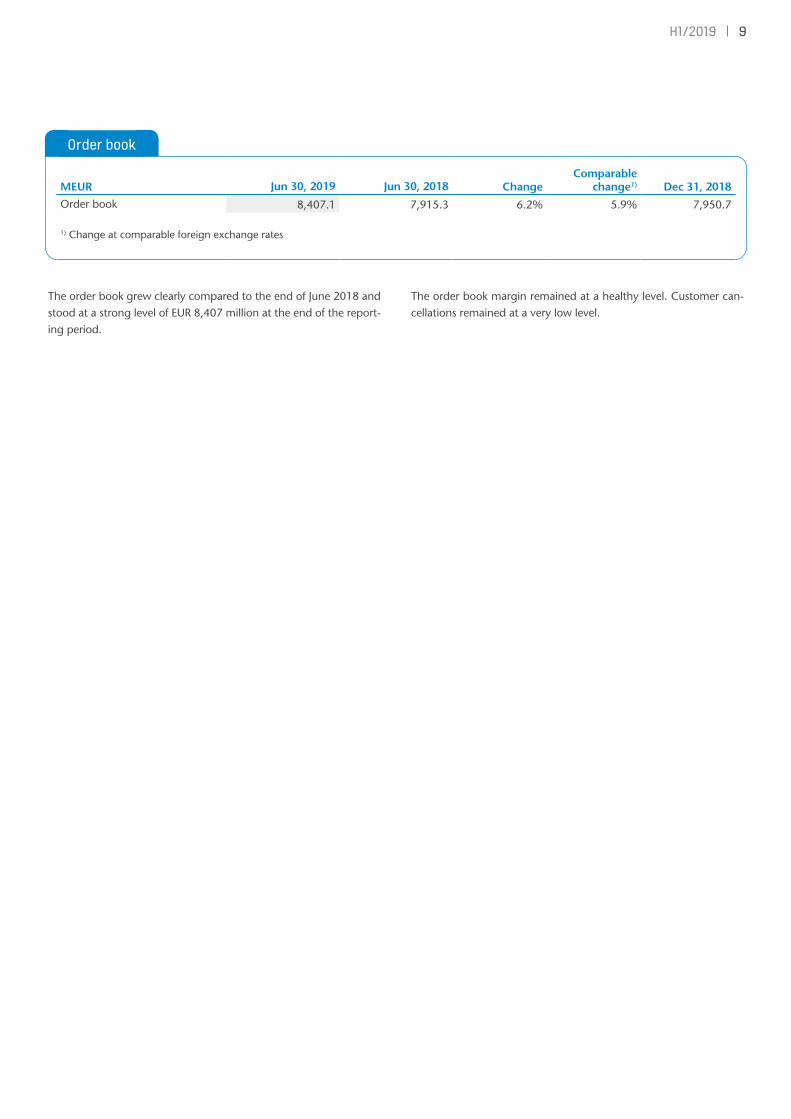
MEUR Jun 30, 2019 Jun 30, 2018 ChangeComparable
change1) Dec 31, 2018
Order book 8,407.1 7,915.3 6.2% 5.9% 7,950.7
1) Change at comparable foreign exchange rates
The order book grew clearly compared to the end of June 2018 and stood at a strong level of EUR 8,407 million at the end of the report-ing period.
The order book margin remained at a healthy level. Customer can-cellations remained at a very low level.

H1/201910
Sales
By region
MEUR 4–6/2019 4–6/2018 ChangeComparable
change1) 1–6/2019 1–6/2018 ChangeComparable
change1) 1–12/2018EMEA 1,008.9 944.5 6.8% 6.8% 1,938.9 1,858.9 4.3% 4.3% 3,791.5Americas 502.0 447.4 12.2% 6.6% 970.7 867.8 11.9% 5.6% 1,804.6Asia-Pacific 1,029.9 938.7 9.7% 9.6% 1,829.9 1,611.8 13.5% 12.9% 3,474.6Total 2,540.8 2,330.6 9.0% 7.9% 4,739.6 4,338.6 9.2% 7.7% 9,070.7
1) Change at comparable foreign exchange rates
By business
MEUR 4–6/2019 4–6/2018 ChangeComparable
change1) 1–6/2019 1–6/2018 ChangeComparable
change1) 1–12/2018New equipment 1,387.3 1,272.9 9.0% 8.1% 2,493.4 2,270.6 9.8% 8.5% 4,796.9Services 1,153.5 1,057.7 9.1% 7.6% 2,246.2 2,068.0 8.6% 6.9% 4,273.9
Maintenance 786.3 740.1 6.2% 5.0% 1,554.7 1,457.8 6.7% 5.2% 2,968.7Modernization 367.2 317.5 15.7% 13.7% 691.5 610.2 13.3% 11.1% 1,305.1
Total 2,540.8 2,330.6 9.0% 7.9% 4,739.6 4,338.6 9.2% 7.7% 9,070.7
1) Change at comparable foreign exchange rates
April–June 2019KONE’s sales grew by 9.0% as compared to April–June 2018, and totaled EUR 2,541 million. At comparable exchange rates, KONE’s sales grew by 7.9%.
Sales in the EMEA region grew by 6.8% and totaled EUR 1,009 million. At comparable exchange rates, the growth was 6.8%. New equipment sales grew clearly, maintenance sales grew slightly and modernization sales grew significantly in the region.
In the Americas, sales grew by 12.2% and totaled EUR 502.0 million. At comparable exchange rates, sales grew by 6.6%. New equipment sales grew clearly, maintenance sales grew slightly and modernization sales grew signifi-cantly in the region.
In Asia-Pacific, sales grew by 9.7% and totaled EUR 1,030 million. At comparable exchange rates, sales grew by 9.6%. New equipment sales grew clearly and maintenance and modernization sales grew significantly in the region.
January–June 2019KONE’s sales grew by 9.2% as compared to January–June 2018, and totaled EUR 4,740 million. At compa-rable exchange rates, KONE’s sales grew by 7.7%.
Sales in the EMEA region grew by 4.3% and totaled EUR 1,939 million. At comparable exchange rates, the growth was 4.3%. New equipment sales were stable, maintenance sales grew slightly and mod-ernization sales grew significantly in the region.
In the Americas, sales grew by 11.9% and totaled EUR 970.7 million. At comparable exchange rates, sales grew by 5.6%. New equipment and modernization sales grew clearly and maintenance sales grew slightly in the region.
In Asia-Pacific, sales grew by 13.5% and totaled EUR 1,830 million. At comparable exchange rates, sales grew by 12.9%. New equipment, maintenance and modernization sales grew significantly in the region.

11H1/2019
Financial result
Financial result
MEUR 4–6/2019 4–6/2018 Change 1–6/2019 1–6/2018 Change 1–12/2018Operating income, MEUR 306.5 280.5 9.3% 521.8 492.0 6.1% 1,042.4
Operating income margin, % 12.1 12.0 11.0 11.3 11.5
Adjusted EBIT, MEUR 319.6 300.4 6.4% 548.0 518.7 5.6% 1,112.1
Adjusted EBIT margin, % 12.6 12.9 11.6 12.0 12.3Income before taxes, MEUR 310.2 290.5 6.8% 530.6 514.1 3.2% 1,087.2Net income, MEUR 238.8 223.7 6.8% 408.6 395.9 3.2% 845.2
Basic earnings per share, EUR 0.46 0.43 5.8% 0.78 0.77 2.3% 1.63
The adoption of IFRS 16 had a positive impact of EUR 2 million on the operating income in April–June. In January–June, the impact was
EUR 4 million.
April–June 2019KONE’s operating income (EBIT) grew to EUR 306.5 million or 12.1% of sales. The adjusted EBIT, which excludes restructuring costs related to the Accelerate program, was EUR 319.6 million or 12.6% of sales.
Adjusted EBIT margin was close to the level of the comparison period. Focused pricing and productivity actions were continued to improve the EBIT margin.
Translation exchange rates had a positive impact of EUR 3 million on the operating income, and the restructuring costs related to the Accelerate program were EUR 13.1 million. Adoption of IFRS 16 had a positive impact of EUR 2 million on the operating income. Corre-spondingly, financing expenses increased by EUR 3 million.
Basic earnings per share was EUR 0.46.
January–June 2019KONE’s operating income (EBIT) grew to EUR 521.8 million or 11.0% of sales. The adjusted EBIT, which excludes restructuring costs related to the Accelerate program, was EUR 548.0 mil-lion or 11.6% of sales.
Adjusted EBIT margin was slightly below the level of the comparison period due to some of the cost headwinds being more pronounced in the early part of the year. Focused pricing and productivity actions were continued to improve the EBIT margin.
Translation exchange rates had a positive impact of EUR 8 million on the operating income, and the restructuring costs related to the Acceler-ate program were EUR 26.2 million. Adoption of IFRS 16 had a positive impact of EUR 4 million on the operating income. Correspondingly, financ-ing expenses increased by EUR 6 million.
KONE’s income before taxes was EUR 530.6 million. Taxes totaled EUR 122.0 (118.2) mil-lion, taking into account taxes proportionate to the amount estimated for the financial year. This represents an effective tax rate of 23.0% for the full financial year. Net income for the period grew slightly to EUR 408.6 million.
Basic earnings per share was EUR 0.78.
Terminology: Slight <5%, clear 5–10%, significant >10%

H1/201912
Cash flow and financial position
Cash flow and financial position
4–6/2019 4–6/2018 1–6/2019 1–6/2018 1–12/2018Cash flow from operations (before financing items and taxes), MEUR 323.5 366.2 701.1 545.2 1,150.1Net working capital (including financing items and taxes), MEUR -805.4 -725.7 -757.8
Interest-bearing net debt, MEUR -973.3 -1,254.8 -1,704.0
Gearing, % -36.6 -47.7 -55.3
Equity ratio, % 42.2 45.5 49.9
Equity per share, EUR 5.10 5.07 5.94
The adoption of IFRS16 had a positive impact of EUR 29 million on the cash flow from operations (before financing items and taxes) in
April–June. In January–June, the impact was EUR 58 million. The adoption also increased the opening interest-bearing net debt by EUR
358 million.
KONE’s financial position was very strong at the end of June 2019.
Cash flow from operations (before financing items and taxes) during January–June 2019 was strong at EUR 701.1 mil-lion. Adoption of IFRS 16 had a positive impact of EUR 58 mil-lion on the cash flow from operations before financing items and taxes.
Net working capital (including financing items and taxes) was strong at EUR -805.4 million at the end of June 2019. Net working capital contributed positively to the cash flow driven by strong development in advances received and progress payments from customers.
Interest-bearing net debt was EUR -973.3 million at the end of June 2019. KONE’s cash and cash equivalents together with current deposits and loan receivables were EUR 1,691 (December 31, 2018: 2,043) million at the end of the report-ing period. Interest-bearing liabilities were EUR 743.2 (369.0) million, including a net pension liability of EUR 168.5 (147.0) million and leasing liability of EUR 384.9 (49.3) million. Adop-tion of IFRS 16 increased the opening balance of interest-bear-ing liabilities by EUR 357.6 million. Gearing was -36.6% and equity ratio was 42.2% at the end of June 2019.
Equity per share was EUR 5.10.
Capital expenditure and acquisitions
Capital expenditure & acquisitions
MEUR 4–6/2019 4–6/2018 1–6/2019 1–6/2018 1–12/2018On fixed assets 21.7 21.3 47.8 38.1 92.7On leasing agreements 29.6 5.7 36.6 8.4 19.3On acquisitions 1.9 5.1 10.1 8.4 27.8Total 53.2 32.1 94.4 54.9 139.8
The adoption of IFRS 16 increased capital expenditure on lease agreements by EUR 27 million in April–June. In January–June, the impact
was EUR 32 million.
KONE’s capital expenditure and acquisitions totaled EUR 94.4 million in January–June 2019. Capital expenditure was mainly related to equipment and facilities in R&D, IT, operations and production.
Acquisitions totaled EUR 10.1 million in January–June 2019. KONE completed small acquisitions of maintenance businesses in Europe and in the United States.

13H1/2019
Research and development
R&D expenditure
MEUR 4–6/2019 4–6/2018 Change 1–6/2019 1–6/2018 Change 1–12/2018
R&D expenditure, MEUR 42.1 43.3 -3.0% 81.7 79.7 2.5% 164.0
As percentage of sales, % 1.7 1.9 1.7 1.8 1.8
KONE’s vision is to deliver the Best People Flow® experience by providing ease, effectiveness and experiences to its custom-ers and users. In line with its strategy, Winning with Custom-ers, the objective of KONE’s solution and service development is to drive differentiation further by putting the needs of cus-tomers and users at the center of all development. By closer collaboration with customers and partners, KONE will increase the speed of bringing new services and solutions to the mar-ket.
Research and development expenditure totaled EUR 81.7 million, representing 1.7% of sales in January–June 2019. R&D
expenditures include the development of new product and service concepts as well as further development of existing solutions and services.
During January–June 2019, KONE made updates and enhancements to its existing product offering. In the first quarter, the analytics tools and sensors in KONE 24/7 Con-nected Services were further improved. In the second quarter, KONE made enhancements to KONE MiniSpace™ offering in the residential segment in India improving the eco-efficiency, safety and reliability of the elevators. In China, we widened our coverage in the modernization business.
H1/201914
The main goals of KONE’s personnel strategy are to secure the availability, engagement, motivation and continuous development of the company’s personnel. All KONE’s activi-ties are guided by ethical principles. Employee rights and responsibilities include the right to a safe and healthy working environ-ment, personal well-being, freedom of association, collective bargaining, non-discrimination and the right to a working environment in which harass-ment of any kind is not tolerated. We actively encourage diversity at KONE, and our values guide us in upholding an inclusive culture.
During the first quarter, we ran a salary review in the majority of the KONE countries and made adjust-ments based on performance and market level comparisons. Based on the review, women and men are on a global level compensated equally at KONE. On a local level there are still differences, which we are addressing.
We strive to have the best professionals with the right com-petencies in each position. We facilitate this effort as well as increase the motivation, engagement and continuous devel-opment of the personnel through regular performance discus-sions, which take place at least twice a year. During the first quarter, we concentrated on performance discussions which focused on goal setting for 2019 and achievement reviews from the past year. Goals were set to more than 43,000 employees. During the second quarter, we started our global annual talent review process for all KONE employees to sup-port employees with development and career opportunities. The talent review is used in the mid-year review and individual development discussions to help employees plan the next steps in their career.
KONE’s strategy, Winning with Customers, focuses on put-ting the needs of our customers and users at the center of all
development at KONE. People are key to the strategy’s success, which requires us to develop and obtain new competences in the fields of leadership, digitalization, partnering, under-standing customers’ businesses and project management.
During the first quarter, we launched new training programs in the field of, for example, solution selling and strategic sourcing. We also continued to strengthen our training capabil-ity by opening a new training center in Israel, adding up to a total of 40 KONE training centers globally. Dur-ing the second quarter, we launched a joint HR initiative for developing & retaining our pool of global emerging leaders at KONE. The initiative consists of elements such as on-the-job learn-ing, learning from others & selected training programs. During the second quarter, we also introduced a new
gamified learning solution for KONE 24/7 Connected Services. A key focus area within the KONE people strategy is attract-
ing the best talent. During the first quarter, we started to systematically track the hiring of new competencies and to increase diversity through recruitment. One channel for find-ing new talent is KONE’s annual International Trainee Program (ITP), to which we received more than 2,000 applications. The program offers several trainee positions across the KONE countries.
The Accelerate program continued with a focus on change management. The aim of the program is to create a more cus-tomer-focused way of working on a country, area and global level, across the entire KONE organization. During the first half of the year, functions such as Finance, Customer Solutions Engineering, Customer Service, Logistics and Sourcing contin-ued to establish new ways of working.
Personnel
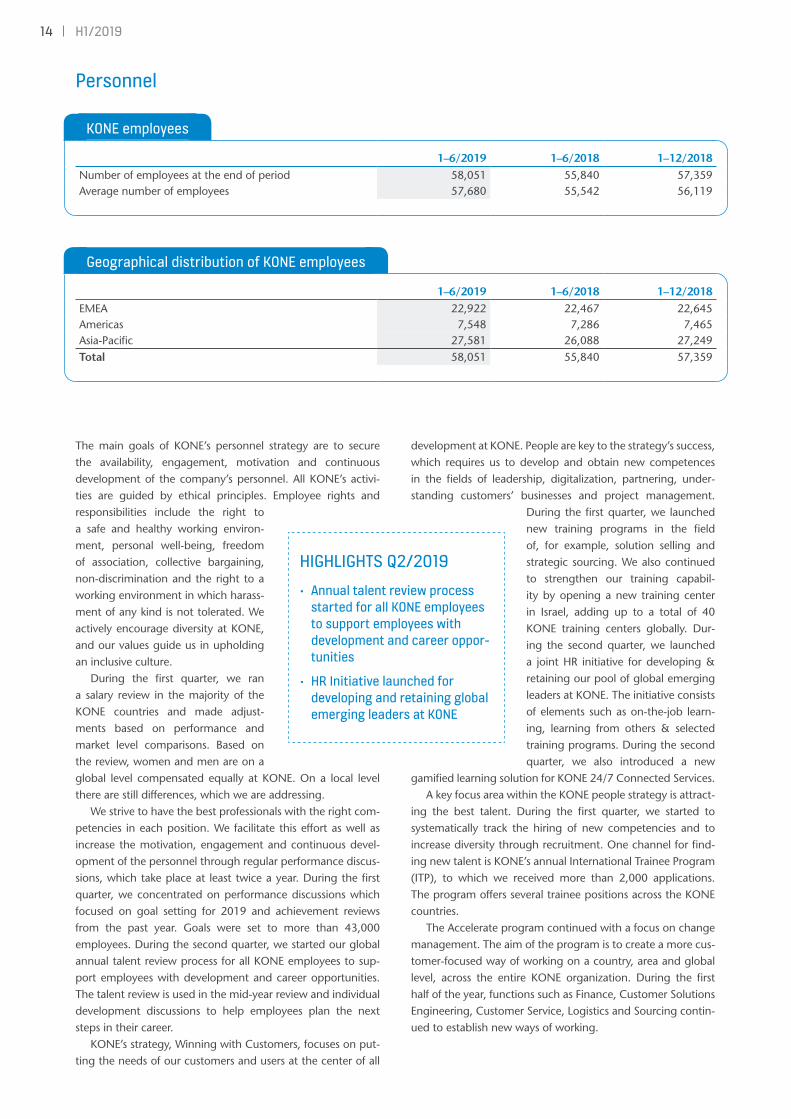
KONE employees
1–6/2019 1–6/2018 1–12/2018Number of employees at the end of period 58,051 55,840 57,359Average number of employees 57,680 55,542 56,119
Geographical distribution of KONE employees
1–6/2019 1–6/2018 1–12/2018EMEA 22,922 22,467 22,645Americas 7,548 7,286 7,465Asia-Pacific 27,581 26,088 27,249Total 58,051 55,840 57,359
HIGHLIGHTS Q2/2019• Annual talent review process
started for all KONE employees to support employees with development and career oppor-tunities
• HR Initiative launched for developing and retaining global emerging leaders at KONE

15H1/2019
Environment KONE’s environmental targets for 2017–2021 are to be the leading provider of low-carbon People Flow® solutions and to have efficient low-carbon operations. Our Environmental Excellence program supports the transformation of the built environment into smart eco-cities, low-carbon communities, and net zero energy buildings. Improving resource efficiency is one of our top priorities.
In January 2019, KONE was ranked as the 43rd most sustainable company in the world by Corporate Knights Inc., a leading sustainable business maga-zine and ranking organization. KONE was second among peer companies in the machinery manufacturing industry category and the only elevator and escalator industry company to make the Global 100 Most Sustainable Cor-porations in the World ranking.
During the first quarter of 2019, we finalized the calcula-tions of our 2018 carbon footprint. KONE’s target is to reduce the carbon footprint relative to sales by 3% annually. In 2018, we exceeded this target as our overall operational carbon foot-print (scope 1, 2 and 3) relative to sales decreased by 4.0% compared to 2017, with sales growth calculated at compa-rable exchange rates. Our scope 1 and 2 greenhouse gas emis-sions relative to sales decreased by 5.5%. KONE’s 2018 abso-lute operational carbon footprint amounted to 318,400 tons of carbon dioxide equivalent (2017: 312,000; figure restated). KONE’s carbon footprint data has been externally assured.
The most significant impacts of KONE’s operational car-bon footprint relate to logistics (51%), vehicle fleet (31%), and electricity and district heat (10%) consumption at KONE’s facilities. As a major achievement in terms of carbon footprint reduction in 2018, our absolute electricity and district heat emissions decreased by 5.6%. In 2018, 33% (2017: 30%) of all electricity in KONE facilities was produced from renewable
sources, our target being over 50% by 2021. Additionally, we have set a long term target of having 0% landfill waste in our manufacturing units by 2030. In 2018, the share of landfill waste in our manufacturing units was down to 0.6% (2017:
0.8%). During the first quarter of 2019,
KONE had important accomplish-ments related to the transparent com-munication about the environmental and health impacts of our materials and supply chain. We published a Health Product Declaration (HPD) for KONE MonoSpace® 500 in addition to the previously published HPD for KONE MonoSpace® 700. KONE also renewed the Singapore Green Build-ing Product (SGBP) certifications for KONE N MonoSpace® and KONE N
MiniSpace™ elevators and KONE TravelMaster™ 110 escala-tor to the highest “Leader” rating in the vertical transporta-tion category. KONE currently has seven solutions which are SGBP certified and thus, recommended for Green Mark certi-fied green buildings. In Sweden, KONE also received approved Byggvarubedömningen (BVB) assessments for KONE Travel-Master™ 110 and KONE TransitMaster™ 140 escalators. BVB is a non-profit organization that evaluates solutions for build-ings and promotes the use of healthy and sustainable building materials.
During the second quarter, KONE was awarded the best A grade in CDP’s 2018 Supplier Engagement Rating, demon-strating leadership and best practice in engaging our suppliers on climate change issues. We also extended the classification coverage of our product range according to the ISO 25745 energy efficiency standard by achieving the best A+++ rating for the KONE TravelMaster™ 120 escalator, in addition to 14 elevators and three escalators or autowalks classified with the best available ratings earlier.
Changes in the Executive BoardIn January–June 2019, KONE announced changes in the Exec-utive Board.
Maciej Kranz (54, MBA, Business Administration), was appointed Chief Technology Officer and Executive Vice Presi-dent, KONE Technology and Innovations, as of July 1, 2019. Maciej Kranz succeeds Tomio Pihkala (43, M.Sc. Mechanical Engineering), who was appointed Executive Vice President,
New Equipment Business as of July 1, 2019. In this role, Tomio Pihkala succeeds Heikki Leppänen, who has served as Execu-tive Vice President, New Equipment Business and member of the Executive Board since 2005. Heikki Leppänen has been employed by KONE since 1982. He has decided to leave his position to focus on non-executive duties.
HIGHLIGHTS Q2/2019• KONE was included in CDP’s
Supplier Engagement Leader-board 2018
• KONE achieved A+++ energy efficiency rating according to ISO 25745 for KONE Travel-Master™ 120 escalator

H1/201916
Other eventsIn 2007, a decision was issued by the European Commission concerning alleged local anticompetitive practices before early 2004 in Germany, Luxembourg, Belgium and the Nether-lands by leading elevator and escalator companies, including KONE’s local subsidiaries. Also, the Austrian Cartel Court issued in 2007 a decision concerning anticompetitive practices that had taken place before mid-2004 in local Austrian markets by leading elevator and escalator companies, including KONE’s local subsidiary. As announced by KONE earlier, a number of civil damage claims by certain companies and public entities,
relating to the two 2007 decisions, are pending in related countries. The claims have been made against various compa-nies concerned by the decisions, including certain KONE com-panies. All claims are independent and are progressing proce-durally at different stages. The total capital amount claimed jointly and severally from all of the defendants together was EUR 166 million at the end of June 2019 (March 31, 2019: EUR 198 million). KONE’s position is that the claims are without merit. No provision has been made.
Most significant risks KONE is exposed to risks that may arise from its operations or changes in the operating environment. The most significant risk factors described below can potentially have an adverse effect on KONE’s business operations and financial position and, as a result, on the value of the company. Other risks, which are currently either unknown or considered immaterial to KONE may, however, become material in the future.
Strategic risks Demand for KONE’s products and services and the competi-tive environment are impacted by the general economic cycles and especially the level of activity within the construction industry. As China accounts for over 25% of KONE’s sales, a sustained market decline in the Chinese construction industry, in particular, could have an adverse effect on KONE’s growth and profitability.
Geopolitical tensions and protectionism continue to expose KONE to various business risks. In addition to the potential adverse impacts on the general economic activity, geopolitical tensions and protectionism could impact the competitiveness of KONE’s supply chain, and lead to increased costs from trade and customs tariffs. A significant portion of KONE’s compo-nent suppliers and global supply capacity is located in China. A no-deal Brexit could also increase costs, create disruptions to KONE’s operations in UK and affect KONE’s UK based suppli-ers’ operations.
In addition to the level of market demand, competitiveness of KONE’s offering is a key driver of the company’s growth and profitability. A failure to anticipate or address changes in cus-tomer requirements and in competitors’ offerings, ecosystems and business models or in the regulatory environment could result in a deterioration of the competitiveness of KONE’s offering.
Operational risks Digitalization is shaping the ways of working and business models also in the elevator and escalator industry. In order to be successful in this transformation, KONE needs new organi-zational capabilities and new competences on the individual employee level. The ability for fast roll out of new services and solutions and new sales capabilities are among other things considered to be critical for success. A failure to develop these
capabilities could have an adverse impact on KONE’s growth and profitability.
The majority of components used in KONE’s supply chain are sourced from external suppliers. In addition to this, KONE uses a significant amount of subcontracted installation resources and has outsourced some business support pro-cesses. These expose KONE to component and skilled labor availability and cost risk. A failure to secure the needed com-ponents or resources or quality issues within these could cause business disruptions and cost increases.
As one of the leading companies in the industry, KONE has a strong brand and reputation. Issues that impact the com-pany’s reputation or brand could have an effect on KONE’s business and financial performance. Such reputational risks could materialize; for example, in the case of an incident, a major delivery issue or a product quality issue. Matters con-cerning product integrity, safety or quality could also have an impact on KONE’s financial performance and affect customer operations.
Hazard, security and incidental risksKONE’s business activities are dependent on the uninterrupted operation, quality and reliability of its manufacturing facilities, sourcing channels, operational service solutions and logistics processes. Physical damage to these operations caused by fire, extreme weather conditions, natural catastrophes or terror-ism, among other things, could cause business interruption for KONE. Both KONE’s and its suppliers’ operations also utilize extensively information technology and KONE’s business is dependent on the quality, integrity and availability of informa-tion. Thus, KONE is exposed to cyber security risks, as opera-tional information systems and products may be vulnerable to interruption, loss or manipulation of data, or malfunctions which can result in disruptions in processes and equipment availability. Any breach of sensitive employee or customer data may also result in significant penalties as well as reputational damage. Such cyber incidents could be caused by, including but not limited to, cybercrime, cyber-attacks, computer mal-ware, information theft, fraud, misappropriation, or inadver-tent actions from our employees and vendors.

17H1/2019
Risk management
Risk Mitigation actionsWeakening of the economic environment, particularly in China
KONE strives to continuously develop its competitiveness in all regions and businesses. KONE has a wide geographic presence and a balanced business portfolio with a high share of maintenance business.
Geopolitical tensions impacting the competitiveness of KONE’s supply chain, leading to increased costs or causing potential disruptions
KONE actively monitors the development of the applicable and relevant regulations, policies and trade rules, and evaluates the competitiveness and viability of KONE’s supply chain and sourcing channels.
Changes in customer requirements or competitors’ offerings impacting the competitiveness of KONE’s offering
KONE aims to be the industry leader by investing in research and develop-ment and by taking an open innovation approach. KONE also closely follows emerging industry and market trends.
A failure to develop the capabilities needed for the digital transformation
KONE continuously evaluates the skills and competences required for the execution of the selected strategy and develops and/or acquires these from internal talent pools or externally. KONE also has extensive training programs in place to develop critical talents.
Risks related to component and subcontracted labor availability
KONE’s sourcing processes aim to identify critical suppliers and supply cate-gories and implement dual sourcing, multi-year agreements, last-buy options and other measures to ensure the availability of the supply. KONE has also developed multinational subcontractor pools to ensure subcontractor capa-city on a regional level. Subcontractors competences and capabilities are monitored and developed continuously, similarly as with own employees.
Product integrity, safety or quality issues as well as issues with reputation
To mitigate product risks, KONE has processes in place for product design, supply, manufacturing, installation and maintenance, involving strict quality control. In addition, KONE aims for transparent and reliable communication, to prevent reputational risks and to manage potential incidents. KONE also has stringent corporate governance principles in place.
Interruptions to KONE’s or its suppliers operations
KONE actively develops business continuity management capabilities to reduce the impact and likelihood of disruptions within its supply chain. Furt-hermore, KONE monitors the operations, business continuity management capabilities, financial strength and cybersecurity of its key suppliers. In addi-tion, KONE aims to secure the availability of alternative sourcing channels for critical components and services. KONE also has a global property damage and business interruption insurance program in place.
Quality and reliability of IT systems and cybersecurity risks
KONE’s security policies define controls to safeguard information and infor-mation systems which are both in development and in operation, in order to detect cybersecurity incidents and to respond and recover in a timely manner. KONE works with third-party security service providers and trusted, well-known technology partners to manage the risks through the control framework. KONE conducts tests, reviews and exercises to identify areas of risk and to ensure the appropriate preparedness. The company continues to invest in its cybersecurity capabilities based on these findings.
Financial risks Centralized risk management in accordance with the KONE Treasury Policy. More information in notes 2.4 and 5.3 of KONE’s Financial Statements 2018.
Financial risks The majority of KONE’s sales and result are denominated in currencies other than the Euro, which exposes KONE to risks arising from foreign exchange-rate fluctuations. KONE is also exposed to counterparty risks related to financial institutions, through the significant amounts of liquid funds deposited with financial institutions, in the form of financial investments and
in derivatives. Additionally, KONE is exposed to risks related to the liquidity and payment schedules of its customers, which may impact cash flow or lead to credit losses. Significant changes in local financial or taxation regulation could also have an impact on KONE’s financial performance and cash flow. For further information on financial risks, please refer to notes 2.4 and 5.3 in the Financial Statements for 2018.

H1/201918
Decisions of the Annual General MeetingKONE Corporation’s Annual General Meeting was held in Hel-sinki on February 26, 2019. The meeting approved the finan-cial statements and discharged the responsible parties from liability for the financial period January 1-December 31, 2018.
The number of Members of the Board of Directors was confirmed as eight. Re-elected as Members of the Board were Matti Alahuhta, Anne Brunila, Antti Herlin, Iiris Herlin, Jussi Herlin, Ravi Kant, Juhani Kaskeala and Sirpa Pietikäinen.
At its meeting held after the General Meeting, the Board of Directors elected from among its members Antti Herlin as its Chairman and Jussi Herlin as Vice Chairman.
Jussi Herlin was elected as Chairman and Anne Brunila, Antti Herlin and Ravi Kant as members of the Audit Commit-tee. Anne Brunila and Ravi Kant are independent of both the company and of significant shareholders.
Antti Herlin was elected as Chairman and Matti Alahuhta, Jussi Herlin and Juhani Kaskeala as members of the Nomination and Compensation Committee. Matti Alahuhta and Juhani Kaskeala are independent of both the company and of signifi-cant shareholders.
The General Meeting confirmed an annual compensation of EUR 55,000 for the Chairman of the Board, EUR 45,000 for the Vice Chairman and EUR 40,000 for Board Members. In addition, a compensation of EUR 500 was approved for atten-dance at Board and Committee meetings. For Committee members residing outside of Finland, a compensation of EUR 2,000 for attendance at Committee meetings was approved. Of the annual remuneration, 40 percent will be paid in class B shares of KONE Corporation and the rest in cash.
The General Meeting approved the authorization for the Board of Directors to repurchase KONE’s own shares. Alto-gether no more than 52,440,000 shares may be repurchased, of which no more than 7,620,000 may be class A shares and 44,820,000 class B shares. The authorization shall remain in effect for a period of one year from the date of decision of the General Meeting.
Authorized public accountants PricewaterhouseCoopers Oy and Jouko Malinen were nominated as auditors.
Share-based incentivesKONE has two separate share-based incentive plans. One plan is targeted for the senior management of KONE including the President & CEO, members of the Executive Board and other top management, consisting of approximately 60 individuals. A second plan is targeted for other key personnel of KONE, totaling approximately 450 individuals. The potential reward is based on KPIs as decided by the Board on an annual basis in line with the strategic targets. The potential reward is to be paid as a combination of KONE class B shares and a cash payment equivalent to the taxes and similar charges that are incurred from the receipt of shares.
The share-based incentive plans have a vesting period of two years. If the participant’s employment or service contract is terminated during the vesting period, they are either obliged to return the shares already received or lose the entitlement to the shares they have not yet received. As part of the plan for the senior management, a long-term target for their owner-ship has been set. For the Executive Board members, the long-
term ownership target is that the members have an ownership of KONE shares corresponding to at least five years’ annual base salary. For other selected top management positions the ownership target is at least two years’ base salary.
In December 2014, KONE granted a conditional 2015 option program. The stock options 2015 were listed on the Nasdaq Helsinki Ltd. as of April 1, 2017. The total number of stock options was 1,500,000 and 131,000 of them were held by KONE Corporation’s subsidiary. Each stock option entitled its holder to subscribe for one (1) new class B KONE share at the price of, from February 26, 2019, EUR 28.75 per share. During the reporting period, 1,303,193 new KONE class B shares were subscribed for with 2015 option rights. The share subscription period for the 2015 option rights ended on April 30, 2019. The 131,000 KONE 2015 option rights in possession of KONE Corporation’s subsidiary, and the 6,110 KONE 2015 option rights not exercised during the subscription period have expired upon the expiry of the subscription period.

19H1/2019
Share capital and market capitalization
Share capital and market capitalization*
June 30, 2019 Dec 31, 2018Number of class B shares 453,187,148 451,883,955Number of class A shares 76,208,712 76,208,712Total shares 529,395,860 528,092,667
Share capital, EUR 66,174,483 66,011,583
Market capitalization, MEUR* 26,876 21,489
* Market capitalization is calculated on the basis of both the listed B shares and the unlisted A shares excluding treasury shares. Class A shares are valued at the closing price of the class B shares at the end of the reporting period.
Shares in KONE’s possession
Shares in KONE’s possession
1–6/2019Shares in KONE’s possession at the beginning of the period 12,031,814Changes in own shares during the period -483,441Shares in KONE’s possession at the end of the period 11,548,373
At the end of June 2019, the Group had 11,548,373 class B shares in its possession. The shares in the Group’s possession
represent 2.5% of the total number of class B shares. This cor-responds to 1.0% of the total voting rights.
H1/201920
Shares traded on the Nasdaq Helsinki Ltd.
Trading on the KONE share
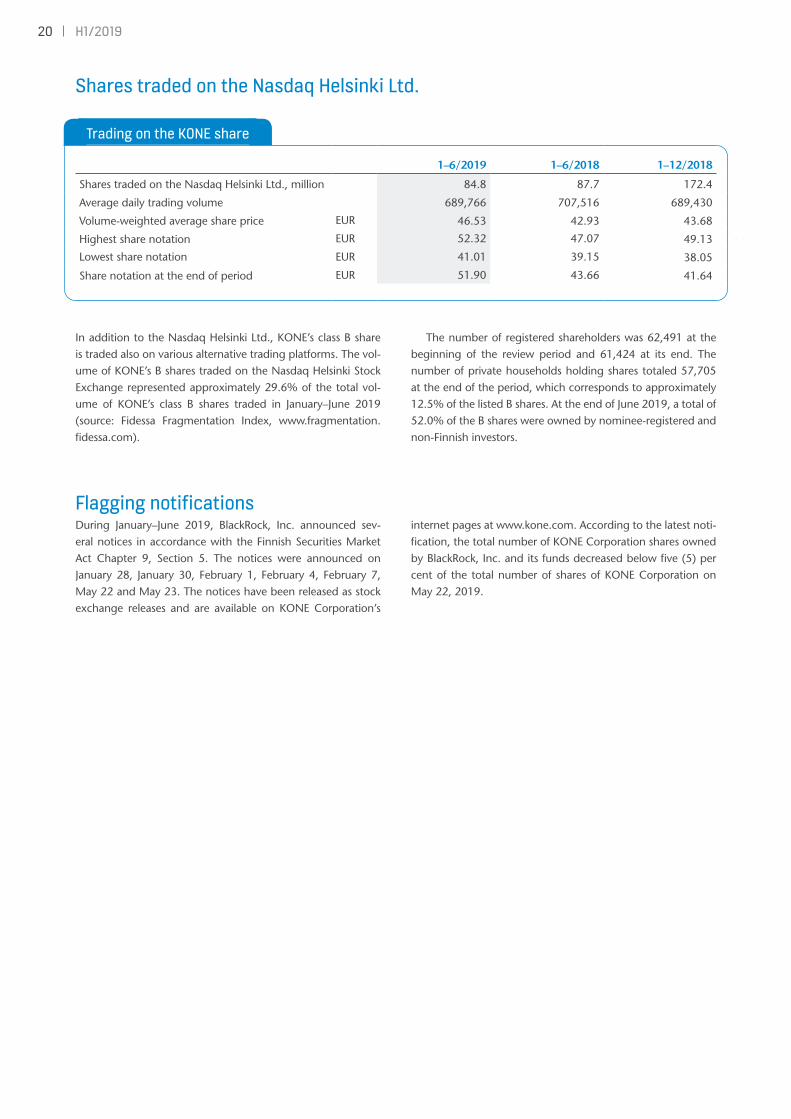
1–6/2019 1–6/2018 1–12/2018
Shares traded on the Nasdaq Helsinki Ltd., million 84.8 87.7 172.4
Average daily trading volume 689,766 707,516 689,430
Volume-weighted average share price EUR 46.53 42.93 43.68
Highest share notation EUR 52.32 47.07 49.13
Lowest share notation EUR 41.01 39.15 38.05
Share notation at the end of period EUR 51.90 43.66 41.64
In addition to the Nasdaq Helsinki Ltd., KONE’s class B share is traded also on various alternative trading platforms. The vol-ume of KONE’s B shares traded on the Nasdaq Helsinki Stock Exchange represented approximately 29.6% of the total vol-ume of KONE’s class B shares traded in January–June 2019 (source: Fidessa Fragmentation Index, www.fragmentation.fidessa.com).
The number of registered shareholders was 62,491 at the beginning of the review period and 61,424 at its end. The number of private households holding shares totaled 57,705 at the end of the period, which corresponds to approximately 12.5% of the listed B shares. At the end of June 2019, a total of 52.0% of the B shares were owned by nominee-registered and non-Finnish investors.
Flagging notificationsDuring January–June 2019, BlackRock, Inc. announced sev-eral notices in accordance with the Finnish Securities Market Act Chapter 9, Section 5. The notices were announced on January 28, January 30, February 1, February 4, February 7, May 22 and May 23. The notices have been released as stock exchange releases and are available on KONE Corporation’s
internet pages at www.kone.com. According to the latest noti-fication, the total number of KONE Corporation shares owned by BlackRock, Inc. and its funds decreased below five (5) per cent of the total number of shares of KONE Corporation on May 22, 2019.

21H1/2019
North AmericaNew equipment Services
Stable
Maintenance
Slight growth
Modernization
Slight growth
EMEANew equipment Services
Stable
Maintenance
Slight growth
Modernization
Slight growth
Asia-PacificNew equipment Services
China
Stable or
slight growth
Outside China
Slight growth
Maintenance
Strong growth
Modernization
Strong growth
Outlook
Market outlook 2019
The outlook is based on KONE’s maintenance base and order book as well as the market outlook. KONE has a solid order book for 2019 in the new equipment business and the service business is expected to continue to grow. Targeted pricing and productivity improvement actions are expected to support profitability together with the savings from the Accel-erate program. High component and labor costs together with trade tariffs are the main headwinds for the adjusted EBIT in 2019. The impact of high raw material prices and trade tariffs is estimated to be less than EUR 50 million.
Previous business outlookKONE previously estimated its sales to grow by 3–7% at compa-rable exchange rates as compared to 2018. The adjusted EBIT was expected to be in the range of EUR 1,160–1,260 million, assuming that foreign exchange rates would have remained at the April 2019 level. Foreign exchange rates were estimated to impact EBIT positively by around EUR 30 million.
Helsinki, July 18, 2019 KONE Corporation’s Board of Directors
Market outlook 2019The new equipment market is expected to be relatively stable or to grow slightly. In China the market is expected to be rela-tively stable or to grow slightly in units ordered, while in the rest of the Asia-Pacific, the market is expected to grow slightly. The new equipment markets in North America and the Europe, Middle East and Africa region are expected to be rather stable.
Maintenance markets are expected to see the strongest growth rate in Asia-Pacific and to grow slightly in other regions.
The modernization market is expected to grow slightly in North America and in the Europe, Middle East and Africa region and to develop strongly in Asia-Pacific.
Business outlook 2019 (specified)In 2019, KONE’s sales is estimated to grow by 4–7% at com-parable exchange rates as compared to 2018. The adjusted EBIT is expected to be in the range of EUR 1,170–1,250 mil-lion, assuming that foreign exchange rates would remain at the July 2019 level. Foreign exchange rates are estimated to impact EBIT positively by around EUR 20 million.
Accounting PrinciplesKONE Corporation’s Half-year Financial Report for January–June 2019 has been prepared in line with IAS 34, ‘Interim Financial Reporting’ and should be read in conjunction with KONE’s financial statements for 2018, published on January 24, 2019. KONE has applied the same accounting principles in the preparation of this Half-year Financial Report as in its Financial Statements for 2018, except for the adoption of new standards and interpretations effective during 2019 that are relevant to its operations. KONE has adopted the new IFRS 16 and IFRIC 23 effective January 1, 2019 using the modified retrospective approach and the comparative figures have not been restated. More information of the adoption of IFRS 16 and IFRIC 23 is presented in page 30. Changes of other standards or interpretations did not have a material impact on the Half-year Financial Report. The information presented in this Half-year Financial Report has not been audited.

H1/201922
MEUR 4–6/2019 % 4–6/2018 % 1–6/2019 % 1–6/2018 % 1–12/2018 %Sales 2,540.8 2,330.6 4,739.6 4,338.6 9,070.7
Costs and expenses -2,174.9 -2,020.6 -4,101.5 -3,788.1 -7,909.4Depreciation and amortization -59.4 -29.5 -116.3 -58.5 -118.9
Operating income 306.5 12.1 280.5 12.0 521.8 11.0 492.0 11.3 1,042.4 11.5Share of associated companies' net income - -1.0 - -1.2 -2.5Financing income 11.6 14.1 21.3 29.4 61.4Financing expenses -7.8 -3.1 -12.6 -6.1 -14.2
Income before taxes 310.2 12.2 290.5 12.5 530.6 11.2 514.1 11.9 1,087.2 12.0Taxes -71.4 -66.8 -122.0 -118.2 -241.9
Net income 238.8 9.4 223.7 9.6 408.6 8.6 395.9 9.1 845.2 9.3
Net income attributable to:Shareholders of the parent company 237.0 223.3 404.4 394.1 840.8Non-controlling interests 1.9 0.3 4.2 1.8 4.4
Total 238.8 223.7 408.6 395.9 845.2
Earnings per share for profit attributable to the shareholders of the parent company, EUR
Basic earnings per share, EUR 0.46 0.43 0.78 0.77 1.63Diluted earnings per share, EUR 0.46 0.43 0.78 0.76 1.63
Consolidated statement of comprehensive income
MEUR 4–6/2019 4–6/2018 1–6/2019 1–6/2018 1–12/2018
Net income 238.8 223.7 408.6 395.9 845.2
Other comprehensive income, net of tax:
Translation differences -49.6 42.7 20.1 21.7 13.8Hedging of foreign subsidiaries 5.9 -14.0 1.1 -4.7 -14.9Cash flow hedges -0.6 -19.1 -2.0 -12.1 -16.3
Items that may be subsequently reclassified to statement of income -44.4 9.6 19.2 4.9 -17.4
Changes in fair value 2.1 -3.1 3.6 0.8 7.1Remeasurements of employee benefits 7.4 13.7 -21.4 12.8 15.7
Items that will not be reclassified to statement of income 9.5 10.6 -17.8 13.6 22.8
Total other comprehensive income, net of tax -34.9 20.2 1.3 18.5 5.4
Total comprehensive income 204.0 243.9 409.9 414.4 850.6
Total comprehensive income attributable to:
Shareholders of the parent company 202.1 243.5 405.8 412.6 846.2Non-controlling interests 1.9 0.3 4.2 1.8 4.4
Total 204.0 243.9 409.9 414.4 850.6
Consolidated statement of income

23H1/2019
Condensed consolidated statement of financial positionAssets MEUR Jun 30, 2019 Jun 30, 2018 Dec 31, 2018
Non-current assets
Goodwill 1,343.5 1,324.1 1,333.4
Other intangible assets 251.2 266.7 260.2
Tangible assets 747.6 378.0 397.4
Loan receivables and other interest-bearing assets I 0.8 1.0 1.0
Investments 151.3 134.7 143.3
Employee benefits I 24.7 9.6 29.0
Deferred tax assets II 262.4 249.6 253.7
Total non-current assets 2,781.4 2,363.5 2,418.2
Current assets
Inventories II 643.3 634.5 624.1
Accounts receivable II 2,126.1 1,953.3 1,988.3
Deferred assets II 669.7 620.3 601.5
Income tax receivables II 90.1 70.3 59.0
Current deposits and loan receivables I 1,116.3 1,094.4 1,407.0
Cash and cash equivalents I 574.8 511.7 636.0
Total current assets 5,220.2 4,884.6 5,315.9
Total assets 8,001.6 7,248.1 7,734.0
Equity and liabilitiesMEUR Jun 30, 2019 Jun 30, 2018 Dec 31, 2018
Equity 2,661.4 2,632.6 3,080.6
Non-current liabilities
Loans I 440.2 197.4 193.8
Employee benefits I 168.5 133.4 147.0
Deferred tax liabilities II 152.1 143.8 148.7
Total non-current liabilities 760.8 474.5 489.5
Provisions II 132.7 134.4 139.4
Current liabilities
Loans I 134.6 31.2 28.3
Advance payments received and deferred revenue II 1,699.4 1,465.1 1,562.2
Accounts payable II 756.4 782.0 786.7
Accruals II 1,745.1 1,660.8 1,574.0
Income tax payables II 111.3 67.6 73.3
Total current liabilities 4,446.7 4,006.7 4,024.5
Total equity and liabilities 8,001.6 7,248.1 7,734.0
Items designated “ I “ comprise interest-bearing net debt.Items designated “ II “ comprise net working capital.

H1/201924
Consolidated statement of changes in equity
MEUR Shar
e ca
pit
al
Shar
e
pre
miu
m
acco
unt
Paid
-up
un
rest
rict
ed
equi
ty r
eser
ve
Fair
val
ue
and
oth
er
rese
rves
Tran
slat
ion
d
iffe
ren
ces
Rem
easu
rem
ents
of
em
plo
yee
ben
efits
Ow
n
shar
es
Ret
ain
ed
earn
ing
s
Net
inco
me
fo
r th
e p
erio
d
Non
-con
trol
ling
in
tere
sts
Tota
l eq
uity
Jan 1, 2019 66.0 100.3 259.1 27.0 64.8 -89.5 -203.3 2,840.0 16.0 3,080.6Restatement impact -28.5 -28.5Jan 1, 2019, restated 66.0 100.3 259.1 27.0 64.8 -89.5 -203.3 2,811.5 16.0 3,052.1
Net income for the period 404.4 4.2 408.6
Other comprehensive income:Translation differences 20.1 20.1Hedging of foreign subsidiaries 1.1 1.1Cash flow hedges -2.0 -2.0Changes in fair value 3.6 3.6Remeasurements of employee benefits -21.4 -21.4
Transactions with shareholders and non-controlling interests:
Profit distribution -851.7 -851.7Increase in equity (option rights) 0.2 37.3 37.5Purchase of own shares -Change in non-controlling interests -0.2 -0.2Option and share-based compensation 13.8 18.3 -18.3 13.8
Jun 30, 2019 66.2 100.3 310.2 28.6 86.0 -110.9 -185.0 1,941.6 404.4 20.0 2,661.4
MEUR Shar
e ca
pit
al
Shar
e
pre
miu
m
acco
unt
Paid
-up
un
rest
rict
ed
equi
ty r
eser
ve
Fair
val
ue
and
oth
er
rese
rves
Tran
slat
ion
d
iffe
ren
ces
Rem
easu
rem
ents
of
em
plo
yee
ben
efits
Ow
n
shar
es
Ret
ain
ed
earn
ing
s
Net
inco
me
fo
r th
e p
erio
d
Non
-con
trol
ling
in
tere
sts
Tota
l eq
uity
Jan 1, 2018 65.9 100.3 205.8 36.2 65.9 -105.2 -217.8 2,862.7 15.0 3,028.9
Net income for the period 394.1 1.8 395.9
Other comprehensive income:Translation differences 21.7 21.7Hedging of foreign subsidiaries -4.7 -4.7Cash flow hedges -12.1 -12.1Changes in fair value 0.8 0.8Remeasurements of employee benefits 12.8 12.8
Transactions with shareholders and non-controlling interests:
Profit distribution -849.2 -849.2Increase in equity (option rights) 0.1 22.1 22.2Purchase of own shares -Change in non-controlling interests -0.5 -0.5Option and share-based compensation 16.6 14.7 -14.5 16.8
Jun 30, 2018 66.0 100.3 244.5 24.9 83.0 -92.4 -203.1 1,999.0 394.1 16.3 2,632.6

25H1/2019
MEUR Shar
e ca
pit
al
Shar
e
pre
miu
m
acco
unt
Paid
-up
un
rest
rict
ed
equi
ty r
eser
ve
Fair
val
ue
and
oth
er
rese
rves
Tran
slat
ion
d
iffe
ren
ces
Rem
easu
rem
ents
of
em
plo
yee
ben
efits
Ow
n
shar
es
Ret
ain
ed
earn
ing
s
Net
inco
me
fo
r th
e p
erio
d
Non
-con
trol
ling
in
tere
sts
Tota
l eq
uity
Jan 1, 2018 65.9 100.3 205.8 36.2 65.9 -105.2 -217.8 2,862.7 15.0 3,028.9
Net income for the period 840.8 4.4 845.2
Other comprehensive income:Translation differences 13.8 13.8Hedging of foreign subsidiaries -14.9 -14.9Cash flow hedges -16.3 -16.3Changes in fair value 7.1 7.1Remeasurements of employee benefits 15.7 15.7
Transactions with shareholders and non-controlling interests:
Profit distribution -849.2 -849.2Increase in equity (option rights) 0.1 22.9 23.1Purchase of own shares -Change in non-controlling interests -3.4 -3.4Option and share-based compensation 30.4 14.5 -14.3 30.6
Dec 31, 2018 66.0 100.3 259.1 27.0 64.8 -89.5 -203.3 1,999.2 840.8 16.0 3,080.6
H1/201926
MEUR 4–6/2019 4–6/2018 1–6/2019 1–6/2018 1–12/2018
Operating income 306.5 280.5 521.8 492.0 1,042.4
Change in working capital
before financing items and taxes -42.4 56.2 62.9 -5.2 -11.2
Depreciation and amortization 59.4 29.5 116.3 58.5 118.9
Cash flow from operations before financing items and taxes 323.5 366.2 701.1 545.2 1,150.1
Cash flow from financing items and taxes -75.2 -60.9 -140.1 -119.8 -180.2
Cash flow from operating activities 248.2 305.3 561.0 425.4 969.8
Cash flow from investing activities -25.8 -26.9 -58.1 -54.1 -121.1
Cash flow after investing activities 222.5 278.4 502.9 371.3 848.7
Purchase of own shares - - - - -
Increase in equity (option rights) 37.5 22.2 37.5 22.2 23.1
Profit distribution -68.8 -63.0 -851.7 -849.2 -849.2
Change in deposits and loans receivable, net -220.1 -212.0 295.9 475.6 155.3
Change in loans payable and
other interest-bearing debt -27.1 -0.3 -52.2 -4.5 -35.3
Changes in non-controlling interests -0.4 -0.5 -0.4 -0.6 -3.1
Cash flow from financing activities -278.9 -253.6 -570.9 -356.4 -709.2
Change in cash and cash equivalents -56.5 24.8 -68.0 14.9 139.5
Cash and cash equivalents at beginning of period 636.3 485.5 636.0 496.5 496.5
Translation difference -5.1 1.5 6.8 0.3 -0.1
Cash and cash equivalents at end of period 574.8 511.7 574.8 511.7 636.0
CHANGE IN INTEREST-BEARING NET DEBT
MEUR 4–6/2019 4–6/2018 1–6/2019 1–6/2018 1–12/2018
Interest-bearing net debt at beginning of period -837.3 -1,001.3 -1,346.4 -1,690.2 -1,690.2
Interest-bearing net debt at end of period -973.3 -1,254.8 -973.3 -1,254.8 -1,704.0
Change in interest-bearing net debt -136.0 -253.5 373.1 435.4 -13.8
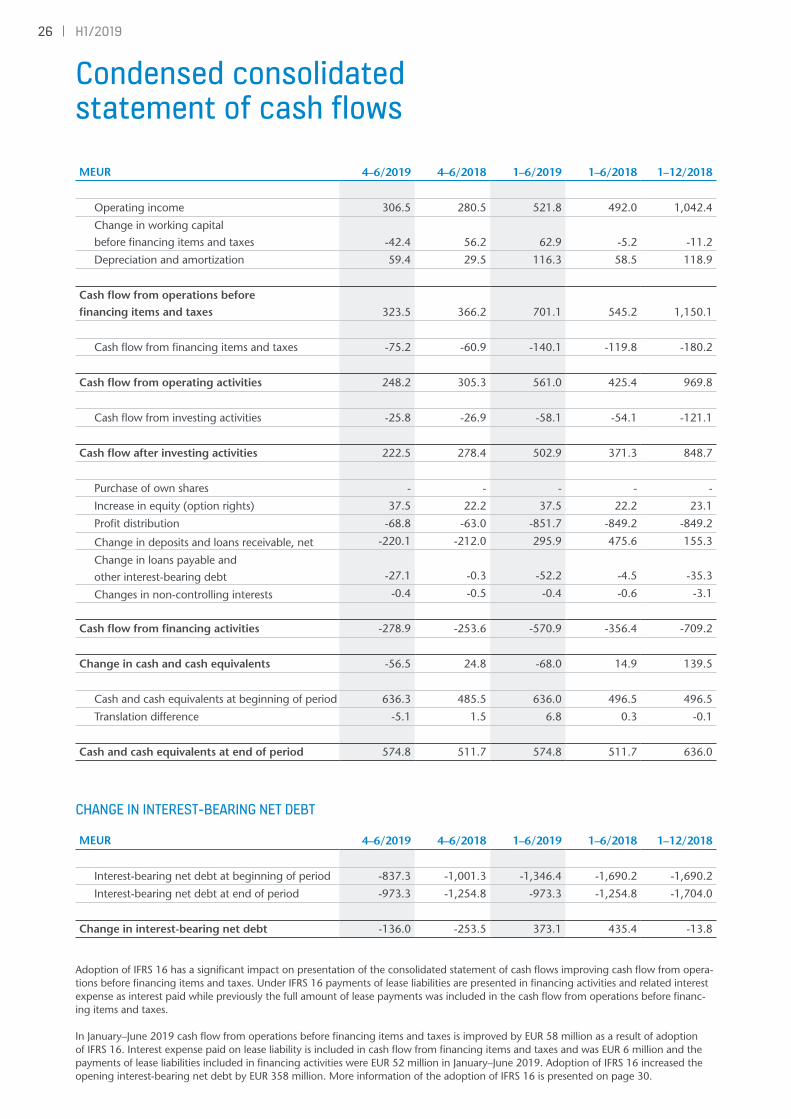
Adoption of IFRS 16 has a significant impact on presentation of the consolidated statement of cash flows improving cash flow from opera-tions before financing items and taxes. Under IFRS 16 payments of lease liabilities are presented in financing activities and related interest expense as interest paid while previously the full amount of lease payments was included in the cash flow from operations before financ-ing items and taxes.
In January–June 2019 cash flow from operations before financing items and taxes is improved by EUR 58 million as a result of adoption of IFRS 16. Interest expense paid on lease liability is included in cash flow from financing items and taxes and was EUR 6 million and the payments of lease liabilities included in financing activities were EUR 52 million in January–June 2019. Adoption of IFRS 16 increased the opening interest-bearing net debt by EUR 358 million. More information of the adoption of IFRS 16 is presented on page 30.
Condensed consolidated statement of cash flows

27H1/2019
KEY FIGURES
1–6/2019 1–6/2018 1–12/2018
Basic earnings per share EUR 0.78 0.77 1.63
Diluted earnings per share EUR 0.78 0.76 1.63
Equity per share EUR 5.10 5.07 5.94
Interest-bearing net debt MEUR -973.3 -1,254.8 -1,704.0
Equity ratio % 42.2 45.5 49.9
Gearing % -36.6 -47.7 -55.3
Return on equity % 28.6 28.0 27.7
Return on capital employed % 23.5 25.1 25.0
Total assets MEUR 8,001.6 7,248.1 7,734.0
Assets employed MEUR 1,688.1 1,377.8 1,376.6
Net working capital (including financing and tax items) MEUR -805.4 -725.7 -757.8
The calculation formulas of key figures are presented in KONE’s Financial Statements for 2018.
Key figures for January–June 2019 are calculated considering the adoption of the new IFRS16 and IFRIC 23 as of January 1, 2019.
ALTERNATIVE PERFORMANCE MEASURE
KONE reports an alternative performance measure, adjusted EBIT, to enhance comparability of the business performance between reporting periods during the Accelerate program. The adjusted EBIT is calculated by excluding significant items impacting compara-bility such as significant restructuring costs arising from redundancy and other costs directly associated to the Accelerate program.
4–6/2019 4–6/2018 1–6/2019 1–6/2018 1–12/2018
Operating income MEUR 306.5 280.5 521.8 492.0 1,042.4
Operating income margin % 12.1 12.0 11.0 11.3 11.5
Items impacting comparability MEUR 13.1 19.9 26.2 26.8 69.6
Adjusted EBIT MEUR 319.6 300.4 548.0 518.7 1,112.1
Adjusted EBIT margin % 12.6 12.9 11.6 12.0 12.3
Net working capital
MEUR June 30, 2019 June 30, 2018 Dec 31, 2018
Net working capital
Inventories 643.3 634.5 624.1
Advance payments received and deferred revenue -1,699.4 -1,465.1 -1,562.2
Accounts receivable 2,126.1 1,953.3 1,988.3
Deferred assets and income tax receivables 759.8 690.6 660.5
Accruals and income tax payables -1,856.3 -1,728.5 -1,647.3
Provisions -132.7 -134.4 -139.4
Accounts payable -756.4 -782.0 -786.7
Net deferred tax assets/liabilities 110.3 105.8 105.0
Total net working capital -805.4 -725.7 -757.8
Notes for the Half-year Financial Report

H1/201928
QUARTERLY FIGURES
KONE has adopted the new IFRS 16 effective January 1, 2019 using the modified retrospective approach and the comparative figures have not been restated. KONE applied IFRS 15 and IFRS 9 standards from January 1, 2018 onwards and 2017 financials are restated retrospecti-vely. Figures for 2012–2016 are not restated and thus not fully comparable.
Q2/2019 Q1/2019 Q4/2018 Q3/2018 Q2/2018 Q1/2018
Orders received MEUR 2,310.1 2,094.1 1,937.9 1,831.9 2,118.6 1,908.7
Order book MEUR 8,407.1 8,454.7 7,950.7 7,791.6 7,915.3 7,786.6
Sales MEUR 2,540.8 2,198.8 2,443.4 2,288.7 2,330.6 2,008.0
Operating income MEUR 306.5 215.4 292.5 258.0 280.5 211.5
Operating income margin % 12.1 9.8 12.0 11.3 12.0 10.5
Adjusted EBIT 1) MEUR 319.6 228.4 319.6 273.7 300.4 218.3
Adjusted EBIT margin 1) % 12.6 10.4 13.1 12.0 12.9 10.9
Items impacting comparability MEUR 13.1 13.1 27.1 15.7 19.9 6.9
Q4/2017 Q3/2017 Q2/2017 Q1/2017 Q4/2016 Q3/2016 Q2/2016 Q1/2016
Orders received MEUR 1,845.8 1,739.0 2,056.2 1,913.0 1,839.2 1,771.7 2,067.8 1,942.3
Order book MEUR 7,357.8 7,473.5 7,749.2 7,960.5 8,591.9 8,699.0 8,763.6 8,529.7
Sales MEUR 2,306.3 2,209.7 2,337.2 1,943.4 2,593.2 2,170.2 2,272.6 1,748.3
Operating income MEUR 292.8 317.9 335.8 245.8 392.2 331.1 348.6 221.4
Operating income margin % 12.7 14.4 14.4 12.6 15.1 15.3 15.3 12.7
Adjusted EBIT 1) MEUR 302.6 321.3 335.8 245.8 392.2 331.1 348.6 221.4
Adjusted EBIT margin 1) % 13.1 14.5 14.4 12.6 15.1 15.3 15.3 12.7
Items impacting comparability MEUR 9.9 3.3
Q4/2015 Q3/2015 Q2/2015 Q1/2015 Q4/2014 Q3/2014 Q2/2014 Q1/2014
Orders received MEUR 1,947.2 1,764.5 2,193.5 2,053.8 1,703.8 1,577.2 1,801.9 1,729.7
Order book MEUR 8,209.5 8,350.7 8,627.4 8,529.6 6,952.5 6,995.8 6,537.2 6,175.4
Sales MEUR 2,561.8 2,184.2 2,210.4 1,690.9 2,165.8 1,877.9 1,848.9 1,441.8
Operating income MEUR 378.5 325.9 325.2 211.9 315.3 277.5 263.2 179.6
Operating income margin % 14.8 14.9 14.7 12.5 14.6 14.8 14.2 12.5
Adjusted EBIT 1) MEUR 378.5 325.9 325.2 211.9 315.3 277.5 263.2 179.6
Adjusted EBIT margin 1) % 14.8 14.9 14.7 12.5 14.6 14.8 14.2 12.5
Items impacting comparability MEUR
Q4/2013 Q3/2013 Q2/2013 Q1/2013 Q4/2012 Q3/2012 Q2/2012 Q1/2012
Orders received MEUR 1,473.2 1,327.2 1,638.2 1,712.4 1,321.3 1,295.6 1,513.4 1,365.9
Order book MEUR 5,587.5 5,642.1 5,874.4 5,823.1 5,050.1 5,283.7 5,305.3 4,842.8
Sales MEUR 2,033.0 1,739.2 1,761.7 1,398.7 1,857.7 1,633.7 1,544.1 1,241.3
Operating income MEUR 292.8 257.5 242.8 160.4 257.4 226.4 173.0 134.6
Operating income margin % 14.4 14.8 13.8 11.5 13.9 13.9 11.2 10.8
Adjusted EBIT 1) MEUR 292.8 257.5 242.8 160.4 257.4 226.4 210.3 134.6
Adjusted EBIT margin 1) % 14.4 14.8 13.8 11.5 13.9 13.9 13.6 10.8
Items impacting comparability MEUR 37.3
1) Operating income excluding items impacting comparability.

29H1/2019
Depreciation and amortization
MEUR 4–6/2019 4–6/2018 1–6/2019 1–6/2018 1–12/2018
Depreciation and amortization of fixed assets 50.5 21.3 98.6 42.3 85.8
Amortization of acquisition-related intangible assets 8.9 8.2 17.7 16.2 33.1
Total 59.4 29.5 116.3 58.5 118.9
The adoption of IFRS 16 increased depreciation and amortization of fixed assets by EUR 28 million in April–June. In January–June, the
impact was EUR 54 million.
Key exchange rates in euros
Jun 30, 2019 Jun 30, 2018Income
statementStatement of
financial positionIncome
statementStatement of
financial position
Chinese Renminbi RMB 7.6891 7.8185 7.7119 7.7170US Dollar USD 1.1334 1.1380 1.2060 1.1658British Pound GBP 0.8761 0.8966 0.8811 0.8861Australian Dollar AUD 1.6015 1.6244 1.5656 1.5787
Derivatives
Fair values of derivative financial instruments Derivative assets
Derivative liabilities
Fair value,net
Fair value,net
Fair value,net
MEURJun 30,
2019Jun 30,
2019Jun 30,
2019Jun 30,
2018Dec 31,
2018
Foreign exchange forward contracts and swaps 31.3 -48.0 -16.7 19.2 -3.6
Electricity price forward contracts - - - 0.2 -
Total 31.3 -48.0 -16.7 19.4 -3.6
Nominal values of derivative financial instrumentsMEUR Jun 30, 2019 Jun 30, 2018 Dec 31, 2018
Foreign exchange forward contracts and swaps 3,203.2 3,214.4 2,769.0
Electricity price forward contracts - 0.5 -
Total 3,203.2 3,214.9 2,769.0
The fair values of foreign exchange forward contracts and swaps are measured based on price information derived from active markets and commonly used valuation methods (fair value hierarchy level 2). For electricity price forward contracts, there exists a stock exchange price.
The fair values are represented on the balance sheet on a gross basis and can be set off on conditional terms. No col-
laterals or pledges have been given as a security against any liabilities or received against any assets arising from derivatives or other financial instruments. Financial contracts are executed only with counterparties that have high credit ratings. The credit risk of these counterparties as well as the present cred-itworthiness of KONE are considered when calculating the fair values of outstanding financial assets and liabilities.

H1/201930
INVESTMENTSThe shares held include a 19.9% holding in Toshiba Elevator and Building Systems Corporation (TELC). TELC is an invest-ment in equity instruments that does not have a quoted price in an active market. Investment also include other non-current financial assets which are investments in smaller holdings in other companies without public quotation.
Shares and other non-current financial assets are classified as investments measured at fair value through other compre-hensive income and the fair value is measured using income or market approach valuation techniques under fair value hier-archy level 3.
COMMITMENTSCommitments include guarantees issued by banks and finan-cial institutions for obligations arising in the ordinary course of
business of KONE companies up to a maximum of EUR 1,538 (June 30, 2018: 1,630) million as of June 30, 2019.
ADOPTION OF IFRIC 23 KONE has adopted IFRIC 23 Uncertainty over Income Tax Treatments effective January 1, 2019. The interpretation clarifies the application of the recognition and measurement requirements in IAS 12 Income Taxes when there is uncer-tainty over income tax treatment. KONE has reviewed it’s income tax treatment and adopted the interpretation using
a modified retrospective approach. An adjustment of EUR 29 million related to tax liabilities has been done to the opening balance of retained earnings and income tax payables at the date of the initial application, 1 January 2019. This adoption did not have impact to other accounts.
ADOPTION OF IFRS 16KONE has adopted the new IFRS 16 effective January 1, 2019. KONE has applied IFRS 16 using the modified retrospective approach by recognizing the cumulative effect of initially applying the standard in the opening balance sheet as at January 1, 2019, thus comparative information has not been restated.
IFRS 16 introduces a single, on-balance sheet lease account-ing model for lessees. A lessee recognizes a right-of-use asset representing its right to use the underlying asset and a lease liability representing its obligation to make lease payments. These right-of-use assets are depreciated over the contract period or over the useful lifetime, which is the shorter. Interest cost of leases are presented in financing expenses. There are optional exemptions for short-term leases and leases of low-value items which KONE has selected to utilize and the lease expense is recognized on a straight-line basis as permitted by IFRS 16. Lessor accounting remains similar to IAS 17 standard – i.e. lessors continue to classify leases as finance or operating leases. KONE does not have any material contracts as lessor.
At initial application of IFRS 16 KONE has recognized new assets and liabilities, mainly for its operating leases of facili-ties and vehicles. KONE has measured a right-of-use asset at the date of initial application for leases previously classified as an operating lease applying IAS 17 at an amount equal to the lease liability. This includes also leases whose lease term will end within 12 months at the initial application of IFRS 16.
Leases that were previously classified as finance leases apply-ing IAS 17 are accounted for as right-of-use assets and lease liabilities applying IFRS 16 from the date of initial application. At initial application of IFRS 16 KONE has excluded initial direct costs from the measurement of the right-of-use asset, has not used hindsight when assessing the lease term and has relied on its assessment of whether leases are onerous apply-ing IAS 37 immediately before the date of initial application.
As of January 1, 2019 KONE has recognized new right-of-use assets and respective lease liabilities of EUR 358 million. Operating lease obligation at December 31, 2018 was EUR 384 million. The difference to the lease liability value at ini-tial application is mainly due to application of exemptions for short-term leases and leases of low-value items and discount-ing of the lease liability. At initial application lease liabilities were discounted at an incremental borrowing rate at January 1, 2019. The weighted average discount rate was 3.0%.
Adoption of IFRS 16 has a significant impact on presenta-tion of the consolidated statement of cash flows improving cash flow from operations before financing items and taxes. Under IFRS 16 payments of lease liabilities are presented in financing activities and related interest expense as interest paid while previously the full amount of lease payments was included in the cash flow from operations before financing items and taxes.

31H1/2019
Adoption of IFRS 16 and IFRIC 23
Assets MEUR Dec 31, 2018
Restatement impact Jan 1, 2019
Non-current assets
Goodwill 1,333.4 1,333.4
Other intangible assets 260.2 260.2
Tangible assets 397.4 357.6 755.0
Loan receivables and other interest-bearing assets I 1.0 1.0
Investments 143.3 143.3
Employee benefits I 29.0 29.0
Deferred tax assets II 253.7 253.7
Total non-current assets 2,418.2 357.6 2,775.7
Current assets
Inventories II 624.1 624.1
Accounts receivable II 1,988.3 1,988.3
Deferred assets II 601.5 601.5
Income tax receivables II 59.0 59.0
Current deposits and loan receivables I 1,407.0 1,407.0
Cash and cash equivalents I 636.0 636.0
Total current assets 5,315.9 5,315.9
Total assets 7,734.0 357.6 8,091.6
Equity and liabilitiesMEUR Dec 31, 2018
Restatement impact Jan 1, 2019
Equity 3,080.6 -28.5 3,052.1
Non-current liabilities
Loans I 193.8 250.3 444.1
Employee benefits I 147.0 147.0
Deferred tax liabilities II 148.7 148.7
Total non-current liabilities 489.5 250.3 739.8
Provisions II 139.4 139.4
Current liabilities
Loans I 28.3 107.3 135.5
Advance payments received and deferred revenue II 1,562.2 1,562.2
Accounts payable II 786.7 786.7
Accruals II 1,574.0 1,574.0
Income tax payables II 73.3 28.5 101.8
Total current liabilities 4,024.5 135.8 4,160.3
Total equity and liabilities 7,734.0 357.6 8,091.6
Items designated “ I “ comprise interest-bearing net debt.Items designated “ II “ comprise net working capital.

H1/201932
This bulletin contains forward-looking statements that are based on the current expectations, known factors, decisions and plans of the management of KONE. Although the management believes that the expectations reflected in such forward-looking statements are reasonable, no assurance can be given that such expectations will prove to be correct. Accordingly, results could differ materially from those implied in the forward-looking statements as a result of, among other factors, changes in economic, market and competitive conditions, changes in the regulatory environment and other govern-ment actions as well as fluctuations in exchange rates.

33H1/2019

Front and back cover reference imagesKunming Changshui Airport is the fourth largest
airport in China, serving over 45 million travelers
every year, with numbers expected to increase.
To keep the airport’s 90 KONE elevators and
16 KONE autowalks running smoothly during
the building of a new terminal, the customer
selected KONE 24/7 Connected Services – a
cutting-edge technology that uses real-time
monitoring and analysis to optimize equipment
reliability.
KONE’s financial reporting schedules 2019Interim Report January 1–September 30, 2019 Wednesday, October 23, 2019
KONE CORPORATION
Corporate OfficesKeilasatama 3 P.O. Box 7 FI-02150 Espoo Finland Tel. +358 (0)204 75 1
For further information please contact:Sanna Kaje Vice President, Investor Relations Tel. +358 (0)204 75 4705
www.kone.com