Komstat 11.10.15
37
Type 'q()' to quit R. > mydata <- c(2.9, 3.4, 3.4, 3.7, 3.7, 2.8, 2.8, 2.5, 2.4, 2.4) > mydata [1] 2.9 3.4 3.4 3.7 3.7 2.8 2.8 2.5 2.4 2.4 > colours <- c("red", "green", "blue", "white", "black") > colours\ Error: unexpected input in "colours\" > colours [1] "red" "green" "blue" "white" "black" > x1 <- 25:30 > x1 [1] 25 26 27 28 29 30 > colours[3] [1] "blue" > colours[4] [1] "white" > mydata > 3 [1] FALSE TRUE TRUE TRUE TRUE FALSE FALSE FALSE FALSE FALSE > mydata[10] [1] 2.4 > mydata[11] [1] NA > mydata[11]<-3.0001 > mydata
-
Upload
dimas-bagus-cahyaningrat-w -
Category
Documents
-
view
246 -
download
0
description
komstat
Transcript of Komstat 11.10.15

Type 'q()' to quit R.
> mydata <- c(2.9, 3.4, 3.4, 3.7, 3.7, 2.8, 2.8, 2.5, 2.4, 2.4)
> mydata
[1] 2.9 3.4 3.4 3.7 3.7 2.8 2.8 2.5 2.4 2.4
> colours <- c("red", "green", "blue", "white", "black")
> colours\
Error: unexpected input in "colours\"
> colours
[1] "red" "green" "blue" "white" "black"
> x1 <- 25:30
> x1
[1] 25 26 27 28 29 30
> colours[3]
[1] "blue"
> colours[4]
[1] "white"
> mydata > 3
[1] FALSE TRUE TRUE TRUE TRUE FALSE FALSE FALSE FALSE FALSE
> mydata[10]
[1] 2.4
> mydata[11]
[1] NA
> mydata[11]<-3.0001
> mydata
[1] 2.9000 3.4000 3.4000 3.7000 3.7000 2.8000 2.8000 2.5000 2.4000 2.4000
[11] 3.0001

> mydata > 3
[1] FALSE TRUE TRUE TRUE TRUE FALSE FALSE FALSE FALSE FALSE TRUE
> mydata > mean(mydata)
[1] FALSE TRUE TRUE TRUE TRUE FALSE FALSE FALSE FALSE FALSE TRUE
> indeks01 <- mydata > mean(mydata)
> indeks01
[1] FALSE TRUE TRUE TRUE TRUE FALSE FALSE FALSE FALSE FALSE TRUE
> mydata(indeks01)
Error: could not find function "mydata"
> mydata[indeks01]
[1] 3.4000 3.4000 3.7000 3.7000 3.0001
> indeks01
[1] FALSE TRUE TRUE TRUE TRUE FALSE FALSE FALSE FALSE FALSE TRUE
> mydata[indeks01]
[1] 3.4000 3.4000 3.7000 3.7000 3.0001
> mydata[!indeks01]
[1] 2.9 2.8 2.8 2.5 2.4 2.4
> y <- rnorm(200, mean=50, std=2)
Error in rnorm(200, mean = 50, std = 2) : unused argument (std = 2)
> y <- rnorm(200, mean=50)
> y
[1] 50.13086 51.42580 49.20017 49.16917 50.47433 50.50821 49.52197 50.11739
[9] 49.40954 50.94728 50.95548 52.03906 50.19414 50.76121 49.22181 46.83693
[17] 49.92169 49.53569 49.63884 49.67352 49.29196 49.52831 49.59237 51.76960
[25] 50.39801 49.89438 49.69184 48.37864 49.57372 49.66544 51.25713 49.86009
[33] 50.33012 48.55080 50.62855 49.84911 51.58018 48.90873 50.72436 50.57045
[41] 48.56930 50.52681 50.92642 49.13474 48.48471 51.30264 49.27509 49.40059

[49] 49.77630 50.66334 50.78752 48.89797 49.07525 50.97124 50.45946 49.62753
[57] 50.48129 48.83178 49.60473 51.30743 50.08844 49.86727 49.85666 48.53580
[65] 48.47133 51.02765 48.31539 50.07641 49.81539 50.30430 49.68941 49.91285
[73] 50.70248 52.28917 50.90101 50.87411 51.14720 50.70147 50.17845 49.32130
[81] 51.22930 48.58973 49.71543 50.48667 49.56157 49.65800 48.33344 49.07977
[89] 49.80732 49.61599 49.59337 49.95152 49.73712 48.96654 49.61933 50.43535
[97] 51.68174 49.29291 52.05524 48.79959 49.71224 50.22969 50.71827 48.39198
[105] 48.27564 51.17583 50.16132 52.30725 51.19687 49.49747 50.11124 50.22192
[113] 50.34174 49.61295 50.95814 48.86877 50.90340 50.95861 50.07248 49.24488
[121] 50.26600 50.82119 49.63884 50.93401 49.25925 48.64657 48.35451 51.54910
[129] 50.30959 50.50030 48.59914 51.89031 50.11500 49.01126 49.45947 50.77548
[137] 50.53639 50.53325 50.12669 50.63493 48.62270 49.55841 47.36840 49.96321
[145] 49.86365 49.92103 50.89078 50.61050 50.44290 50.16003 50.74916 49.27069
[153] 47.81458 50.78242 50.87525 49.98991 49.87732 49.28069 50.82600 49.69817
[161] 51.78402 48.82891 50.90434 50.00803 49.97117 50.39129 49.97771 51.26128
[169] 47.87598 50.09317 50.57335 50.78370 49.94386 48.27162 51.28584 49.85444
[177] 49.35162 51.01070 49.99288 49.02349 50.23750 48.85241 51.25378 51.67095
[185] 51.45721 50.65890 49.70436 50.58016 48.82555 49.87652 51.23569 48.97739
[193] 49.90704 50.70993 50.78357 50.09145 50.23036 49.43132 49.16092 50.60906
> indeks02 <- y > mean(y)+3*std(y)
Error: could not find function "std"
> var(y)
[1] 0.9194558
> std(y)
Error: could not find function "std"
> stdev(y)
Error: could not find function "stdev"

> st.dev(y)
Error: could not find function "st.dev"
>
> indeks02 <- y > mean(y)+3*sqrt(var(y))
> indeks02
[1] FALSE FALSE FALSE FALSE FALSE FALSE FALSE FALSE FALSE FALSE FALSE FALSE
[13] FALSE FALSE FALSE FALSE FALSE FALSE FALSE FALSE FALSE FALSE FALSE FALSE
[25] FALSE FALSE FALSE FALSE FALSE FALSE FALSE FALSE FALSE FALSE FALSE FALSE
[37] FALSE FALSE FALSE FALSE FALSE FALSE FALSE FALSE FALSE FALSE FALSE FALSE
[49] FALSE FALSE FALSE FALSE FALSE FALSE FALSE FALSE FALSE FALSE FALSE FALSE
[61] FALSE FALSE FALSE FALSE FALSE FALSE FALSE FALSE FALSE FALSE FALSE FALSE
[73] FALSE FALSE FALSE FALSE FALSE FALSE FALSE FALSE FALSE FALSE FALSE FALSE
[85] FALSE FALSE FALSE FALSE FALSE FALSE FALSE FALSE FALSE FALSE FALSE FALSE
[97] FALSE FALSE FALSE FALSE FALSE FALSE FALSE FALSE FALSE FALSE FALSE FALSE
[109] FALSE FALSE FALSE FALSE FALSE FALSE FALSE FALSE FALSE FALSE FALSE FALSE
[121] FALSE FALSE FALSE FALSE FALSE FALSE FALSE FALSE FALSE FALSE FALSE FALSE
[133] FALSE FALSE FALSE FALSE FALSE FALSE FALSE FALSE FALSE FALSE FALSE FALSE
[145] FALSE FALSE FALSE FALSE FALSE FALSE FALSE FALSE FALSE FALSE FALSE FALSE
[157] FALSE FALSE FALSE FALSE FALSE FALSE FALSE FALSE FALSE FALSE FALSE FALSE
[169] FALSE FALSE FALSE FALSE FALSE FALSE FALSE FALSE FALSE FALSE FALSE FALSE
[181] FALSE FALSE FALSE FALSE FALSE FALSE FALSE FALSE FALSE FALSE FALSE FALSE
[193] FALSE FALSE FALSE FALSE FALSE FALSE FALSE FALSE
> indeks02 <- y > mean(y)+2*sqrt(var(y))
> indeks02
[1] FALSE FALSE FALSE FALSE FALSE FALSE FALSE FALSE FALSE FALSE FALSE TRUE
[13] FALSE FALSE FALSE FALSE FALSE FALSE FALSE FALSE FALSE FALSE FALSE FALSE
[25] FALSE FALSE FALSE FALSE FALSE FALSE FALSE FALSE FALSE FALSE FALSE FALSE

[37] FALSE FALSE FALSE FALSE FALSE FALSE FALSE FALSE FALSE FALSE FALSE FALSE
[49] FALSE FALSE FALSE FALSE FALSE FALSE FALSE FALSE FALSE FALSE FALSE FALSE
[61] FALSE FALSE FALSE FALSE FALSE FALSE FALSE FALSE FALSE FALSE FALSE FALSE
[73] FALSE TRUE FALSE FALSE FALSE FALSE FALSE FALSE FALSE FALSE FALSE FALSE
[85] FALSE FALSE FALSE FALSE FALSE FALSE FALSE FALSE FALSE FALSE FALSE FALSE
[97] FALSE FALSE TRUE FALSE FALSE FALSE FALSE FALSE FALSE FALSE FALSE TRUE
[109] FALSE FALSE FALSE FALSE FALSE FALSE FALSE FALSE FALSE FALSE FALSE FALSE
[121] FALSE FALSE FALSE FALSE FALSE FALSE FALSE FALSE FALSE FALSE FALSE FALSE
[133] FALSE FALSE FALSE FALSE FALSE FALSE FALSE FALSE FALSE FALSE FALSE FALSE
[145] FALSE FALSE FALSE FALSE FALSE FALSE FALSE FALSE FALSE FALSE FALSE FALSE
[157] FALSE FALSE FALSE FALSE FALSE FALSE FALSE FALSE FALSE FALSE FALSE FALSE
[169] FALSE FALSE FALSE FALSE FALSE FALSE FALSE FALSE FALSE FALSE FALSE FALSE
[181] FALSE FALSE FALSE FALSE FALSE FALSE FALSE FALSE FALSE FALSE FALSE FALSE
[193] FALSE FALSE FALSE FALSE FALSE FALSE FALSE FALSE
> y[indeks02]
[1] 52.03906 52.28917 52.05524 52.30725
> indeks1 <- y > mean(y)+sqrt(var(y))
> indeks1
[1] FALSE TRUE FALSE FALSE FALSE FALSE FALSE FALSE FALSE FALSE FALSE TRUE
[13] FALSE FALSE FALSE FALSE FALSE FALSE FALSE FALSE FALSE FALSE FALSE TRUE
[25] FALSE FALSE FALSE FALSE FALSE FALSE TRUE FALSE FALSE FALSE FALSE FALSE
[37] TRUE FALSE FALSE FALSE FALSE FALSE FALSE FALSE FALSE TRUE FALSE FALSE
[49] FALSE FALSE FALSE FALSE FALSE FALSE FALSE FALSE FALSE FALSE FALSE TRUE
[61] FALSE FALSE FALSE FALSE FALSE TRUE FALSE FALSE FALSE FALSE FALSE FALSE
[73] FALSE TRUE FALSE FALSE TRUE FALSE FALSE FALSE TRUE FALSE FALSE FALSE
[85] FALSE FALSE FALSE FALSE FALSE FALSE FALSE FALSE FALSE FALSE FALSE FALSE
[97] TRUE FALSE TRUE FALSE FALSE FALSE FALSE FALSE FALSE TRUE FALSE TRUE

[109] TRUE FALSE FALSE FALSE FALSE FALSE FALSE FALSE FALSE FALSE FALSE FALSE
[121] FALSE FALSE FALSE FALSE FALSE FALSE FALSE TRUE FALSE FALSE FALSE TRUE
[133] FALSE FALSE FALSE FALSE FALSE FALSE FALSE FALSE FALSE FALSE FALSE FALSE
[145] FALSE FALSE FALSE FALSE FALSE FALSE FALSE FALSE FALSE FALSE FALSE FALSE
[157] FALSE FALSE FALSE FALSE TRUE FALSE FALSE FALSE FALSE FALSE FALSE TRUE
[169] FALSE FALSE FALSE FALSE FALSE FALSE TRUE FALSE FALSE TRUE FALSE FALSE
[181] FALSE FALSE TRUE TRUE TRUE FALSE FALSE FALSE FALSE FALSE TRUE FALSE
[193] FALSE FALSE FALSE FALSE FALSE FALSE FALSE FALSE
> y[indeks1]
[1] 51.42580 52.03906 51.76960 51.25713 51.58018 51.30264 51.30743 51.02765
[9] 52.28917 51.14720 51.22930 51.68174 52.05524 51.17583 52.30725 51.19687
[17] 51.54910 51.89031 51.78402 51.26128 51.28584 51.01070 51.25378 51.67095
[25] 51.45721 51.23569
> names(mydata) <- c('c','j','b','e','i','h','g','d','f','a')
> mydata
c j b e i h g d f a <NA>
2.9000 3.4000 3.4000 3.7000 3.7000 2.8000 2.8000 2.5000 2.4000 2.4000 3.0001
> mydata["e"]
e
3.7
> letters[1:5]
[1] "a" "b" "c" "d" "e"
> mydata[letters[1:5]]
a b c d e
2.4 3.4 2.9 2.5 3.7
> mydata[c(3:5)]
b e i

3.4 3.7 3.7
> mydata[-c(3:5)]
c j h g d f a <NA>
2.9000 3.4000 2.8000 2.8000 2.5000 2.4000 2.4000 3.0001
> -c(3:5)
[1] -3 -4 -5
> mydata[-c(3:5)]
c j h g d f a <NA>
2.9000 3.4000 2.8000 2.8000 2.5000 2.4000 2.4000 3.0001
> mydata[-1]
j b e i h g d f a <NA>
3.4000 3.4000 3.7000 3.7000 2.8000 2.8000 2.5000 2.4000 2.4000 3.0001
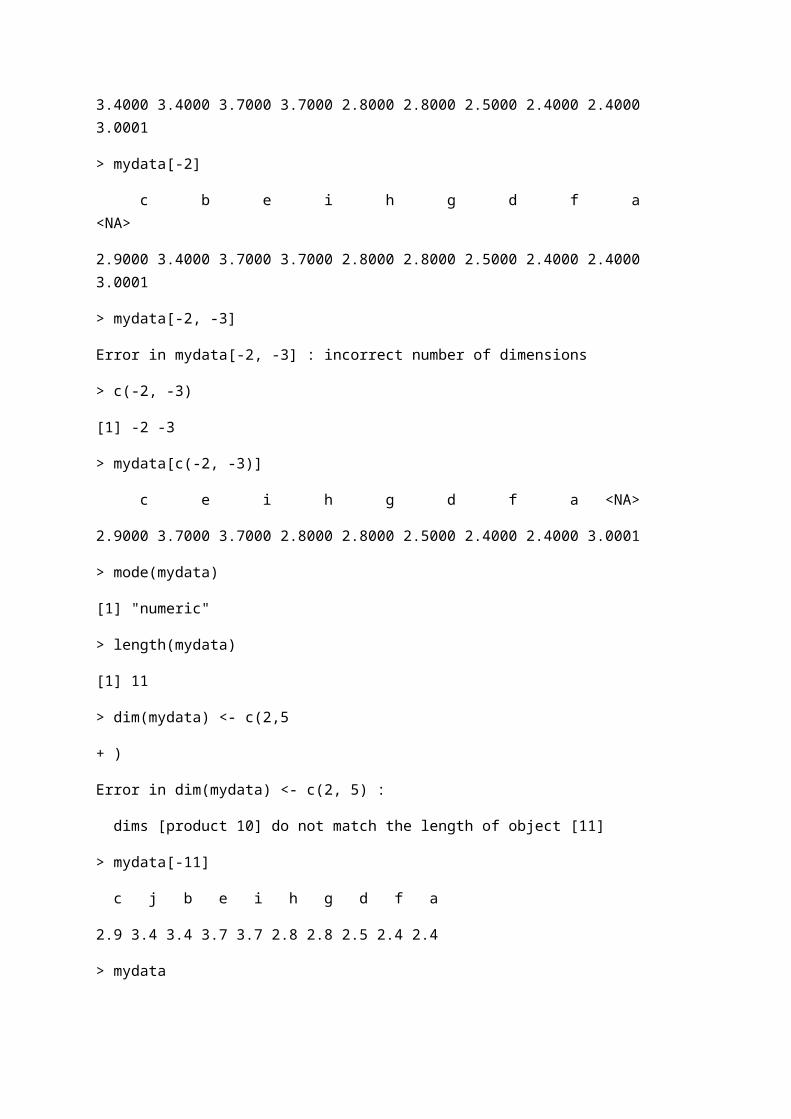
> mydata[-2]
c b e i h g d f a <NA>
2.9000 3.4000 3.7000 3.7000 2.8000 2.8000 2.5000 2.4000 2.4000 3.0001
> mydata[-2, -3]
Error in mydata[-2, -3] : incorrect number of dimensions
> c(-2, -3)
[1] -2 -3
> mydata[c(-2, -3)]
c e i h g d f a <NA>
2.9000 3.7000 3.7000 2.8000 2.8000 2.5000 2.4000 2.4000 3.0001
> mode(mydata)
[1] "numeric"
> length(mydata)
[1] 11
> dim(mydata) <- c(2,5

+ )
Error in dim(mydata) <- c(2, 5) :
dims [product 10] do not match the length of object [11]
> mydata[-11]
c j b e i h g d f a
2.9 3.4 3.4 3.7 3.7 2.8 2.8 2.5 2.4 2.4
> mydata
c j b e i h g d f a <NA>
2.9000 3.4000 3.4000 3.7000 3.7000 2.8000 2.8000 2.5000 2.4000 2.4000 3.0001
> myadata <- mydata[-11]
> mydata
c j b e i h g d f a <NA>
2.9000 3.4000 3.4000 3.7000 3.7000 2.8000 2.8000 2.5000 2.4000 2.4000 3.0001
> mydata <- mydata[-11]
> mydata
c j b e i h g d f a
2.9 3.4 3.4 3.7 3.7 2.8 2.8 2.5 2.4 2.4
> dim(mydata) <- c(2,5)
> mydata
[,1] [,2] [,3] [,4] [,5]
[1,] 2.9 3.4 3.7 2.8 2.4
[2,] 3.4 3.7 2.8 2.5 2.4
> dim(mydata) <- c(5,2)
> mydata
[,1] [,2]
[1,] 2.9 2.8
[2,] 3.4 2.8

[3,] 3.4 2.5
[4,] 3.7 2.4
[5,] 3.7 2.4
> dim(mydata) <- null
Error: object 'null' not found
> dim(mydata) <- NULL
> mydata
[1] 2.9 3.4 3.4 3.7 3.7 2.8 2.8 2.5 2.4 2.4
> mydata[11]<0
[1] NA
> mydata[11]<-0
> mydata
[1] 2.9 3.4 3.4 3.7 3.7 2.8 2.8 2.5 2.4 2.4 0.0
> dim(mydata) <- c(5,2)
Error in dim(mydata) <- c(5, 2) :
dims [product 10] do not match the length of object [11]
> mydata[12]<-0
> dim(mydata) <- c(5,2)
Error in dim(mydata) <- c(5, 2) :
dims [product 10] do not match the length of object [12]
> dim(mydata) <- c(6,2)
> mydata
[,1] [,2]
[1,] 2.9 2.8
[2,] 3.4 2.5
[3,] 3.4 2.4
[4,] 3.7 2.4
[5,] 3.7 0.0
[6,] 2.8 0.0
> dim(mydata) <- NULL
> matrix(mydata, 2, 6)
[,1] [,2] [,3] [,4] [,5] [,6]
[1,] 2.9 3.4 3.7 2.8 2.4 0
[2,] 3.4 3.7 2.8 2.5 2.4 0
> mydata
[1] 2.9 3.4 3.4 3.7 3.7 2.8 2.8 2.5 2.4 2.4 0.0 0.0
> matrix(mydata, 3, 4)
[,1] [,2] [,3] [,4]
[1,] 2.9 3.7 2.8 2.4
[2,] 3.4 3.7 2.5 0.0
[3,] 3.4 2.8 2.4 0.0
> mydata
[1] 2.9 3.4 3.4 3.7 3.7 2.8 2.8 2.5 2.4 2.4 0.0 0.0
> matrix(mydata, 3, 4, byrow=T)
[,1] [,2] [,3] [,4]
[1,] 2.9 3.4 3.4 3.7
[2,] 3.7 2.8 2.8 2.5
[3,] 2.4 2.4 0.0 0.0
> mat34<-matrix(mydata, 3, 4, byrow=T)
> mat34
[,1] [,2] [,3] [,4]
[1,] 2.9 3.4 3.4 3.7
[2,] 3.7 2.8 2.8 2.5
[3,] 2.4 2.4 0.0 0.0

> mat34[1,2]
[1] 3.4
> mat34[1,]
[1] 2.9 3.4 3.4 3.7
> mat34[,2]
[1] 3.4 2.8 2.4
> mat34[,c(1,2)]
[,1] [,2]
[1,] 2.9 3.4
[2,] 3.7 2.8
[3,] 2.4 2.4
> mat34[c(1,2),]
[,1] [,2] [,3] [,4]
[1,] 2.9 3.4 3.4 3.7
[2,] 3.7 2.8 2.8 2.5
> mat34[c(1,2),3]
[1] 3.4 2.8
> Empl <- list(employee="Anna", spouse="Fred", children=3,
+ child.ages=c(4,7,9))
> Empl[1]
$employee
[1] "Anna"
> Empl[4]
$child.ages
[1] 4 7 9

> Empl$employee
[1] "Anna"
> Empl$spouse
[1] "Fred"
> Empl$child.ages
[1] 4 7 9
> Empl2 <- list(employee="Anny", spouse="Fredy", children=2, child.ages=c(1, 5))
> Empl
$employee
[1] "Anna"
$spouse
[1] "Fred"
$children
[1] 3
$child.ages
[1] 4 7 9
> Empl2
$employee
[1] "Anny"
$spouse
[1] "Fredy"

$children
[1] 2
$child.ages
[1] 1 5
> hrd <- list(c(Empl, Empl2))
> hrd
[[1]]
[[1]]$employee
[1] "Anna"
[[1]]$spouse
[1] "Fred"
[[1]]$children
[1] 3
[[1]]$child.ages
[1] 4 7 9
[[1]]$employee
[1] "Anny"
[[1]]$spouse
[1] "Fredy"

[[1]]$children
[1] 2
[[1]]$child.ages
[1] 1 5
> hrd[1]
[[1]]
[[1]]$employee
[1] "Anna"
[[1]]$spouse
[1] "Fred"
[[1]]$children
[1] 3
[[1]]$child.ages
[1] 4 7 9
[[1]]$employee
[1] "Anny"
[[1]]$spouse
[1] "Fredy"

[[1]]$children
[1] 2
[[1]]$child.ages
[1] 1 5
> hrd$employee
NULL
> hrd <- list(cbind(Empl, Empl2))
> hrd
[[1]]
Empl Empl2
employee "Anna" "Anny"
spouse "Fred" "Fredy"
children 3 2
child.ages Numeric,3 Numeric,2
> hrd <- list(list(Empl, Empl2))
> hrd
[[1]]
[[1]][[1]]
[[1]][[1]]$employee
[1] "Anna"
[[1]][[1]]$spouse
[1] "Fred"

[[1]][[1]]$children
[1] 3
[[1]][[1]]$child.ages
[1] 4 7 9
[[1]][[2]]
[[1]][[2]]$employee
[1] "Anny"
[[1]][[2]]$spouse
[1] "Fredy"
[[1]][[2]]$children
[1] 2
[[1]][[2]]$child.ages
[1] 1 5
> hrd[1]
[[1]]
[[1]][[1]]
[[1]][[1]]$employee

[1] "Anna"
[[1]][[1]]$spouse
[1] "Fred"
[[1]][[1]]$children
[1] 3
[[1]][[1]]$child.ages
[1] 4 7 9
[[1]][[2]]
[[1]][[2]]$employee
[1] "Anny"
[[1]][[2]]$spouse
[1] "Fredy"
[[1]][[2]]$children
[1] 2
[[1]][[2]]$child.ages
[1] 1 5

> hrd[2]
[[1]]
NULL
> hrd <- list(r(Empl, Empl2))
Error: could not find function "r"
> hrd <- list(Empl, Empl2)
> hrd
[[1]]
[[1]]$employee
[1] "Anna"
[[1]]$spouse
[1] "Fred"
[[1]]$children
[1] 3
[[1]]$child.ages
[1] 4 7 9
[[2]]
[[2]]$employee
[1] "Anny"
[[2]]$spouse

[1] "Fredy"
[[2]]$children
[1] 2
[[2]]$child.ages
[1] 1 5
> hrd[1]
[[1]]
[[1]]$employee
[1] "Anna"
[[1]]$spouse
[1] "Fred"
[[1]]$children
[1] 3
[[1]]$child.ages
[1] 4 7 9
> hrd[2]
[[1]]
[[1]]$employee

[1] "Anny"
[[1]]$spouse
[1] "Fredy"
[[1]]$children
[1] 2
[[1]]$child.ages
[1] 1 5
> hrd <- list(satu=Empl, dua=Empl2)
> hrd
$satu
$satu$employee
[1] "Anna"
$satu$spouse
[1] "Fred"
$satu$children
[1] 3
$satu$child.ages
[1] 4 7 9

$dua
$dua$employee
[1] "Anny"
$dua$spouse
[1] "Fredy"
$dua$children
[1] 2
$dua$child.ages
[1] 1 5
> hrd$satu
$employee
[1] "Anna"
$spouse
[1] "Fred"
$children
[1] 3
$child.ages
[1] 4 7 9

> hrd$satu$employee
[1] "Anna"
> x <- rnorm(10,5,0.5)
> n <- length(x)
> for (i in 1:n) {
+ jumlah <- jumlah + x[i]
+ }
Error: object 'jumlah' not found
> jumlah
Error: object 'jumlah' not found
> jumlah=0
> x <- rnorm(10,5,0.5)
> n <- length(x)
> for (i in 1:n) {
+ jumlah <- jumlah + x[i]
+ }
> jumlah
[1] 49.83154
> x
[1] 4.830826 5.065396 4.592953 3.954200 5.822443 5.147678 5.146601 4.827131 5.193999 5.250316
> sum(x)
[1] 49.83154
> x <- rnorm(50)
> y <- 0.2 + 0.9*x + rnorm(50)*0.8
> plot(x,y)
> lines(y=mean(y))

Error in xy.coords(x, y) : argument "x" is missing, with no default
>
> lm(y~x)
Call:
lm(formula = y ~ x)
Coefficients:
(Intercept) x
0.1585 0.9308
> a<-lm(y~x)
> a
Call:
lm(formula = y ~ x)
Coefficients:
(Intercept) x
0.1585 0.9308
> mode(a)
[1] "list"
> a[1]
$coefficients
(Intercept) x
0.1584649 0.9307666

> a[2]
$residuals
1 2 3 4 5 6
-0.59400348 -0.42075070 1.41776007 -0.31446056 -0.36242832 -0.29496234
7 8 9 10 11 12
0.46161820 -0.53368357 0.37429512 -1.76080837 0.03737622 0.50040130
13 14 15 16 17 18
-0.96607513 0.83268218 -0.03572034 1.22214638 -0.29362526 0.47052934
19 20 21 22 23 24
-0.03617732 1.56733966 0.39634260 0.51300827 -0.89975324 -0.30975592
25 26 27 28 29 30
0.14811963 0.84024405 0.16214630 -0.23882518 0.13130301 0.18602049
31 32 33 34 35 36
-1.02670335 0.53140028 0.92268499 0.51875405 0.94922658 -0.05101016
37 38 39 40 41 42
0.19200916 -0.70663485 -0.97680660 0.51773158 1.39287136 -0.94160293
43 44 45 46 47 48
-1.78704454 -0.54336419 -1.21635568 0.87535687 -0.74249560 0.32061570
49 50
0.30031565 -0.72925140
> summary(a)
Call:
lm(formula = y ~ x)

Residuals:
Min 1Q Median 3Q Max
-1.78704 -0.54094 0.08434 0.50986 1.56734
Coefficients:
Estimate Std. Error t value Pr(>|t|)
(Intercept) 0.1585 0.1119 1.416 0.163
x 0.9308 0.1100 8.465 4.41e-11 ***
---
Signif. codes: 0 ‘***’ 0.001 ‘**’ 0.01 ‘*’ 0.05 ‘.’ 0.1 ‘ ’ 1
Residual standard error: 0.789 on 48 degrees of freedom
Multiple R-squared: 0.5988, Adjusted R-squared: 0.5905
F-statistic: 71.65 on 1 and 48 DF, p-value: 4.409e-11
> b <- summary(a)
> b
Call:
lm(formula = y ~ x)
Residuals:
Min 1Q Median 3Q Max
-1.78704 -0.54094 0.08434 0.50986 1.56734
Coefficients:
Estimate Std. Error t value Pr(>|t|)

(Intercept) 0.1585 0.1119 1.416 0.163
x 0.9308 0.1100 8.465 4.41e-11 ***
---
Signif. codes: 0 ‘***’ 0.001 ‘**’ 0.01 ‘*’ 0.05 ‘.’ 0.1 ‘ ’ 1
Residual standard error: 0.789 on 48 degrees of freedom
Multiple R-squared: 0.5988, Adjusted R-squared: 0.5905
F-statistic: 71.65 on 1 and 48 DF, p-value: 4.409e-11
> mode(b)
[1] "list"
> b[1]
$call
lm(formula = y ~ x)
> b[2]
$terms
y ~ x
attr(,"variables")
list(y, x)
attr(,"factors")
x
y 0
x 1
attr(,"term.labels")
[1] "x"
attr(,"order")

[1] 1
attr(,"intercept")
[1] 1
attr(,"response")
[1] 1
attr(,".Environment")
<environment: R_GlobalEnv>
attr(,"predvars")
list(y, x)
attr(,"dataClasses")
y x
"numeric" "numeric"
> b[3]
$residuals
1 2 3 4 5 6
-0.59400348 -0.42075070 1.41776007 -0.31446056 -0.36242832 -0.29496234
7 8 9 10 11 12
0.46161820 -0.53368357 0.37429512 -1.76080837 0.03737622 0.50040130
13 14 15 16 17 18
-0.96607513 0.83268218 -0.03572034 1.22214638 -0.29362526 0.47052934
19 20 21 22 23 24
-0.03617732 1.56733966 0.39634260 0.51300827 -0.89975324 -0.30975592
25 26 27 28 29 30
0.14811963 0.84024405 0.16214630 -0.23882518 0.13130301 0.18602049
31 32 33 34 35 36
-1.02670335 0.53140028 0.92268499 0.51875405 0.94922658 -0.05101016

37 38 39 40 41 42
0.19200916 -0.70663485 -0.97680660 0.51773158 1.39287136 -0.94160293
43 44 45 46 47 48
-1.78704454 -0.54336419 -1.21635568 0.87535687 -0.74249560 0.32061570
49 50
0.30031565 -0.72925140
> b[4]
$coefficients
Estimate Std. Error t value Pr(>|t|)
(Intercept) 0.1584649 0.1119312 1.415736 1.633092e-01
x 0.9307666 0.1099566 8.464856 4.408731e-11
> b
Call:
lm(formula = y ~ x)
Residuals:
Min 1Q Median 3Q Max
-1.78704 -0.54094 0.08434 0.50986 1.56734
Coefficients:
Estimate Std. Error t value Pr(>|t|)
(Intercept) 0.1585 0.1119 1.416 0.163
x 0.9308 0.1100 8.465 4.41e-11 ***
---

Signif. codes: 0 ‘***’ 0.001 ‘**’ 0.01 ‘*’ 0.05 ‘.’ 0.1 ‘ ’ 1
Residual standard error: 0.789 on 48 degrees of freedom
Multiple R-squared: 0.5988, Adjusted R-squared: 0.5905
F-statistic: 71.65 on 1 and 48 DF, p-value: 4.409e-11
> summary(a)
Call:
lm(formula = y ~ x)
Residuals:
Min 1Q Median 3Q Max
-1.78704 -0.54094 0.08434 0.50986 1.56734
Coefficients:
Estimate Std. Error t value Pr(>|t|)
(Intercept) 0.1585 0.1119 1.416 0.163
x 0.9308 0.1100 8.465 4.41e-11 ***
---
Signif. codes: 0 ‘***’ 0.001 ‘**’ 0.01 ‘*’ 0.05 ‘.’ 0.1 ‘ ’ 1
Residual standard error: 0.789 on 48 degrees of freedom
Multiple R-squared: 0.5988, Adjusted R-squared: 0.5905
F-statistic: 71.65 on 1 and 48 DF, p-value: 4.409e-11
> b[4]

$coefficients
Estimate Std. Error t value Pr(>|t|)
(Intercept) 0.1584649 0.1119312 1.415736 1.633092e-01
x 0.9307666 0.1099566 8.464856 4.408731e-11
> b[4][1]
$coefficients
Estimate Std. Error t value Pr(>|t|)
(Intercept) 0.1584649 0.1119312 1.415736 1.633092e-01
x 0.9307666 0.1099566 8.464856 4.408731e-11
> b$coefficients
Estimate Std. Error t value Pr(>|t|)
(Intercept) 0.1584649 0.1119312 1.415736 1.633092e-01
x 0.9307666 0.1099566 8.464856 4.408731e-11
> b$coefficients[1]
[1] 0.1584649
> b$coefficients[2]
[1] 0.9307666
> b$coefficients[3]
[1] 0.1119312
> b$coefficients[4]
[1] 0.1099566
> b$coefficients[5]
[1] 1.415736
> b$coefficients["t value"]
[1] NA

> mode(b$coefficients)
[1] "numeric"
> b$coefficients["Estimate"]
[1] NA
> type(b$coefficients)
Error: could not find function "type"
> is.list(b$coefficients)
[1] FALSE
> is.vector(b$coefficients)
[1] FALSE
> slot.Names(b)
Error: could not find function "slot.Names"
> b$coefficients[5,]
Error in b$coefficients[5, ] : subscript out of bounds
> b$coefficients[,1]
(Intercept) x
0.1584649 0.9307666
> b$coefficients[,2]
(Intercept) x
0.1119312 0.1099566
> b$coefficients[,3]
(Intercept) x
1.415736 8.464856
> b$coefficients
Estimate Std. Error t value Pr(>|t|)
(Intercept) 0.1584649 0.1119312 1.415736 1.633092e-01
x 0.9307666 0.1099566 8.464856 4.408731e-11

> b$coefficients[,3]
(Intercept) x
1.415736 8.464856
> b$coefficients[1,]
Estimate Std. Error t value Pr(>|t|)
0.1584649 0.1119312 1.4157357 0.1633092
> b$coefficients[2,3]
[1] 8.464856
> rownames(b$coefficients)
[1] "(Intercept)" "x"
> colnames(b$coefficients)
[1] "Estimate" "Std. Error" "t value" "Pr(>|t|)"
>