Kohonen self-organising maps in the data mining of wine taster comments · 2014-05-15 · Kohonen...
15
Kohonen self-organising maps in the data mining of wine taster comments P. Sallis 1 , S. Shanmuganathan 1 , L. Pavesi 2 & M. C. J. Muñoz 2 1 Auckland University of Technology, Australia 2 Universidad Catolica del Maule, Chile Abstract Computational neural network methods are increasingly being used for research- oriented data mining tasks. Kohonen self-organising map (SOM) techniques are well established within the so-called connectionist paradigm of Artificial Intelligence where neural networks are used to extract both explicit and implicit dependency values often between data that is sometimes disparate in type and kind. The research described here seeks to elicit relationships between grape varieties and their growing conditions using SOM techniques. In addition, utilising k-means and principle component analysis (PCA) methods, the data mined and depicted by the SOM technique is shown to have dependency values that enable a clustering of terms relating to variety quality to be associated with growing condition data to produce optimal locations for each. This study is part of a larger research project that uses comparative data from New Zealand and Chile. The text mining aspect of it forms one element of a ‘toolbox’ of integrated hardware and software instruments being developed to underpin an environmental modelling methodology oriented not only towards grape growing but also generally for optimal crop production. The example described here uses data from New Zealand in the first instance. The paper begins with a summary of some historical wisdom relating to grape growing with a discussion of some previous studies and then describes the text mining of comments from wine tasters, which are statistically analysed. The results are clustered and the paper concludes with a reflection on the investigation with a pointer to future work in this aspect of the larger research project previously described. Keywords: text mining, wine taster comments and wine sensory data. © 2008 WIT Press WIT Transactions on Information and Communication Technologies, Vol 40, www.witpress.com, ISSN 1743-3517 (on-line) Data Mining IX 125 doi:10.2495/DATA080131
Transcript of Kohonen self-organising maps in the data mining of wine taster comments · 2014-05-15 · Kohonen...
Kohonen self-organising maps in the data mining of wine taster comments
P. Sallis1, S. Shanmuganathan1, L. Pavesi2 & M. C. J. Muñoz2 1Auckland University of Technology, Australia 2Universidad Catolica del Maule, Chile
Abstract
Computational neural network methods are increasingly being used for research-oriented data mining tasks. Kohonen self-organising map (SOM) techniques are well established within the so-called connectionist paradigm of Artificial Intelligence where neural networks are used to extract both explicit and implicit dependency values often between data that is sometimes disparate in type and kind. The research described here seeks to elicit relationships between grape varieties and their growing conditions using SOM techniques. In addition, utilising k-means and principle component analysis (PCA) methods, the data mined and depicted by the SOM technique is shown to have dependency values that enable a clustering of terms relating to variety quality to be associated with growing condition data to produce optimal locations for each. This study is part of a larger research project that uses comparative data from New Zealand and Chile. The text mining aspect of it forms one element of a ‘toolbox’ of integrated hardware and software instruments being developed to underpin an environmental modelling methodology oriented not only towards grape growing but also generally for optimal crop production. The example described here uses data from New Zealand in the first instance. The paper begins with a summary of some historical wisdom relating to grape growing with a discussion of some previous studies and then describes the text mining of comments from wine tasters, which are statistically analysed. The results are clustered and the paper concludes with a reflection on the investigation with a pointer to future work in this aspect of the larger research project previously described. Keywords: text mining, wine taster comments and wine sensory data.
© 2008 WIT PressWIT Transactions on Information and Communication Technologies, Vol 40, www.witpress.com, ISSN 1743-3517 (on-line)
Data Mining IX 125
doi:10.2495/DATA080131
1 Introduction
The context for this investigation is within a wider research project that seeks to develop a comprehensive computational model relating to environmental factors that influence grape growing. These factors include climate, atmosphere, soil and terrain, plant biology and physiology. A paper describing the wider research project (titled Eno-Humanas) can be seen at [1]. One element of the research not previously described is illustrated here and relates to the linguistic and statistical analysis of written comments from wine tasters. The objective of this work is to mine the comments in an endeavour to establish correlations between grape varieties, growing conditions and location. Kohonen SOM techniques are used in conjunction with conventional statistical data analysis methods to achieve this task. Data dependency values are derived to establish relationships between wine sensory properties (such are referred to as ortho, retro-nasal and taste), terrior and ‘cultivars’. Geo-referenced or location data can be mapped to so-called terrior or environmental attributes such as soil and climate. Additionally, cultivars or vine variety data can be mapped to this convergent data set. Increasingly, understanding the relationships between these variables is considered to be vital in growing grapes for producing premium quality wine. Historically for example, the Mediterranean grape growing perspective has been based on traditional concepts that focus on the fact that small changes to the vintage cultivation practices of grapevine growth and berry ripening conditions can increase quality and quantity. Recently, this region has adopted methods to improve environmental factor relationship understanding, especially for the strength of dependency between terrior and cultivar factors. It is believed that the overall best conditions associated with the non-amendable variables, are based on ‘good year’ climatic conditions for that wine type and region. This is intuitively perceived using historical data, such as phenological events and observations that have been recorded and kept in some cases, for a thousand years, where dates of harvest and yield have been recorded [1, 2]. Using this data, which is considered more as knowledge or wisdom, crops are covered and protected from extreme weather conditions or induced with nutrients/stressed (reduced irrigation) to get the ideal grape fruit composition. For example, getting favourable levels of sugar accumulated without compromising the flavour components, which helps the winemaker to produce finer wine with optimum quality and ratings for a particular wine style. That is, flavours fully developed with well balanced acid and alcohol resulting in optimum characteristics mainly colour, aroma and taste [1, 3–5]. The impact of global warming on climate and its varying effects on different grapevine varieties in different regions, together with recent developments in the global wine market have enforced changes in the way viticulture and enology is being practiced [3, 6]. Even in the new wine producing countries where such concepts linking terrior with wine ratings were not considered as vital, there is significant interest in furthering research in the areas described here [7, 8]. Traditional wine characterisation and discrimination strategies used to quantify wine ratings for profiling purposes are outlined below, together with results of SOM based text mining approaches and other conventional
© 2008 WIT PressWIT Transactions on Information and Communication Technologies, Vol 40, www.witpress.com, ISSN 1743-3517 (on-line)
126 Data Mining IX
methodologies, such as PCA and k-means clustering. The advantages and disadvantages of these methods are discussed using wine data from regions within New Zealand. It is proposed that SOM based approaches more comprehensively enable researchers to analyse and describe the relationship dependencies between the variables already referred to for this aspect of grape growing and wine production, particularly:
a) to extend the analysis beyond a single wine region and thereby construct meaningful global comparisons
b) to enable the analysis of multiple attribute types that relate to wine ratings, grapevine growth factors and environmental influences
c) to build scenarios based on this analysis in order to predict a region’s ability to grow grapes under future climate change scenarios, using geo-referenced data sets including climate change prediction models.
The paper concludes with a discussion of the potential for collectively analysing wine data (from multiple sources) using Chilean and other wine growing regions around the world.
2 Climate change and viticulture
Climate change is seen as a major impact variable on all vegetation across the globe, but its impact on grapevine varieties is critical. Wine producing regions are located in relatively narrow geographical or climatic niches so they are more vulnerable to shifts in climate pattern and weather intensity. The effect of weather extremes historically is described in [3]. In this article, Jones argues several relevant points for consideration in a comprehensive modelling project such as the Eno-Humans project of the author’s described as the wider context for this research in [1]. First, there is sufficient evidence to suggest that the currently famous grapevine growing regions developed because of prevailing favourable climatic conditions and that shifts in wine-producing regions have also occurred due to climate changes. Historical literature reveals that some old European records spanning a thousand years describe periods of more beneficial growing season temperatures, greater productivity, and better quality in certain regions. The historical evidence also proves the existence of vineyards of as far north as the coastal zones of the Baltic Sea and southern England during the medieval Little Optimum period of the 900-1300AD; a time when records describe an average temperature of 1.7oC warmer than in that region today. With the dramatic temperature decline that began in the 14th century called the Little Ice Age period, most of the northern vineyards in Europe and England were unable to continue, so grape cultivation and grape harvesting diminished dramatically. Therefore, climate variation over time is a significant environmental modelling considering and factor for incorporation in any prediction system that may evolve. Second, a correlation between the potential increases in alcohol levels (2.5% by volume) in Alsace Riesling at harvest together with significantly warmer ripening periods over the next 30 years has been established. Jones inter alia
© 2008 WIT PressWIT Transactions on Information and Communication Technologies, Vol 40, www.witpress.com, ISSN 1743-3517 (on-line)
Data Mining IX 127
goes on to argue that the 50 % of the increasing alcohol trend is due to climate variability as opposed to a study by Godden and Gishen [3a] who find the reason for this trend as driven by wine cities for bigger and bolder wines. Establishing the motivation for increased alcohol content is not in itself a consideration for environmental modelling systems but does have an impact of prediction proposals, whether the cause is climate change or market demand or a mix of both because they are independent influences on grape growing and wine production methods going forward. Third, and the most interesting one from a multivariate value dependency perspective as being modelled in the Eno-Humanas Project, is that the warming so far observed by Jones is stated as being not uniform across the wine-producing regions with greater magnitudes in the western US and Europe, and less warming in Chile, South Africa and Australia.
3 Traditional wine tasting, strategies and ratings
The grapevine cultivation practices so far discussed incorporate traditions and history dating back several centuries. The reality is that there is no single tasting procedure that has achieved universal acceptance [9]. There is however, consistency in wine tasting strategy that relates to appearance, odour in the glass, in-mouth sensation, finish and overall quality. The first component is visual perception and relates to colour (perception, measurement, and origin), clarity (crystal, sediment, haze, and microbial spoilage), viscosity, spritz … and uses emotive descriptor terms such as tears. Similarly, physiological characteristics such as olfactory sensation concerns olfactory systems, odorants, stimulations and chemical functionalities involved, perception and assessment, and off-odours. The in-mouth sensation characteristics deal with taste, perception, mouth feel, the chemical compounds involved and sensations in wine tasting. Finally, sweetness in wine comes from the sugars in it, such as glucose and fructose and these can be measured chemically, so are more precise descriptors. Perceptible sweetness is achieved with over 0.2% concentration of total sugars. [10]. Wine assessment or formal wine tasting is a skill that requires extensive training during which individuals develop perceptual abilities (e.g., olfactory imaging) in order to recognise and name the wine odour. However, in [11] it is argued that novices can also have these abilities but fail to perform with result reporting that is as consistent as wine experts due for example, to the interference of forced naming of an odorant with the memory for the actual odorant itself. Furthermore, citing earlier studies on research that theorised on information processing of complex stimuli such as odours and tastes can be compromised under some circumstances by forced verbalisation. Following a detailed introduction to wine tasting expertise issues, Wendy et al. [12] discuss an investigation aimed at discovering the objective ways in which wine experts perform better than novices when evaluating wines. The findings implied that the source of superior odour recognition memory demonstrated by wine experts was not due to enhanced semantic memory and linguistic capabilities for wine-relevant odours, but perceptual skills. In the investigation described, the authors
© 2008 WIT PressWIT Transactions on Information and Communication Technologies, Vol 40, www.witpress.com, ISSN 1743-3517 (on-line)
128 Data Mining IX
used recognition of wine-relevant odours as a function of wine expertise and type of encoding of the to-be-remembered odorants. The study also concluded that wine experts as well suffer from bias, and odorant-naming difficulties similar to those endured by wine novices. In wine rating assessments the product quality is evaluated not only in terms of quantitative scores but also qualitative evaluations, represented by comments such as those analysed in this paper. As with other consumer satisfaction surveys, open-ended questions relating to quality are used to complement classical satisfaction scales, [13]. Traditional sensory analysis is still found to be the most efficient tool for exactly assessing food sensory properties despite the availability of sophisticated techniques and research into establishing and identifying the trace volatile molecules that generate the flavours in wine. Even the modern techniques, such as gas chromatography sampling, fail to evaluate odour mixtures accurately. Mostly they measure odorant peaks. Chemical analysis to date has rarely been successful in providing robust enough data to predict the sensory properties of mixtures [13]. It appears to be the case that sensory evaluation and profiling of wine sample discrimination could be most effectively achieved by combining data from visual, gustatory and olfactory ratings. ISO standards relating to wine glasses, rooms, and other quality attributes that contribute to the end product can be found at [14] but the previously described research in [13] that attempted to study wine taster comments has prompted the view for this paper that the ISO standards are not comprehensive enough for the precision being sought in the ever-increasing competitive world of grape growing and wine production. In the work by Bécue-Bertaut et al. [13] they analysed the relationship between a liking score (quantitative) and free-text comments (qualitative) provided by experts for a range of wines. In this approach, analysts calculated a synthetic score using an extended multiple factor analysis from the words in the comments for each of the wines and compared them with the liking score given by the experts for that wine. Even though the analysts produced synthetic scores similar to the wine liking scores, they had to pre-process the text to create a coding in consideration of three factors namely, stability, legibility and reproducibility using software tools especially developed for processing natural languages. The study concluded the approach to be useful in conducting systematic comparisons to study the relationships between vocabulary and liking scores depending on wines, years, guides and products. It is also interesting that the analysts were able to establish the groups of words that had low and high relationships in terms of coordinates, with liking and synthetic scores. However, as the authors also concluded, the approach relies on the particular coding guide of descriptive terms used. Comments consisting of different word groups would change the synthetic scores and in many cases the liking scores as well.
4 The SOM and conventional text mining approaches
This section details the methodology and results achieved in analysing 94 different wine textual taster comments from [15]. The data set consists of
© 2008 WIT PressWIT Transactions on Information and Communication Technologies, Vol 40, www.witpress.com, ISSN 1743-3517 (on-line)
Data Mining IX 129
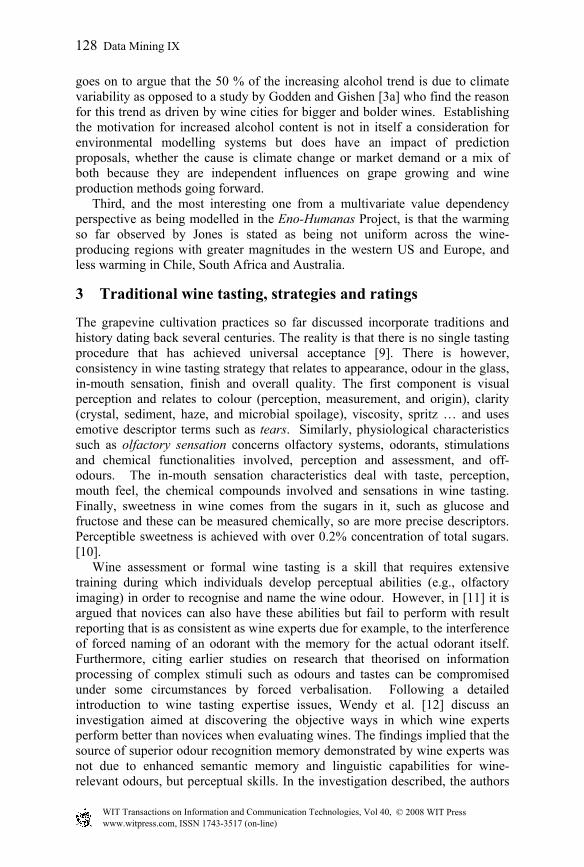
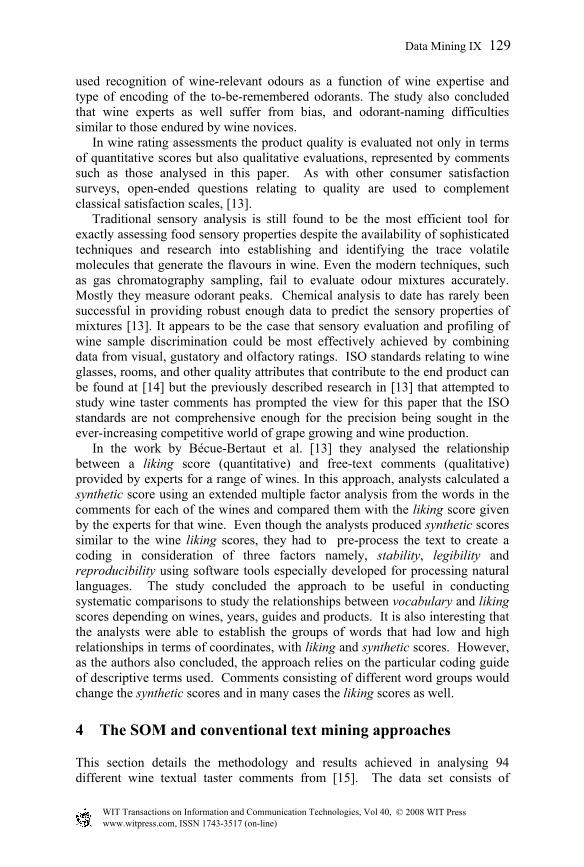
different wine styles from different regions within New Zealand (figure 1). Taster comments of these wines are mined using standard text mining techniques. During this process initially stop words, such as is, the, that, etc that do not have any context meaning value, are programmatically removed then a wine (number x words) table is created. Where words are present in at least in two comments (tf x idf) are measured, where (tf) term frequency is used to derive term density and (idf) inverse document frequency, which is a measure of rarity across the corpus. The result provides a word frequency weight value that is then used by the SOM clustering technique to indicate a dependency or correlation of values in the set. The resulting SOM (figures 2a & b) with 100 nodes and a standard training algorithm was used to depict the wine varieties and locations when compared with the taster comments. Two clusters were produced during the training. One with three clusters and another with eight clusters each. The geo-referenced data was manipulated by a GIS with the name DIVA, a NASA produced product developed specifically for crop and climate data processing. See http://www.diva-gis.org/. This graph (figure 3), while difficult to read, represents a three dimensional density of word matches against the varietal and geo-referenced location data. The three dimensional interpretation of this would suggest a clustering of comments around varieties and locations that would lead to establishing qualitative similarities alongside those characteristics able to be quantified. It is planned to conduct this aspect of the research once data has been collected for Chile and other grape growing regions with a view to establishing a global set of
Figure 1: Wine grouping projected DIVA-GIS based on the wine types analysed given in the web catalogue.
© 2008 WIT PressWIT Transactions on Information and Communication Technologies, Vol 40, www.witpress.com, ISSN 1743-3517 (on-line)
130 Data Mining IX
2
Red Blend
Hawke's Bay
29
Pinot Noir
Martinborough
Hawke's Bay
28
Pinot Noir
Marlborough
Marlborough
5
Merlot
Hawke's Bay
g
Martinborough
74
Ries ling
Marlborough
71
Ries ling
Central Otago
g
Central Otago
13
Sauvignon Blanc
Martinborough
g
Central Otago
89
Sauvignon Blanc
Marlborough
52
Chardonnay
Marlborough
73
Ries ling
Central Otag
5
t Noir
l Otago
0
rah
e's Bay
56
Pinot Gris
Marlborough
48
Chardonnay
Kum eu
77
Sauvignon Blanc
Hawke's Bay
12
Sauvignon Blanc
Marlborough
4
Chard
Hawke
5
Chard
Kum
5
Chard
Marlbo
16
et Sauvignon-Merlot
Waipara
9
Ries ling
Marlborough
31
Pinot Noir
Martinborough
35
Sauvignon Blanc
Marlborough
85
Sauvignon Blanc
Marlborough
49
Chardonnay
Kum eu
9
t Noir
l Otago
4
t Noir
l Otago
8
t Noir
para
58
Pinot Noir
Central Otago
65
Pinot Noir
Marlborough
67
Pinot Noir
Moutere
88
Sauvignon Blanc
Marlborough
17
Chardonnay
Hawke's Bay
4
Chard
Martinb
44
Chard
Gisb
4
Chard
Hawke
43
ordeaux Blend
Hawke's Bay
8
Pinot Noir
Martinborough
57
Pinot Noir
Central Otago
41
Syrah
Hawke's Bay
37
Sauvignon Blanc
Marlborough
70
Pinot Noir
Wairarapa
15
Bordeaux White Blend
Waipara Valley
53
Chardonnay
Martinborough
54
Chardonnay
New Zealand
19
Chardonnay
Kum eu
20
Chardonnay
Marlborough
6
t Noir
l Otago
9
t Noir
para
61
Pinot Noir
Central Otago
60
Pinot Noir
Central Otago
21
Chardonnay
Martinborough
1
Chard
Hawke
3
Ries
Centra42
Syrah
Hawke's Bay
23
Merlot
Hawke's Bay
38
Sauvignon Blanc
Marlborough
92
Sauvignon Blanc
Marlborough
75
Sauvignon Bla
Awatere Valle
80
Sauvignon Bla
Marlborough
86
Sauvignon Bla
Marlborough
2
t Noir
l Otago
6
t Noir
orough
7
t Noir
borough
14
Bordeaux Blend
Hawke's Bay
34
Sauvignon Blanc
Marlborough
79
Sauvignon Blanc
Hawke's Bay
39
Sauvignon Blanc
Marlborough
82
Sauvignon Blanc
Marlborough
7
Sauvigno
Hawke
9
Sauvigno
Marlbo30
Pinot Noir
Martinborough
33
Ries ling
Moutere
63
Pinot Noir
Central Otago
55
Chardonnay
Waipara
6
Pinot Noir
Martinborough Terrace
22
Chardonnay
Nelson
45
83
Sauvignon Blanc
Marlborough
76
Sauvignon Blanc
Central Otago
81
Sauvignon Blanc
Marlborough
91
Sauvignon Blanc
Marlborough
36
Sauvignon Bla
Marlborough
87
Sauvignon Bla
Marlborough
C1
C2
C3
(a)
appl-1
0.00 0.76
berri-3
0.00 0.86
black-4
0.00 0.72
cherri-10
0.00 0.59
grapefruit-19
0.00 0.71
herbal-21
0.00 0.98
nut-27
0.00 0.59
nutti-28
0.00 0.88
passion-30
0.00 0.83
pink-31
0.00 0.51
tannin-40
0.00 0.67
old-29
0.00 0.56 (b)
Figure 2: (a): Three cluster SOM created with 44 weights calculated by applying the (tf x idf) formula to words occurring more than twice in the taster comments of 95 wines. (b): A few SOM components showing the word weights in the clustering.
© 2008 WIT PressWIT Transactions on Information and Communication Technologies, Vol 40, www.witpress.com, ISSN 1743-3517 (on-line)
Data Mining IX 131
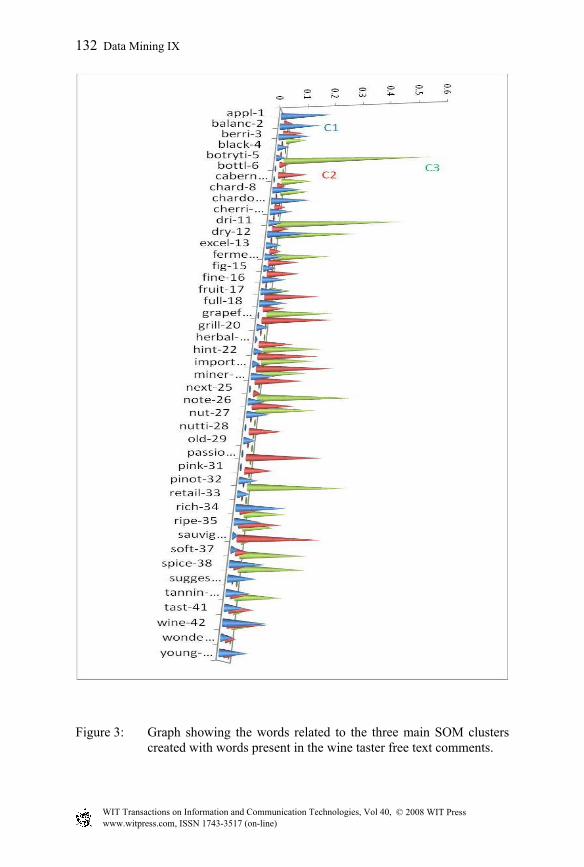
Figure 3: Graph showing the words related to the three main SOM clusters created with words present in the wine taster free text comments.
© 2008 WIT PressWIT Transactions on Information and Communication Technologies, Vol 40, www.witpress.com, ISSN 1743-3517 (on-line)
132 Data Mining IX
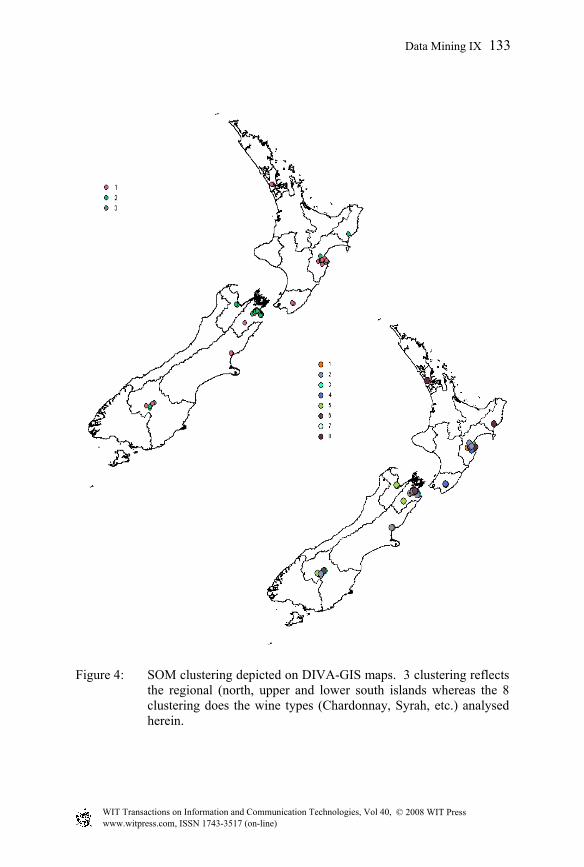
Figure 4: SOM clustering depicted on DIVA-GIS maps. 3 clustering reflects the regional (north, upper and lower south islands whereas the 8 clustering does the wine types (Chardonnay, Syrah, etc.) analysed herein.
© 2008 WIT PressWIT Transactions on Information and Communication Technologies, Vol 40, www.witpress.com, ISSN 1743-3517 (on-line)
Data Mining IX 133
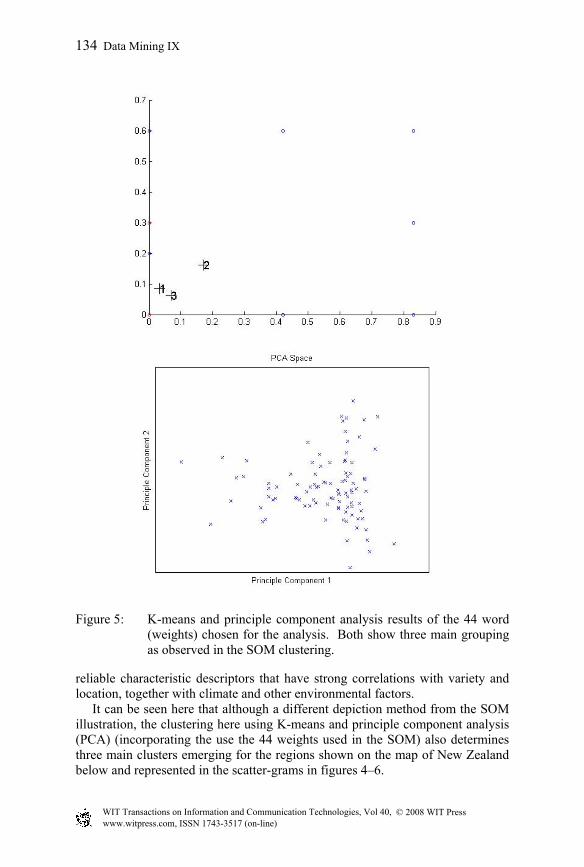
Figure 5: K-means and principle component analysis results of the 44 word (weights) chosen for the analysis. Both show three main grouping as observed in the SOM clustering.
reliable characteristic descriptors that have strong correlations with variety and location, together with climate and other environmental factors. It can be seen here that although a different depiction method from the SOM illustration, the clustering here using K-means and principle component analysis (PCA) (incorporating the use the 44 weights used in the SOM) also determines three main clusters emerging for the regions shown on the map of New Zealand below and represented in the scatter-grams in figures 4–6.
© 2008 WIT PressWIT Transactions on Information and Communication Technologies, Vol 40, www.witpress.com, ISSN 1743-3517 (on-line)
134 Data Mining IX

5 Conclusion
Based on historical data that is available dating back centuries and further contemporary data and analysis of wine tasting parameters and techniques, it is clear that the multivariate nature of this complex blend of chemically identifiable characteristics and other more qualitative human opinion based values, leads to an indefinite basis on which to predict wine quality. As is demonstrated in this paper though, the imprecise data relating to human sensory perception and resulting opinions gives rise to the view that using contemporary computational modelling techniques, it is possible both to plot the existence of discrete values and to illustrate their dependency strengths within a matrix of known variables.
0
2
4
6
8
10
12
14
16
Cen
tral O
tago
Haw
ke's
Bay
Kum
eu M
arlb
orou
gh M
artin
boro
ugh
Mou
tere
New
Zea
land
Wai
para
Wai
rara
pa A
wat
ere
Cen
tral O
tago
Haw
ke's
Bay
Mar
lbor
ough
Cen
tral O
tago
Haw
ke's
Bay
Mar
tinbo
roug
h W
aipa
ra C
entra
l Ota
go H
awke
's B
ay H
awke
's B
ay K
umeu
Mar
lbor
ough
Mar
tinbo
roug
h C
entra
l Ota
go H
awke
's B
ay M
arlb
orou
gh M
artin
boro
ugh
Mou
tere
Cen
tral O
tago
Haw
ke's
Bay
Mar
lbor
ough
Mar
tinbo
roug
h M
oute
re N
elso
n W
aipa
ra C
entra
l Ota
go M
arlb
orou
gh M
artin
boro
ugh
Gis
born
e H
awke
's B
ay K
umeu
Mar
lbor
ough
Mar
tinbo
roug
h
1 2 3 4 5 6 7 8
Bordeaux Blend Bordeaux White Blend Cabernet Sauvignon-Merlot ChardonnayMerlot Merlot-Cabernet Franc Pinot Gris Pinot NoirRed Blend Riesling Sauvignon Blanc Syrah
Count of Clusters
ClusterNo Region
wineNAME
Figure 6: Graph showing the wine grouping of the 8 cluster SOM of wine taster comments. The clustering appears to be reflecting the wine type, for example, cluster 8 has all Syrah growing in Gisborne, Hawke’s Bay, Kumeu, Marlborough and Martinborough. Cluster 2 has Sauvignon Blanc from Awatere, Central Otago, Hawke’s Bay and Marlborough regions.
This paper has described a technique for depicting clusters of variables using mixed data type analysis and the Kohonen self-organising map method predominantly associated with computational neural network modelling and a technique for data mining that results in the extraction of relevant data values to populate the model. Further work is destined to develop a knowledge-based system that can learn from the iterations of this model as new data is introduced over time and in particular, can compare the results of imprecise qualitative tasting opinion with a mix of variety and geo-referenced location data with climate and other environmental data, which is more precise in nature.
© 2008 WIT PressWIT Transactions on Information and Communication Technologies, Vol 40, www.witpress.com, ISSN 1743-3517 (on-line)
Data Mining IX 135
Appendix A. Weighted words
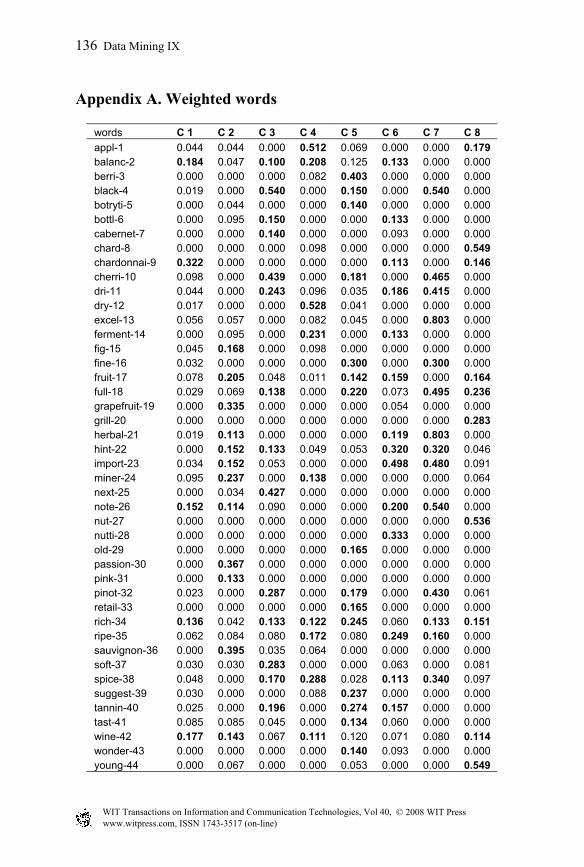
words C 1 C 2 C 3 C 4 C 5 C 6 C 7 C 8 appl-1 0.044 0.044 0.000 0.512 0.069 0.000 0.000 0.179 balanc-2 0.184 0.047 0.100 0.208 0.125 0.133 0.000 0.000 berri-3 0.000 0.000 0.000 0.082 0.403 0.000 0.000 0.000 black-4 0.019 0.000 0.540 0.000 0.150 0.000 0.540 0.000 botryti-5 0.000 0.044 0.000 0.000 0.140 0.000 0.000 0.000 bottl-6 0.000 0.095 0.150 0.000 0.000 0.133 0.000 0.000 cabernet-7 0.000 0.000 0.140 0.000 0.000 0.093 0.000 0.000 chard-8 0.000 0.000 0.000 0.098 0.000 0.000 0.000 0.549 chardonnai-9 0.322 0.000 0.000 0.000 0.000 0.113 0.000 0.146 cherri-10 0.098 0.000 0.439 0.000 0.181 0.000 0.465 0.000 dri-11 0.044 0.000 0.243 0.096 0.035 0.186 0.415 0.000 dry-12 0.017 0.000 0.000 0.528 0.041 0.000 0.000 0.000 excel-13 0.056 0.057 0.000 0.082 0.045 0.000 0.803 0.000 ferment-14 0.000 0.095 0.000 0.231 0.000 0.133 0.000 0.000 fig-15 0.045 0.168 0.000 0.098 0.000 0.000 0.000 0.000 fine-16 0.032 0.000 0.000 0.000 0.300 0.000 0.300 0.000 fruit-17 0.078 0.205 0.048 0.011 0.142 0.159 0.000 0.164 full-18 0.029 0.069 0.138 0.000 0.220 0.073 0.495 0.236 grapefruit-19 0.000 0.335 0.000 0.000 0.000 0.054 0.000 0.000 grill-20 0.000 0.000 0.000 0.000 0.000 0.000 0.000 0.283 herbal-21 0.019 0.113 0.000 0.000 0.000 0.119 0.803 0.000 hint-22 0.000 0.152 0.133 0.049 0.053 0.320 0.320 0.046 import-23 0.034 0.152 0.053 0.000 0.000 0.498 0.480 0.091 miner-24 0.095 0.237 0.000 0.138 0.000 0.000 0.000 0.064 next-25 0.000 0.034 0.427 0.000 0.000 0.000 0.000 0.000 note-26 0.152 0.114 0.090 0.000 0.000 0.200 0.540 0.000 nut-27 0.000 0.000 0.000 0.000 0.000 0.000 0.000 0.536 nutti-28 0.000 0.000 0.000 0.000 0.000 0.333 0.000 0.000 old-29 0.000 0.000 0.000 0.000 0.165 0.000 0.000 0.000 passion-30 0.000 0.367 0.000 0.000 0.000 0.000 0.000 0.000 pink-31 0.000 0.133 0.000 0.000 0.000 0.000 0.000 0.000 pinot-32 0.023 0.000 0.287 0.000 0.179 0.000 0.430 0.061 retail-33 0.000 0.000 0.000 0.000 0.165 0.000 0.000 0.000 rich-34 0.136 0.042 0.133 0.122 0.245 0.060 0.133 0.151 ripe-35 0.062 0.084 0.080 0.172 0.080 0.249 0.160 0.000 sauvignon-36 0.000 0.395 0.035 0.064 0.000 0.000 0.000 0.000 soft-37 0.030 0.030 0.283 0.000 0.000 0.063 0.000 0.081 spice-38 0.048 0.000 0.170 0.288 0.028 0.113 0.340 0.097 suggest-39 0.030 0.000 0.000 0.088 0.237 0.000 0.000 0.000 tannin-40 0.025 0.000 0.196 0.000 0.274 0.157 0.000 0.000 tast-41 0.085 0.085 0.045 0.000 0.134 0.060 0.000 0.000 wine-42 0.177 0.143 0.067 0.111 0.120 0.071 0.080 0.114 wonder-43 0.000 0.000 0.000 0.000 0.140 0.093 0.000 0.000 young-44 0.000 0.067 0.000 0.000 0.053 0.000 0.000 0.549
© 2008 WIT PressWIT Transactions on Information and Communication Technologies, Vol 40, www.witpress.com, ISSN 1743-3517 (on-line)
136 Data Mining IX
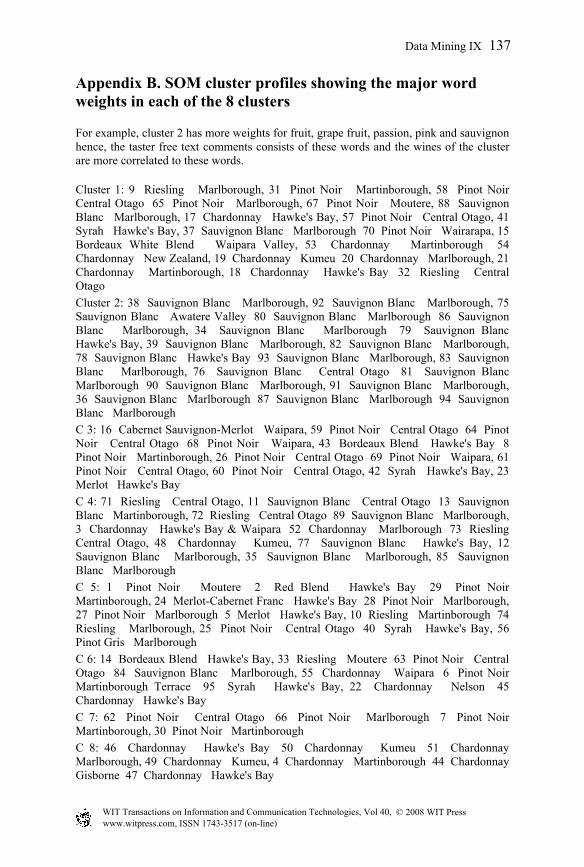
Appendix B. SOM cluster profiles showing the major word weights in each of the 8 clusters
For example, cluster 2 has more weights for fruit, grape fruit, passion, pink and sauvignon hence, the taster free text comments consists of these words and the wines of the cluster are more correlated to these words. Cluster 1: 9 Riesling Marlborough, 31 Pinot Noir Martinborough, 58 Pinot Noir Central Otago 65 Pinot Noir Marlborough, 67 Pinot Noir Moutere, 88 Sauvignon Blanc Marlborough, 17 Chardonnay Hawke's Bay, 57 Pinot Noir Central Otago, 41 Syrah Hawke's Bay, 37 Sauvignon Blanc Marlborough 70 Pinot Noir Wairarapa, 15 Bordeaux White Blend Waipara Valley, 53 Chardonnay Martinborough 54 Chardonnay New Zealand, 19 Chardonnay Kumeu 20 Chardonnay Marlborough, 21 Chardonnay Martinborough, 18 Chardonnay Hawke's Bay 32 Riesling Central Otago
Cluster 2: 38 Sauvignon Blanc Marlborough, 92 Sauvignon Blanc Marlborough, 75 Sauvignon Blanc Awatere Valley 80 Sauvignon Blanc Marlborough 86 Sauvignon Blanc Marlborough, 34 Sauvignon Blanc Marlborough 79 Sauvignon Blanc Hawke's Bay, 39 Sauvignon Blanc Marlborough, 82 Sauvignon Blanc Marlborough, 78 Sauvignon Blanc Hawke's Bay 93 Sauvignon Blanc Marlborough, 83 Sauvignon Blanc Marlborough, 76 Sauvignon Blanc Central Otago 81 Sauvignon Blanc Marlborough 90 Sauvignon Blanc Marlborough, 91 Sauvignon Blanc Marlborough, 36 Sauvignon Blanc Marlborough 87 Sauvignon Blanc Marlborough 94 Sauvignon Blanc Marlborough
C 3: 16 Cabernet Sauvignon-Merlot Waipara, 59 Pinot Noir Central Otago 64 Pinot Noir Central Otago 68 Pinot Noir Waipara, 43 Bordeaux Blend Hawke's Bay 8 Pinot Noir Martinborough, 26 Pinot Noir Central Otago 69 Pinot Noir Waipara, 61 Pinot Noir Central Otago, 60 Pinot Noir Central Otago, 42 Syrah Hawke's Bay, 23 Merlot Hawke's Bay
C 4: 71 Riesling Central Otago, 11 Sauvignon Blanc Central Otago 13 Sauvignon Blanc Martinborough, 72 Riesling Central Otago 89 Sauvignon Blanc Marlborough, 3 Chardonnay Hawke's Bay & Waipara 52 Chardonnay Marlborough 73 Riesling Central Otago, 48 Chardonnay Kumeu, 77 Sauvignon Blanc Hawke's Bay, 12 Sauvignon Blanc Marlborough, 35 Sauvignon Blanc Marlborough, 85 Sauvignon Blanc Marlborough
C 5: 1 Pinot Noir Moutere 2 Red Blend Hawke's Bay 29 Pinot Noir Martinborough, 24 Merlot-Cabernet Franc Hawke's Bay 28 Pinot Noir Marlborough, 27 Pinot Noir Marlborough 5 Merlot Hawke's Bay, 10 Riesling Martinborough 74 Riesling Marlborough, 25 Pinot Noir Central Otago 40 Syrah Hawke's Bay, 56 Pinot Gris Marlborough
C 6: 14 Bordeaux Blend Hawke's Bay, 33 Riesling Moutere 63 Pinot Noir Central Otago 84 Sauvignon Blanc Marlborough, 55 Chardonnay Waipara 6 Pinot Noir Martinborough Terrace 95 Syrah Hawke's Bay, 22 Chardonnay Nelson 45 Chardonnay Hawke's Bay
C 7: 62 Pinot Noir Central Otago 66 Pinot Noir Marlborough 7 Pinot Noir Martinborough, 30 Pinot Noir Martinborough
C 8: 46 Chardonnay Hawke's Bay 50 Chardonnay Kumeu 51 Chardonnay Marlborough, 49 Chardonnay Kumeu, 4 Chardonnay Martinborough 44 Chardonnay Gisborne 47 Chardonnay Hawke's Bay
© 2008 WIT PressWIT Transactions on Information and Communication Technologies, Vol 40, www.witpress.com, ISSN 1743-3517 (on-line)
Data Mining IX 137
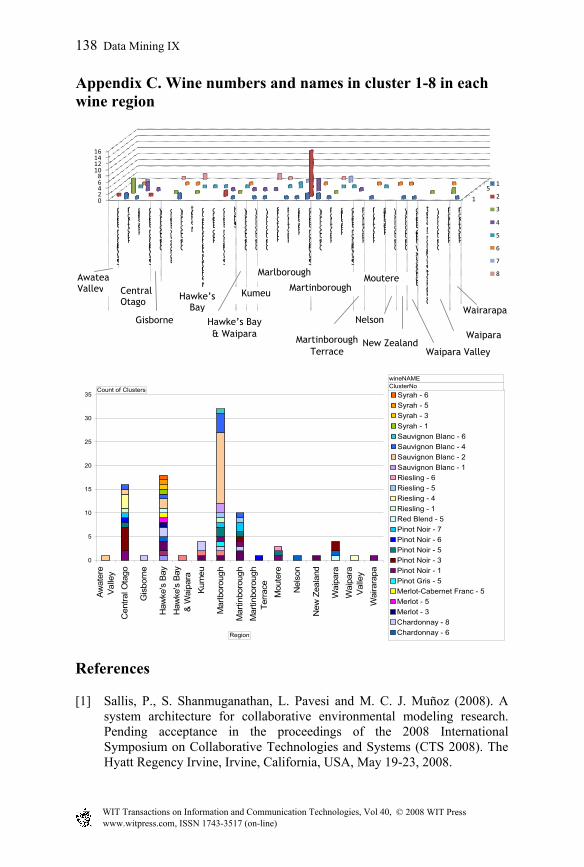
Appendix C. Wine numbers and names in cluster 1-8 in each wine region
1
5
02468
10121416
Sauvignon Blanc
Pinot Noir
Riesling
Sauvignon Blanc
Chardonnay
Bordeaux Blend
Chardonnay
Merlot
MerlotCabernet Franc
Red Blend
Sauvignon Blanc
Syrah
Chardonnay
Chardonnay
Chardonnay
Pinot Gris
Pinot Noir
Riesling
Sauvignon Blanc
Chardonnay
Pinot Noir
Riesling
Sauvignon Blanc
Pinot Noir
Pinot Noir
Riesling
Chardonnay
Chardonnay
Bordeaux White Blend
Cabernet SauvignonMerlot
Chardonnay
Pinot Noir
Pinot Noir
AwatereC OtagoGisborneHawke's Bay (HB) HB&WK MarlboroughMartinboroughMTMoutereNelNZW ValleyWaipara Wairarapa
1
2
3
4
5
6
7
8
Gisborne
Awatea Valley Central
OtagoHawke’s
Bay
Hawke’s Bay
& Waipara Martinborough
Terrace
Marlborough
Kumeu
Moutere
Nelson
New Zealand Waipara Valley
Waipara
Wairarapa
Martinborough
0
5
10
15
20
25
30
35
Aw
ater
eVa
lley
Cen
tral O
tago
Gis
born
e
Haw
ke's
Bay
Haw
ke's
Bay
& W
aipa
ra K
umeu
Mar
lbor
ough
Mar
tinbo
roug
h M
artin
boro
ugh
Terra
ce M
oute
re
Nel
son
New
Zea
land
Wai
para
Wai
para
Val
ley
Wai
rara
pa
Syrah - 6Syrah - 5Syrah - 3Syrah - 1Sauvignon Blanc - 6Sauvignon Blanc - 4Sauvignon Blanc - 2Sauvignon Blanc - 1Riesling - 6Riesling - 5Riesling - 4Riesling - 1Red Blend - 5Pinot Noir - 7Pinot Noir - 6Pinot Noir - 5Pinot Noir - 3Pinot Noir - 1Pinot Gris - 5Merlot-Cabernet Franc - 5Merlot - 5Merlot - 3Chardonnay - 8Chardonnay - 6Ch d 4
Count of Clusters
Region
wineNAMEClusterNo
References
[1] Sallis, P., S. Shanmuganathan, L. Pavesi and M. C. J. Muñoz (2008). A system architecture for collaborative environmental modeling research. Pending acceptance in the proceedings of the 2008 International Symposium on Collaborative Technologies and Systems (CTS 2008). The Hyatt Regency Irvine, Irvine, California, USA, May 19-23, 2008.
© 2008 WIT PressWIT Transactions on Information and Communication Technologies, Vol 40, www.witpress.com, ISSN 1743-3517 (on-line)
138 Data Mining IX

[2] Jones, G. V. and R. E. Davis (2000). "Climate Influences on Grapevine Phenology, Grape Composition, and Wine Production and Quality for Bordeaux, France.” American Journal of Enology and Viticulture 51(3): 249–251.
[3] Jones, G. V. (2007) "Climate Change: Observations, Projections, and General Implications’ for Viticulture and Wine Production." Economics Department-working paper No. 7, 14 pp.
[4] Godden, P.; Gishen, M. Trends in the composition of Australian wine. Aust. N.Z. Wine Ind. J. 20(5): 21–46; 2005.
[5] Grifoni, D., M. Mancini, G. Maracchi, S. Orlandini and G. Zipoli (2006). "Analysis of Italian Wine Quality Using Freely Available Meteorological Information." American Journal of Enology and Viticulture 57 (3): 339–346.
[6] Fischer, U. (2007). Wine Aroma. Flavours and Fragrances, Springer Berlin Heidelberg: 241–267.
[7] Climatmundi (2008) "Global warming or climate change." www.climatmundi.fr/lng_EN_srub_34-Global-warming.html last accessed 29/2/ 08.
[8] Parr, W. V., J. A. Green, K. G. White and R. R. Sherlock (2007). "The distinctive flavour of New Zealand Sauvignon blanc: Sensory characterisation by wine professionals." Food Quality and Preference 18:6 September 2007:849–861.
[9] Douglas, D., M. A. Cliff and A. G. Reynolds (2001). "Canadian terroir: characterization of Riesling wines from the Niagara Peninsula." Food Research International 34 (2001) 559–563
[10] Knill, C. J. (2005). "Book review on Wine Tasting: A Professional Handbook by R. S. Jackson (2002) (Academic Press, San Diego, CA, USA)" Carbohydrate Polymers 60 (2005) 411–412.
[11] R. S. Jackson (2002). Wine Tasting: A Professional Handbook, Academic Press, San Diego, CA, USA. xviC295 pp.
[12] Wendy V. Parr, K. Geoffrey White, David A. Heatherbell (2004), Exploring the nature of wine expertise: what underlies wine experts’ olfactory recognition memory advantage? Food Quality and Preference 15 (2004) 411–420 pp. www.elsevier.com/locate/foodqual.
[13] Mónica Bécue-Bertaut, Ramón Á lvarez-Esteban and Jérôme Pagès (2008) Rating of products through scores and free-text assertions: Comparing and combining both in Food Quality and Preference 19 (2008) 122–134 pp.
[14] Annie Vannier, Olivier X. Bruna and Max H. Feinberg (1999) Application of sensory analysis to champagne wine characterisation and discrimination in Food Quality and Preference 10 (1999) 101–107 pp.
[15] www.iso.org/iso/catalogue_detail?csnumber=90021. last accessed 29/2/08 [16] www.winemag.com/buyingguide/search.asp?db=. last accessed 29/2/08
© 2008 WIT PressWIT Transactions on Information and Communication Technologies, Vol 40, www.witpress.com, ISSN 1743-3517 (on-line)
Data Mining IX 139