Koechlin’s volume: Perception of © The Author(s) 2016 sound … · 2017-02-17 · Koechlin’s...
20
Musicae Scientiae 2017, Vol. 21(1) 113–131 © The Author(s) 2016 Reprints and permissions: sagepub.co.uk/journalsPermissions.nav DOI: 10.1177/1029864916649638 journals.sagepub.com/home/msx Koechlin’s volume: Perception of sound extensity among instrument timbres from different families Frédéric Chiasson Université de Montréal, Canada Caroline Traube Université de Montréal, Canada Clément Lagarrigue Université de Montréal, Canada Stephen McAdams McGill University, Canada Abstract Charles Koechlin’s Traité de l’orchestration ascribes different dimensions to timbre than those usually discussed in multidimensional scaling studies: “volume” or grosseur, related to extensity (the sound’s perceived size), and intensity, related to loudness. Koechlin also provides volume rankings for orchestral instruments in different registers. Studies show that humans, as well as several animal species, perceive extensity for many sound sources, but none has demonstrated its relevance for musical instruments from different families. To test extensity, samples of seven orchestral instruments equalized in pitch, but not in loudness, were used. Task 1 required participants to order eight sets of samples on a largeness (grosseur) scale from “less large” (moins gros) to “larger” (plus gros). Task 2 required them to quantify the sounds’ largeness compared to a reference sample on a ratio scale. Both studies show that participants share a common extensity perception for instrument timbres of different families that is very similar to Koechlin’s proposed scale. This perception seems to be related to spectral shape and particularly to acoustic energy in the lower frequencies. Perception of this attribute is unrelated to musical training, native language, and the presence of minor hearing loss, which suggests that extensity could be a universal attribute of timbre perception that is useful in orchestration practice and theory. Keywords auditory size, extensity, Koechlin, largeness, orchestration, timbre, volume Corresponding author: Frédéric Chiasson, Université de Montréal, Faculté de musique, 200, Avenue Vincent d’Indy C.P. 6128, succursale Centre-ville, Montréal, Quebec H3C 3J7, Canada. Email: [email protected] 649638MSX 0 0 10.1177/1029864916649638Musicae ScientiaeChiasson et al. research-article 2016 Article
Transcript of Koechlin’s volume: Perception of © The Author(s) 2016 sound … · 2017-02-17 · Koechlin’s...
https://doi.org/10.1177/1029864916649638
Musicae Scientiae2017, Vol. 21(1) 113 –131
© The Author(s) 2016Reprints and permissions:
sagepub.co.uk/journalsPermissions.navDOI: 10.1177/1029864916649638
journals.sagepub.com/home/msx
Koechlin’s volume: Perception of sound extensity among instrument timbres from different families
Frédéric ChiassonUniversité de Montréal, Canada
Caroline TraubeUniversité de Montréal, Canada
Clément LagarrigueUniversité de Montréal, Canada
Stephen McAdamsMcGill University, Canada
AbstractCharles Koechlin’s Traité de l’orchestration ascribes different dimensions to timbre than those usually discussed in multidimensional scaling studies: “volume” or grosseur, related to extensity (the sound’s perceived size), and intensity, related to loudness. Koechlin also provides volume rankings for orchestral instruments in different registers. Studies show that humans, as well as several animal species, perceive extensity for many sound sources, but none has demonstrated its relevance for musical instruments from different families. To test extensity, samples of seven orchestral instruments equalized in pitch, but not in loudness, were used. Task 1 required participants to order eight sets of samples on a largeness (grosseur) scale from “less large” (moins gros) to “larger” (plus gros). Task 2 required them to quantify the sounds’ largeness compared to a reference sample on a ratio scale. Both studies show that participants share a common extensity perception for instrument timbres of different families that is very similar to Koechlin’s proposed scale. This perception seems to be related to spectral shape and particularly to acoustic energy in the lower frequencies. Perception of this attribute is unrelated to musical training, native language, and the presence of minor hearing loss, which suggests that extensity could be a universal attribute of timbre perception that is useful in orchestration practice and theory.
Keywordsauditory size, extensity, Koechlin, largeness, orchestration, timbre, volume
Corresponding author:Frédéric Chiasson, Université de Montréal, Faculté de musique, 200, Avenue Vincent d’Indy C.P. 6128, succursale Centre-ville, Montréal, Quebec H3C 3J7, Canada. Email: [email protected]
649638 MSX0010.1177/1029864916649638Musicae ScientiaeChiasson et al.research-article2016
Article
114 Musicae Scientiae 21(1)
Many researchers, such as Hajda, Kendall, Carterette, and Harshberger (1997), have pointed out that the official ANSI psychophysical definition of timbre – “that attribute of auditory sensation in terms of which a subject can judge that two sounds similarly pre-sented and having the same loudness and pitch are dissimilar” – is problematic for its study. Still, most multidimensional scaling (MDS) studies on timbre have based their research methodology on this definition, equalizing loudness and pitch to find the acoustic factors that contribute to timbre perception (e.g., McAdams, Winsberg, Donnadieu, De Soete, & Krimphoff, 1995). Hajda et al. (1997) reviewed many MDS studies of timbre and deter-mined that spectral centroid was the most salient acoustic measure for timbre perception in continuous sounds. Peeters, Giordano, Susini, Misdariis, and McAdams (2011) conducted a correlational analysis, followed by hierarchical clustering, on a large set of acoustic descrip-tors of timbre across pitch, dynamics and articulation on a database of about 6000 musical instrument sounds and identified 10 classes of primary descriptors. The four largest groups included: 1) the central tendency of time-varying spectral properties (e.g., spectral cen-troid), 2) the temporal variability of the time-varying spectral properties (e.g., spectral vari-ation), 3) global energetic properties (e.g., energy of harmonic and noise components) and properties of the temporal envelope (e.g., attack and decay times), and 4) descriptors of signal periodicity (e.g., noisiness and inharmonicity).
Obviously, musicians do not use such acoustic terminology to describe the perceptual attrib-utes of instrumental sounds but rather use a more intuitive set of verbal descriptors referring to the roundness, sweetness, sharpness, brightness, openness or largeness of sound. The French composer Charles Koechlin, author of an important orchestration treatise (1954–1959), has proposed a unique orchestration system that uses general timbre descriptors to explain the sound of diverse orchestrations by Bach, Mozart, Beethoven, Berlioz, Wagner, Bizet, Debussy, Ravel, Stravinsky, Milhaud, and Schoenberg. One crucial timbre dimension Koechlin discusses in this treaty is designated by the term volume (Koechlin, 1954–1959, Vol. I, p. 220). This is the perceptual attribute that we are investigating in this study.
Koechlin’s orchestration system
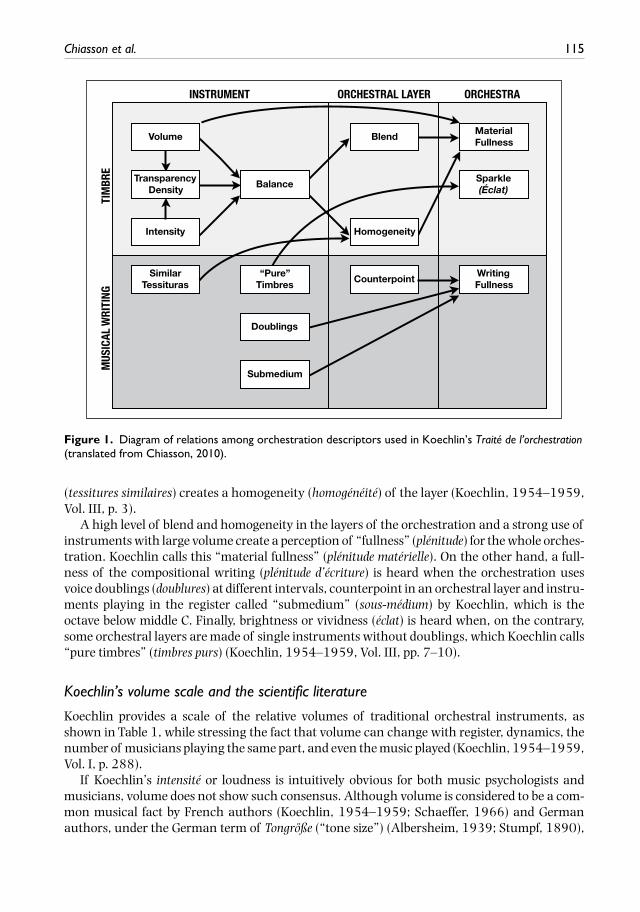
Koechlin uses volume and intensité as the basic timbre descriptors for a complex and highly refined orchestration “system” (Koechlin, 1954–1959, Vol. I, p. 220). He does not describe this system as such, but a careful reading of his Traité de l’orchestration shows coherent relations among the timbre descriptors used in a way that makes it possible to reconstitute the system. Figure 1 shows the relations among descriptors for orchestration, according to the musical “object” defined: instrument, orchestral layer or the whole orchestra (Chiasson, 2010).
Volume corresponds to the extensity of an instrument sound, the space it seems to occupy in the auditory scene. Intensity (intensité) corresponds to its perceived loudness or strength. Both qualities are used to evaluate the instrument timbre’s transparency (transparence) or its oppo-site, density (densité) (Koechlin, 1954–1959, Vol. I, p. 220). A timbre is dense when it has a high intensity with a small volume, whereas it is transparent when it has a low intensity and a large volume. When other musical parameters are similar, a dense timbre is heard in the fore-ground and a transparent timbre in the background, so these parameters may affect figure/ground perception in orchestral music.
Timbres with similar volume and intensity are balanced (équilibré) (Koechlin, 1954–1959, Vol. I, p. 223). This balance is required for instruments to blend (fondre) into an orchestral layer (plan orchestral). A high degree of blend (fondu) between similar instruments (most of the time between instruments from the same family, like strings) playing in similar registers
Chiasson et al. 115
(tessitures similaires) creates a homogeneity (homogénéité) of the layer (Koechlin, 1954–1959, Vol. III, p. 3).
A high level of blend and homogeneity in the layers of the orchestration and a strong use of instruments with large volume create a perception of “fullness” (plénitude) for the whole orches-tration. Koechlin calls this “material fullness” (plénitude matérielle). On the other hand, a full-ness of the compositional writing (plénitude d’écriture) is heard when the orchestration uses voice doublings (doublures) at different intervals, counterpoint in an orchestral layer and instru-ments playing in the register called “submedium” (sous-médium) by Koechlin, which is the octave below middle C. Finally, brightness or vividness (éclat) is heard when, on the contrary, some orchestral layers are made of single instruments without doublings, which Koechlin calls “pure timbres” (timbres purs) (Koechlin, 1954–1959, Vol. III, pp. 7–10).
Koechlin’s volume scale and the scientific literature
Koechlin provides a scale of the relative volumes of traditional orchestral instruments, as shown in Table 1, while stressing the fact that volume can change with register, dynamics, the number of musicians playing the same part, and even the music played (Koechlin, 1954–1959, Vol. I, p. 288).
If Koechlin’s intensité or loudness is intuitively obvious for both music psychologists and musicians, volume does not show such consensus. Although volume is considered to be a com-mon musical fact by French authors (Koechlin, 1954–1959; Schaeffer, 1966) and German authors, under the German term of Tongröße (“tone size”) (Albersheim, 1939; Stumpf, 1890),
Figure 1. Diagram of relations among orchestration descriptors used in Koechlin’s Traité de l’orchestration (translated from Chiasson, 2010).
116 Musicae Scientiae 21(1)
most timbre studies in the field of psychoacoustics do not mention any volume- or acoustic-size-related dimension (Giordano & McAdams, 2006; Hajda et al., 1997). However, one MDS study on violin timbre as perceived by musical experts does have a “narrow/full” dimension that indirectly relates to the “thin” and “large” descriptors of the volume scale (Štĕpánek, 2006). Also, Kendall and Carterette (1993) have listed verbal descriptors that seem to relate to volume in Walter Piston’s Orchestration – “voluminous” (violin), “full” (cello, trombone, heckel-phone), “broad” (horn), etc. These descriptors, found in most orchestration treatises (e.g., Adler, 2002; Blatter, 1997; Piston, 1955; Rimsky-Korsakoff & Steinberg, 1914), are mostly specific to an instrument or a unique combination of instruments. Verbal descriptors related to volume – full, open, thick versus small, closed and thin – are used by performers in pedagogical or rehearsal contexts (Traube & Depalle, 2004).
It should be noted that the concept of volume, defined as “an apparent largeness and exten-siveness,” has been investigated by the pioneer of psychoacoustics S. S. Stevens. With different collaborators, he conducted a first group of studies on the volume perception of pure sounds. They observed that the volume of pure sounds increased when loudness increased and pitch decreased (Stevens & Davis, 1938; Terrace & Stevens, 1962), and that loudness was a product of volume and density (Stevens, Guirao, & Slawson, 1965), the same relation proposed by Koechlin (1954–1959).1
In this paper, we have chosen to use the term extensity to refer to the concept of volume as defined by Koechlin and as used by Stevens in his studies. Stevens himself acknowledges the current ambiguity of the word, because when “the radio-engineer speaks of […] the ‘volume control’ of a radio set, […] he means […] what we should probably call intensity” (Terrace & Stevens, 1962, p. 597).
The term extensity can be found in early texts in the psychology of perception. For example, Edward Titchener in 1896 defined extensity as an “impression that a sensation or image is more or less spread out in space” (cited in Hergenhahn & Henley, 2013, p. 261). Erickson (1975, p. 144) uses the term extensity as the “bigness”, “spaciousness, broadness [and] diffuse-ness of a sound”. In the field of auditory perception, the expression auditory size has also been used, such as in recent studies using human voice stimuli (Smith, Patterson, Turner, Kawahara, & Irino, 2005), noise bands (Cabrera & Tilley, 2003), and musical instruments from the same family (Dinther & Patterson, 2006). Auditory size perception has also been investigated in other animal species (Fitch, 1997; Huron, Kinney, & Precoda, 2006; Reby & McComb, 2003). We
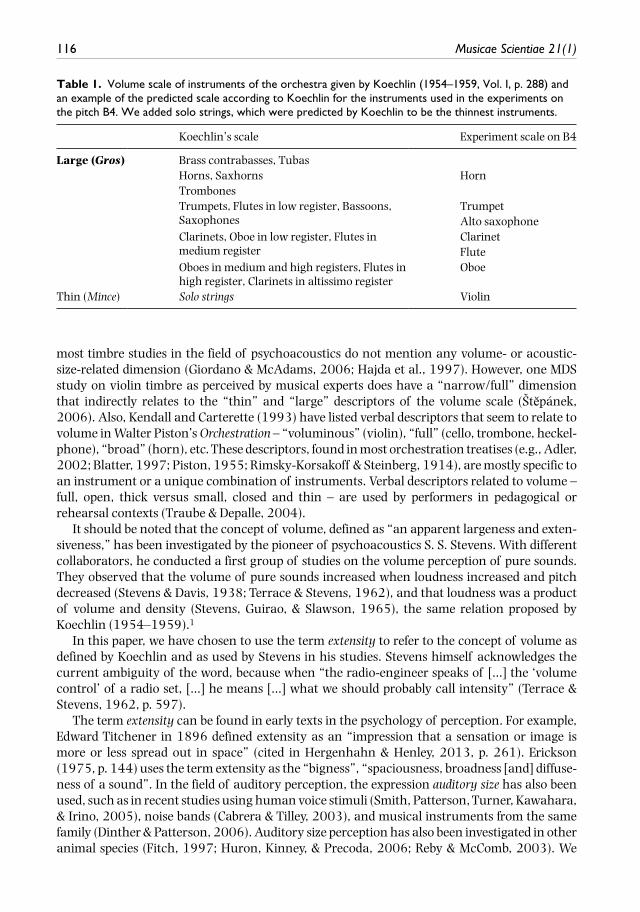
Table 1. Volume scale of instruments of the orchestra given by Koechlin (1954–1959, Vol. I, p. 288) and an example of the predicted scale according to Koechlin for the instruments used in the experiments on the pitch B4. We added solo strings, which were predicted by Koechlin to be the thinnest instruments.
Koechlin’s scale Experiment scale on B4
Large (Gros) Brass contrabasses, Tubas Horns, Saxhorns Horn Trombones Trumpets, Flutes in low register, Bassoons,
SaxophonesTrumpet
Alto saxophone Clarinets, Oboe in low register, Flutes in
medium registerClarinet
Flute Oboes in medium and high registers, Flutes in
high register, Clarinets in altissimo registerOboe
Thin (Mince) Solo strings Violin
Chiasson et al. 117
have adopted the term extensity as it is less ambiguous than volume, and it refers to a sensation that is inherent to the sound and independent of the size of the sound-producing object itself.
General methods
The purpose of our first experiment was to verify whether participants’ rankings of extensity differences among sounds of musical instruments from different families on an ordinal scale correspond to the relations theorized by Koechlin (Exp. 1). We also wanted to know whether participants can quantify extensity in instrument sounds using a ratio estimation procedure (Exp. 2), as has been done with pure sounds in Terrace and Stevens (1962).
Stimuli
Koechlin developed his volume scale based on his own experience hearing musical instruments during numerous concerts. The major issue concerning the instrument samples was to find a sample bank that kept the loudness differences between instruments as they would be heard in a concert hall. The oboe, for instance, rarely plays louder than a trumpet in a concert. However, this loudness ratio is often lost with the loudness equalization often required in MDS studies. Due to the different recording conditions used for each instrument to produce instrumental sound databases such as the McGill University Master Samples (Opolko & Wapnick, 1989), the oboe sounds louder than the trumpet, which is unrealistic for an orchestrator. The difference in loudness between concert and laboratory situations would probably create a significant differ-ence in the extensity of each instrument.
In the Music Instrument Samples database from the Electronic Music Studio of the University of Iowa (Fritts, n.d.), each instrument is recorded at various dynamic levels as controlled by the player, from pianissimo to fortissimo. The sound pressure level of the samples is not normalized, and this is why we chose to work with this database.
All instruments were recorded in the Anechoic Chamber in the Wendell Johnson Speech and Hearing Center at The University of Iowa using a Neumann KM 84 cardioid condenser micro-phone (Georg Neumann GmbH, Berlin, Germany) and a Mackie 1402-VLZ mixer (Loud Technologies, Inc., Woodinville, WA) with a Panasonic SV-3800 DAT recorder (Panasonic Corp., Osaka, Japan). All instruments were played at a distance of 1.5 m from the microphone.
Seven instruments from among those covered in Koechlin’s volume scale were used: violin, flute, oboe, B♭clarinet, alto saxophone, C trumpet and French horn (hereafter simply “horn”). We used samples of these instruments playing F or B in octaves 3, 4 or 5 (A4 = 440 Hz), accord-ing to the available range of each instrument (Table 2). The horn playing F3 is absent, because the horn samples in octave 3 were not available. Each instrument was recorded playing at a dynamic marking of mf, the choice of loudness being left to the player and following the instru-ment’s capacities. All instruments were played without vibrato and were recorded in mono, 16 bit, 44.1 kHz, AIFF format.
All samples were 1 second in duration for this study, with a linear fade-out over the last 100 ms. Onsets were kept in their original form for all samples. No loudness equalization was per-formed to keep the natural loudness differences among the instruments and to be closer to the “natural” concert situation. Pitch equalization was used, however. The mean pitch deviation from equal temperament was calculated for each sample with Praat (University of Amsterdam, the Netherlands) and then transposed to equal temperament using the Elastic Pitch tool in Pro Tools 8 LE (Bias, Inc., Petaluma, CA). The mean correction was 13.2 cents. Apart from the horn B3 sample, tuned down by 116 cents because it was produced with the C4 sample, the maxi-mum correction was 32.1 cents.

118 Musicae Scientiae 21(1)
Apparatus
Participants were seated in a sound-attenuated room. The samples were played on two loud-speakers separated by 155 cm, facing the participant, whose chair was approximately 75 cm from the line between the two speakers. The middle of each speaker was 112 cm high, approxi-mately at the same level as the participant’s head. The computer screen was at the exact middle of the line between the speakers. The trumpet B5 sample, which was the loudest, was calibrated to 75 dB SPL (C-weighting) for all participants using a Quest SE SoundPro DL 1/3 Octave level meter (3M Detection Solutions, Oconomowoc, WI) on the slow rate setting, positioned at the same position as the center of the listener’s head when seated.
Participants
The 80 participants consisted of 40 native francophones and 40 native anglophones, with equal numbers of musicians and nonmusicians in each group. Among the anglophones, 22 were not fluent in French in terms of listening, speaking, reading or writing. Forty participants
Table 2. Series of instrument samples in Experiment 1 (columns) and their rankings according to Koechlin’s volume scale. The first six series use a single pitch (F3–B5). The last two series use different pitches. Series 7 (TransA – light grey) uses instruments with predicted increasing extensity with increasing pitch, whereas Series 8 (TransB – dark grey) uses instruments with decreasing extensity with increasing pitch.
Volume rank F3 B3 F4 B4 F5 B5
5 Horn Horn Horn Horn
4 Saxophone, Trumpet
Flute, Saxophone, Trumpet
Flute, Saxophone, Trumpet
Saxophone, Trumpet
Saxophone, Trumpet
Trumpet
3 Clarinet Clarinet, Oboe
Clarinet, Oboe Clarinet, Flute
Clarinet, Flute
Clarinet, Flute
2 Oboe Oboe Oboe
1 Violin Violin Violin Violin Violin
Series 1 Series 2 Series 3 Series 4 Series 5 Series 6
Volume rank F3 B3 F4 B4 F5 B5
5 Horn
4 Flute, Saxophone, Trumpet
Flute, Saxophone, Trumpet
3 Clarinet, Oboe
Clarinet, (Oboe not used)
2 Oboe
1 Violin
Series 7 (TransA)
Series 8 (TransB)
Chiasson et al. 119
were professional musicians or music students with at least an undergraduate level, and 40 were either amateur musicians not studying in music or nonmusicians. Fifty-eight participants had normal hearing with no hearing loss of more than 20 dB SPL in both ears as measured with a standard audiometric procedure (ISO 389-8, 2004; Martin & Champlin, 2000), and 22 had some hearing loss over 20 dB or other minor hearing problems (mostly tinnitus). Before doing both experiments, all participants signed an informed-consent form and filled out a ques-tionnaire concerning language, hearing issues, music listening habits, instrumental practice, and music theory knowledge. After the experiments, participants were questioned by the exper-imenter concerning their listening strategies and strategies for performing the tasks in both experiments. All participants took part in both experiments.
Experiment 1
Method
In the first experiment, participants were asked to rank eight sets of samples in order of grosseur (for francophones) or “largeness” (for anglophones) from moins gros or “less large” to plus gros or “larger”. As mentioned earlier, the word “volume” is now confused with acoustic intensity or loudness (which we observed during the pilot study), so we replaced Koechlin’s term “volume” with grosseur in French, and “largeness” in English. The instructions were presented on a soft-ware interface that was programmed in Max/MSP (Cycling 74, San Francisco, CA).
For each series, the experimental interface presented a number of boxes at the top of the screen and an equivalent number of baskets below. Each box represented a sample to be ranked in this series and the baskets represented the largeness ranks. The initial order of sample boxes was ran-domized for each series. Participants had to double-click on the box to hear the sample and to drag the box to a basket. They were asked to put all boxes in order of largeness in the baskets, one box per basket. They were also asked to listen to all samples during the process and to confirm their volume ranking by listening to all samples in order before proceeding to the next series.
Before the main set, a practice set was performed with the experimenter present, with samples of horn, flute, oboe, saxophone and violin playing B4. The experimenter gave no feedback con-cerning the accuracy of answers according to Koechlin’s scale. Then in the main set, partici-pants ranked six single-pitch sets, then two trans-pitch sets (Table 2). The presentation orders of the six single-pitch sets and of the two trans-pitch sets were randomized for each participant.
Results
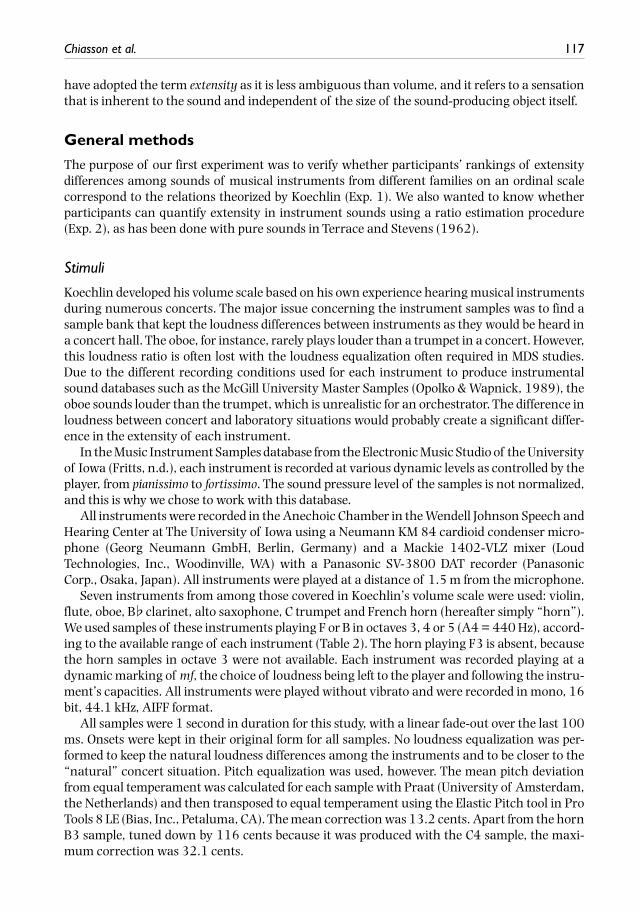
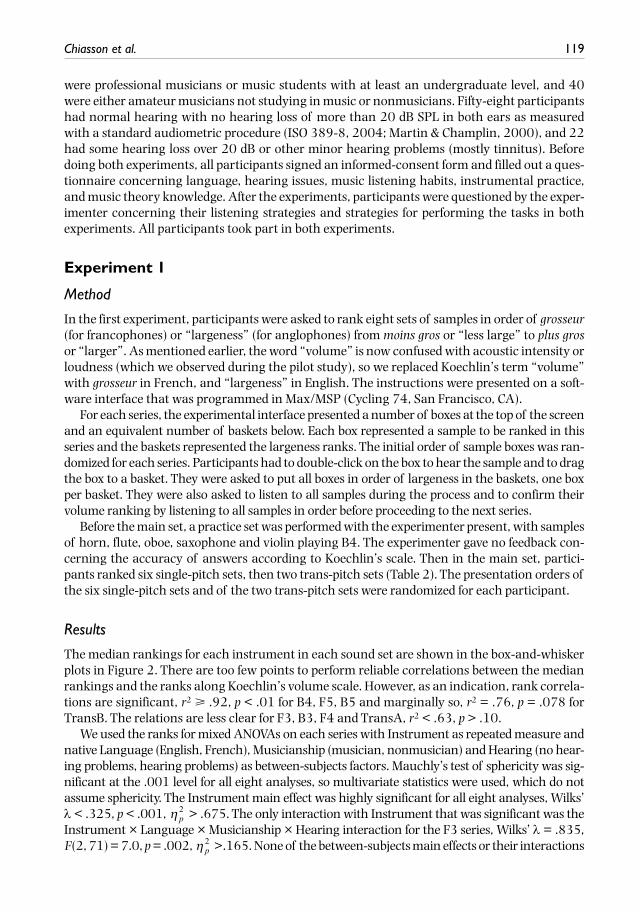
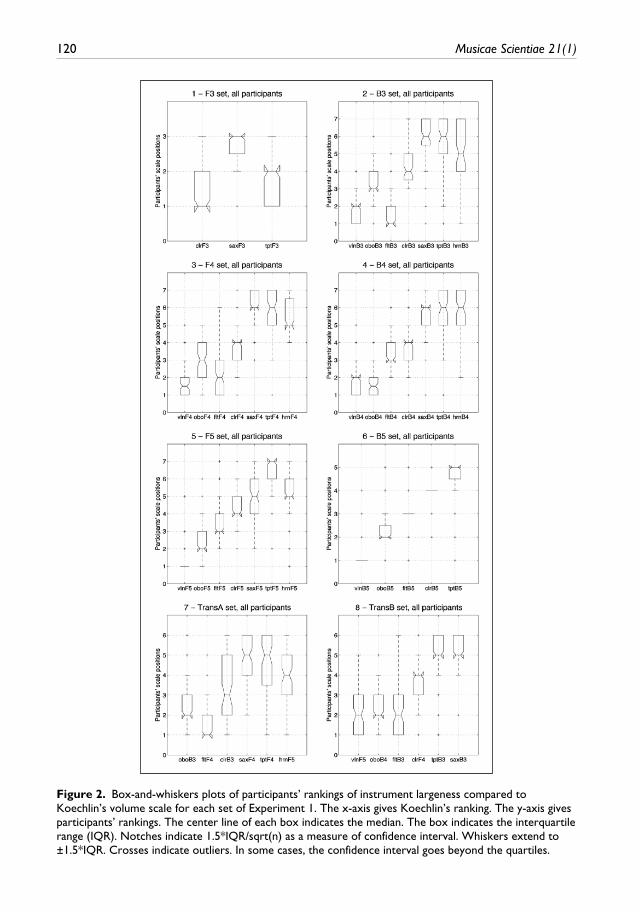
The median rankings for each instrument in each sound set are shown in the box-and-whisker plots in Figure 2. There are too few points to perform reliable correlations between the median rankings and the ranks along Koechlin’s volume scale. However, as an indication, rank correla-tions are significant, r2 ⩾ .92, p < .01 for B4, F5, B5 and marginally so, r2 = .76, p = .078 for TransB. The relations are less clear for F3, B3, F4 and TransA, r2 < .63, p > .10.
We used the ranks for mixed ANOVAs on each series with Instrument as repeated measure and native Language (English, French), Musicianship (musician, nonmusician) and Hearing (no hear-ing problems, hearing problems) as between-subjects factors. Mauchly’s test of sphericity was sig-nificant at the .001 level for all eight analyses, so multivariate statistics were used, which do not assume sphericity. The Instrument main effect was highly significant for all eight analyses, Wilks’ λ < .325, p < .001, η p
2 > .675. The only interaction with Instrument that was significant was the Instrument × Language × Musicianship × Hearing interaction for the F3 series, Wilks’ λ = .835, F(2, 71) = 7.0, p = .002, η p
2 >.165. None of the between-subjects main effects or their interactions
120 Musicae Scientiae 21(1)
Figure 2. Box-and-whiskers plots of participants’ rankings of instrument largeness compared to Koechlin’s volume scale for each set of Experiment 1. The x-axis gives Koechlin’s ranking. The y-axis gives participants’ rankings. The center line of each box indicates the median. The box indicates the interquartile range (IQR). Notches indicate 1.5*IQR/sqrt(n) as a measure of confidence interval. Whiskers extend to ±1.5*IQR. Crosses indicate outliers. In some cases, the confidence interval goes beyond the quartiles.
Chiasson et al. 121
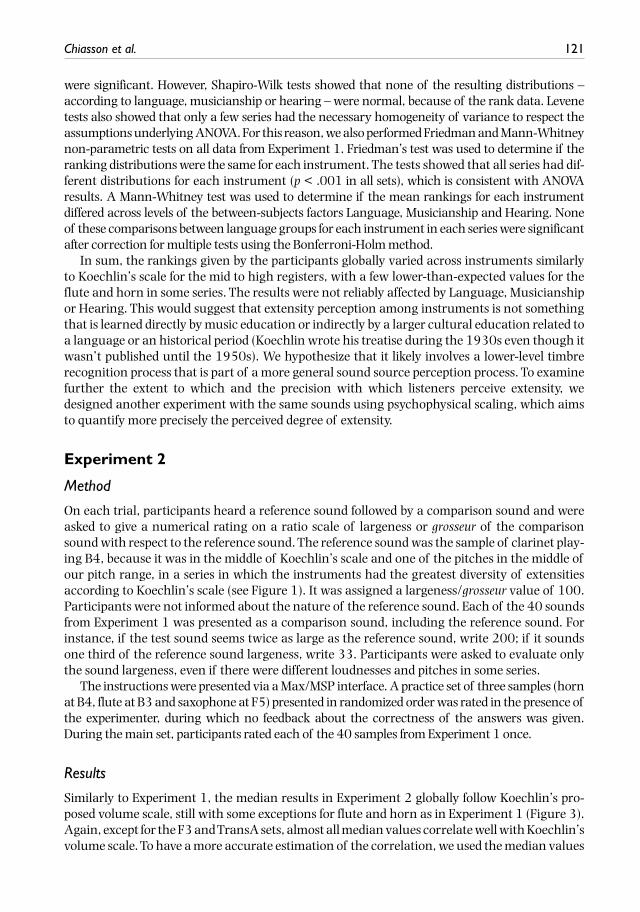
were significant. However, Shapiro-Wilk tests showed that none of the resulting distributions – according to language, musicianship or hearing – were normal, because of the rank data. Levene tests also showed that only a few series had the necessary homogeneity of variance to respect the assumptions underlying ANOVA. For this reason, we also performed Friedman and Mann-Whitney non-parametric tests on all data from Experiment 1. Friedman’s test was used to determine if the ranking distributions were the same for each instrument. The tests showed that all series had dif-ferent distributions for each instrument (p < .001 in all sets), which is consistent with ANOVA results. A Mann-Whitney test was used to determine if the mean rankings for each instrument differed across levels of the between-subjects factors Language, Musicianship and Hearing. None of these comparisons between language groups for each instrument in each series were significant after correction for multiple tests using the Bonferroni-Holm method.
In sum, the rankings given by the participants globally varied across instruments similarly to Koechlin’s scale for the mid to high registers, with a few lower-than-expected values for the flute and horn in some series. The results were not reliably affected by Language, Musicianship or Hearing. This would suggest that extensity perception among instruments is not something that is learned directly by music education or indirectly by a larger cultural education related to a language or an historical period (Koechlin wrote his treatise during the 1930s even though it wasn’t published until the 1950s). We hypothesize that it likely involves a lower-level timbre recognition process that is part of a more general sound source perception process. To examine further the extent to which and the precision with which listeners perceive extensity, we designed another experiment with the same sounds using psychophysical scaling, which aims to quantify more precisely the perceived degree of extensity.
Experiment 2
Method
On each trial, participants heard a reference sound followed by a comparison sound and were asked to give a numerical rating on a ratio scale of largeness or grosseur of the comparison sound with respect to the reference sound. The reference sound was the sample of clarinet play-ing B4, because it was in the middle of Koechlin’s scale and one of the pitches in the middle of our pitch range, in a series in which the instruments had the greatest diversity of extensities according to Koechlin’s scale (see Figure 1). It was assigned a largeness/grosseur value of 100. Participants were not informed about the nature of the reference sound. Each of the 40 sounds from Experiment 1 was presented as a comparison sound, including the reference sound. For instance, if the test sound seems twice as large as the reference sound, write 200; if it sounds one third of the reference sound largeness, write 33. Participants were asked to evaluate only the sound largeness, even if there were different loudnesses and pitches in some series.
The instructions were presented via a Max/MSP interface. A practice set of three samples (horn at B4, flute at B3 and saxophone at F5) presented in randomized order was rated in the presence of the experimenter, during which no feedback about the correctness of the answers was given. During the main set, participants rated each of the 40 samples from Experiment 1 once.
Results
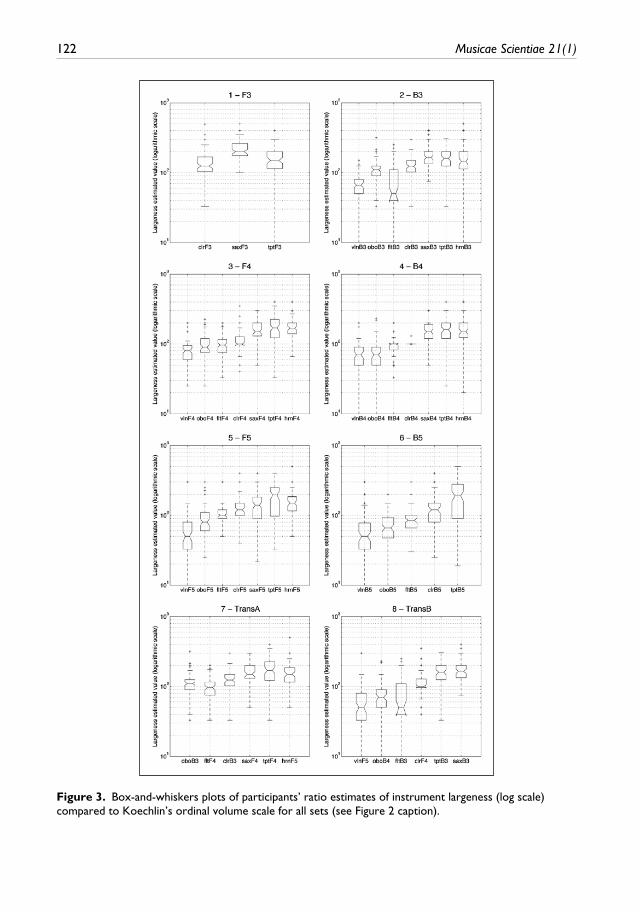
Similarly to Experiment 1, the median results in Experiment 2 globally follow Koechlin’s pro-posed volume scale, still with some exceptions for flute and horn as in Experiment 1 (Figure 3). Again, except for the F3 and TransA sets, almost all median values correlate well with Koechlin’s volume scale. To have a more accurate estimation of the correlation, we used the median values
122 Musicae Scientiae 21(1)
Figure 3. Box-and-whiskers plots of participants’ ratio estimates of instrument largeness (log scale) compared to Koechlin’s ordinal volume scale for all sets (see Figure 2 caption).
Chiasson et al. 123
from Experiment 2 to calculate the instrument ranks. We then computed Spearman correla-tions between the median ranks of each series and Koechlin’s scale. The correlations between predicted extensity scales according to Koechlin and participants’ mean largeness scales are significant for all groups and explain 73% to 83% of the variance in the data.
In line with S. S. Stevens’ (1971) power law, we used the log of each ratio estimation as the dependent variable for mixed ANOVAs on each sound set, with Instrument as repeated measure and native Language (English, French), Musicianship (musician, nonmusician) and Hearing (no hearing problems, hearing problems) as between-subjects factors. Mauchly’s test of sphericity was significant at the p < .001 level for all eight analyses, so multivariate statistics were used, which do not assume sphericity. This time, Shapiro-Wilk tests showed that most of the data were normally distributed for levels of the factors Language, Musicianship and Hearing. Levene tests also showed that most of the data respected the homogeneity of variance assumption. Levene tests that rejected the null hypothesis of homogeneity of variance were on Instruments related to Musicianship (clarinet in series F3, B3 and B5; flute in series F4, B4, F5 and B5; saxophone in series B4 and F5; horn in series F5; oboe in series B5). The main effect of Instrument was highly significant for all eight series, Wilks λ < .443, p < .001, ηp
2 >.557. Instrument × Language inter-actions were significant only for series B4, λ = .83, F(6, 67) = 2.30, p = .045, ηp
2 = .170, and F5, λ = .781, F(6, 67) = 3.13, p = .009, ηp
2 = .219. The Instrument × Musicianship × Hearing interaction was significant only for series B3, λ = .78, F(6, 67) = 3.09, p = .01, ηp
2 = .217, and TransA, λ = .76, F(5, 68) = 4.30, p = .002, ηp
2 = .240. The effect of these variables is fairly small compared to that of the Instrument main effect, and they don’t seem to be systematic enough in pattern to interpret. T-tests comparing groups for Musicianship and Hearing on each instru-ment in each series revealed only one significant comparison after Bonferroni-Holm correction: the violin in the B4 series for the two Language groups, t(78) = −2.39, p < .001.
The ANOVAs did not reveal any significant influence of Musicianship and Hearing factors on the data (p > .19 in all cases). Mann-Whitney tests revealed an influence of Musicianship only for saxophone in the F3 series (p = .004), as well as a significant influence of Hearing on trumpet extensity in five of the eight series (p < .047 in all five cases) and on flute (p = .043). In all concerned series, trumpet is heard as smaller by participants with hearing problems than by participants with normal hearing.
Again, Instrument is the most salient factor in the results for Experiment 2. Although Language has a significant effect in some cases, it does not have a great effect on the extensity ratio scaling of instruments. These results are consistent with the results of Experiment 1.
Discussion
As for Experiment 1, the results from Experiment 2 show that except for the F3 and TransA series, participants have a common relative extensity perception of the instrument samples, which is again correlated with Koechlin’s scale (Table 4), and the rank correlation again increases with pitch. Koechlin’s scale seems to be able to roughly predict participants’ extensity rankings, even when they are asked to give numerical estimations of extensity to instruments in random order, with no grouping according to series.
Instrument is the most significant factor for extensity rankings. While most instrument rankings follow Koechlin’s scale, there is one strong discrepancy between the participants’ scale and Koechlin’s: the place of the flute in its low register. Koechlin insists in his Traité that the flute in its low register is as large as the trumpet at the same pitch. However, participants estimated the flute’s extensity as much lower than most instruments, even as the lowest for the B3 series. This difference is observed for all participant groups.
124 Musicae Scientiae 21(1)
A slighter discrepancy can also be seen between participants’ and Koechlin’s scales for the place of the horn. According to Koechlin, the horn should be the instrument sounding the larg-est among our set. In our experiments, it is still at the largest end of the scale, but shares its position with trumpet and saxophone. Thus, the horn sounds somewhat smaller for our partici-pants than for Koechlin.
With the actual data and settings, the reason for the discrepancies in extensity rankings for flute and horn is hard to determine. It could be caused by a difference in the perception of these instruments between the experimental and normal concert contexts. The places of both musi-cians and listeners in the concert hall and the hall’s own acoustic characteristics affect the perceived timbre and could enlarge the extensity of these instruments. It could also be caused by Koechlin’s particular way of perceiving flute and horn extensities, which are not shared by other listeners.
Language is also a significant factor for most series, but this influence is small. In Experiment 2, Hearing was a significant factor affecting Trumpet largeness ratings, but again, this influence is small. These results provide evidence for a common extensity perception by Koechlin and our listeners that is only minimally affected by language, musical training or minor hearing prob-lems. The relation between median extensity scalings and Koechlin’s volume rankings show a very similar pattern to those from Experiment 1 in spite of the differences in the tasks (ordinal ranking and ratio scaling). Indeed the Spearman rank correlation coefficients between the median values in the two experiments vary from r = .87 to r = 1.00 across the eight series. Table 3 juxtaposes the rankings derived from Koechlin’s Traité and from Experiments 1 and 2. Values from the experiments that are not statistically different are shown in the same rank categories.
Acoustic correlates of extensity
Having demonstrated differences in extensity across instruments and pitch registers, we now turn our attention to establishing an acoustic basis for the perception of extensity. A Principal Component Analysis (PCA) with Varimax rotation and Kaiser normalization was used first to determine the number of independent latent variables representing a set of 12 acoustic descriptors. We then compared them to the median results from Experiment 2, because the numerical nature of extensity ratio scaling gives a more precise correlation with the acoustic descriptors used, and at any rate, the median results in both experiments are highly corre-lated. In concordance with the literature on psychophysical scaling (Stevens, 1975), we used the logarithm (base 10) of the extensity values. The descriptors included loudness (in sones), spectral centroid (a measure of the amplitude-weighted average frequency of the spectrum, hereafter referred to as absolute spectral centroid), fundamental frequency (F0), the spectral centroid/F0 ratio (centroid expressed in harmonic rank independently of the fundamental fre-quency, referred to hereafter as relative spectral centroid), spectral flux (a measure of spectral variation over time), spectral roll-off (frequency below which 95% of a sound’s frequency con-tent is located), spectral spread, spectral skewness, spectral kurtosis, attack time, even/odd harmonics amplitude ratio and irregularity across the amplitudes of the frequency compo-nents (spectral irregularity). All of these descriptors were computed using the MATIMBRE Matlab toolbox (Barthet, 2008).
The PCA analysis rejects components that have eigenvalues less than 1. The analysis con-verged in four iterations and extracted three components that explain 39%, 20% and 13% of the variance, respectively, for a total variance explained of 72%. The loadings of each descriptor on each component are shown in Table 4. The descriptors that load the strongest on principal component 1 (PC1) include spectral kurtosis, spectral spread, and spectral skewness, with weaker contributions from absolute spectral centroid and loudness. Note that the value of this

Chiasson et al. 125
Table 3. Koechlin’s volume scale and participants’ ordinal extensity scales from both experiments. Instruments in the same squares are considered to have similar volumes, according to Bonferroni-Holm corrected significance values. As we see in Figures 2 and 3, if notches are not overlapping, we consider them to be in separate categories. Koechlin had himself separated and clustered instruments into categories. Instruments considered to have different ranks in Koechlin’s and participants’ scales are in italics.
Koechlin’s volume rank
F3 B3 F4
Koechlin Exp. 1 Exp. 2 Koechlin Exp. 1 Exp. 2 Koechlin Exp. 1 Exp. 2
5 Horn SaxTrumpetHorn
SaxTrumpetHorn
Horn SaxTrumpetHorn
HornTrumpet
4 SaxTrumpet
Sax Sax FluteSaxTrumpet
FluteSax Trumpet
Sax
3 Clarinet TrumpetClarinet
TrumpetClarinet
Clarinet Oboe
Clarinet
Oboe
Clarinet Oboe
Clarinet Oboe
Clarinet
Oboe
Clarinet
FluteOboe
2 ViolinFlute
ViolinFlute
Flute
1 Violin Violin Violin Violin
Koechlin’s volume rank
B4 F5 B5
Koechlin Exp. 1 Exp. 2 Koechlin Exp. 1 Exp. 2 Koechlin Exp. 1 Exp. 2
5 Horn SaxTrumpetHorn
TrumpetSaxHorn
Horn Trumpet TrumpetHorn
4 Sax Trumpet
SaxTrumpet
HornSax
Trumpet Trumpet Trumpet
SaxClarinet Flute
3 Clarinet Flute
ClarinetFlute
ClarinetFlute
Clarinet Flute
Clarinet
Flute
Clarinet Flute
Clarinet
Flute
Clarinet
Flute
2 Oboe ViolinOboe
OboeViolin
Oboe Oboe Oboe Oboe Oboe Oboe
1 Violin Violin Violin Violin Violin Violin Violin
Koechlin’s volume rank
TransA TransB
Koechlin Exp. 1 Exp. 2 Koechlin Exp. 1 Exp. 2
5 Horn F5 Trumpet F4Sax F4Horn F5
Sax F4Trumpet F4Horn F5
4 Flute F4Sax F4 Trumpet F4
Flute B3Sax B3Trumpet B3
Trumpet B3Sax B3
Sax B3Trumpet B3
3 Clarinet B3Oboe B3
Clarinet B3 Clarinet B3Oboe B3
Clarinet F4 Clarinet F4 Clarinet F4
Oboe B3
2 Flute F4 Flute F4 Oboe B4 Flute B3Oboe B4Violin F5
Oboe B4
1 Violin F5 Flute B3Violin F5
126 Musicae Scientiae 21(1)
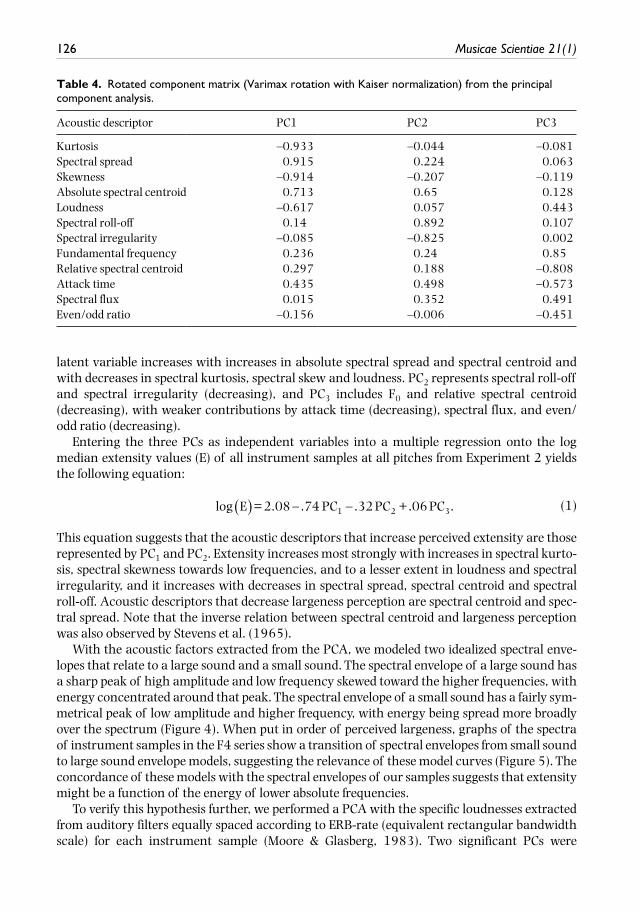
latent variable increases with increases in absolute spectral spread and spectral centroid and with decreases in spectral kurtosis, spectral skew and loudness. PC2 represents spectral roll-off and spectral irregularity (decreasing), and PC3 includes F0 and relative spectral centroid (decreasing), with weaker contributions by attack time (decreasing), spectral flux, and even/odd ratio (decreasing).
Entering the three PCs as independent variables into a multiple regression onto the log median extensity values (E) of all instrument samples at all pitches from Experiment 2 yields the following equation:
log E = 2.08 .74 PC .32 PC + .06 PC .1 2 3( ) − − (1)
This equation suggests that the acoustic descriptors that increase perceived extensity are those represented by PC1 and PC2. Extensity increases most strongly with increases in spectral kurto-sis, spectral skewness towards low frequencies, and to a lesser extent in loudness and spectral irregularity, and it increases with decreases in spectral spread, spectral centroid and spectral roll-off. Acoustic descriptors that decrease largeness perception are spectral centroid and spec-tral spread. Note that the inverse relation between spectral centroid and largeness perception was also observed by Stevens et al. (1965).
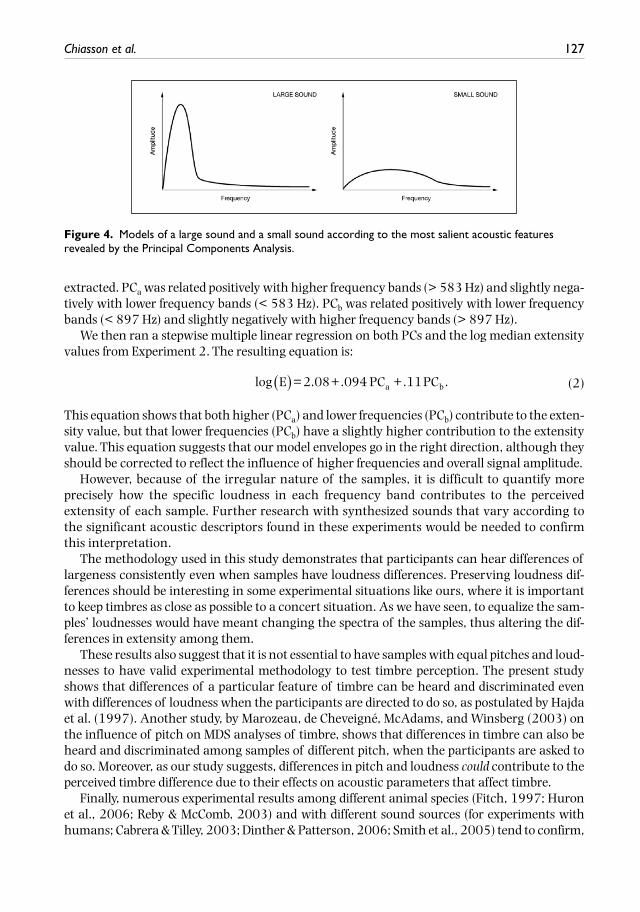
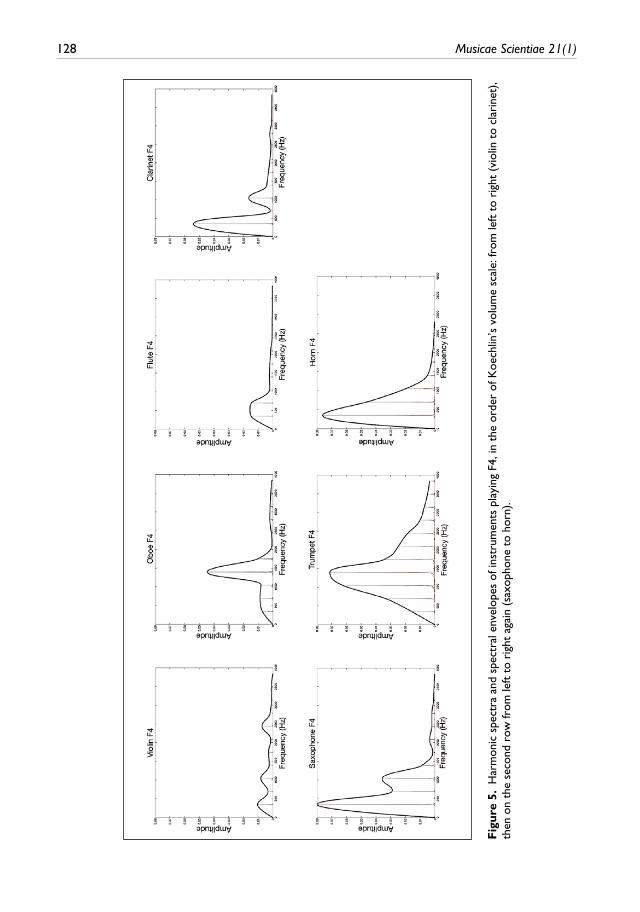
With the acoustic factors extracted from the PCA, we modeled two idealized spectral enve-lopes that relate to a large sound and a small sound. The spectral envelope of a large sound has a sharp peak of high amplitude and low frequency skewed toward the higher frequencies, with energy concentrated around that peak. The spectral envelope of a small sound has a fairly sym-metrical peak of low amplitude and higher frequency, with energy being spread more broadly over the spectrum (Figure 4). When put in order of perceived largeness, graphs of the spectra of instrument samples in the F4 series show a transition of spectral envelopes from small sound to large sound envelope models, suggesting the relevance of these model curves (Figure 5). The concordance of these models with the spectral envelopes of our samples suggests that extensity might be a function of the energy of lower absolute frequencies.
To verify this hypothesis further, we performed a PCA with the specific loudnesses extracted from auditory filters equally spaced according to ERB-rate (equivalent rectangular bandwidth scale) for each instrument sample (Moore & Glasberg, 1983). Two significant PCs were
Table 4. Rotated component matrix (Varimax rotation with Kaiser normalization) from the principal component analysis.
Acoustic descriptor PC1 PC2 PC3
Kurtosis –0.933 –0.044 –0.081Spectral spread 0.915 0.224 0.063Skewness –0.914 –0.207 –0.119Absolute spectral centroid 0.713 0.65 0.128Loudness –0.617 0.057 0.443Spectral roll-off 0.14 0.892 0.107Spectral irregularity –0.085 –0.825 0.002Fundamental frequency 0.236 0.24 0.85Relative spectral centroid 0.297 0.188 –0.808Attack time 0.435 0.498 –0.573Spectral flux 0.015 0.352 0.491Even/odd ratio –0.156 –0.006 –0.451
Chiasson et al. 127
extracted. PCa was related positively with higher frequency bands (> 583 Hz) and slightly nega-tively with lower frequency bands (< 583 Hz). PCb was related positively with lower frequency bands (< 897 Hz) and slightly negatively with higher frequency bands (> 897 Hz).
We then ran a stepwise multiple linear regression on both PCs and the log median extensity values from Experiment 2. The resulting equation is:
log E = 2.08 + .094 PC + .11 PC .a b( ) (2)
This equation shows that both higher (PCa) and lower frequencies (PCb) contribute to the exten-sity value, but that lower frequencies (PCb) have a slightly higher contribution to the extensity value. This equation suggests that our model envelopes go in the right direction, although they should be corrected to reflect the influence of higher frequencies and overall signal amplitude.
However, because of the irregular nature of the samples, it is difficult to quantify more precisely how the specific loudness in each frequency band contributes to the perceived extensity of each sample. Further research with synthesized sounds that vary according to the significant acoustic descriptors found in these experiments would be needed to confirm this interpretation.
The methodology used in this study demonstrates that participants can hear differences of largeness consistently even when samples have loudness differences. Preserving loudness dif-ferences should be interesting in some experimental situations like ours, where it is important to keep timbres as close as possible to a concert situation. As we have seen, to equalize the sam-ples’ loudnesses would have meant changing the spectra of the samples, thus altering the dif-ferences in extensity among them.
These results also suggest that it is not essential to have samples with equal pitches and loud-nesses to have valid experimental methodology to test timbre perception. The present study shows that differences of a particular feature of timbre can be heard and discriminated even with differences of loudness when the participants are directed to do so, as postulated by Hajda et al. (1997). Another study, by Marozeau, de Cheveigné, McAdams, and Winsberg (2003) on the influence of pitch on MDS analyses of timbre, shows that differences in timbre can also be heard and discriminated among samples of different pitch, when the participants are asked to do so. Moreover, as our study suggests, differences in pitch and loudness could contribute to the perceived timbre difference due to their effects on acoustic parameters that affect timbre.
Finally, numerous experimental results among different animal species (Fitch, 1997; Huron et al., 2006; Reby & McComb, 2003) and with different sound sources (for experiments with humans; Cabrera & Tilley, 2003; Dinther & Patterson, 2006; Smith et al., 2005) tend to confirm,
Figure 4. Models of a large sound and a small sound according to the most salient acoustic features revealed by the Principal Components Analysis.
128 Musicae Scientiae 21(1)
Fig
ure
5. H
arm
onic
spe
ctra
and
spe
ctra
l env
elop
es o
f ins
trum
ents
pla
ying
F4,
in t
he o
rder
of K
oech
lin’s
vol
ume
scal
e: fr
om le
ft t
o ri
ght
(vio
lin t
o cl
arin
et),
then
on
the
seco
nd r
ow fr
om le
ft t
o ri
ght
agai
n (s
axop
hone
to
horn
).
Chiasson et al. 129
along with our own experiments, that extensity might be an auditory perception of sound that would exist beyond cultural learning and even human-specific audition. Extensity may be a hearing attribute that is useful for different biological behaviors such as judging the size of an unseen organism or sounding object and making decisions and acting appropriately based on the potential meaning of that perception. The adoption of this attribute for musical purposes would thus be a deviation from its former ecological origins, extending it to a more general sense of sound extent with its implication in multiple sound sources through orchestration. As such, we now understand why this feature of hearing was so important for Koechlin (and many other classical musicians). A good understanding of extensity (or volume, as Koechlin called it) is cru-cial to give orchestrations “illusions” of “largeness”, “distance”, “depth” and of other evocative descriptions in Koechlin’s Traité de l’orchestration. The art of orchestration becomes an art of creating plausible “illusions” of auditory scenes – analogous to theatre and cinema creating “theatrical illusion” – by using limited auditory cues taken from real experience. For instance, a muted horn playing softly would be used to suggest a large musical call coming from afar, although the horn plays next to every other musician of the orchestra. Hence, using extensity wisely (among other attributes of hearing), a composer can create refined and detailed musical “scenes” in which many features can be heard by most listeners.
Conclusion
The purpose of this study was to verify the validity of Koechlin’s mean volume (or largeness) scale in native French and English speakers with different musical backgrounds. The results show strong evidence that participants hear the relative extensity of instrument samples roughly as Koechlin has described, independently of native language, musical background or the presence of a small hearing loss in the high frequencies. High energy concentrated in low frequencies tends to increase perceived largeness, whereas low energy more spread out in higher frequencies tends to decrease it. Strong results consistent with other studies with differ-ent sound sources or animal species suggest that extensity is a part of a general collection of timbre perception processes, oriented to recognize properties of different sound sources. And composers have capitalized on its biological origins to serve musical purposes.
Funding
This work was supported by a research grant from the Canadian Natural Sciences and Engineering Research Council (RGPIN 312774-10) and a Canada Research Chair awarded to Stephen McAdams as well as a research grant from the Fonds de Recherche du Québec-Société et Culture awarded to Caroline Traube. It was also supported by a doctoral research scholarship from the Fonds de Recherche du Québec-Société et Culture awarded to Frédéric Chiasson.
Note
1. Stevens thought that density and brilliance might be a single acoustic quality (Stevens & Davis, 1938). Because brilliance is the perceptual correlate of spectral centroid (Hajda et al., 1997) and most MDS studies use loudness-equalized samples (Hajda et al., 1997; McAdams, 1993), volume may be indirectly related to the spectral centroid dimension if we consider the loudness equation from Stevens et al. (1965) according to which volume increases when density or brilliance decreases for sounds with equal loudness.
References
Adler, S. (2002). The study of orchestration (3rd ed.). New York: W.W. Norton.Albersheim, G. (1939). Zur Psychologie der Toneigenschaften [On the psychology of tone quality]. Straßburg,
Germany: Heitz.
130 Musicae Scientiae 21(1)
Barthet, M. (2008). De l’interprète à l’auditeur: Une analyse acoustique et perceptive du timbre musical [From performer to listener: An acoustical and perceptual analysis of musical timbre]. PhD thesis, Université d’Aix-Marseille II, Aix, France. Retrieved from https://tel.archives-ouvertes.fr/tel-00418296
Blatter, A. (1997). Instrumentation and orchestration (2nd ed.). Boston, MA: Schirmer.Cabrera, D., & Tilley, S. (2003). Parameters for auditory display of height and size. In E. Brazil & B. Shinn-
Cunningham (Eds.), Proceedings of the 2003 International Conference on Auditory Display (pp. 29–32). Boston, MA: Boston University.
Chiasson, F. (2010). L’universalité de la méthode de Koechlin [The universality of the method of Koechlin]. In P. Cathé, S. Douche, & M. Duchesneau (Eds.), Charles Koechlin: Compositeur et humaniste [Charles Koechlin: Composer and humanist] (pp. 397–413). Paris, France: J. Vrin.
Dinther, R. V., & Patterson, R. D. (2006). Perception of acoustic scale and size in musical instrument sounds. Journal of Acoustical Society of America, 120(4), 2158–2176.
Erickson, R. (1975). Sound structure in music. Berkeley: University of California Press.Fitch, W. T. (1997). Vocal tract length and formant frequency dispersion correlate with body size in rhe-
sus macaques. Journal of Acoustical Society of America, 102, 1213–1222.Fritts, L. (n.d.). University of Iowa musical instrument samples [Mono recordings] (pre-2012 version).
Retrieved from http://theremin.music.uiowa.edu/MIS.htmlGiordano, B. L., & McAdams, S. (2006). Material identification of real impact sounds: Effects of size varia-
tion in steel, glass, wood and plexiglass plates. Journal of the Acoustical Society of America, 119, 1171–1181.
Hajda, J. M., Kendall, R. A., Carterette, E. C., & Harshberger, M. L. (1997). Methodological issues in timbre research. In I. Deliege & J. Sloboda (Eds.), Perception and cognition of music (pp. 253–306). Hove, UK: Psychology Press.
Hergenhahn, B. R., & Henley, T. (2013). An introduction to the history of psychology (7th ed.). Boston, MA: Wadsworth.
Huron, D., Kinney, D., & Precoda, K. (2006). Influence of pitch height on the perception of submissiveness and threat in musical passages. Empirical Musicology Review, 1(3), 170–177.
ISO 389-8. (2004). Acoustics: Reference zero for the calibration of audiometric equipment—Par 8: Reference equivalent threshold sound pressure levels for pure tones and circumaural earphones (Technical Report). Geneva, Switzerland: International Organization for Standardization.
Kendall, R. A., & Carterette, E. C. (1993). Verbal attributes of simultaneous wind instrument timbres: II. Adjectives induced from Piston’s Orchestration. Music Perception, 10, 469–502.
Koechlin, C. (1954–1959). Traité de l’orchestration, en 4 volumes [Treatise on orchestration, in 4 volumes]. Paris, France: Max Eschig.
Marozeau, J., de Cheveigné, A., McAdams, S., & Winsberg, S. (2003). The dependency of timbre on funda-mental frequency. Journal of the Acoustical Society of America, 114, 2946–2957.
Martin, F. N., & Champlin, C. A. (2000). Reconsidering the limits of normal hearing. Journal of the American Academy of Audiology, 11, 64–66.
McAdams, S. (1993). Recognition of sound sources and events. In S. McAdams & E. Bigand (Eds.), Thinking in sound: The cognitive psychology of human audition (pp. 157–213). Oxford, UK: Oxford University Press.
McAdams, S., Winsberg, S., Donnadieu, S., De Soete, G., & Krimphoff, J. (1995). Perceptual scaling of syn-thesized musical timbres: Common dimensions, specificities, and latent subject classes. Psychological Research, 58(3), 177–192.
Moore, B. C., & Glasberg, B. R. (1983). Suggested formulae for calculating auditory-filter bandwidths and excitation patterns. Journal of the Acoustical Society of America, 74(3), 750–753.
Opolko, F., & Wapnick, J. (1989). McGill University Master Samples. Montreal, Canada: McGill University.Peeters, G., Giordano, B. L., Susini, P., Misdariis, N., & McAdams, S. (2011). The timbre toolbox: Extracting
audio descriptors from musical signals. Journal of the Acoustical Society of America, 130, 2902–2916.Piston, W. (1955). Orchestration. New York: Norton.Reby, D., & McComb, K. (2003). Anatomical constraints generate honesty: Acoustic cues to age and
weight in roars of red deer stags. Animal Behavior, 65, 519–530.
Chiasson et al. 131
Rimsky-Korsakoff, N., & Steinberg, M. (1914). Principes d’orchestration (Vol. 1). Berlin, Germany: Édition russe de musique.
Schaeffer, P. (1966). Traité des objets musicaux: Essai interdisciplines. Paris, France: Éditions du Seuil.Smith, D. R. R., Patterson, R. D., Turner, R., Kawahara, H., & Irino, T. (2005). The processing and
perception of size information in speech sounds. Journal of the Acoustical Society of America, 117(1), 305–318.
Štĕpánek, J. (2006). Musical sound timbre: Verbal description and dimensions. Proceedings of the International Conference on Digital Audio Effects (DAFx-06) (pp. 121–126). Montreal, Canada: McGill University.
Stevens, S. S. (1971). Issues in psychophysical measurement. Psychological Review, 75(5), 426–450.Stevens, S. S. (1975). Psychophysics: Introduction to its perceptual, neural and social prospects. New York:
Wiley.Stevens, S. S., & Davis, H. (1938). Hearing: Its psychology and physiology. New York, NY: Wiley.Stevens, S. S., Guirao, M., & Slawson, A. W. (1965). Loudness, a product of volume times density. Journal
of Experimental Psychology, 69, 503–510.Stumpf, C. (1890). Tonpsychologie [Tone psychology] (Vol. 2). Leipzig, Germany: Hirzel.Terrace, H. S., & Stevens, S. S. (1962). The quantification of tonal volume. American Journal of Psychology,
75, 596–604.Traube, C., & Depalle, P. (2004). Timbral analogies between vowels and plucked string tones. Paper presented
at the International Conference on Acoustics, Speech, and Signal Processing (ICASSP ‘04), Montreal, Canada.