KNPD Final Res Report Pt 2 Analysis Tables - CRPD · 10.2% 487 81.2% 71 11.8% 44 7.3% 34 5.7% 37...
58
KNPD/PROG/0313 RESEARCH REPORT Confidential – all rights reserved - Informa Consultants 2014 1 KNPD RESEARCH ON THE SITUATION OF DISABLED PERSONS IN MALTA Final Research Report March 2014 – Pt 2 Analysis Tables
Transcript of KNPD Final Res Report Pt 2 Analysis Tables - CRPD · 10.2% 487 81.2% 71 11.8% 44 7.3% 34 5.7% 37...

KNPD/PROG/0313 RESEARCH REPORT Confidential – all rights reserved - Informa Consultants 2014 1
KNPD RESEARCH ON THE SITUATION OF DISABLED PERSONS IN MALTA Final Research Report March 2014 – Pt 2 Analysis Tables

KNPD/PROG/0313 RESEARCH REPORT Confidential – all rights reserved - Informa Consultants 2014 2
KUMMISSJONI NAZZJONALI PERSUNI B’ DIŻBILITÀ (KNPD): Research on the Situation of Disabled Persons in Malta co-funded by the PROGRESS Programme (Agreement no.: JUST/2012/PROG/AG/3715)

KNPD/PROG/0313 RESEARCH REPORT Confidential – all rights reserved - Informa Consultants 2014 3
APPENDIX III
Analysis Tables
The following tables display the results for all questions analysed by the characteristics of the sample, namely by Age, Gender, and
Type of Impairment.
The figures in each table consist of three types: actual counts (absolute); row %’s (analysis %); and column %’s (break %).

KNPD/PROG/0313 RESEARCH REPORT Confidential – all rights reserved - Informa Consultants 2014 4
CountsAnaly sis %Break %Respondents Total
Base
Visualimpairment
Hearingimpairment
Physicalimpairment
Intellectualimpairment
Mental healthissues
Specific learningdifficulties Other
Single
Married / Living withPartner
Separated / Divorced /Widowed
600 6811.3%
6110.2%
48781.2%
7111.8%
447.3%
345.7%
376.2%
19031.7%
2010.5%29.4%
168.4%
26.2%
12465.3%25.5%
5528.9%77.5%
2613.7%59.1%
3417.9%
100.0%
157.9%
40.5%
31953.2%
3611.3%52.9%
3310.3%54.1%
28288.4%57.9%
123.8%
16.9%
134.1%
29.5%
---
175.3%
45.9%
9115.2%
1213.2%17.6%
1213.2%19.7%
8189.0%16.6%
44.4%5.6%
55.5%
11.4%
---
55.5%
13.5%
CountsAnaly sis %Break %Respondents Total
Base
Male Female1 - 10years
11 - 20years
21 - 30years
31 - 40years
41 - 50years
50 - 60years
61 - 70years
71 years& over
Single
Married / Living withPartner
Separated / Divorced /Widowed
600 31953.2%
28146.8%
71.2%
203.3%
294.8%
376.2%
488.0%
7913.2%
13522.5%
24540.8%
19031.7%
9449.5%29.5%
9650.5%34.2%
73.7%
100.0%
2010.5%
100.0%
2915.3%
100.0%
2915.3%78.4%
2613.7%54.2%
1910.0%24.1%
2412.6%17.8%
3618.9%14.7%
31953.2%
20363.6%63.6%
11636.4%41.3%
---
---
---
82.5%
21.6%
165.0%
33.3%
5216.3%65.8%
9730.4%71.9%
14645.8%59.6%
9115.2%
2224.2%6.9%
6975.8%24.6%
---
---
---
---
66.6%
12.5%
88.8%
10.1%
1415.4%10.4%
6369.2%25.7%
Status by Gender & Age
Status by Type of Impairment

KNPD/PROG/0313 RESEARCH REPORT Confidential – all rights reserved - Informa Consultants 2014 5
CountsAnaly sis %Break %Respondents Total
Base
Male Female1 - 10years
11 - 20years
21 - 30years
31 - 40years
41 - 50years
50 - 60years
61 - 70years
71 years& over
Yes
No
600 31953.2%
28146.8%
71.2%
203.3%
294.8%
376.2%
488.0%
7913.2%
13522.5%
24540.8%
39866.3%
22356.0%69.9%
17544.0%62.3%
---
---
10.3%3.4%
92.3%
24.3%
246.0%
50.0%
5714.3%72.2%
10726.9%79.3%
20050.3%81.6%
20233.7%
9647.5%30.1%
10652.5%37.7%
73.5%
100.0%
209.9%
100.0%
2813.9%96.6%
2813.9%75.7%
2411.9%50.0%
2210.9%27.8%
2813.9%20.7%
4522.3%18.4%
CountsAnaly sis %Break %Respondents Total
Base
SouthernHarbour
Northernharbour
SouthEastern Western Northern Gozo
Single
Married / Living withPartner
Separated / Divorced /Widowed
600 14023.3%
19933.2%
7212.0%
9616.0%
7011.7%
233.8%
19031.7%
3719.5%26.4%
6835.8%34.2%
2111.1%29.2%
3317.4%34.4%
178.9%
24.3%
147.4%
60.9%
31953.2%
7322.9%52.1%
11235.1%56.3%
3912.2%54.2%
5015.7%52.1%
4112.9%58.6%
41.3%
17.4%
9115.2%
3033.0%21.4%
1920.9%9.5%
1213.2%16.7%
1314.3%13.5%
1213.2%17.1%
55.5%
21.7%
Status by Area
Do you have children by Gender & Age

KNPD/PROG/0313 RESEARCH REPORT Confidential – all rights reserved - Informa Consultants 2014 6
CountsAnaly sis %Break %Respondents Total
Base
Visualimpairment
Hearingimpairment
Physicalimpairment
Intellectualimpairment
Mental healthissues
Specific learningdifficulties Other
Yes
No
600 6811.3%
6110.2%
48781.2%
7111.8%
447.3%
345.7%
376.2%
39866.3%
4511.3%66.2%
4411.1%72.1%
35288.4%72.3%
164.0%
22.5%
194.8%
43.2%
10.3%2.9%
215.3%
56.8%
20233.7%
2311.4%33.8%
178.4%
27.9%
13566.8%27.7%
5527.2%77.5%
2512.4%56.8%
3316.3%97.1%
167.9%
43.2%
CountsAnaly sis %Break %Respondents Total
Base
SouthernHarbour
Northernharbour
SouthEastern Western Northern Gozo
Yes
No
600 14023.3%
19933.2%
7212.0%
9616.0%
7011.7%
233.8%
39866.3%
10225.6%72.9%
13032.7%65.3%
4812.1%66.7%
5814.6%60.4%
5112.8%72.9%
92.3%
39.1%
20233.7%
3818.8%27.1%
6934.2%34.7%
2411.9%33.3%
3818.8%39.6%
199.4%
27.1%
146.9%
60.9%
Do you have children by Type of Impairment
Do you have children by Area

KNPD/PROG/0313 RESEARCH REPORT Confidential – all rights reserved - Informa Consultants 2014 7
CountsAnaly sis %Break %Respondents Total
Base
Male Female1 - 10years
11 - 20years
21 - 30years
31 - 40years
41 - 50years
50 - 60years
61 - 70years
71 years& over
None
1 child
2 - 3 children
4 - 5 children
6 - 7 children
More than 7 children
600 31953.2%
28146.8%
71.2%
203.3%
294.8%
376.2%
488.0%
7913.2%
13522.5%
24540.8%
20233.7%
9647.5%30.1%
10652.5%37.7%
73.5%
100.0%
209.9%
100.0%
2813.9%96.6%
2813.9%75.7%
2411.9%50.0%
2210.9%27.8%
2813.9%20.7%
4522.3%18.4%
518.5%
2854.9%8.8%
2345.1%8.2%
---
---
12.0%3.4%
23.9%5.4%
713.7%14.6%
1121.6%13.9%
1325.5%
9.6%
1733.3%6.9%
25342.2%
15561.3%48.6%
9838.7%34.9%
---
---
---
41.6%
10.8%
166.3%
33.3%
4015.8%50.6%
8132.0%60.0%
11244.3%45.7%
7111.8%
3447.9%10.7%
3752.1%13.2%
---
---
---
34.2%8.1%
11.4%2.1%
45.6%5.1%
1216.9%
8.9%
5171.8%20.8%
132.2%
430.8%1.3%
969.2%3.2%
---
---
---
---
---
215.4%
2.5%
17.7%0.7%
1076.9%4.1%
101.7%
220.0%0.6%
880.0%2.8%
---
---
---
---
---
---
---
10100.0%
4.1%
Number of Children by Gender & Age

KNPD/PROG/0313 RESEARCH REPORT Confidential – all rights reserved - Informa Consultants 2014 8
CountsAnaly sis %Break %Respondents Total
Base
Visualimpairment
Hearingimpairment
Physicalimpairment
Intellectualimpairment
Mental healthissues
Specific learningdifficulties Other
None
1 child
2 - 3 children
4 - 5 children
6 - 7 children
More than 7 children
600 6811.3%
6110.2%
48781.2%
7111.8%
447.3%
345.7%
376.2%
20233.7%
2311.4%33.8%
178.4%
27.9%
13566.8%27.7%
5527.2%77.5%
2512.4%56.8%
3316.3%97.1%
167.9%
43.2%
518.5%
35.9%4.4%
59.8%8.2%
4486.3%9.0%
23.9%2.8%
35.9%6.8%
---
35.9%8.1%
25342.2%
3112.3%45.6%
3011.9%49.2%
22588.9%46.2%
114.3%
15.5%
124.7%
27.3%
10.4%2.9%
135.1%
35.1%
7111.8%
1115.5%16.2%
79.9%
11.5%
6287.3%12.7%
11.4%1.4%
45.6%9.1%
---
45.6%
10.8%
132.2%
---
17.7%1.6%
1292.3%2.5%
17.7%1.4%
---
---
---
101.7%
---
110.0%1.6%
990.0%1.8%
110.0%1.4%
---
---
110.0%2.7%
Number of Children by Type of Impairment

KNPD/PROG/0313 RESEARCH REPORT Confidential – all rights reserved - Informa Consultants 2014 9
CountsAnaly sis %Break %Respondents Total
Base
Male Female1 - 10years
11 - 20years
21 - 30years
31 - 40years
41 - 50years
50 - 60years
61 - 70years
71 years& over
Mild,
Moderate, or
Severe
600 31953.2%
28146.8%
71.2%
203.3%
294.8%
376.2%
488.0%
7913.2%
13522.5%
24540.8%
396.5%
1846.2%5.6%
2153.8%7.5%
---
25.1%
10.0%
410.3%13.8%
12.6%2.7%
717.9%14.6%
37.7%3.8%
615.4%
4.4%
1641.0%6.5%
27045.0%
15657.8%48.9%
11442.2%40.6%
31.1%
42.9%
134.8%
65.0%
145.2%
48.3%
124.4%
32.4%
186.7%
37.5%
3814.1%48.1%
5821.5%43.0%
11442.2%46.5%
29148.5%
14549.8%45.5%
14650.2%52.0%
41.4%
57.1%
51.7%
25.0%
113.8%
37.9%
248.2%
64.9%
237.9%
47.9%
3813.1%48.1%
7124.4%52.6%
11539.5%46.9%
CountsAnaly sis %Break %Respondents Total
Base
SouthernHarbour
Northernharbour
SouthEastern Western Northern Gozo
1 child
2 - 3 children
4 - 5 children
6 - 7 children
More than 7 children
398 10225.6%
13032.7%
4812.1%
5814.6%
5112.8%
92.3%
5112.8%
1529.4%14.7%
1733.3%13.1%
611.8%12.5%
59.8%8.6%
611.8%11.8%
23.9%
22.2%
25363.6%
6525.7%63.7%
8031.6%61.5%
2710.7%56.3%
3915.4%67.2%
3714.6%72.5%
52.0%
55.6%
7117.8%
1622.5%15.7%
2839.4%21.5%
1115.5%22.9%
912.7%15.5%
57.0%9.8%
22.8%
22.2%
133.3%
430.8%3.9%
323.1%2.3%
215.4%
4.2%
323.1%
5.2%
17.7%2.0%
---
102.5%
220.0%2.0%
220.0%1.5%
220.0%
4.2%
220.0%
3.4%
220.0%3.9%
---
Number of Children by Area
Degree of Disability by Gender & Age

KNPD/PROG/0313 RESEARCH REPORT Confidential – all rights reserved - Informa Consultants 2014 10
CountsAnaly sis %Break %Respondents Total
Base
Visualimpairment
Hearingimpairment
Physicalimpairment
Intellectualimpairment
Mental healthissues
Specific learningdifficulties Other
Mild,
Moderate, or
Severe
600 6811.3%
6110.2%
48781.2%
7111.8%
447.3%
345.7%
376.2%
396.5%
37.7%4.4%
615.4%9.8%
2871.8%5.7%
512.8%7.0%
12.6%2.3%
12.6%2.9%
25.1%5.4%
27045.0%
228.1%
32.4%
3011.1%49.2%
22181.9%45.4%
2810.4%39.4%
124.4%
27.3%
114.1%
32.4%
93.3%
24.3%
29148.5%
4314.8%63.2%
258.6%
41.0%
23881.8%48.9%
3813.1%53.5%
3110.7%70.5%
227.6%
64.7%
268.9%
70.3%
CountsAnaly sis %Break %Respondents Total
Base
SouthernHarbour
Northernharbour
SouthEastern Western Northern Gozo
Mild,
Moderate, or
Severe
600 14023.3%
19933.2%
7212.0%
9616.0%
7011.7%
233.8%
396.5%
923.1%6.4%
1538.5%7.5%
37.7%4.2%
615.4%
6.3%
37.7%4.3%
37.7%
13.0%
27045.0%
5219.3%37.1%
9234.1%46.2%
4115.2%56.9%
4617.0%47.9%
269.6%
37.1%
134.8%
56.5%
29148.5%
7927.1%56.4%
9231.6%46.2%
289.6%
38.9%
4415.1%45.8%
4114.1%58.6%
72.4%
30.4%
Degree of Disability by Type of Impairment
Degree of Disability by Area

KNPD/PROG/0313 RESEARCH REPORT Confidential – all rights reserved - Informa Consultants 2014 11
CountsAnaly sis %Break %Respondents Total
Base
Male Female1 - 10years
11 - 20years
21 - 30years
31 - 40years
41 - 50years
50 - 60years
61 - 70years
71 years& over
At birth
From 0 - 5 years
From 6 - 19 years
From 20 - 39 years
From 40 - 59 years
After 60 years
600 31953.2%
28146.8%
71.2%
203.3%
294.8%
376.2%
488.0%
7913.2%
13522.5%
24540.8%
10217.0%
5957.8%18.5%
4342.2%15.3%
43.9%
57.1%
1716.7%85.0%
2019.6%69.0%
2423.5%64.9%
1413.7%29.2%
1312.7%16.5%
76.9%5.2%
32.9%1.2%
376.2%
2259.5%6.9%
1540.5%5.3%
25.4%
28.6%
12.7%5.0%
410.8%13.8%
---
38.1%6.3%
616.2%
7.6%
1027.0%
7.4%
1129.7%4.5%
467.7%
2554.3%7.8%
2145.7%7.5%
12.2%
14.3%
24.3%
10.0%
36.5%
10.3%
510.9%13.5%
48.7%8.3%
510.9%
6.3%
1021.7%
7.4%
1634.8%6.5%
6410.7%
3453.1%10.7%
3046.9%10.7%
---
---
23.1%6.9%
812.5%21.6%
1320.3%27.1%
1421.9%17.7%
1320.3%
9.6%
1421.9%5.7%
15325.5%
8756.9%27.3%
6643.1%23.5%
---
---
---
---
149.2%
29.2%
4126.8%51.9%
6643.1%48.9%
3220.9%13.1%
19833.0%
9246.5%28.8%
10653.5%37.7%
---
---
---
---
---
---
2914.6%21.5%
16985.4%69.0%
Age When Disability Occurred by Gender & Age

KNPD/PROG/0313 RESEARCH REPORT Confidential – all rights reserved - Informa Consultants 2014 12
CountsAnaly sis %Break %Respondents Total
Base
Visualimpairment
Hearingimpairment
Physicalimpairment
Intellectualimpairment
Mental healthissues
Specific learningdifficulties Other
At birth
From 0 - 5 years
From 6 - 19 years
From 20 - 39 years
From 40 - 59 years
After 60 years
600 6811.3%
6110.2%
48781.2%
7111.8%
447.3%
345.7%
376.2%
10217.0%
87.8%
11.8%
109.8%
16.4%
6361.8%12.9%
3837.3%53.5%
76.9%
15.9%
2221.6%64.7%
98.8%
24.3%
376.2%
410.8%
5.9%
410.8%
6.6%
2670.3%
5.3%
1232.4%16.9%
410.8%9.1%
513.5%14.7%
12.7%2.7%
467.7%
613.0%
8.8%
613.0%
9.8%
3167.4%
6.4%
613.0%
8.5%
817.4%18.2%
48.7%
11.8%
12.2%2.7%
6410.7%
914.1%13.2%
1117.2%18.0%
4976.6%10.1%
---
46.3%9.1%
11.6%2.9%
46.3%
10.8%
15325.5%
2113.7%30.9%
127.8%
19.7%
13286.3%27.1%
63.9%8.5%
127.8%
27.3%
21.3%5.9%
117.2%
29.7%
19833.0%
2010.1%29.4%
189.1%
29.5%
18693.9%38.2%
94.5%
12.7%
94.5%
20.5%
---
115.6%
29.7%
Age When Disability Occurred by Type of Impairment

KNPD/PROG/0313 RESEARCH REPORT Confidential – all rights reserved - Informa Consultants 2014 13
CountsAnaly sis %Break %Respondents Total
Base
SouthernHarbour
Northernharbour
SouthEastern Western Northern Gozo
At birth
From 0 - 5 years
From 6 - 19 years
From 20 - 39 years
From 40 - 59 years
After 60 years
600 14023.3%
19933.2%
7212.0%
9616.0%
7011.7%
233.8%
10217.0%
2322.5%16.4%
2524.5%12.6%
1716.7%23.6%
2019.6%20.8%
109.8%
14.3%
76.9%
30.4%
376.2%
616.2%4.3%
1437.8%7.0%
12.7%1.4%
821.6%
8.3%
718.9%10.0%
12.7%4.3%
467.7%
817.4%5.7%
2452.2%12.1%
36.5%4.2%
613.0%
6.3%
510.9%7.1%
---
6410.7%
1523.4%10.7%
2335.9%11.6%
46.3%5.6%
1015.6%10.4%
1015.6%14.3%
23.1%8.7%
15325.5%
3724.2%26.4%
4831.4%24.1%
2315.0%31.9%
2315.0%24.0%
1711.1%24.3%
53.3%
21.7%
19833.0%
5125.8%36.4%
6532.8%32.7%
2412.1%33.3%
2914.6%30.2%
2110.6%30.0%
84.0%
34.8%
Age When Disability Occurred by Area

KNPD/PROG/0313 RESEARCH REPORT Confidential – all rights reserved - Informa Consultants 2014 14
CountsAnaly sis %Break %Respondents Total
Base
Male Female1 - 10years
11 - 20years
21 - 30years
31 - 40years
41 - 50years
50 - 60years
61 - 70years
71 years& over
In my house, with mypartner
In my house, with mypartner and kids
In my house, with thefamily which broughtme
up
In my house, on my own
With a family member, inhis house
In my house with son/sand/or daughter/s
In the family home withbrother/sister
Other place
In a home for elderlypersons (private or
Church), paid for bymyself
In a Convent
In an institution fordisabled persons
In a Government housefor elderly persons
In a house within thecommunity, for disabled
persons
In a Governmentinstitution for elderly
persons
600 31953.2%
28146.8%
71.2%
203.3%
294.8%
376.2%
488.0%
7913.2%
13522.5%
24540.8%
20734.5%
13464.7%42.0%
7335.3%26.0%
---
---
---
31.4%8.1%
10.5%2.1%
178.2%
21.5%
6732.4%49.6%
11957.5%48.6%
11118.5%
7365.8%22.9%
3834.2%13.5%
---
---
10.9%3.4%
76.3%
18.9%
1614.4%33.3%
3430.6%43.0%
2926.1%21.5%
2421.6%
9.8%
10617.7%
5350.0%16.6%
5350.0%18.9%
65.7%
85.7%
1917.9%95.0%
2321.7%79.3%
2220.8%59.5%
1615.1%33.3%
1211.3%15.2%
43.8%3.0%
43.8%1.6%
7913.2%
2430.4%7.5%
5569.6%19.6%
---
---
---
11.3%2.7%
78.9%
14.6%
67.6%7.6%
2430.4%17.8%
4151.9%16.7%
294.8%
1241.4%3.8%
1758.6%6.0%
---
13.4%5.0%
413.8%13.8%
310.3%
8.1%
13.4%2.1%
517.2%
6.3%
26.9%1.5%
1344.8%
5.3%
264.3%
27.7%0.6%
2492.3%8.5%
---
---
---
---
27.7%4.2%
311.5%
3.8%
27.7%1.5%
1973.1%
7.8%
142.3%
642.9%1.9%
857.1%2.8%
---
---
---
---
17.1%2.1%
17.1%1.3%
428.6%
3.0%
857.1%
3.3%
71.2%
571.4%1.6%
228.6%0.7%
114.3%14.3%
---
---
---
114.3%
2.1%
---
228.6%
1.5%
342.9%
1.2%
50.8%
360.0%0.9%
240.0%0.7%
---
---
---
---
---
---
---
5100.0%
2.0%
50.8%
120.0%0.3%
480.0%1.4%
---
---
---
---
---
120.0%
1.3%
---
480.0%
1.6%
40.7%
250.0%0.6%
250.0%0.7%
---
---
125.0%
3.4%
125.0%
2.7%
125.0%
2.1%
---
---
125.0%
0.4%
30.5%
133.3%0.3%
266.7%0.7%
---
---
---
---
---
---
133.3%
0.7%
266.7%
0.8%
20.3%
2100.0%
0.6%
---
---
---
---
---
2100.0%
4.2%
---
---
---
20.3%
150.0%0.3%
150.0%0.4%
---
---
---
---
---
---
---
2100.0%
0.8%
Who do you live with by Gender & Age

KNPD/PROG/0313 RESEARCH REPORT Confidential – all rights reserved - Informa Consultants 2014 15
CountsAnaly sis %Break %Respondents Total
Base
Visualimpairment
Hearingimpairment
Physicalimpairment
Intellectualimpairment
Mental healthissues
Specific learningdifficulties Other
In my house, with mypartner
In my house, with mypartner and kids
In my house, with thefamily which broughtme
up
In my house, on my own
With a family member, inhis house
In my house with son/sand/or daughter/s
In the family home withbrother/sister
Other place
In a home for elderlypersons (private or
Church), paid for bymyself
In a Convent
In an institution fordisabled persons
In a Government housefor elderly persons
In a house within thecommunity, for disabled
persons
In a Governmentinstitution for elderly
persons
600 6811.3%
6110.2%
48781.2%
7111.8%
447.3%
345.7%
376.2%
20734.5%
2713.0%39.7%
2210.6%36.1%
18589.4%38.0%
41.9%5.6%
41.9%9.1%
---
104.8%
27.0%
11118.5%
98.1%
13.2%
109.0%
16.4%
9686.5%19.7%
87.2%
11.3%
76.3%
15.9%
10.9%2.9%
76.3%
18.9%
10617.7%
1211.3%17.6%
98.5%
14.8%
6056.6%12.3%
3936.8%54.9%
1716.0%38.6%
2927.4%85.3%
1110.4%29.7%
7913.2%
810.1%11.8%
911.4%14.8%
7189.9%14.6%
11.3%1.4%
56.3%
11.4%
---
45.1%
10.8%
294.8%
26.9%2.9%
310.3%
4.9%
2069.0%
4.1%
931.0%12.7%
724.1%15.9%
310.3%8.8%
26.9%5.4%
264.3%
519.2%
7.4%
311.5%
4.9%
2388.5%
4.7%
13.8%1.4%
13.8%2.3%
---
27.7%5.4%
142.3%
17.1%1.5%
17.1%1.6%
1285.7%
2.5%
---
---
---
17.1%2.7%
71.2%
228.6%
2.9%
228.6%
3.3%
571.4%
1.0%
228.6%
2.8%
---
---
---
50.8%
240.0%
2.9%
120.0%
1.6%
480.0%
0.8%
120.0%
1.4%
120.0%
2.3%
---
---
50.8%
---
---
360.0%
0.6%
---
240.0%
4.5%
---
---
40.7%
---
---
250.0%
0.4%
4100.0%
5.6%
---
---
---
30.5%
---
133.3%
1.6%
3100.0%
0.6%
---
---
---
---
20.3%
---
---
150.0%
0.2%
150.0%
1.4%
---
150.0%2.9%
---
20.3%
---
---
2100.0%
0.4%
150.0%
1.4%
---
---
---
Who do you live with by Type of Impairment

KNPD/PROG/0313 RESEARCH REPORT Confidential – all rights reserved - Informa Consultants 2014 16
CountsAnaly sis %Break %Respondents Total
Base
SouthernHarbour
Northernharbour
SouthEastern Western Northern Gozo
In my house, with mypartner
In my house, with mypartner and kids
In my house, with thefamily which broughtme
up
In my house, on my own
With a family member, inhis house
In my house with son/sand/or daughter/s
In the family home withbrother/sister
Other place
In a home for elderlypersons (private or
Church), paid for bymyself
In a Convent
In an institution fordisabled persons
In a Government housefor elderly persons
In a house within thecommunity, for disabled
persons
In a Governmentinstitution for elderly
persons
600 14023.3%
19933.2%
7212.0%
9616.0%
7011.7%
233.8%
20734.5%
4220.3%30.0%
7737.2%38.7%
2311.1%31.9%
3416.4%35.4%
2914.0%41.4%
21.0%8.7%
11118.5%
3228.8%22.9%
3632.4%18.1%
1614.4%22.2%
1412.6%14.6%
119.9%
15.7%
21.8%8.7%
10617.7%
2321.7%16.4%
3533.0%17.6%
1716.0%23.6%
1615.1%16.7%
1110.4%15.7%
43.8%
17.4%
7913.2%
2329.1%16.4%
2936.7%14.6%
56.3%6.9%
1012.7%10.4%
1012.7%14.3%
22.5%8.7%
294.8%
413.8%
2.9%
931.0%
4.5%
26.9%2.8%
724.1%7.3%
26.9%2.9%
517.2%21.7%
264.3%
934.6%
6.4%
415.4%
2.0%
519.2%6.9%
311.5%3.1%
27.7%2.9%
311.5%13.0%
142.3%
428.6%
2.9%
214.3%
1.0%
17.1%1.4%
428.6%4.2%
17.1%1.4%
214.3%
8.7%
71.2%
114.3%
0.7%
114.3%
0.5%
228.6%2.8%
114.3%1.0%
114.3%
1.4%
114.3%
4.3%
50.8%
120.0%
0.7%
120.0%
0.5%
120.0%1.4%
---
120.0%
1.4%
120.0%
4.3%
50.8%
---
360.0%
1.5%
---
120.0%1.0%
---
120.0%
4.3%
40.7%
---
---
---
4100.0%
4.2%
---
---
30.5%
---
133.3%
0.5%
---
133.3%1.0%
133.3%
1.4%
---
20.3%
---
150.0%
0.5%
---
---
150.0%
1.4%
---
20.3%
150.0%
0.7%
---
---
150.0%1.0%
---
---
Who do you live with by Area

KNPD/PROG/0313 RESEARCH REPORT Confidential – all rights reserved - Informa Consultants 2014 17
CountsAnaly sis %Break %Respondents Total
Base
Male Female1 - 10years
11 - 20years
21 - 30years
31 - 40years
41 - 50years
50 - 60years
61 - 70years
71 years& over
One person
2 persons
3 to 4 persons
5 to 6 persons
7 to 10 persons
11 to 15 persons
Over 15 persons
595 31552.9%
28047.1%
71.2%
203.4%
294.9%
376.2%
477.9%
7913.3%
13322.4%
24340.8%
8113.6%
2530.9%7.9%
5669.1%20.0%
---
---
---
11.2%2.7%
78.6%
14.9%
67.4%7.6%
2429.6%18.0%
4353.1%17.7%
26244.0%
14655.7%46.3%
11644.3%41.4%
10.4%
14.3%
10.4%5.0%
41.5%
13.8%
41.5%
10.8%
103.8%
21.3%
269.9%
32.9%
6926.3%51.9%
14756.1%60.5%
18831.6%
10857.4%34.3%
8042.6%28.6%
21.1%
28.6%
158.0%
75.0%
168.5%
55.2%
2714.4%73.0%
2312.2%48.9%
3719.7%46.8%
3217.0%24.1%
3619.1%14.8%
477.9%
3166.0%9.8%
1634.0%5.7%
36.4%
42.9%
48.5%
20.0%
714.9%24.1%
48.5%
10.8%
612.8%12.8%
919.1%11.4%
714.9%
5.3%
714.9%2.9%
71.2%
228.6%0.6%
571.4%1.8%
114.3%14.3%
---
114.3%3.4%
---
---
114.3%
1.3%
114.3%
0.8%
342.9%1.2%
40.7%
375.0%1.0%
125.0%0.4%
---
---
125.0%3.4%
125.0%2.7%
125.0%
2.1%
---
---
125.0%0.4%
61.0%
---
6100.0%
2.1%
---
---
---
---
---
---
---
6100.0%
2.5%
How many people live in the house, including yourself? by Gender & Age

KNPD/PROG/0313 RESEARCH REPORT Confidential – all rights reserved - Informa Consultants 2014 18
CountsAnaly sis %Break %Respondents Total
Base
Visualimpairment
Hearingimpairment
Physicalimpairment
Intellectualimpairment
Mental healthissues
Specificlearning
difficulties Other
One person
2 persons
3 to 4 persons
5 to 6 persons
7 to 10 persons
11 to 15 persons
Over 15 persons
595 6611.1%
599.9%
48381.2%
7011.8%
447.4%
335.5%
376.2%
8113.6%
89.9%
12.1%
911.1%15.3%
7390.1%15.1%
11.2%1.4%
56.2%
11.4%
---
44.9%
10.8%
26244.0%
3714.1%56.1%
3212.2%54.2%
22184.4%45.8%
166.1%
22.9%
124.6%
27.3%
51.9%
15.2%
135.0%
35.1%
18831.6%
179.0%
25.8%
147.4%
23.7%
14376.1%29.6%
4121.8%58.6%
2111.2%47.7%
2211.7%66.7%
179.0%
45.9%
477.9%
36.4%4.5%
36.4%5.1%
3676.6%
7.5%
48.5%5.7%
24.3%4.5%
510.6%15.2%
36.4%8.1%
71.2%
114.3%1.5%
114.3%1.7%
457.1%
0.8%
457.1%5.7%
114.3%
2.3%
114.3%
3.0%
---
40.7%
---
---
375.0%
0.6%
4100.0%
5.7%
---
---
---
61.0%
---
---
350.0%
0.6%
---
350.0%
6.8%
---
---
How many people live in the house, including yourself? by Type of Impairment

KNPD/PROG/0313 RESEARCH REPORT Confidential – all rights reserved - Informa Consultants 2014 19
CountsAnaly sis %Break %Respondents Total
Base
SouthernHarbour
Northernharbour
SouthEastern Western Northern Gozo
One person
2 persons
3 to 4 persons
5 to 6 persons
7 to 10 persons
11 to 15 persons
Over 15 persons
595 14023.5%
19733.1%
7212.1%
9516.0%
7011.8%
213.5%
8113.6%
2328.4%16.4%
2935.8%14.7%
56.2%6.9%
1012.3%10.5%
1214.8%17.1%
22.5%9.5%
26244.0%
5721.8%40.7%
8833.6%44.7%
3413.0%47.2%
3914.9%41.1%
3413.0%48.6%
103.8%
47.6%
18831.6%
4725.0%33.6%
5931.4%29.9%
2714.4%37.5%
3317.6%34.7%
189.6%
25.7%
42.1%
19.0%
477.9%
1021.3%7.1%
1429.8%7.1%
612.8%
8.3%
714.9%
7.4%
510.6%7.1%
510.6%23.8%
71.2%
114.3%0.7%
457.1%2.0%
---
114.3%
1.1%
114.3%1.4%
---
40.7%
---
---
---
4100.0%
4.2%
---
---
61.0%
233.3%1.4%
350.0%1.5%
---
116.7%
1.1%
---
---
How many people live in the house, including yourself? By Area

KNPD/PROG/0313 RESEARCH REPORT Confidential – all rights reserved - Informa Consultants 2014 20
CountsAnaly sis %Break %Respondents Total
Base
Visualimpairment
Hearingimpairment
Physicalimpairment
Intellectualimpairment
Mental healthissues
Specific learningdifficulties Other
Yes
No
600 6811.3%
6110.2%
48781.2%
7111.8%
447.3%
345.7%
376.2%
54590.8%
6011.0%88.2%
5610.3%91.8%
45082.6%92.4%
529.5%
73.2%
366.6%
81.8%
234.2%
67.6%
346.2%
91.9%
559.2%
814.5%11.8%
59.1%8.2%
3767.3%7.6%
1934.5%26.8%
814.5%18.2%
1120.0%32.4%
35.5%8.1%
CountsAnaly sis %Break %Respondents Total
Base
Male Female1 - 10years
11 - 20years
21 - 30years
31 - 40years
41 - 50years
50 - 60years
61 - 70years
71 years& over
Yes
No
600 31953.2%
28146.8%
71.2%
203.3%
294.8%
376.2%
488.0%
7913.2%
13522.5%
24540.8%
54590.8%
29854.7%93.4%
24745.3%87.9%
40.7%
57.1%
122.2%
60.0%
203.7%
69.0%
315.7%
83.8%
478.6%
97.9%
7513.8%94.9%
12923.7%95.6%
22741.7%92.7%
559.2%
2138.2%6.6%
3461.8%12.1%
35.5%
42.9%
814.5%40.0%
916.4%31.0%
610.9%16.2%
11.8%2.1%
47.3%5.1%
610.9%
4.4%
1832.7%7.3%
CountsAnaly sis %Break %Respondents Total
Base
SouthernHarbour
Northernharbour
SouthEastern Western Northern Gozo
Yes
No
600 14023.3%
19933.2%
7212.0%
9616.0%
7011.7%
233.8%
54590.8%
12923.7%92.1%
18333.6%92.0%
6211.4%86.1%
8816.1%91.7%
6612.1%94.3%
173.1%
73.9%
559.2%
1120.0%7.9%
1629.1%8.0%
1018.2%13.9%
814.5%
8.3%
47.3%5.7%
610.9%26.1%
Do you have your own bedroom? by Gender & Age
Do you have your own bedroom? by Type of Impairment
Do you have your own bedroom? by Area

KNPD/PROG/0313 RESEARCH REPORT Confidential – all rights reserved - Informa Consultants 2014 21
CountsAnaly sis %Break %Respondents Total
Base
Male Female1 - 10years
11 - 20years
21 - 30years
31 - 40years
41 - 50years
50 - 60years
61 - 70years
71 years& over
Don't know
2 persons
3 persons
4 persons
55 2138.2%
3461.8%
35.5%
814.5%
916.4%
610.9%
11.8%
47.3%
610.9%
1832.7%
11.8%
---
1100.0%
2.9%
---
---
---
---
---
---
1100.0%16.7%
---
4581.8%
1737.8%81.0%
2862.2%82.4%
36.7%
100.0%
613.3%75.0%
715.6%77.8%
24.4%
33.3%
12.2%
100.0%
48.9%
100.0%
48.9%
66.7%
1840.0%
100.0%
610.9%
350.0%14.3%
350.0%8.8%
---
233.3%25.0%
116.7%11.1%
350.0%50.0%
---
---
---
---
35.5%
133.3%4.8%
266.7%5.9%
---
---
133.3%11.1%
133.3%16.7%
---
---
133.3%16.7%
---
CountsAnaly sis %Break %Respondents Total
Base
Visualimpairment
Hearingimpairment
Physicalimpairment
Intellectualimpairment
Mental healthissues
Specific learningdifficulties Other
Don't know
2 persons
3 persons
4 persons
55 814.5%
59.1%
3767.3%
1934.5%
814.5%
1120.0%
35.5%
11.8%
---
---
1100.0%
2.7%
---
---
---
---
4581.8%
715.6%87.5%
511.1%
100.0%
2964.4%78.4%
1431.1%73.7%
715.6%87.5%
920.0%81.8%
24.4%
66.7%
610.9%
---
---
583.3%13.5%
466.7%21.1%
116.7%12.5%
233.3%18.2%
116.7%33.3%
35.5%
133.3%12.5%
---
266.7%
5.4%
133.3%
5.3%
---
---
---
How many people sleep in the same room? by Gender & Age
How many people sleep in the same room? by Type of Impairment

KNPD/PROG/0313 RESEARCH REPORT Confidential – all rights reserved - Informa Consultants 2014 22
CountsAnaly sis %Break %Respondents Total
Base
SouthernHarbour
Northernharbour
SouthEastern Western Northern Gozo
Don't know
2 persons
3 persons
4 persons
55 1120.0%
1629.1%
1018.2%
814.5%
47.3%
610.9%
11.8%
---
1100.0%
6.3%
---
---
---
---
4581.8%
1022.2%90.9%
1328.9%81.3%
920.0%90.0%
511.1%62.5%
36.7%
75.0%
511.1%83.3%
610.9%
116.7%9.1%
233.3%12.5%
116.7%10.0%
233.3%25.0%
---
---
35.5%
---
---
---
133.3%12.5%
133.3%25.0%
133.3%16.7%
How many people sleep in the same room? By Area

KNPD/PROG/0313 RESEARCH REPORT Confidential – all rights reserved - Informa Consultants 2014 23
CountsAnaly sis %Break %Respondents Total
Base
Male Female1 - 10years
11 - 20years
21 - 30years
31 - 40years
41 - 50years
50 - 60years
61 - 70years
71 years& over
I live in my house withmy partner and/or
children
I'm still l iving in myfamily's house with one
or both parents
I live on my own in myfamily's house
I live in another place onmy own
I'm still l iving in myfamily's house with oneor more of my siblings
(without parents)
Other
I live with one of mysiblings, in their house
I live with one of mychildren, in his/her
house
I went to live in anelderly people's home
afterI turned 60
I live in an institutionsince I do not have
enough support to livein the community
One of my childrenmoved in with me
600 31953.2%
28146.8%
71.2%
203.3%
294.8%
376.2%
488.0%
7913.2%
13522.5%
24540.8%
32854.7%
20161.3%63.0%
12738.7%45.2%
---
---
10.3%3.4%
82.4%
21.6%
175.2%
35.4%
5215.9%65.8%
9529.0%70.4%
15547.3%63.3%
9716.2%
5253.6%16.3%
4546.4%16.0%
44.1%
57.1%
1818.6%90.0%
2626.8%89.7%
2323.7%62.2%
1414.4%29.2%
99.3%
11.4%
33.1%2.2%
---
6010.0%
2236.7%6.9%
3863.3%13.5%
---
---
---
---
610.0%12.5%
915.0%11.4%
1423.3%10.4%
3151.7%12.7%
325.3%
1031.3%3.1%
2268.8%7.8%
---
---
13.1%3.4%
13.1%2.7%
412.5%
8.3%
13.1%1.3%
1340.6%
9.6%
1237.5%4.9%
264.3%
1038.5%3.1%
1661.5%5.7%
27.7%
28.6%
13.8%5.0%
---
27.7%5.4%
311.5%
6.3%
27.7%2.5%
519.2%
3.7%
1142.3%4.5%
203.3%
1260.0%3.8%
840.0%2.8%
15.0%
14.3%
15.0%5.0%
---
15.0%2.7%
210.0%
4.2%
210.0%
2.5%
210.0%
1.5%
1155.0%4.5%
91.5%
333.3%0.9%
666.7%2.1%
---
---
---
111.1%2.7%
---
333.3%
3.8%
222.2%
1.5%
333.3%1.2%
91.5%
111.1%0.3%
888.9%2.8%
---
---
---
---
---
111.1%
1.3%
---
888.9%3.3%
91.5%
444.4%1.3%
555.6%1.8%
---
---
---
---
---
---
111.1%
0.7%
888.9%3.3%
61.0%
466.7%1.3%
233.3%0.7%
---
---
116.7%3.4%
116.7%2.7%
233.3%
4.2%
---
---
233.3%0.8%
40.7%
---
4100.0%
1.4%
---
---
---
---
---
---
---
4100.0%
1.6%
Which of the following best describes the place that you live in? by Gender & Age

KNPD/PROG/0313 RESEARCH REPORT Confidential – all rights reserved - Informa Consultants 2014 24
CountsAnaly sis %Break %Respondents Total
Base
Visualimpairment
Hearingimpairment
Physicalimpairment
Intellectualimpairment
Mental healthissues
Specific learningdifficulties Other
I live in my house withmy partner and/or
children
I'm still living in myfamily's house with one
or both parents
I live on my own in myfamily's house
I live in another place onmy own
I'm still living in myfamily's house with oneor more of my siblings
(without parents)
Other
I live with one of mysiblings, in their house
I live with one of mychildren, in his/her
house
I went to live in anelderly people's home
afterI turned 60
I live in an institutionsince I do not have
enough support to livein the community
One of my childrenmoved in with me
600 6811.3%
6110.2%
48781.2%
7111.8%
447.3%
345.7%
376.2%
32854.7%
3811.6%55.9%
3510.7%57.4%
28787.5%58.9%
113.4%
15.5%
113.4%
25.0%
---
195.8%
51.4%
9716.2%
1212.4%17.6%
99.3%
14.8%
5152.6%10.5%
3637.1%50.7%
1313.4%29.5%
2828.9%82.4%
99.3%
24.3%
6010.0%
711.7%10.3%
711.7%11.5%
5693.3%11.5%
11.7%1.4%
58.3%
11.4%
---
11.7%2.7%
325.3%
39.4%4.4%
26.3%3.3%
2990.6%
6.0%
---
39.4%6.8%
---
412.5%10.8%
264.3%
27.7%2.9%
415.4%
6.6%
2076.9%
4.1%
623.1%
8.5%
27.7%4.5%
311.5%8.8%
27.7%5.4%
203.3%
210.0%
2.9%
15.0%1.6%
1575.0%
3.1%
315.0%
4.2%
315.0%6.8%
---
---
91.5%
111.1%
1.5%
---
666.7%
1.2%
444.4%
5.6%
333.3%6.8%
222.2%5.9%
111.1%
2.7%
91.5%
---
111.1%
1.6%
888.9%
1.6%
333.3%
4.2%
333.3%6.8%
---
111.1%
2.7%
91.5%
222.2%
2.9%
222.2%
3.3%
888.9%
1.6%
111.1%
1.4%
111.1%2.3%
---
---
61.0%
---
---
350.0%
0.6%
6100.0%
8.5%
---
116.7%2.9%
---
40.7%
125.0%
1.5%
---
4100.0%
0.8%
---
---
---
---
Which of the following best describes the place that you live in? by Type of Impairment

KNPD/PROG/0313 RESEARCH REPORT Confidential – all rights reserved - Informa Consultants 2014 25
CountsAnaly sis %Break %Respondents Total
Base
SouthernHarbour
Northernharbour
SouthEastern Western Northern Gozo
I live in my house withmy partner and/or
children
I'm still living in myfamily's house with one
or both parents
I live on my own in myfamily's house
I live in another place onmy own
I'm still living in myfamily's house with oneor more of my siblings
(without parents)
Other
I live with one of mysiblings, in their house
I live with one of mychildren, in his/her
house
I went to live in anelderly people's home
afterI turned 60
I live in an institutionsince I do not have
enough support to livein the community
One of my childrenmoved in with me
600 14023.3%
19933.2%
7212.0%
9616.0%
7011.7%
233.8%
32854.7%
7723.5%55.0%
11334.5%56.8%
4012.2%55.6%
5115.5%53.1%
4112.5%58.6%
61.8%
26.1%
9716.2%
1818.6%12.9%
3637.1%18.1%
1212.4%16.7%
1616.5%16.7%
1111.3%15.7%
44.1%
17.4%
6010.0%
1830.0%12.9%
1830.0%9.0%
813.3%11.1%
711.7%
7.3%
610.0%8.6%
35.0%
13.0%
325.3%
1031.3%7.1%
1237.5%6.0%
412.5%
5.6%
26.3%2.1%
412.5%5.7%
---
264.3%
726.9%5.0%
726.9%3.5%
311.5%
4.2%
519.2%
5.2%
---
415.4%17.4%
203.3%
210.0%1.4%
525.0%2.5%
315.0%
4.2%
210.0%
2.1%
420.0%5.7%
420.0%17.4%
91.5%
444.4%2.9%
111.1%0.5%
111.1%
1.4%
222.2%
2.1%
---
111.1%4.3%
91.5%
111.1%0.7%
333.3%1.5%
---
444.4%
4.2%
111.1%1.4%
---
91.5%
222.2%1.4%
222.2%1.0%
111.1%
1.4%
111.1%
1.0%
222.2%2.9%
111.1%4.3%
61.0%
---
116.7%0.5%
---
583.3%
5.2%
---
---
40.7%
125.0%0.7%
125.0%0.5%
---
125.0%
1.0%
125.0%1.4%
---
Which of the following best describes the place that you live in? by Area

KNPD/PROG/0313 RESEARCH REPORT Confidential – all rights reserved - Informa Consultants 2014 26
CountsAnaly sis %Break %Respondents Total
Base
Male Female1 - 10years
11 - 20years
21 - 30years
31 - 40years
41 - 50years
50 - 60years
61 - 70years
71 years& over
I chose the place I live in
A family member chosethe place I live in
Another person chosethe place I live in
600 31953.2%
28146.8%
71.2%
203.3%
294.8%
376.2%
488.0%
7913.2%
13522.5%
24540.8%
42470.7%
23154.5%72.4%
19345.5%68.7%
10.2%
14.3%
40.9%
20.0%
10.2%3.4%
163.8%
43.2%
235.4%
47.9%
5713.4%72.2%
12028.3%88.9%
20247.6%82.4%
17429.0%
9252.9%28.8%
8247.1%29.2%
63.4%
85.7%
179.8%
85.0%
2715.5%93.1%
2011.5%54.1%
2112.1%43.8%
1910.9%24.1%
169.2%
11.9%
4827.6%19.6%
233.8%
939.1%2.8%
1460.9%5.0%
---
---
14.3%3.4%
14.3%2.7%
521.7%10.4%
417.4%
5.1%
417.4%
3.0%
834.8%3.3%
CountsAnaly sis %Break %Respondents Total
Base
Visualimpairment
Hearingimpairment
Physicalimpairment
Intellectualimpairment
Mental healthissues
Specific learningdifficulties Other
I chose the place I live in
A family member chosethe place I live in
Another person chosethe place I live in
600 6811.3%
6110.2%
48781.2%
7111.8%
447.3%
345.7%
376.2%
42470.7%
5112.0%75.0%
429.9%
68.9%
36987.0%75.8%
204.7%
28.2%
225.2%
50.0%
30.7%8.8%
215.0%
56.8%
17429.0%
137.5%
19.1%
2212.6%36.1%
11968.4%24.4%
5129.3%71.8%
169.2%
36.4%
3017.2%88.2%
158.6%
40.5%
233.8%
417.4%5.9%
14.3%1.6%
1773.9%3.5%
14.3%1.4%
626.1%13.6%
14.3%2.9%
14.3%2.7%
Which of the following best describes who chose the place you live in? by Gender & Age
Which of the following best describes who chose the place you live in? by Type of Impairment

KNPD/PROG/0313 RESEARCH REPORT Confidential – all rights reserved - Informa Consultants 2014 27
CountsAnaly sis %Break %Respondents Total
Base
Male Female1 - 10years
11 - 20years
21 - 30years
31 - 40years
41 - 50years
50 - 60years
61 - 70years
71 years& over
I would like to remainliving where I am
I would like to live in myown place
I would like to live inanother place with a few
other disabled people
I would like to live inanother place with many
other disabled people
600 31953.2%
28146.8%
71.2%
203.3%
294.8%
376.2%
488.0%
7913.2%
13522.5%
24540.8%
57195.2%
30653.6%95.9%
26546.4%94.3%
61.1%
85.7%
203.5%
100.0%
264.6%
89.7%
346.0%
91.9%
457.9%
93.8%
7312.8%92.4%
13022.8%96.3%
23741.5%96.7%
223.7%
1045.5%3.1%
1254.5%4.3%
14.5%
14.3%
---
29.1%6.9%
29.1%5.4%
313.6%
6.3%
418.2%
5.1%
522.7%
3.7%
522.7%2.0%
50.8%
120.0%0.3%
480.0%1.4%
---
---
---
120.0%2.7%
---
240.0%
2.5%
---
240.0%0.8%
20.3%
2100.0%
0.6%
---
---
---
150.0%3.4%
---
---
---
---
150.0%0.4%
CountsAnaly sis %Break %Respondents Total
Base
SouthernHarbour
Northernharbour
SouthEastern Western Northern Gozo
I chose the place I live in
A family member chosethe place I live in
Another person chosethe place I live in
600 14023.3%
19933.2%
7212.0%
9616.0%
7011.7%
233.8%
42470.7%
10224.1%72.9%
14133.3%70.9%
5913.9%81.9%
5713.4%59.4%
5312.5%75.7%
122.8%
52.2%
17429.0%
3319.0%23.6%
5229.9%26.1%
137.5%
18.1%
4425.3%45.8%
2112.1%30.0%
116.3%
47.8%
233.8%
834.8%5.7%
939.1%4.5%
---
313.0%
3.1%
28.7%2.9%
14.3%4.3%
Which of the following best describes who chose the place you live in? by Area Which of the following best describes the way you feel about the place that you live in? by Gender & Age

KNPD/PROG/0313 RESEARCH REPORT Confidential – all rights reserved - Informa Consultants 2014 28
CountsAnaly sis %Break %Respondents Total
Base
Visualimpairment
Hearingimpairment
Physicalimpairment
Intellectualimpairment
Mental healthissues
Specific learningdifficulties Other
I would like to remainliving where I am
I would like to live in myown place
I would like to live inanother place with a few
other disabled people
I would like to live inanother place with many
other disabled people
600 6811.3%
6110.2%
48781.2%
7111.8%
447.3%
345.7%
376.2%
57195.2%
6711.7%98.5%
5910.3%96.7%
46280.9%94.9%
6711.7%94.4%
396.8%
88.6%
315.4%
91.2%
335.8%
89.2%
223.7%
14.5%1.5%
29.1%3.3%
2090.9%4.1%
14.5%1.4%
313.6%6.8%
14.5%2.9%
313.6%8.1%
50.8%
---
---
480.0%0.8%
240.0%2.8%
120.0%2.3%
120.0%2.9%
120.0%2.7%
20.3%
---
---
150.0%0.2%
150.0%1.4%
150.0%2.3%
150.0%2.9%
---
CountsAnaly sis %Break %Respondents Total
Base
SouthernHarbour
Northernharbour
SouthEastern Western Northern Gozo
I would like to remainliving where I am
I would like to live in myown place
I would like to live inanother place with a few
other disabled people
I would like to live inanother place with many
other disabled people
600 14023.3%
19933.2%
7212.0%
9616.0%
7011.7%
233.8%
57195.2%
13022.8%92.9%
19133.5%96.0%
7112.4%98.6%
9216.1%95.8%
6511.4%92.9%
223.9%
95.7%
223.7%
731.8%5.0%
627.3%3.0%
---
313.6%
3.1%
522.7%7.1%
14.5%4.3%
50.8%
240.0%1.4%
240.0%1.0%
---
120.0%
1.0%
---
---
20.3%
150.0%0.7%
---
150.0%
1.4%
---
---
---
Which of the following best describes the way you feel about the place that you live in? by Type of Impairment
Which of the following best describes the way you feel about the place that you live in? by Area

KNPD/PROG/0313 RESEARCH REPORT Confidential – all rights reserved - Informa Consultants 2014 29
CountsAnaly sis %Break %Respondents Total
Base
Male Female1 - 10years
11 - 20years
21 - 30years
31 - 40years
41 - 50years
50 - 60years
61 - 70years
71 years& over
€500 or less
Between €501 - €700
Between €701 - €1000
I do not wish to answer
Between €1001 - €1500
Between €1501 - 2000
€2001 or more
600 31953.2%
28146.8%
71.2%
203.3%
294.8%
376.2%
488.0%
7913.2%
13522.5%
24540.8%
24240.3%
9840.5%30.7%
14459.5%51.2%
72.9%
100.0%
208.3%
100.0%
249.9%
82.8%
239.5%
62.2%
3012.4%62.5%
3012.4%38.0%
3916.1%28.9%
6928.5%28.2%
16427.3%
9759.1%30.4%
6740.9%23.8%
---
---
10.6%3.4%
31.8%8.1%
74.3%
14.6%
2012.2%25.3%
4728.7%34.8%
8652.4%35.1%
12420.7%
8770.2%27.3%
3729.8%13.2%
---
---
32.4%
10.3%
43.2%
10.8%
54.0%
10.4%
1612.9%20.3%
3830.6%28.1%
5846.8%23.7%
355.8%
822.9%2.5%
2777.1%9.6%
---
---
12.9%3.4%
25.7%5.4%
25.7%4.2%
617.1%
7.6%
720.0%
5.2%
1748.6%6.9%
223.7%
1881.8%5.6%
418.2%1.4%
---
---
---
313.6%8.1%
29.1%4.2%
627.3%
7.6%
313.6%
2.2%
836.4%3.3%
71.2%
685.7%1.9%
114.3%0.4%
---
---
---
---
228.6%
4.2%
114.3%
1.3%
114.3%
0.7%
342.9%1.2%
61.0%
583.3%1.6%
116.7%0.4%
---
---
---
233.3%5.4%
---
---
---
466.7%1.6%
How much income do you receive monthly? by Gender & Age

KNPD/PROG/0313 RESEARCH REPORT Confidential – all rights reserved - Informa Consultants 2014 30
CountsAnaly sis %Break %Respondents Total
Base
Visualimpairment
Hearingimpairment
Physicalimpairment
Intellectualimpairment
Mental healthissues
Specific learningdifficulties Other
€500 or less
Between €501 - €700
Between €701 - €1000
I do not wish to answer
Between €1001 - €1500
Between €1501 - 2000
€2001 or more
600 6811.3%
6110.2%
48781.2%
7111.8%
447.3%
345.7%
376.2%
24240.3%
2811.6%41.2%
187.4%
29.5%
18174.8%37.2%
5824.0%81.7%
3012.4%68.2%
3313.6%97.1%
177.0%
45.9%
16427.3%
2515.2%36.8%
2414.6%39.3%
13381.1%27.3%
74.3%9.9%
63.7%
13.6%
10.6%2.9%
127.3%
32.4%
12420.7%
108.1%
14.7%
129.7%
19.7%
11189.5%22.8%
64.8%8.5%
43.2%9.1%
---
64.8%
16.2%
355.8%
38.6%4.4%
617.1%
9.8%
2982.9%
6.0%
---
25.7%4.5%
---
12.9%2.7%
223.7%
14.5%1.5%
14.5%1.6%
2090.9%
4.1%
---
14.5%2.3%
---
14.5%2.7%
71.2%
---
---
7100.0%
1.4%
---
114.3%2.3%
---
---
61.0%
116.7%
1.5%
---
6100.0%
1.2%
---
---
---
---
How much income do you receive monthly? by Type of Impairment

KNPD/PROG/0313 RESEARCH REPORT Confidential – all rights reserved - Informa Consultants 2014 31
CountsAnaly sis %Break %Respondents Total
Base
SouthernHarbour
Northernharbour
SouthEastern Western Northern Gozo
€500 or less
Between €501 - €700
Between €701 - €1000
Between €1001 - €1500
Between €1501 - 2000
€2001 or more
I do not wish to answer
600 14023.3%
19933.2%
7212.0%
9616.0%
7011.7%
233.8%
24240.3%
5422.3%38.6%
7832.2%39.2%
3213.2%44.4%
4317.8%44.8%
249.9%
34.3%
114.5%
47.8%
16427.3%
4024.4%28.6%
6036.6%30.2%
1811.0%25.0%
2112.8%21.9%
1811.0%25.7%
74.3%
30.4%
12420.7%
3326.6%23.6%
3729.8%18.6%
1713.7%23.6%
1915.3%19.8%
1713.7%24.3%
10.8%4.3%
223.7%
522.7%3.6%
836.4%4.0%
29.1%2.8%
418.2%
4.2%
29.1%2.9%
14.5%4.3%
71.2%
114.3%0.7%
114.3%0.5%
228.6%
2.8%
114.3%
1.0%
114.3%1.4%
114.3%4.3%
61.0%
---
233.3%1.0%
116.7%
1.4%
233.3%
2.1%
116.7%1.4%
---
355.8%
720.0%5.0%
1337.1%6.5%
---
617.1%
6.3%
720.0%10.0%
25.7%8.7%
How much income do you receive monthly? By Area

KNPD/PROG/0313 RESEARCH REPORT Confidential – all rights reserved - Informa Consultants 2014 32
CountsAnaly sis %Break %Respondents Total
Base
Male Female1 - 10years
11 - 20years
21 - 30years
31 - 40years
41 - 50years
50 - 60years
61 - 70years
71 years& over
Transport provided bythe family
Transport you driveyourself (car, van etc)
Public buses
The ferry between Malta &Gozo
Transport provided byan organisation
Paid transport (eg Taxi,van)
Transport provided byfriends
587 31653.8%
27146.2%
71.2%
203.4%
294.9%
376.3%
488.2%
7913.5%
13122.3%
23640.2%
35059.6%
16346.6%51.6%
18753.4%69.0%
51.4%
71.4%
144.0%
70.0%
246.9%
82.8%
226.3%
59.5%
246.9%
50.0%
4111.7%51.9%
7020.0%53.4%
15042.9%63.6%
24541.7%
17471.0%55.1%
7129.0%26.2%
10.4%
14.3%
31.2%
15.0%
41.6%
13.8%
135.3%
35.1%
218.6%
43.8%
5120.8%64.6%
6727.3%51.1%
8534.7%36.0%
15025.6%
8858.7%27.8%
6241.3%22.9%
21.3%
28.6%
117.3%
55.0%
74.7%
24.1%
117.3%
29.7%
1711.3%35.4%
2214.7%27.8%
3926.0%29.8%
4127.3%17.4%
11519.6%
7161.7%22.5%
4438.3%16.2%
---
76.1%
35.0%
87.0%
27.6%
76.1%
18.9%
1311.3%27.1%
2118.3%26.6%
1916.5%14.5%
4034.8%16.9%
7011.9%
2637.1%8.2%
4462.9%16.2%
22.9%
28.6%
34.3%
15.0%
68.6%
20.7%
912.9%24.3%
811.4%16.7%
811.4%10.1%
57.1%3.8%
2941.4%12.3%
579.7%
3154.4%9.8%
2645.6%9.6%
11.8%
14.3%
47.0%
20.0%
35.3%
10.3%
---
814.0%16.7%
610.5%
7.6%
1119.3%
8.4%
2442.1%10.2%
549.2%
3157.4%9.8%
2342.6%8.5%
---
11.9%5.0%
59.3%
17.2%
35.6%8.1%
59.3%
10.4%
1120.4%13.9%
814.8%
6.1%
2138.9%8.9%
Which of the following means of transport do you use? by Gender & Age

KNPD/PROG/0313 RESEARCH REPORT Confidential – all rights reserved - Informa Consultants 2014 33
CountsAnaly sis %Break %Respondents Total
Base
Visualimpairment
Hearingimpairment
Physicalimpairment
Intellectualimpairment
Mental healthissues
Specific learningdifficulties Other
Transport provided bythe family
Transport you driveyourself (car, van etc)
Public buses
The ferry between Malta &Gozo
Transport provided byan organisation
Paid transport (eg Taxi,van)
Transport provided byfriends
587 6711.4%
6110.4%
47681.1%
7011.9%
427.2%
345.8%
366.1%
35059.6%
4713.4%70.1%
3510.0%57.4%
27879.4%58.4%
5114.6%72.9%
236.6%
54.8%
226.3%
64.7%
205.7%
55.6%
24541.7%
166.5%
23.9%
229.0%
36.1%
22391.0%46.8%
62.4%8.6%
104.1%
23.8%
72.9%
20.6%
145.7%
38.9%
15025.6%
1912.7%28.4%
2718.0%44.3%
10469.3%21.8%
2114.0%30.0%
1510.0%35.7%
138.7%
38.2%
149.3%
38.9%
11519.6%
76.1%
10.4%
1815.7%29.5%
9380.9%19.5%
2219.1%31.4%
65.2%
14.3%
97.8%
26.5%
32.6%8.3%
7011.9%
710.0%10.4%
57.1%8.2%
5477.1%11.3%
2332.9%32.9%
68.6%
14.3%
710.0%20.6%
811.4%22.2%
579.7%
712.3%10.4%
610.5%9.8%
4680.7%9.7%
814.0%11.4%
610.5%14.3%
47.0%
11.8%
47.0%
11.1%
549.2%
713.0%10.4%
1120.4%18.0%
4583.3%9.5%
59.3%7.1%
23.7%4.8%
11.9%2.9%
23.7%5.6%
Which of the following means of transport do you use? by Gender & Age

KNPD/PROG/0313 RESEARCH REPORT Confidential – all rights reserved - Informa Consultants 2014 34
CountsAnaly sis %Break %Respondents Total
Base
SouthernHarbour
Northernharbour
SouthEastern Western Northern Gozo
Transport provided bythe family
Transport you driveyourself (car, van etc)
Public buses
The ferry between Malta &Gozo
Transport provided byan organisation
Paid transport (eg Taxi,van)
Transport provided byfriends
587 13823.5%
19332.9%
6911.8%
9416.0%
7011.9%
233.9%
35059.6%
8123.1%58.7%
11733.4%60.6%
4212.0%60.9%
6017.1%63.8%
3911.1%55.7%
113.1%
47.8%
24541.7%
5321.6%38.4%
8032.7%41.5%
2610.6%37.7%
4518.4%47.9%
3413.9%48.6%
72.9%
30.4%
15025.6%
3724.7%26.8%
4228.0%21.8%
128.0%
17.4%
2818.7%29.8%
2718.0%38.6%
42.7%
17.4%
11519.6%
87.0%5.8%
3328.7%17.1%
---
3227.8%34.0%
3732.2%52.9%
54.3%
21.7%
7011.9%
1825.7%13.0%
2028.6%10.4%
57.1%7.2%
1521.4%16.0%
710.0%10.0%
57.1%
21.7%
579.7%
1424.6%10.1%
1526.3%7.8%
712.3%10.1%
58.8%5.3%
1526.3%21.4%
11.8%4.3%
549.2%
814.8%5.8%
1731.5%8.8%
47.4%5.8%
1629.6%17.0%
713.0%10.0%
23.7%8.7%
Which of the following means of transport do you use? by Area

KNPD/PROG/0313 RESEARCH REPORT Confidential – all rights reserved - Informa Consultants 2014 35
CountsAnaly sis %Break %Respondents Total
Base
Male Female1 - 10years
11 - 20years
21 - 30years
31 - 40years
41 - 50years
50 - 60years
61 - 70years
71 years& over
Yes
No
Wish to
600 31953.2%
28146.8%
71.2%
203.3%
294.8%
376.2%
488.0%
7913.2%
13522.5%
24540.8%
10217.0%
5654.9%17.6%
4645.1%16.4%
43.9%
57.1%
109.8%
50.0%
109.8%
34.5%
1312.7%35.1%
1211.8%25.0%
1312.7%16.5%
2019.6%14.8%
2019.6%8.2%
48781.2%
25853.0%80.9%
22947.0%81.5%
30.6%
42.9%
102.1%
50.0%
163.3%
55.2%
234.7%
62.2%
367.4%
75.0%
6212.7%78.5%
11223.0%83.0%
22546.2%91.8%
111.8%
545.5%1.6%
654.5%2.1%
---
---
327.3%10.3%
19.1%2.7%
---
436.4%
5.1%
327.3%
2.2%
---
CountsAnaly sis %Break %Respondents Total
Base
Visualimpairment
Hearingimpairment
Physicalimpairment
Intellectualimpairment
Mental healthissues
Specific learningdifficulties Other
Yes
No
Wish to
600 6811.3%
6110.2%
48781.2%
7111.8%
447.3%
345.7%
376.2%
10217.0%
1413.7%20.6%
98.8%
14.8%
6664.7%13.6%
1716.7%23.9%
109.8%
22.7%
1615.7%47.1%
54.9%
13.5%
48781.2%
5310.9%77.9%
5110.5%83.6%
41184.4%84.4%
5310.9%74.6%
347.0%
77.3%
183.7%
52.9%
326.6%
86.5%
111.8%
19.1%1.5%
19.1%1.6%
1090.9%2.1%
19.1%1.4%
---
---
---
Can you tell me whether you are a member of an organization for disabled persons, or if you wish to be? by Gender & Age
Can you tell me whether you are a member of an organization for disabled persons, or if you wish to be? by Type of Impairment

KNPD/PROG/0313 RESEARCH REPORT Confidential – all rights reserved - Informa Consultants 2014 36
CountsAnaly sis %Break %Respondents Total
Base
Male Female1 - 10years
11 - 20years
21 - 30years
31 - 40years
41 - 50years
50 - 60years
61 - 70years
71 years& over
Yes
No
Wish to
600 31953.2%
28146.8%
71.2%
203.3%
294.8%
376.2%
488.0%
7913.2%
13522.5%
24540.8%
345.7%
2264.7%6.9%
1235.3%4.3%
25.9%
28.6%
411.8%20.0%
514.7%17.2%
617.6%16.2%
38.8%6.3%
12.9%1.3%
720.6%
5.2%
617.6%2.4%
55592.5%
29152.4%91.2%
26447.6%94.0%
50.9%
71.4%
152.7%
75.0%
213.8%
72.4%
315.6%
83.8%
458.1%
93.8%
7413.3%93.7%
12522.5%92.6%
23943.1%97.6%
111.8%
654.5%1.9%
545.5%1.8%
---
19.1%5.0%
327.3%10.3%
---
---
436.4%
5.1%
327.3%
2.2%
---
CountsAnaly sis %Break %Respondents Total
Base
SouthernHarbour
Northernharbour
SouthEastern Western Northern Gozo
Yes
No
Wish to
600 14023.3%
19933.2%
7212.0%
9616.0%
7011.7%
233.8%
10217.0%
2625.5%18.6%
3837.3%19.1%
1110.8%15.3%
87.8%8.3%
1413.7%20.0%
54.9%
21.7%
48781.2%
11323.2%80.7%
15732.2%78.9%
6112.5%84.7%
8417.2%87.5%
5411.1%77.1%
183.7%
78.3%
111.8%
19.1%0.7%
436.4%2.0%
---
436.4%
4.2%
218.2%2.9%
---
Can you tell me whether you are a member of an organization for disabled persons, or if you wish to be? By Area Can you tell me whether you are a member of another non-governmental organization for persons with a disability, or if you wish to be? by Gender & Age

KNPD/PROG/0313 RESEARCH REPORT Confidential – all rights reserved - Informa Consultants 2014 37
CountsAnaly sis %Break %Respondents Total
Base
Visualimpairment
Hearingimpairment
Physicalimpairment
Intellectualimpairment
Mental healthissues
Specific learningdifficulties Other
Yes
No
Wish to
600 6811.3%
6110.2%
48781.2%
7111.8%
447.3%
345.7%
376.2%
345.7%
617.6%8.8%
25.9%3.3%
2367.6%4.7%
1132.4%15.5%
25.9%4.5%
617.6%17.6%
514.7%13.5%
55592.5%
6111.0%89.7%
5810.5%95.1%
45582.0%93.4%
5810.5%81.7%
427.6%
95.5%
285.0%
82.4%
325.8%
86.5%
111.8%
19.1%1.5%
19.1%1.6%
981.8%1.8%
218.2%2.8%
---
---
---
CountsAnaly sis %Break %Respondents Total
Base
SouthernHarbour
Northernharbour
SouthEastern Western Northern Gozo
Yes
No
Wish to
600 14023.3%
19933.2%
7212.0%
9616.0%
7011.7%
233.8%
345.7%
514.7%3.6%
1235.3%6.0%
38.8%4.2%
617.6%
6.3%
617.6%8.6%
25.9%8.7%
55592.5%
13424.1%95.7%
18333.0%92.0%
6912.4%95.8%
8715.7%90.6%
6211.2%88.6%
203.6%
87.0%
111.8%
19.1%0.7%
436.4%2.0%
---
327.3%
3.1%
218.2%2.9%
19.1%4.3%
Can you tell me whether you are a member of another non-governmental organization for persons with a disability, or if you wish to be? by Type of Impairment
Can you tell me whether you are a member of another non-governmental organization for persons with a disability, or if you wish to be? by

KNPD/PROG/0313 RESEARCH REPORT Confidential – all rights reserved - Informa Consultants 2014 38
CountsAnaly sis %Break %Respondents Total
Base
Male Female1 - 10years
11 - 20years
21 - 30years
31 - 40years
41 - 50years
50 - 60years
61 - 70years
71 years& over
Yes
No
Wish to
600 31953.2%
28146.8%
71.2%
203.3%
294.8%
376.2%
488.0%
7913.2%
13522.5%
24540.8%
518.5%
3058.8%9.4%
2141.2%7.5%
---
35.9%
15.0%
713.7%24.1%
23.9%5.4%
611.8%12.5%
47.8%5.1%
815.7%
5.9%
2141.2%8.6%
54290.3%
28452.4%89.0%
25847.6%91.8%
71.3%
100.0%
163.0%
80.0%
183.3%
62.1%
356.5%
94.6%
427.7%
87.5%
7313.5%92.4%
12723.4%94.1%
22441.3%91.4%
71.2%
571.4%1.6%
228.6%0.7%
---
114.3%5.0%
457.1%13.8%
---
---
228.6%
2.5%
---
---
CountsAnaly sis %Break %Respondents Total
Base
Visualimpairment
Hearingimpairment
Physicalimpairment
Intellectualimpairment
Mental healthissues
Specific learningdifficulties Other
Yes
No
Wish to
600 6811.3%
6110.2%
48781.2%
7111.8%
447.3%
345.7%
376.2%
518.5%
47.8%5.9%
917.6%14.8%
4486.3%
9.0%
35.9%4.2%
23.9%4.5%
47.8%
11.8%
23.9%5.4%
54290.3%
6211.4%91.2%
509.2%
82.0%
43981.0%90.1%
6612.2%93.0%
427.7%
95.5%
305.5%
88.2%
346.3%
91.9%
71.2%
228.6%
2.9%
228.6%
3.3%
457.1%
0.8%
228.6%
2.8%
---
---
114.3%
2.7%
Can you tell me whether you are a member of a non-governmental organization involved in a different sector, or if you wish to be? by Gender & Age
Can you tell me whether you are a member of a non-governmental organization involved in a different sector, or if you wish to be? by Type of Impairment

KNPD/PROG/0313 RESEARCH REPORT Confidential – all rights reserved - Informa Consultants 2014 39
CountsAnaly sis %Break %Respondents Total
Base
Male Female1 - 10years
11 - 20years
21 - 30years
31 - 40years
41 - 50years
50 - 60years
61 - 70years
71 years& over
Yes
No
Don't know
600 31953.2%
28146.8%
71.2%
203.3%
294.8%
376.2%
488.0%
7913.2%
13522.5%
24540.8%
538.8%
2750.9%8.5%
2649.1%9.3%
35.7%
42.9%
23.8%
10.0%
611.3%20.7%
35.7%8.1%
815.1%16.7%
1018.9%12.7%
1222.6%
8.9%
917.0%3.7%
51085.0%
27353.5%85.6%
23746.5%84.3%
40.8%
57.1%
173.3%
85.0%
203.9%
69.0%
326.3%
86.5%
346.7%
70.8%
6212.2%78.5%
11422.4%84.4%
22744.5%92.7%
376.2%
1951.4%6.0%
1848.6%6.4%
---
12.7%5.0%
38.1%
10.3%
25.4%5.4%
616.2%12.5%
718.9%
8.9%
924.3%
6.7%
924.3%3.7%
CountsAnaly sis %Break %Respondents Total
Base
SouthernHarbour
Northernharbour
SouthEastern Western Northern Gozo
Yes
No
Wish to
600 14023.3%
19933.2%
7212.0%
9616.0%
7011.7%
233.8%
518.5%
59.8%3.6%
2345.1%11.6%
59.8%6.9%
1325.5%13.5%
47.8%5.7%
12.0%4.3%
54290.3%
13424.7%95.7%
17432.1%87.4%
6712.4%93.1%
8114.9%84.4%
6512.0%92.9%
213.9%
91.3%
71.2%
114.3%0.7%
228.6%1.0%
---
228.6%
2.1%
114.3%1.4%
114.3%4.3%
Can you tell me whether you are a member of a non-governmental organization involved in a different sector, or if you wish to be? By
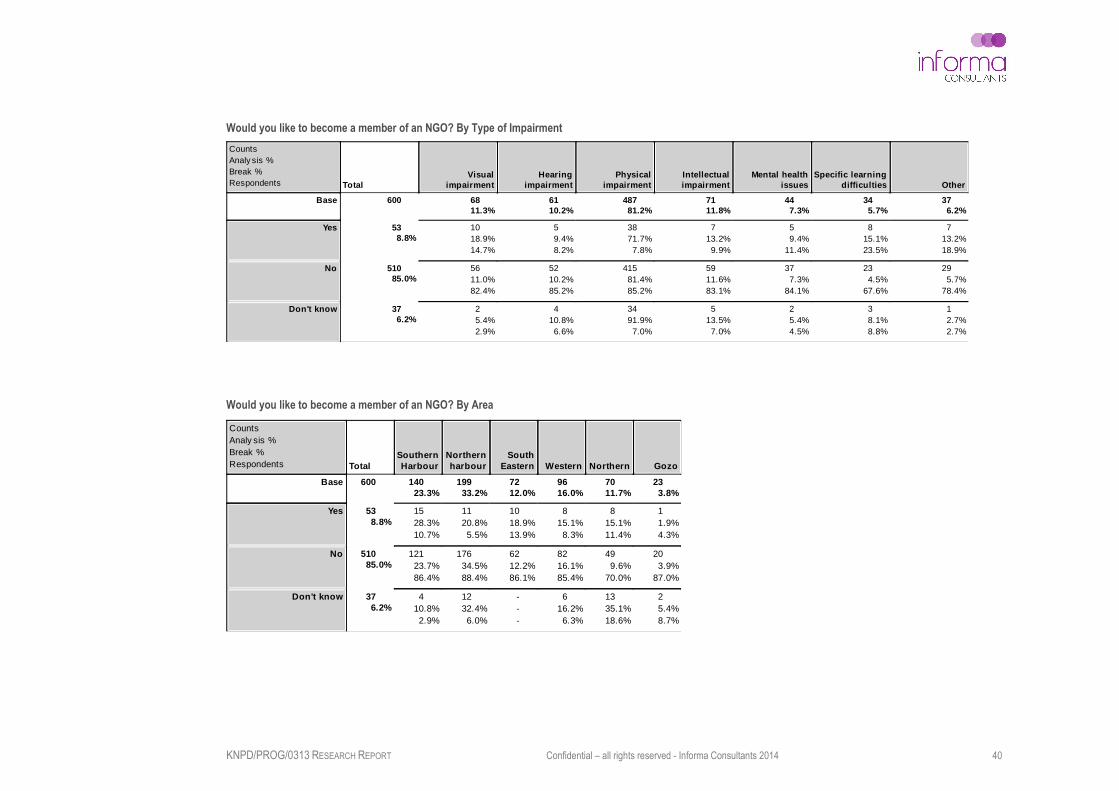
Would you like to become a member of an NGO? by Gender & Age
KNPD/PROG/0313 RESEARCH REPORT Confidential – all rights reserved - Informa Consultants 2014 40
CountsAnaly sis %Break %Respondents Total
Base
Visualimpairment
Hearingimpairment
Physicalimpairment
Intellectualimpairment
Mental healthissues
Specific learningdifficulties Other
Yes
No
Don't know
600 6811.3%
6110.2%
48781.2%
7111.8%
447.3%
345.7%
376.2%
538.8%
1018.9%14.7%
59.4%8.2%
3871.7%
7.8%
713.2%
9.9%
59.4%
11.4%
815.1%23.5%
713.2%18.9%
51085.0%
5611.0%82.4%
5210.2%85.2%
41581.4%85.2%
5911.6%83.1%
377.3%
84.1%
234.5%
67.6%
295.7%
78.4%
376.2%
25.4%2.9%
410.8%
6.6%
3491.9%
7.0%
513.5%
7.0%
25.4%4.5%
38.1%8.8%
12.7%2.7%
CountsAnaly sis %Break %Respondents Total
Base
SouthernHarbour
Northernharbour
SouthEastern Western Northern Gozo
Yes
No
Don't know
600 14023.3%
19933.2%
7212.0%
9616.0%
7011.7%
233.8%
538.8%
1528.3%10.7%
1120.8%5.5%
1018.9%13.9%
815.1%
8.3%
815.1%11.4%
11.9%4.3%
51085.0%
12123.7%86.4%
17634.5%88.4%
6212.2%86.1%
8216.1%85.4%
499.6%
70.0%
203.9%
87.0%
376.2%
410.8%2.9%
1232.4%6.0%
---
616.2%
6.3%
1335.1%18.6%
25.4%8.7%
Would you like to become a member of an NGO? By Type of Impairment
Would you like to become a member of an NGO? By Area

KNPD/PROG/0313 RESEARCH REPORT Confidential – all rights reserved - Informa Consultants 2014 41
CountsAnaly sis %Break %Respondents Total
Base
Male Female1 - 10years
11 - 20years
21 - 30years
31 - 40years
41 - 50years
50 - 60years
61 - 70years
71 years& over
Paid for by yourself
Paid for by your family
Paid for by government
Paid for by anotherentity
264 12246.2%
14253.8%
72.7%
83.0%
103.8%
114.2%
176.4%
259.5%
5119.3%
13551.1%
17967.8%
8648.0%70.5%
9352.0%65.5%
21.1%
28.6%
31.7%
37.5%
63.4%
60.0%
42.2%
36.4%
95.0%
52.9%
1910.6%76.0%
3519.6%68.6%
10156.4%74.8%
5018.9%
2550.0%20.5%
2550.0%17.6%
48.0%
57.1%
36.0%
37.5%
48.0%
40.0%
36.0%
27.3%
48.0%
23.5%
36.0%
12.0%
1020.0%19.6%
1938.0%14.1%
10840.9%
4541.7%36.9%
6358.3%44.4%
32.8%
42.9%
65.6%
75.0%
54.6%
50.0%
65.6%
54.5%
98.3%
52.9%
98.3%
36.0%
2018.5%39.2%
5046.3%37.0%
124.5%
541.7%4.1%
758.3%4.9%
---
---
18.3%
10.0%
18.3%9.1%
216.7%11.8%
18.3%4.0%
18.3%2.0%
650.0%4.4%
CountsAnaly sis %Break %Respondents Total
Base
Visualimpairment
Hearingimpairment
Physicalimpairment
Intellectualimpairment
Mental healthissues
Specific learningdifficulties Other
Paid for by yourself
Paid for by your family
Paid for by government
Paid for by anotherentity
264 3212.1%
2810.6%
20979.2%
3613.6%
2710.2%
218.0%
83.0%
17967.8%
2514.0%78.1%
1810.1%64.3%
14983.2%71.3%
147.8%
38.9%
147.8%
51.9%
73.9%
33.3%
42.2%
50.0%
5018.9%
48.0%
12.5%
48.0%
14.3%
3774.0%17.7%
1326.0%36.1%
816.0%29.6%
1122.0%52.4%
48.0%
50.0%
10840.9%
109.3%
31.3%
1312.0%46.4%
8376.9%39.7%
1413.0%38.9%
1312.0%48.1%
87.4%
38.1%
43.7%
50.0%
124.5%
18.3%3.1%
216.7%7.1%
758.3%3.3%
541.7%13.9%
216.7%7.4%
---
---
The personal assistance you receive is... by Gender & Age
The personal assistance you receive is... by Type of Impairment

KNPD/PROG/0313 RESEARCH REPORT Confidential – all rights reserved - Informa Consultants 2014 42
CountsAnaly sis %Break %Respondents Total
Base
Male Female1 - 10years
11 - 20years
21 - 30years
31 - 40years
41 - 50years
50 - 60years
61 - 70years
71 years& over
Yes
No
Don't know
600 31953.2%
28146.8%
71.2%
203.3%
294.8%
376.2%
488.0%
7913.2%
13522.5%
24540.8%
13522.5%
7958.5%24.8%
5641.5%19.9%
---
43.0%
20.0%
53.7%
17.2%
118.1%
29.7%
85.9%
16.7%
1712.6%21.5%
3123.0%23.0%
5943.7%24.1%
33355.5%
17051.1%53.3%
16348.9%58.0%
72.1%
100.0%
103.0%
50.0%
154.5%
51.7%
206.0%
54.1%
298.7%
60.4%
4814.4%60.8%
7823.4%57.8%
12637.8%51.4%
13222.0%
7053.0%21.9%
6247.0%22.1%
---
64.5%
30.0%
96.8%
31.0%
64.5%
16.2%
118.3%
22.9%
1410.6%17.7%
2619.7%19.3%
6045.5%24.5%
CountsAnaly sis %Break %Respondents Total
Base
SouthernHarbour
Northernharbour
SouthEastern Western Northern Gozo
Paid for by yourself
Paid for by your family
Paid for by government
Paid for by anotherentity
264 5420.5%
9034.1%
4918.6%
3011.4%
3312.5%
83.0%
17967.8%
3620.1%66.7%
6033.5%66.7%
3921.8%79.6%
158.4%
50.0%
2212.3%66.7%
73.9%
87.5%
5018.9%
1122.0%20.4%
2142.0%23.3%
36.0%6.1%
714.0%23.3%
714.0%21.2%
12.0%
12.5%
10840.9%
2422.2%44.4%
2624.1%28.9%
3431.5%69.4%
87.4%
26.7%
1312.0%39.4%
32.8%
37.5%
124.5%
216.7%3.7%
216.7%2.2%
---
758.3%23.3%
18.3%3.0%
---
The personal assistance you receive is... by Area Are you ready to pay, to have more personal assistance? by Gender & Age
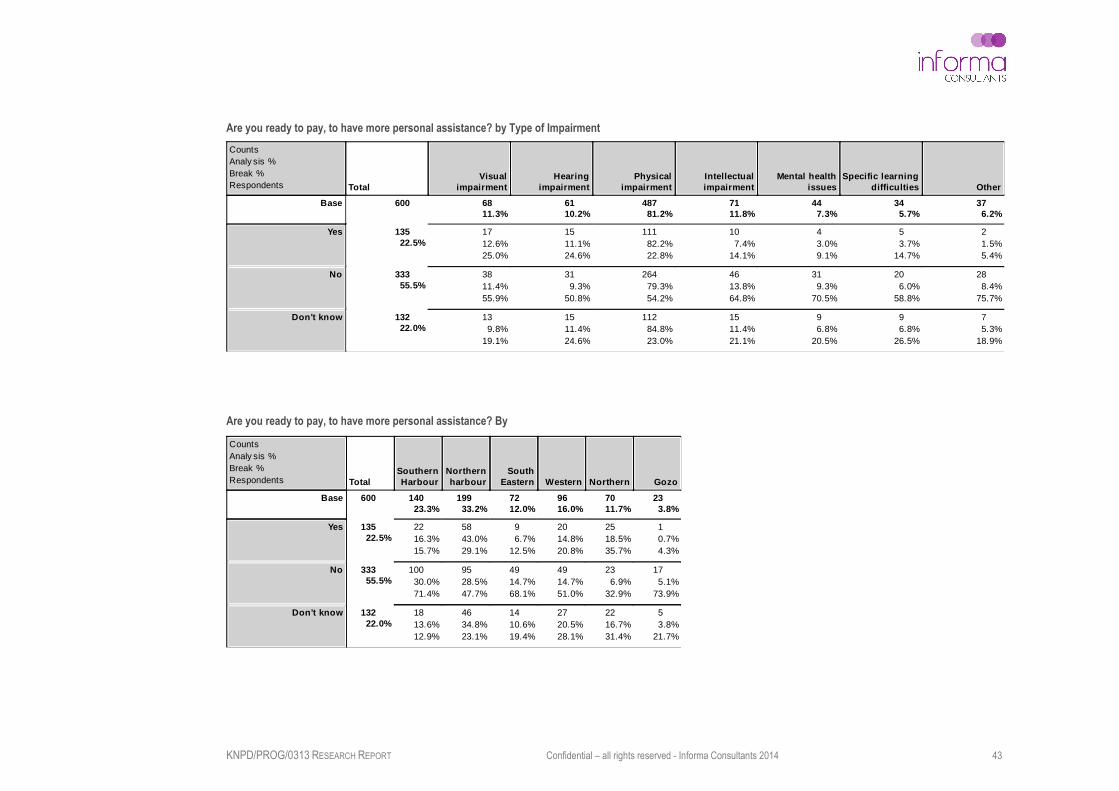
KNPD/PROG/0313 RESEARCH REPORT Confidential – all rights reserved - Informa Consultants 2014 43
CountsAnaly sis %Break %Respondents Total
Base
Visualimpairment
Hearingimpairment
Physicalimpairment
Intellectualimpairment
Mental healthissues
Specific learningdifficulties Other
Yes
No
Don't know
600 6811.3%
6110.2%
48781.2%
7111.8%
447.3%
345.7%
376.2%
13522.5%
1712.6%25.0%
1511.1%24.6%
11182.2%22.8%
107.4%
14.1%
43.0%9.1%
53.7%
14.7%
21.5%5.4%
33355.5%
3811.4%55.9%
319.3%
50.8%
26479.3%54.2%
4613.8%64.8%
319.3%
70.5%
206.0%
58.8%
288.4%
75.7%
13222.0%
139.8%
19.1%
1511.4%24.6%
11284.8%23.0%
1511.4%21.1%
96.8%
20.5%
96.8%
26.5%
75.3%
18.9%
CountsAnaly sis %Break %Respondents Total
Base
SouthernHarbour
Northernharbour
SouthEastern Western Northern Gozo
Yes
No
Don't know
600 14023.3%
19933.2%
7212.0%
9616.0%
7011.7%
233.8%
13522.5%
2216.3%15.7%
5843.0%29.1%
96.7%
12.5%
2014.8%20.8%
2518.5%35.7%
10.7%4.3%
33355.5%
10030.0%71.4%
9528.5%47.7%
4914.7%68.1%
4914.7%51.0%
236.9%
32.9%
175.1%
73.9%
13222.0%
1813.6%12.9%
4634.8%23.1%
1410.6%19.4%
2720.5%28.1%
2216.7%31.4%
53.8%
21.7%
Are you ready to pay, to have more personal assistance? by Type of Impairment
Are you ready to pay, to have more personal assistance? By

KNPD/PROG/0313 RESEARCH REPORT Confidential – all rights reserved - Informa Consultants 2014 44
CountsAnaly sis %Break %Respondents Total
Base
Male Female1 - 10years
11 - 20years
21 - 30years
31 - 40years
41 - 50years
50 - 60years
61 - 70years
71 years& over
Yes
No
Don't know
600 31953.2%
28146.8%
71.2%
203.3%
294.8%
376.2%
488.0%
7913.2%
13522.5%
24540.8%
22737.8%
12454.6%38.9%
10345.4%36.7%
31.3%
42.9%
73.1%
35.0%
114.8%
37.9%
187.9%
48.6%
156.6%
31.3%
3113.7%39.2%
4720.7%34.8%
9541.9%38.8%
26043.3%
13150.4%41.1%
12949.6%45.9%
41.5%
57.1%
62.3%
30.0%
103.8%
34.5%
155.8%
40.5%
259.6%
52.1%
3814.6%48.1%
6223.8%45.9%
10038.5%40.8%
11318.8%
6456.6%20.1%
4943.4%17.4%
---
76.2%
35.0%
87.1%
27.6%
43.5%
10.8%
87.1%
16.7%
108.8%
12.7%
2623.0%19.3%
5044.2%20.4%
CountsAnaly sis %Break %Respondents Total
Base
Visualimpairment
Hearingimpairment
Physicalimpairment
Intellectualimpairment
Mental healthissues
Specific learningdifficulties Other
Yes
No
Don't know
600 6811.3%
6110.2%
48781.2%
7111.8%
447.3%
345.7%
376.2%
22737.8%
2310.1%33.8%
198.4%
31.1%
19485.5%39.8%
2310.1%32.4%
135.7%
29.5%
125.3%
35.3%
125.3%
32.4%
26043.3%
3111.9%45.6%
2710.4%44.3%
20277.7%41.5%
3413.1%47.9%
249.2%
54.5%
114.2%
32.4%
186.9%
48.6%
11318.8%
1412.4%20.6%
1513.3%24.6%
9180.5%18.7%
1412.4%19.7%
76.2%
15.9%
119.7%
32.4%
76.2%
18.9%
Are you ready to pay a subsidized price, to have more personal assistance? by Gender & Age
Are you ready to pay a subsidized price, to have more personal assistance? by Type of Impairment

KNPD/PROG/0313 RESEARCH REPORT Confidential – all rights reserved - Informa Consultants 2014 45
CountsAnaly sis %Break %Respondents Total
Base
Male Female1 - 10years
11 - 20years
21 - 30years
31 - 40years
41 - 50years
50 - 60years
61 - 70years
71 years& over
I paid for the equipmentI have
The equipment I have isfree
The equipment I havewas subsidised
I am ready to pay to havemore equipment
I am ready to pay asubsidised price to have
more equipment
402 19648.8%
20651.2%
41.0%
61.5%
184.5%
205.0%
287.0%
4611.4%
9523.6%
18546.0%
25663.7%
12046.9%61.2%
13653.1%66.0%
31.2%
75.0%
20.8%
33.3%
72.7%
38.9%
145.5%
70.0%
176.6%
60.7%
2710.5%58.7%
5621.9%58.9%
13050.8%70.3%
8120.1%
4353.1%21.9%
3846.9%18.4%
---
33.7%
50.0%
56.2%
27.8%
22.5%
10.0%
911.1%32.1%
89.9%
17.4%
2024.7%21.1%
3442.0%18.4%
10726.6%
5450.5%27.6%
5349.5%25.7%
10.9%
25.0%
21.9%
33.3%
109.3%
55.6%
65.6%
30.0%
65.6%
21.4%
1110.3%23.9%
2624.3%27.4%
4542.1%24.3%
61.5%
350.0%1.5%
350.0%1.5%
---
116.7%16.7%
---
116.7%5.0%
---
116.7%
2.2%
116.7%
1.1%
233.3%1.1%
379.2%
1437.8%7.1%
2362.2%11.2%
---
12.7%
16.7%
410.8%22.2%
513.5%25.0%
410.8%14.3%
513.5%10.9%
1027.0%10.5%
821.6%4.3%
CountsAnaly sis %Break %Respondents Total
Base
SouthernHarbour
Northernharbour
SouthEastern Western Northern Gozo
Yes
No
Don't know
600 14023.3%
19933.2%
7212.0%
9616.0%
7011.7%
233.8%
22737.8%
4419.4%31.4%
8738.3%43.7%
2611.5%36.1%
3314.5%34.4%
3415.0%48.6%
31.3%
13.0%
26043.3%
7729.6%55.0%
7127.3%35.7%
3513.5%48.6%
4416.9%45.8%
186.9%
25.7%
155.8%
65.2%
11318.8%
1916.8%13.6%
4136.3%20.6%
119.7%
15.3%
1916.8%19.8%
1815.9%25.7%
54.4%
21.7%
Are you ready to pay a subsidized price, to have more personal assistance? By Area Can you tell me which of the following apply to you? By Gender & Age

KNPD/PROG/0313 RESEARCH REPORT Confidential – all rights reserved - Informa Consultants 2014 46
CountsAnaly sis %Break %Respondents Total
Base
Visualimpairment
Hearingimpairment
Physicalimpairment
Intellectualimpairment
Mental healthissues
Specific learningdifficulties Other
I paid for the equipmentI have
The equipment I have isfree
The equipment I havewas subsidised
I am ready to pay to havemore equipment
I am ready to pay asubsidised price to have
more equipment
402 4210.4%
4511.2%
35989.3%
307.5%
276.7%
102.5%
205.0%
25663.7%
2810.9%66.7%
2810.9%62.2%
23391.0%64.9%
155.9%
50.0%
103.9%
37.0%
62.3%
60.0%
166.3%
80.0%
8120.1%
1012.3%23.8%
1113.6%24.4%
6985.2%19.2%
67.4%
20.0%
911.1%33.3%
22.5%
20.0%
67.4%
30.0%
10726.6%
98.4%
21.4%
1211.2%26.7%
10194.4%28.1%
1110.3%36.7%
109.3%
37.0%
21.9%
20.0%
54.7%
25.0%
61.5%
116.7%
2.4%
---
583.3%
1.4%
---
---
---
---
379.2%
38.1%7.1%
513.5%11.1%
3286.5%
8.9%
616.2%20.0%
410.8%14.8%
38.1%
30.0%
25.4%
10.0%
CountsAnaly sis %Break %Respondents Total
Base
SouthernHarbour
Northernharbour
SouthEastern Western Northern Gozo
I paid for the equipmentI have
The equipment I have isfree
The equipment I havewas subsidised
I am ready to pay to havemore equipment
I am ready to pay asubsidised price to have
more equipment
402 8922.1%
13934.6%
5714.2%
6115.2%
4410.9%
123.0%
25663.7%
5822.7%65.2%
8934.8%64.0%
3212.5%56.1%
3814.8%62.3%
2911.3%65.9%
103.9%
83.3%
8120.1%
2227.2%24.7%
1822.2%12.9%
2024.7%35.1%
78.6%
11.5%
1012.3%22.7%
44.9%
33.3%
10726.6%
1514.0%16.9%
4542.1%32.4%
109.3%
17.5%
2018.7%32.8%
1413.1%31.8%
32.8%
25.0%
61.5%
116.7%1.1%
233.3%1.4%
---
116.7%
1.6%
233.3%
4.5%
---
379.2%
821.6%9.0%
1745.9%12.2%
---
410.8%
6.6%
821.6%18.2%
---
Can you tell me which of the following apply to you? By Type of Impairment
Can you tell me which of the following apply to you? By Area
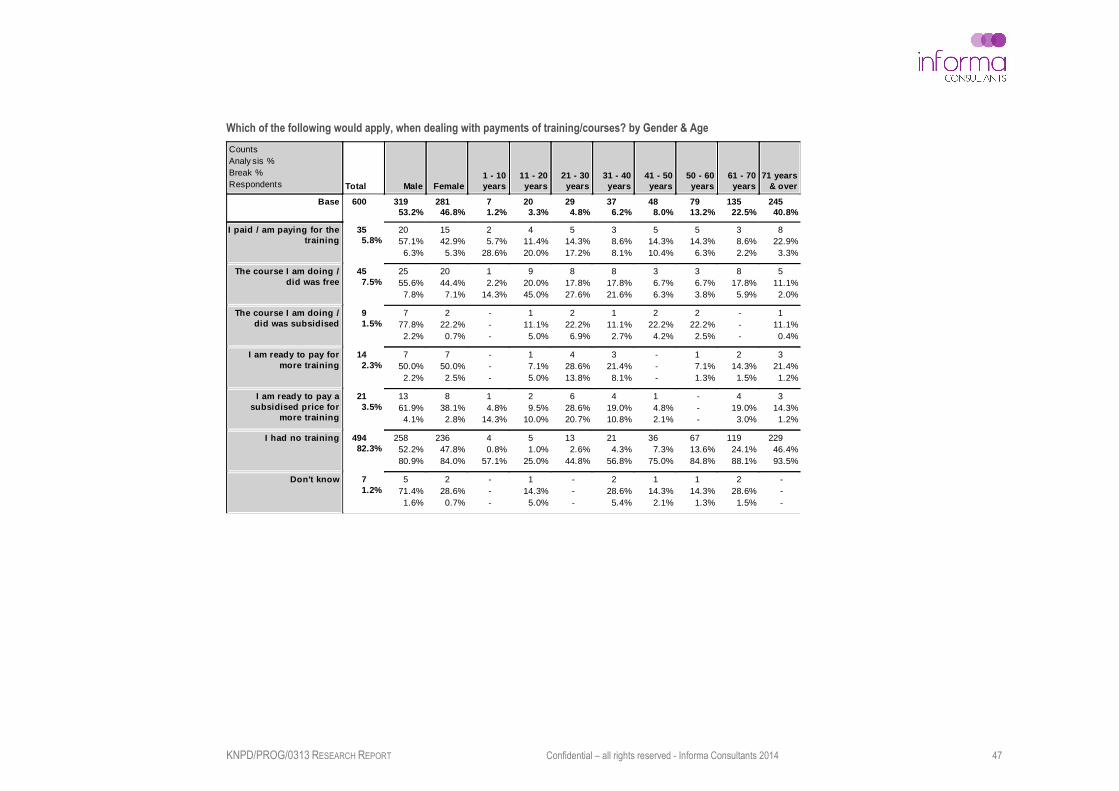
KNPD/PROG/0313 RESEARCH REPORT Confidential – all rights reserved - Informa Consultants 2014 47
CountsAnaly sis %Break %Respondents Total
Base
Male Female1 - 10years
11 - 20years
21 - 30years
31 - 40years
41 - 50years
50 - 60years
61 - 70years
71 years& over
I paid / am paying for thetraining
The course I am doing /did was free
The course I am doing /did was subsidised
I am ready to pay formore training
I am ready to pay asubsidised price for
more training
I had no training
Don't know
600 31953.2%
28146.8%
71.2%
203.3%
294.8%
376.2%
488.0%
7913.2%
13522.5%
24540.8%
355.8%
2057.1%6.3%
1542.9%5.3%
25.7%
28.6%
411.4%20.0%
514.3%17.2%
38.6%8.1%
514.3%10.4%
514.3%
6.3%
38.6%2.2%
822.9%3.3%
457.5%
2555.6%7.8%
2044.4%7.1%
12.2%
14.3%
920.0%45.0%
817.8%27.6%
817.8%21.6%
36.7%6.3%
36.7%3.8%
817.8%
5.9%
511.1%2.0%
91.5%
777.8%2.2%
222.2%0.7%
---
111.1%5.0%
222.2%6.9%
111.1%2.7%
222.2%
4.2%
222.2%
2.5%
---
111.1%0.4%
142.3%
750.0%2.2%
750.0%2.5%
---
17.1%5.0%
428.6%13.8%
321.4%8.1%
---
17.1%1.3%
214.3%
1.5%
321.4%1.2%
213.5%
1361.9%4.1%
838.1%2.8%
14.8%
14.3%
29.5%
10.0%
628.6%20.7%
419.0%10.8%
14.8%2.1%
---
419.0%
3.0%
314.3%1.2%
49482.3%
25852.2%80.9%
23647.8%84.0%
40.8%
57.1%
51.0%
25.0%
132.6%
44.8%
214.3%
56.8%
367.3%
75.0%
6713.6%84.8%
11924.1%88.1%
22946.4%93.5%
71.2%
571.4%1.6%
228.6%0.7%
---
114.3%5.0%
---
228.6%5.4%
114.3%
2.1%
114.3%
1.3%
228.6%
1.5%
---
Which of the following would apply, when dealing with payments of training/courses? by Gender & Age

KNPD/PROG/0313 RESEARCH REPORT Confidential – all rights reserved - Informa Consultants 2014 48
CountsAnaly sis %Break %Respondents Total
Base
Visualimpairment
Hearingimpairment
Physicalimpairment
Intellectualimpairment
Mental healthissues
Specific learningdifficulties Other
I paid / am paying for thetraining
The course I am doing /did was free
The course I am doing /did was subsidised
I am ready to pay formore training
I am ready to pay asubsidised price for
more training
I had no training
Don't know
600 6811.3%
6110.2%
48781.2%
7111.8%
447.3%
345.7%
376.2%
355.8%
720.0%10.3%
514.3%
8.2%
2674.3%
5.3%
38.6%4.2%
25.7%4.5%
514.3%14.7%
12.9%2.7%
457.5%
715.6%10.3%
511.1%
8.2%
2453.3%
4.9%
1431.1%19.7%
---
511.1%14.7%
1022.2%27.0%
91.5%
---
444.4%
6.6%
555.6%
1.0%
111.1%
1.4%
111.1%2.3%
333.3%8.8%
---
142.3%
214.3%
2.9%
17.1%1.6%
1285.7%
2.5%
321.4%
4.2%
17.1%2.3%
321.4%8.8%
17.1%2.7%
213.5%
523.8%
7.4%
29.5%3.3%
1571.4%
3.1%
419.0%
5.6%
29.5%4.5%
314.3%8.8%
14.8%2.7%
49482.3%
5410.9%79.4%
479.5%
77.0%
42085.0%86.2%
489.7%
67.6%
377.5%
84.1%
183.6%
52.9%
255.1%
67.6%
71.2%
---
228.6%
3.3%
457.1%
0.8%
342.9%
4.2%
114.3%2.3%
114.3%2.9%
---
Which of the following would apply, when dealing with payments of training/courses? by Type of Impairment

KNPD/PROG/0313 RESEARCH REPORT Confidential – all rights reserved - Informa Consultants 2014 49
CountsAnaly sis %Break %Respondents Total
Base
SouthernHarbour
Northernharbour
SouthEastern Western Northern Gozo
I paid / am paying for thetraining
The course I am doing /did was free
The course I am doing /did was subsidised
I am ready to pay formore training
I am ready to pay asubsidised price for
more training
I had no training
Don't know
600 14023.3%
19933.2%
7212.0%
9616.0%
7011.7%
233.8%
355.8%
617.1%4.3%
720.0%3.5%
25.7%2.8%
925.7%
9.4%
720.0%10.0%
411.4%17.4%
457.5%
2146.7%15.0%
613.3%3.0%
613.3%
8.3%
715.6%
7.3%
48.9%5.7%
12.2%4.3%
91.5%
---
444.4%2.0%
111.1%
1.4%
222.2%
2.1%
222.2%2.9%
---
142.3%
---
857.1%4.0%
---
535.7%
5.2%
17.1%1.4%
---
213.5%
14.8%0.7%
1152.4%5.5%
---
628.6%
6.3%
314.3%4.3%
---
49482.3%
11322.9%80.7%
17034.4%85.4%
6312.8%87.5%
7415.0%77.1%
5611.3%80.0%
183.6%
78.3%
71.2%
114.3%0.7%
342.9%1.5%
---
228.6%
2.1%
114.3%1.4%
---
Which of the following would apply, when dealing with payments of training/courses? By Area

KNPD/PROG/0313 RESEARCH REPORT Confidential – all rights reserved - Informa Consultants 2014 50
CountsAnaly sis %Break %Respondents Total
Base
Visualimpairment
Hearingimpairment
Physicalimpairment
Intellectualimpairment
Mental healthissues
Specific learningdifficulties Other
Yes
No
Don't know
600 6811.3%
6110.2%
48781.2%
7111.8%
447.3%
345.7%
376.2%
55091.7%
6612.0%97.1%
5910.7%96.7%
45983.5%94.3%
356.4%
49.3%
356.4%
79.5%
183.3%
52.9%
305.5%
81.1%
498.2%
24.1%2.9%
24.1%3.3%
2755.1%5.5%
3673.5%50.7%
918.4%20.5%
1530.6%44.1%
714.3%18.9%
10.2%
---
---
1100.0%
0.2%
---
---
1100.0%
2.9%
---
CountsAnaly sis %Break %Respondents Total
Base
Male Female1 - 10years
11 - 20years
21 - 30years
31 - 40years
41 - 50years
50 - 60years
61 - 70years
71 years& over
Yes
No
Don't know
600 31953.2%
28146.8%
71.2%
203.3%
294.8%
376.2%
488.0%
7913.2%
13522.5%
24540.8%
55091.7%
29253.1%91.5%
25846.9%91.8%
---
101.8%
50.0%
234.2%
79.3%
285.1%
75.7%
417.5%
85.4%
7613.8%96.2%
13424.4%99.3%
23843.3%97.1%
498.2%
2653.1%8.2%
2346.9%8.2%
714.3%
100.0%
1020.4%50.0%
510.2%17.2%
918.4%24.3%
714.3%14.6%
36.1%3.8%
12.0%0.7%
714.3%2.9%
10.2%
1100.0%
0.3%
---
---
---
1100.0%
3.4%
---
---
---
---
---
Do you have a vote? by Gender & Age
Do you have a vote? by Type of Impairment
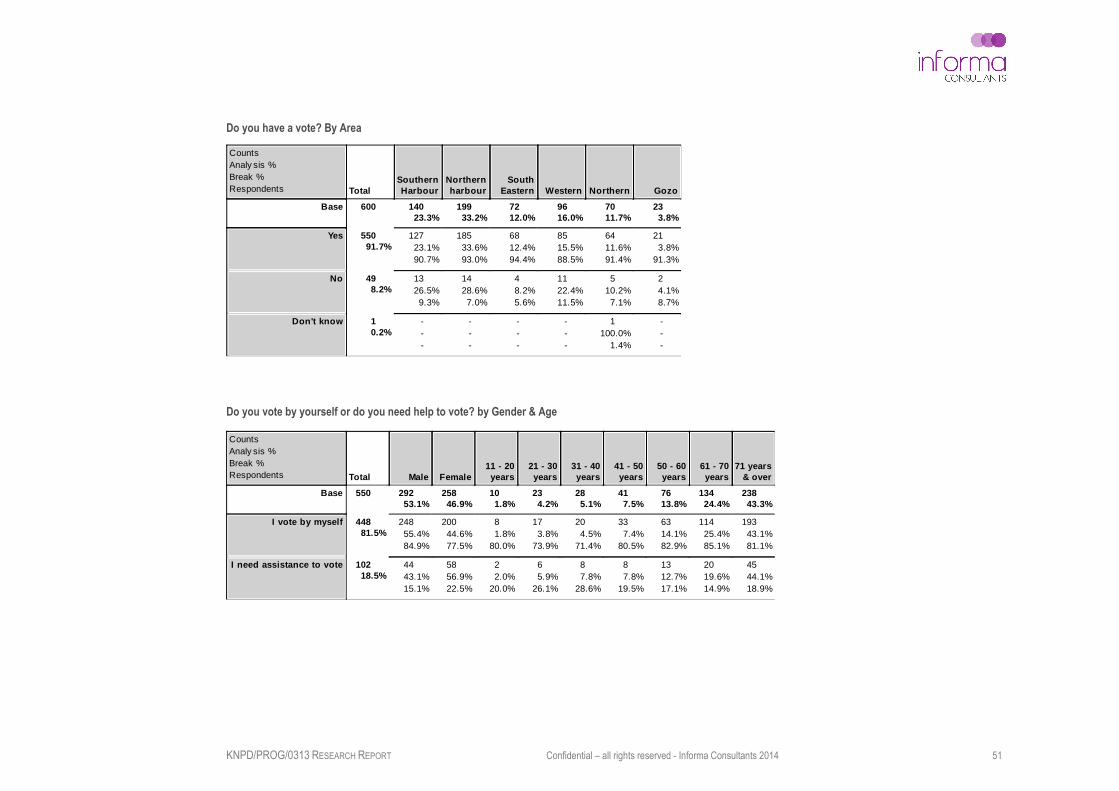
KNPD/PROG/0313 RESEARCH REPORT Confidential – all rights reserved - Informa Consultants 2014 51
CountsAnaly sis %Break %Respondents Total
Base
SouthernHarbour
Northernharbour
SouthEastern Western Northern Gozo
Yes
No
Don't know
600 14023.3%
19933.2%
7212.0%
9616.0%
7011.7%
233.8%
55091.7%
12723.1%90.7%
18533.6%93.0%
6812.4%94.4%
8515.5%88.5%
6411.6%91.4%
213.8%
91.3%
498.2%
1326.5%9.3%
1428.6%7.0%
48.2%5.6%
1122.4%11.5%
510.2%7.1%
24.1%8.7%
10.2%
---
---
---
---
1100.0%
1.4%
---
CountsAnaly sis %Break %Respondents Total
Base
Male Female11 - 20years
21 - 30years
31 - 40years
41 - 50years
50 - 60years
61 - 70years
71 years& over
I vote by myself
I need assistance to vote
550 29253.1%
25846.9%
101.8%
234.2%
285.1%
417.5%
7613.8%
13424.4%
23843.3%
44881.5%
24855.4%84.9%
20044.6%77.5%
81.8%
80.0%
173.8%
73.9%
204.5%
71.4%
337.4%
80.5%
6314.1%82.9%
11425.4%85.1%
19343.1%81.1%
10218.5%
4443.1%15.1%
5856.9%22.5%
22.0%
20.0%
65.9%
26.1%
87.8%
28.6%
87.8%
19.5%
1312.7%17.1%
2019.6%14.9%
4544.1%18.9%
Do you have a vote? By Area
Do you vote by yourself or do you need help to vote? by Gender & Age

KNPD/PROG/0313 RESEARCH REPORT Confidential – all rights reserved - Informa Consultants 2014 52
CountsAnaly sis %Break %Respondents Total
Base
SouthernHarbour
Northernharbour
SouthEastern Western Northern Gozo
I vote by myself
I need assistance to vote
550 12723.1%
18533.6%
6812.4%
8515.5%
6411.6%
213.8%
44881.5%
9320.8%73.2%
15534.6%83.8%
5712.7%83.8%
7115.8%83.5%
5712.7%89.1%
153.3%
71.4%
10218.5%
3433.3%26.8%
3029.4%16.2%
1110.8%16.2%
1413.7%16.5%
76.9%
10.9%
65.9%
28.6%
CountsAnaly sis %Break %Respondents Total
Base
Visualimpairment
Hearingimpairment
Physicalimpairment
Intellectualimpairment
Mental healthissues
Specific learningdifficulties Other
I vote by myself
I need assistance to vote
550 6612.0%
5910.7%
45983.5%
356.4%
356.4%
183.3%
305.5%
44881.5%
429.4%
63.6%
5211.6%88.1%
38485.7%83.7%
143.1%
40.0%
235.1%
65.7%
102.2%
55.6%
214.7%
70.0%
10218.5%
2423.5%36.4%
76.9%
11.9%
7573.5%16.3%
2120.6%60.0%
1211.8%34.3%
87.8%
44.4%
98.8%
30.0%
Do you vote by yourself or do you need help to vote? by Type of Impairment
Do you vote by yourself or do you need help to vote? By Area

KNPD/PROG/0313 RESEARCH REPORT Confidential – all rights reserved - Informa Consultants 2014 53
CountsAnaly sis %Break %Respondents Total
Base
Male Female11 - 20years
21 - 30years
31 - 40years
41 - 50years
50 - 60years
61 - 70years
71 years& over
The system of voting infront of the Assistant
Electoral Commissionersis good for me
I'd rather choose from alist of assistantsapproved by the
Electoral Commission, tohelp me vote
I'd rather have a person Iknow and whom I trust
to help me vote
I prefer having myassistive equipment tohelp me vote by myself
Don't know
102 4443.1%
5856.9%
22.0%
65.9%
87.8%
87.8%
1312.7%
2019.6%
4544.1%
4039.2%
2152.5%47.7%
1947.5%32.8%
---
25.0%
33.3%
37.5%
37.5%
25.0%
25.0%
820.0%61.5%
922.5%45.0%
1640.0%35.6%
43.9%
250.0%
4.5%
250.0%3.4%
---
---
---
---
---
250.0%10.0%
250.0%4.4%
4746.1%
1736.2%38.6%
3063.8%51.7%
24.3%
100.0%
36.4%
50.0%
36.4%
37.5%
510.6%62.5%
510.6%38.5%
817.0%40.0%
2144.7%46.7%
76.9%
342.9%
6.8%
457.1%6.9%
---
114.3%16.7%
228.6%25.0%
114.3%12.5%
---
114.3%
5.0%
228.6%4.4%
43.9%
125.0%
2.3%
375.0%5.2%
---
---
---
---
---
---
4100.0%
8.9%
Can you tell me which of the following statements you agree with most: by Gender & Age

KNPD/PROG/0313 RESEARCH REPORT Confidential – all rights reserved - Informa Consultants 2014 54
CountsAnaly sis %Break %Respondents Total
Base
Visualimpairment
Hearingimpairment
Physicalimpairment
Intellectualimpairment
Mental healthissues
Specific learningdifficulties Other
The system of voting infront of the Assistant
Electoral Commissionersis good for me
I'd rather choose from alist of assistantsapproved by the
Electoral Commission, tohelp me vote
I'd rather have a person Iknow and whom I trust
to help me vote
I prefer having myassistive equipment tohelp me vote by myself
Don't know
102 2423.5%
76.9%
7573.5%
2120.6%
1211.8%
87.8%
98.8%
4039.2%
922.5%37.5%
12.5%
14.3%
3382.5%44.0%
615.0%28.6%
25.0%
16.7%
12.5%
12.5%
25.0%
22.2%
43.9%
---
---
4100.0%
5.3%
---
---
---
---
4746.1%
1225.5%50.0%
48.5%
57.1%
3166.0%41.3%
1327.7%61.9%
919.1%75.0%
612.8%75.0%
714.9%77.8%
76.9%
342.9%12.5%
---
457.1%5.3%
228.6%9.5%
114.3%8.3%
114.3%12.5%
---
43.9%
---
250.0%28.6%
375.0%4.0%
---
---
---
---
Can you tell me which of the following statements you agree with most: by Type of Impairment

KNPD/PROG/0313 RESEARCH REPORT Confidential – all rights reserved - Informa Consultants 2014 55
CountsAnaly sis %Break %Respondents Total
Base
Male Female1 - 10years
11 - 20years
21 - 30years
31 - 40years
41 - 50years
50 - 60years
61 - 70years
71 years& over
None
Interdicted by a courtorder
Incapacitated by a courtorder
600 31953.2%
28146.8%
71.2%
203.3%
294.8%
376.2%
488.0%
7913.2%
13522.5%
24540.8%
59599.2%
31552.9%98.7%
28047.1%99.6%
71.2%
100.0%
203.4%
100.0%
284.7%
96.6%
366.1%
97.3%
457.6%
93.8%
7913.3%
100.0%
13522.7%
100.0%
24541.2%
100.0%
10.2%
1100.0%
0.3%
---
---
---
---
---
1100.0%
2.1%
---
---
---
50.8%
480.0%1.3%
120.0%0.4%
---
---
120.0%3.4%
120.0%2.7%
360.0%
6.3%
---
---
---
CountsAnaly sis %Break %Respondents Total
Base
SouthernHarbour
Northernharbour
SouthEastern Western Northern Gozo
The system of voting infront of the Assistant
Electoral Commissionersis good for me
I'd rather choose from alist of assistantsapproved by the
Electoral Commission, tohelp me vote
I'd rather have a person Iknow and whom I trust
to help me vote
I prefer having myassistive equipment tohelp me vote by myself
Don't know
102 3433.3%
3029.4%
1110.8%
1413.7%
76.9%
65.9%
4039.2%
1025.0%29.4%
1742.5%56.7%
410.0%36.4%
615.0%42.9%
37.5%
42.9%
---
43.9%
250.0%5.9%
125.0%3.3%
125.0%
9.1%
---
---
---
4746.1%
1940.4%55.9%
817.0%26.7%
612.8%54.5%
612.8%42.9%
24.3%
28.6%
612.8%
100.0%
76.9%
228.6%5.9%
228.6%6.7%
---
114.3%
7.1%
228.6%28.6%
---
43.9%
125.0%2.9%
250.0%6.7%
---
125.0%
7.1%
---
---
Can you tell me which of the following statements you agree with most: by Area
Can you tell me whether you are: by Gender & Age

KNPD/PROG/0313 RESEARCH REPORT Confidential – all rights reserved - Informa Consultants 2014 56
CountsAnaly sis %Break %Respondents Total
Base
Visualimpairment
Hearingimpairment
Physicalimpairment
Intellectualimpairment
Mental healthissues
Specific learningdifficulties Other
None
Interdicted by a courtorder
Incapacitated by a courtorder
600 6811.3%
6110.2%
48781.2%
7111.8%
447.3%
345.7%
376.2%
59599.2%
6811.4%
100.0%
6010.1%98.4%
48581.5%99.6%
6811.4%95.8%
447.4%
100.0%
315.2%
91.2%
376.2%
100.0%
10.2%
---
---
1100.0%
0.2%
---
---
---
---
50.8%
---
120.0%1.6%
240.0%0.4%
360.0%4.2%
---
360.0%8.8%
---
CountsAnaly sis %Break %Respondents Total
Base
SouthernHarbour
Northernharbour
SouthEastern Western Northern Gozo
None
Interdicted by a courtorder
Incapacitated by a courtorder
600 14023.3%
19933.2%
7212.0%
9616.0%
7011.7%
233.8%
59599.2%
13923.4%99.3%
19833.3%99.5%
7011.8%97.2%
9616.1%
100.0%
7011.8%
100.0%
223.7%
95.7%
10.2%
1100.0%
0.7%
---
---
---
---
---
50.8%
120.0%0.7%
120.0%0.5%
240.0%
2.8%
---
---
120.0%4.3%
Can you tell me whether you are: by Type of Impairment
Can you tell me whether you are: by Area

KNPD/PROG/0313 RESEARCH REPORT Confidential – all rights reserved - Informa Consultants 2014 57
This publication is supported by the European Union Programme for Employment and Social
Solidarity - PROGRESS (2007-2013). This programme is implemented by the European
Commission. It was established to financially support the implementation of the objectives of
the European Union in the employment, social affairs and equal opportunities area, and
thereby contribute to the achievement of the Europe 2020 Strategy goals in these fields.
The seven-year Programme targets all stakeholders who can help shape the development of
appropriate and effective employment and social legislation and policies, across the EU-27,
EFTA-EEA and EU candidate and pre-candidate countries.
For more information see: http://ec.europa.eu/progress
The sole responsibility for the information contained in this publication lies with KNPD and the
European Commission is not responsible for any use that may be made of the information
contained therein.

KNPD/PROG/0313 RESEARCH REPORT Confidential – all rights reserved - Informa Consultants 2014 58
This publication is supported by the European Union Programme for Employment and Social Solidarity - PROGRESS (2007-2013).
For more information see: http://ec.europa.eu/progress