
Knowledge Work on Shadow Banking – Trust Funds and … · Consultant’s Report Project Number:...
21
Consultant’s Report Project Number: SC 102486 May 2014 The People’s Republic of China: Knowledge Work on Shadow Banking – Trust Funds and Wealth Management Products Prepared by Nicholas Zhu, Partner of Transino.net, Ltd; and Jurgen Conrad, Head, Economics Unit, PRC Resident Mission, ADB For Asian Development Bank This consultant’s report does not necessarily reflect the views of ADB or the Government concerned, and ADB and the Government cannot be held liable for its contents. (For project preparatory technical assistance: All the views expressed herein may not be incorporated into the proposed project’s design.
Transcript of Knowledge Work on Shadow Banking – Trust Funds and … · Consultant’s Report Project Number:...
Consultant’s Report
Project Number: SC 102486 May 2014
The People’s Republic of China:
Knowledge Work on Shadow Banking – Trust Funds and Wealth Management Products
Prepared by Nicholas Zhu, Partner of Transino.net, Ltd; and Jurgen Conrad, Head, Economics Unit, PRC Resident Mission, ADB
For Asian Development Bank
This consultant’s report does not necessarily reflect the views of ADB or the Government concerned, and ADB and the Government cannot be held liable for its contents. (For project preparatory technical assistance: All the views expressed herein may not be incorporated into the proposed project’s design.
2
Table of Contents
EXECUTIVE SUMMARY ............................................................................................................... 4
I. INTRODUCTION .................................................................................................................. 5
II. THE RAPID GROWTH OF THE TRUST SECTOR .............................................................. 6
III. TRUST LOANS AS KEY INVESTMENT INSTRUMENT ..................................................... 8
IV. INDUSTRY DISTRIBUTION OF TRUST ASSETS ............................................................ 11
V. TRUST FUND PROFITABILITY ......................................................................................... 12
VI. BANK WMPS...................................................................................................................... 13
VII. CONCLUSIONS AND POLICY ISSUES ............................................................................ 17
APPENDIX 1: MAJOR FINANCIALS FOR TRUST COMPANIES............................................. 20
APPENDIX 2: MAJOR CBRC REGULATIONS ......................................................................... 21
3
ABBREVIATIONS ADB ‐ Asian Development Bank AFS ‐ available for sale CBRC ‐ China Banking Regulatory Commission F&C ‐ financial and commercial activity FI ‐ financial institution GDP ‐ gross domestic product HTM ‐ held to maturity PBOC ‐ People’s Bank of China PRC ‐ People’s Republic of China WMP ‐ wealth‐management product
CURRENCY EQUIVALENTS (as of 30 March 2014)
Currency unit – yuan (CNY) CNY1.00 = $0.16066 $1.00 = CNY6.22416
4
EXECUTIVE SUMMARY
• Shadow banking in the People’s Republic of China (PRC), can be seen as diversification of a bank dominated financial sector and shift towards more market based intermediation. However, strong growth of shadow banking has raised concerns regarding leverage, maturity mismatches, underwriting standards, credit quality, and banks’ exposure to risks through off-balance sheet activities.
• Quantifying shadow banking in the PRC is complicated by lack of consensus about definitions, activities to include, and data availability and quality issues. This study focuses on the two segments that dominate shadow banking quantitatively and have raised the most concerns: trust funds and bank wealth-management products (WMPs), which together amounted to CNY20.4 trillion or 35.8% of GDP at end-2013 according to industry estimates, up from CNY5.6 trillion in 2010.
• The main drivers for their growth were investors’ search for higher returns in PRC’s regulated interest rate environment and the regulatory permission of bank WMPs to fund trust plans since 2007. Various regulatory initiatives have since effectively limited the bank-trust cooperation. As a result, only 23.2% of bank WMPs were invested in trusts and 21.7% of trust assets were funded by WMPs at end-2013. However, banks also invest own funds in trusts, which is why about half of trust assets might still be financed by or through banks.
• The exposure of the trust industry to land related risks has also declined substantially: At end-2013, only 10.0% of trust assets were still invested in property and 25.2% in infrastructure. However, 70% of bank WMPs remain without explicit guarantee, which provides a case for better investor protection and/or measures to increase risk awareness.
• The government has taken a series of incremental regulatory steps over time to protect the banking system from risk related to WMPs and trust funds, and put their development on a more sustainable path.
Leverage was reduced and risk capital buffers increased by net capital regulation requiring capital provision of banks against investment in trusts, consolidation of most off-balance-sheet WMPs onto banks’ balance sheets for calculating risk-based capital requirements, coverage of the remaining WMPs by trust companies’ capital provision, and dividend policy restriction for inadequately provisioned trust companies.
Liquidity was enhanced by limiting the amount of non-standardized debt instruments, including trust loans, funded by trust plans or WMPs.
Transparency was improved by requiring banks to maintain separate accounts for each WMP with transparent documentation of assets funded by each WMP account, and prohibiting the use of funding pools by bank WMPs and trust plans for investment in non-standardized debt instruments.
• We expect the government to continue strengthening regulations in future to further increase transparency and mitigate risks. At the same time, it will accelerate financial sector liberalization, including interest rate liberalization and asset securitization, to reduce regulatory-arbitrage incentives of investing in WMPs and trust funds. The government will also aim to ensure that economic growth does not decelerate too quickly to limit the stress on exposed borrowers and their creditors to a degree that can be managed on a case-by-case basis through bail-outs and defaults, some of which are allowed to increase investor awareness for risks.
5
0
2
4
6
8
10
12
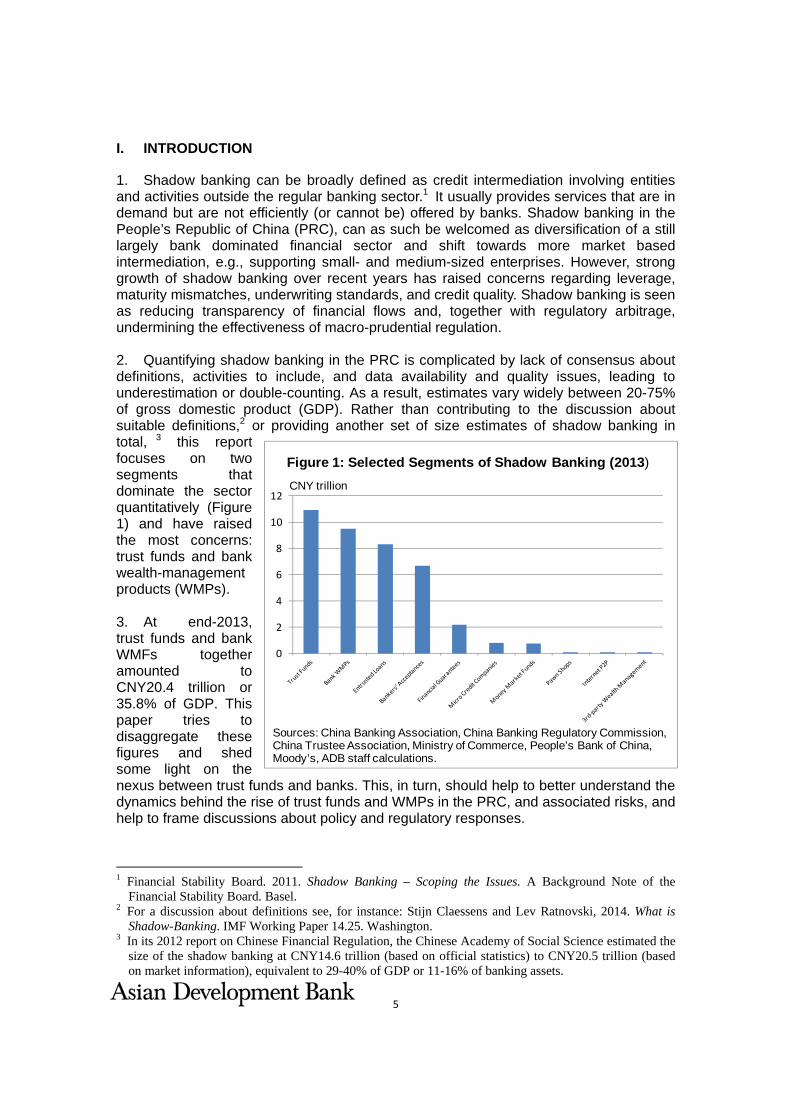
Sources: China Banking Association, China Banking Regulatory Commission, China Trustee Association, Ministry of Commerce, People’s Bank of China, Moody’s, ADB staff calculations.
Figure 1: Selected Segments of Shadow Banking (2013)
CNY trillion
I. INTRODUCTION
1. Shadow banking can be broadly defined as credit intermediation involving entities and activities outside the regular banking sector.1 It usually provides services that are in demand but are not efficiently (or cannot be) offered by banks. Shadow banking in the People’s Republic of China (PRC), can as such be welcomed as diversification of a still largely bank dominated financial sector and shift towards more market based intermediation, e.g., supporting small- and medium-sized enterprises. However, strong growth of shadow banking over recent years has raised concerns regarding leverage, maturity mismatches, underwriting standards, and credit quality. Shadow banking is seen as reducing transparency of financial flows and, together with regulatory arbitrage, undermining the effectiveness of macro-prudential regulation. 2. Quantifying shadow banking in the PRC is complicated by lack of consensus about definitions, activities to include, and data availability and quality issues, leading to underestimation or double-counting. As a result, estimates vary widely between 20-75% of gross domestic product (GDP). Rather than contributing to the discussion about suitable definitions,2 or providing another set of size estimates of shadow banking in total, 3 this report focuses on two segments that dominate the sector quantitatively (Figure 1) and have raised the most concerns: trust funds and bank wealth-management products (WMPs). 3. At end-2013, trust funds and bank WMFs together amounted to CNY20.4 trillion or 35.8% of GDP. This paper tries to disaggregate these figures and shed some light on the nexus between trust funds and banks. This, in turn, should help to better understand the dynamics behind the rise of trust funds and WMPs in the PRC, and associated risks, and help to frame discussions about policy and regulatory responses.
1 Financial Stability Board. 2011. Shadow Banking – Scoping the Issues. A Background Note of the
Financial Stability Board. Basel.
2 For a discussion about definitions see, for instance: Stijn Claessens and Lev Ratnovski, 2014. What is Shadow-Banking. IMF Working Paper 14.25. Washington.
3 In its 2012 report on Chinese Financial Regulation, the Chinese Academy of Social Science estimated the size of the shadow banking at CNY14.6 trillion (based on official statistics) to CNY20.5 trillion (based on market information), equivalent to 29-40% of GDP or 11-16% of banking assets.
6
0.0%
10.0%
20.0%
30.0%
40.0%
50.0%
60.0%
70.0%
80.0%
‐
1.0
2.0
3.0
4.0
5.0
6.0
7.0
8.0
9.0
10.0
11.0
2010
‐03
2010
‐06
2010
‐09
2010
‐12
2011
‐03
2011
‐06
2011
‐09
2011
‐12
2012
‐03
2012
‐06
2012
‐09
2012
‐12
2013
‐03
2013
‐06
2013
‐09
2013
‐12
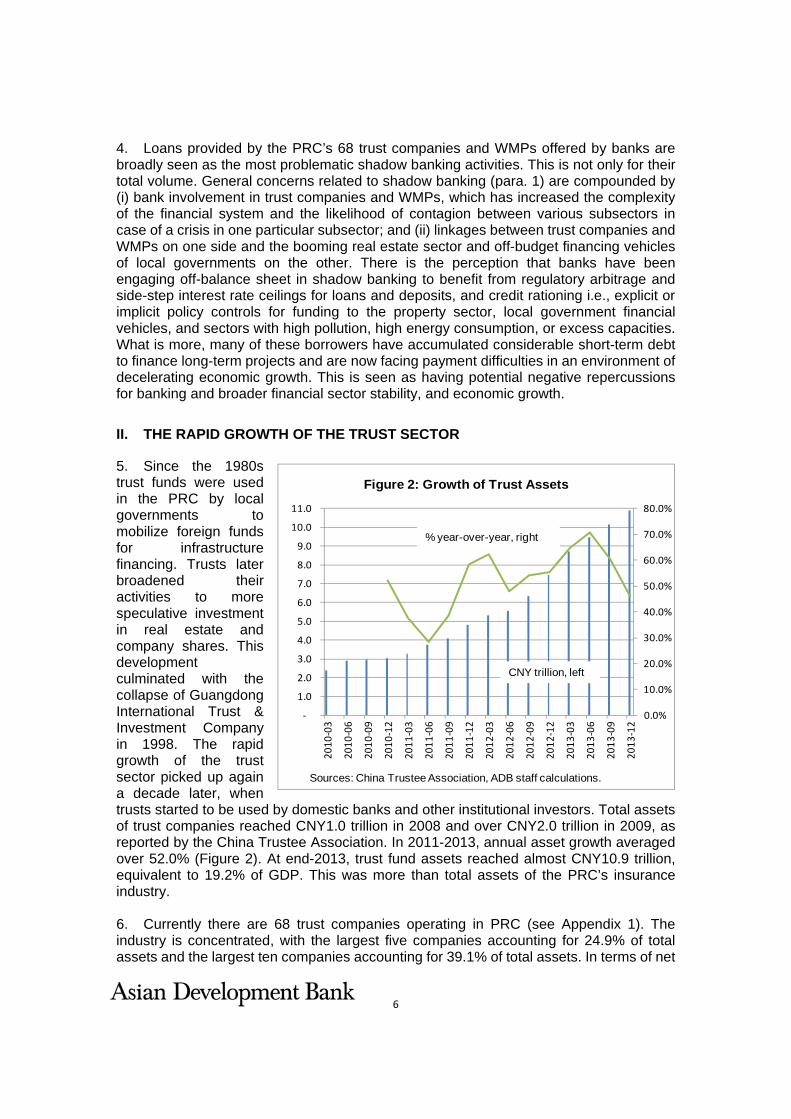
Figure 2: Growth of Trust Assets
CNY trillion, left
Sources: China Trustee Association, ADB staff calculations.
% year-over-year, right
4. Loans provided by the PRC’s 68 trust companies and WMPs offered by banks are broadly seen as the most problematic shadow banking activities. This is not only for their total volume. General concerns related to shadow banking (para. 1) are compounded by (i) bank involvement in trust companies and WMPs, which has increased the complexity of the financial system and the likelihood of contagion between various subsectors in case of a crisis in one particular subsector; and (ii) linkages between trust companies and WMPs on one side and the booming real estate sector and off-budget financing vehicles of local governments on the other. There is the perception that banks have been engaging off-balance sheet in shadow banking to benefit from regulatory arbitrage and side-step interest rate ceilings for loans and deposits, and credit rationing i.e., explicit or implicit policy controls for funding to the property sector, local government financial vehicles, and sectors with high pollution, high energy consumption, or excess capacities. What is more, many of these borrowers have accumulated considerable short-term debt to finance long-term projects and are now facing payment difficulties in an environment of decelerating economic growth. This is seen as having potential negative repercussions for banking and broader financial sector stability, and economic growth.
II. THE RAPID GROWTH OF THE TRUST SECTOR
5. Since the 1980s trust funds were used in the PRC by local governments to mobilize foreign funds for infrastructure financing. Trusts later broadened their activities to more speculative investment in real estate and company shares. This development culminated with the collapse of Guangdong International Trust & Investment Company in 1998. The rapid growth of the trust sector picked up again a decade later, when trusts started to be used by domestic banks and other institutional investors. Total assets of trust companies reached CNY1.0 trillion in 2008 and over CNY2.0 trillion in 2009, as reported by the China Trustee Association. In 2011-2013, annual asset growth averaged over 52.0% (Figure 2). At end-2013, trust fund assets reached almost CNY10.9 trillion, equivalent to 19.2% of GDP. This was more than total assets of the PRC’s insurance industry. 6. Currently there are 68 trust companies operating in PRC (see Appendix 1). The industry is concentrated, with the largest five companies accounting for 24.9% of total assets and the largest ten companies accounting for 39.1% of total assets. In terms of net
7
0%
10%
20%
30%
40%
50%
60%
70%
80%
90%
100%
2010
-03
2010
-06
2010
-09
2010
-12
2011
-03
2011
-06
2011
-09
2011
-12
2012
-03
2012
-06
2012
-09
2012
-12
2013
-03
2013
-06
2013
-09
2013
-12
Properties
Combined
Single‐unit
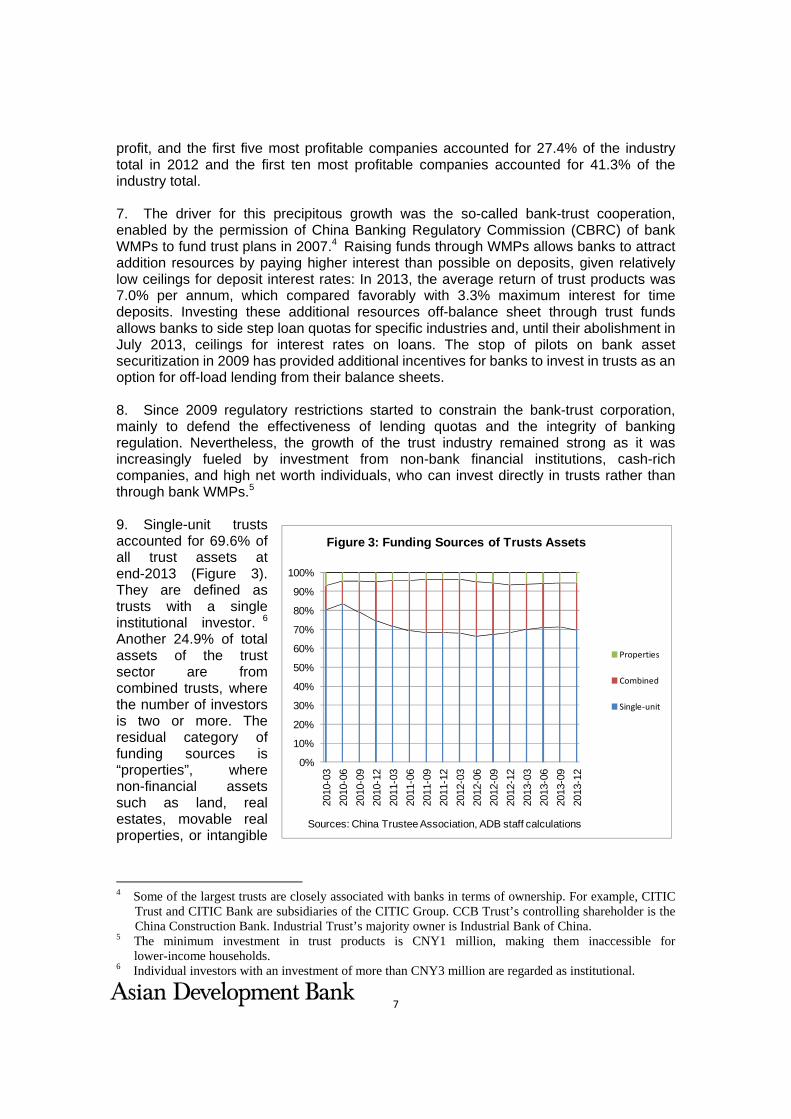
Figure 3: Funding Sources of Trusts Assets
Sources: China Trustee Association, ADB staff calculations
profit, and the first five most profitable companies accounted for 27.4% of the industry total in 2012 and the first ten most profitable companies accounted for 41.3% of the industry total. 7. The driver for this precipitous growth was the so-called bank-trust cooperation, enabled by the permission of China Banking Regulatory Commission (CBRC) of bank WMPs to fund trust plans in 2007.4 Raising funds through WMPs allows banks to attract addition resources by paying higher interest than possible on deposits, given relatively low ceilings for deposit interest rates: In 2013, the average return of trust products was 7.0% per annum, which compared favorably with 3.3% maximum interest for time deposits. Investing these additional resources off-balance sheet through trust funds allows banks to side step loan quotas for specific industries and, until their abolishment in July 2013, ceilings for interest rates on loans. The stop of pilots on bank asset securitization in 2009 has provided additional incentives for banks to invest in trusts as an option for off-load lending from their balance sheets. 8. Since 2009 regulatory restrictions started to constrain the bank-trust corporation, mainly to defend the effectiveness of lending quotas and the integrity of banking regulation. Nevertheless, the growth of the trust industry remained strong as it was increasingly fueled by investment from non-bank financial institutions, cash-rich companies, and high net worth individuals, who can invest directly in trusts rather than through bank WMPs.5 9. Single-unit trusts accounted for 69.6% of all trust assets at end-2013 (Figure 3). They are defined as trusts with a single institutional investor. 6 Another 24.9% of total assets of the trust sector are from combined trusts, where the number of investors is two or more. The residual category of funding sources is “properties”, where non-financial assets such as land, real estates, movable real properties, or intangible
4 Some of the largest trusts are closely associated with banks in terms of ownership. For example, CITIC
Trust and CITIC Bank are subsidiaries of the CITIC Group. CCB Trust’s controlling shareholder is the China Construction Bank. Industrial Trust’s majority owner is Industrial Bank of China.
5 The minimum investment in trust products is CNY1 million, making them inaccessible for lower-income households.
6 Individual investors with an investment of more than CNY3 million are regarded as institutional.
8
0%10%20%30%40%50%60%70%80%90%
100%
2010
‐03
2010
‐06
2010
‐09
2010
‐12
2011
‐03
2011
‐06
2011
‐09
2011
‐12
2012
‐03
2012
‐06
2012
‐09
2012
‐12
2013
‐03
2013
‐06
2013
‐09
2013
‐12
Administrative
Investing
Funding
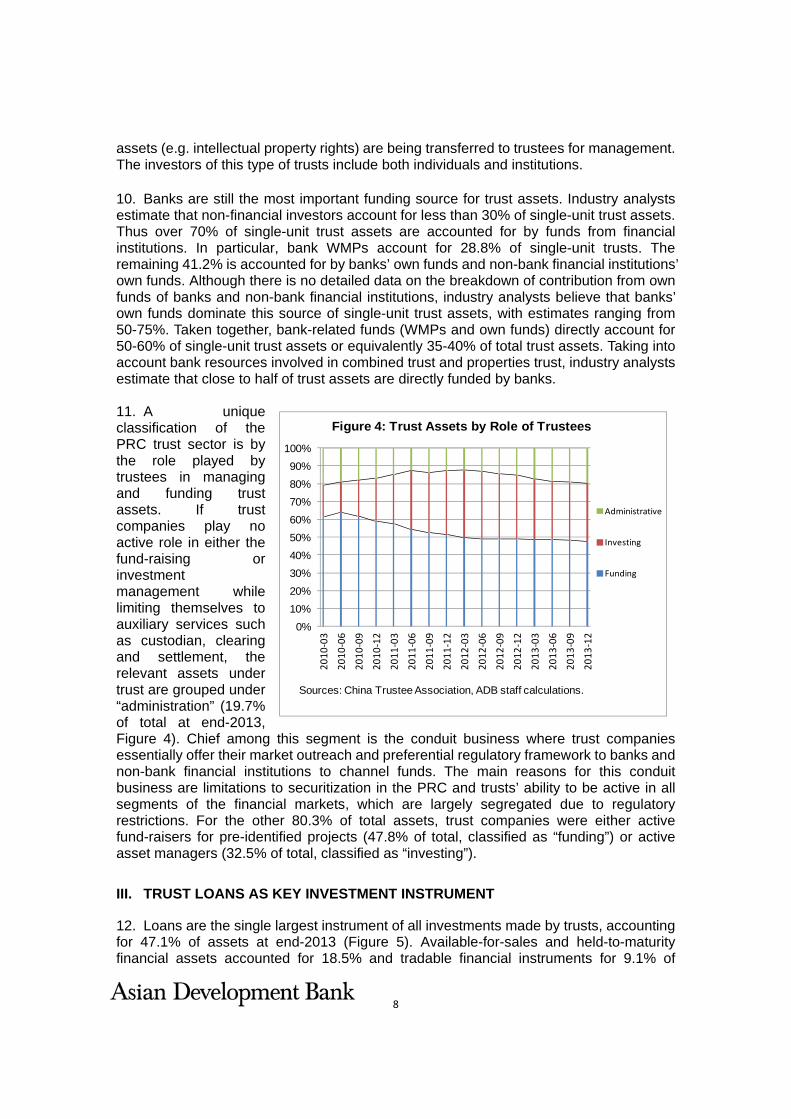
Figure 4: Trust Assets by Role of Trustees
Sources: China Trustee Association, ADB staff calculations.
assets (e.g. intellectual property rights) are being transferred to trustees for management. The investors of this type of trusts include both individuals and institutions. 10. Banks are still the most important funding source for trust assets. Industry analysts estimate that non-financial investors account for less than 30% of single-unit trust assets. Thus over 70% of single-unit trust assets are accounted for by funds from financial institutions. In particular, bank WMPs account for 28.8% of single-unit trusts. The remaining 41.2% is accounted for by banks’ own funds and non-bank financial institutions’ own funds. Although there is no detailed data on the breakdown of contribution from own funds of banks and non-bank financial institutions, industry analysts believe that banks’ own funds dominate this source of single-unit trust assets, with estimates ranging from 50-75%. Taken together, bank-related funds (WMPs and own funds) directly account for 50-60% of single-unit trust assets or equivalently 35-40% of total trust assets. Taking into account bank resources involved in combined trust and properties trust, industry analysts estimate that close to half of trust assets are directly funded by banks. 11. A unique classification of the PRC trust sector is by the role played by trustees in managing and funding trust assets. If trust companies play no active role in either the fund-raising or investment management while limiting themselves to auxiliary services such as custodian, clearing and settlement, the relevant assets under trust are grouped under “administration” (19.7% of total at end-2013, Figure 4). Chief among this segment is the conduit business where trust companies essentially offer their market outreach and preferential regulatory framework to banks and non-bank financial institutions to channel funds. The main reasons for this conduit business are limitations to securitization in the PRC and trusts’ ability to be active in all segments of the financial markets, which are largely segregated due to regulatory restrictions. For the other 80.3% of total assets, trust companies were either active fund-raisers for pre-identified projects (47.8% of total, classified as “funding”) or active asset managers (32.5% of total, classified as “investing”).
III. TRUST LOANS AS KEY INVESTMENT INSTRUMENT
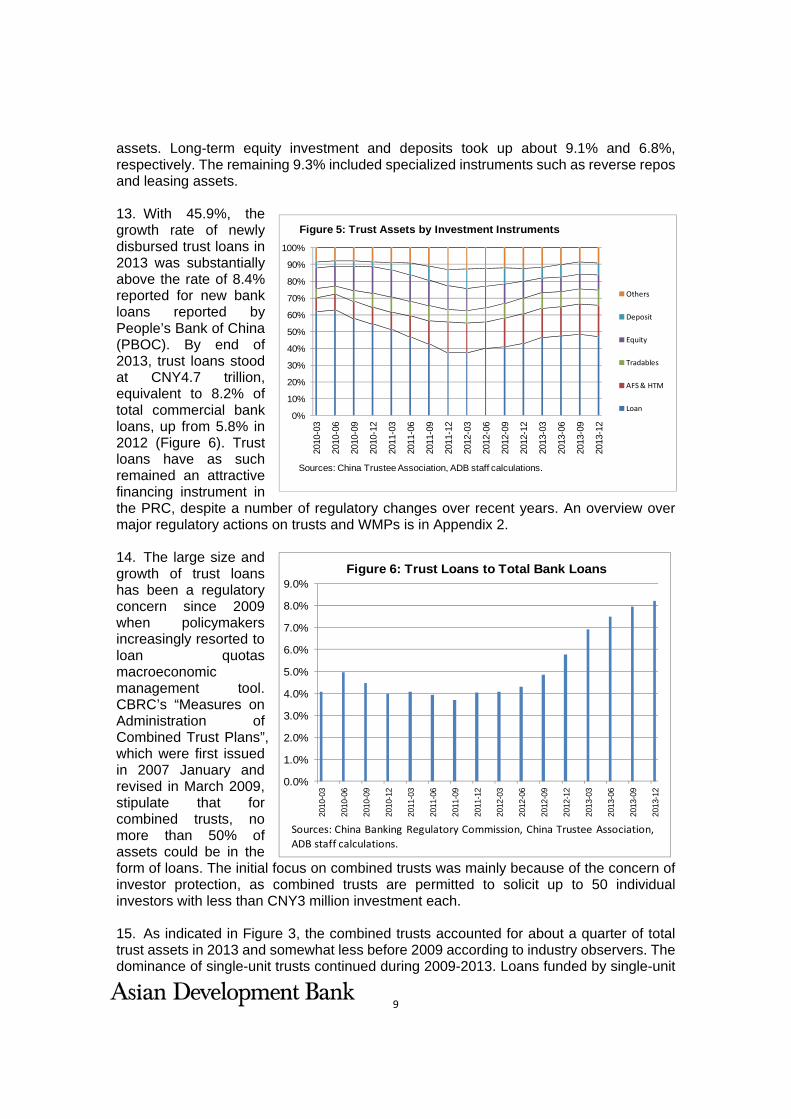
12. Loans are the single largest instrument of all investments made by trusts, accounting for 47.1% of assets at end-2013 (Figure 5). Available-for-sales and held-to-maturity financial assets accounted for 18.5% and tradable financial instruments for 9.1% of
9
0%
10%
20%
30%
40%
50%
60%
70%
80%
90%
100%
2010
-03
2010
-06
2010
-09
2010
-12
2011
-03
2011
-06
2011
-09
2011
-12
2012
-03
2012
-06
2012
-09
2012
-12
2013
-03
2013
-06
2013
-09
2013
-12
Others
Deposit
Equity
Tradables
AFS & HTM
Loan
Figure 5: Trust Assets by Investment Instruments
Sources: China Trustee Association, ADB staff calculations.
0.0%
1.0%
2.0%
3.0%
4.0%
5.0%
6.0%
7.0%
8.0%
9.0%
2010
-03
2010
-06
2010
-09
2010
-12
2011
-03
2011
-06
2011
-09
2011
-12
2012
-03
2012
-06
2012
-09
2012
-12
2013
-03
2013
-06
2013
-09
2013
-12
Figure 6: Trust Loans to Total Bank Loans
Sources: China Banking Regulatory Commission, China Trustee Association, ADB staff calculations.
assets. Long-term equity investment and deposits took up about 9.1% and 6.8%, respectively. The remaining 9.3% included specialized instruments such as reverse repos and leasing assets.
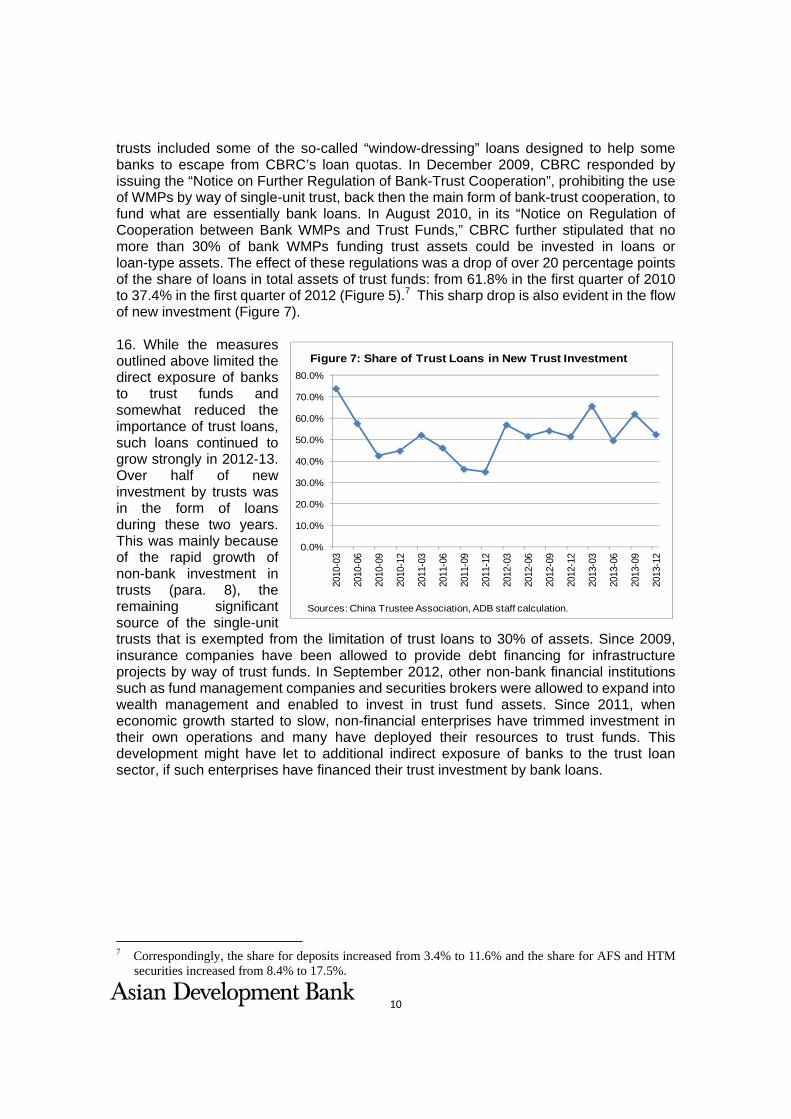
13. With 45.9%, the growth rate of newly disbursed trust loans in 2013 was substantially above the rate of 8.4% reported for new bank loans reported by People’s Bank of China (PBOC). By end of 2013, trust loans stood at CNY4.7 trillion, equivalent to 8.2% of total commercial bank loans, up from 5.8% in 2012 (Figure 6). Trust loans have as such remained an attractive financing instrument in the PRC, despite a number of regulatory changes over recent years. An overview over major regulatory actions on trusts and WMPs is in Appendix 2. 14. The large size and growth of trust loans has been a regulatory concern since 2009 when policymakers increasingly resorted to loan quotas macroeconomic management tool. CBRC’s “Measures on Administration of Combined Trust Plans”, which were first issued in 2007 January and revised in March 2009, stipulate that for combined trusts, no more than 50% of assets could be in the form of loans. The initial focus on combined trusts was mainly because of the concern of investor protection, as combined trusts are permitted to solicit up to 50 individual investors with less than CNY3 million investment each. 15. As indicated in Figure 3, the combined trusts accounted for about a quarter of total trust assets in 2013 and somewhat less before 2009 according to industry observers. The dominance of single-unit trusts continued during 2009-2013. Loans funded by single-unit
10
0.0%
10.0%
20.0%
30.0%
40.0%
50.0%
60.0%
70.0%
80.0%
2010
-03
2010
-06
2010
-09
2010
-12
2011
-03
2011
-06
2011
-09
2011
-12
2012
-03
2012
-06
2012
-09
2012
-12
2013
-03
2013
-06
2013
-09
2013
-12
Figure 7: Share of Trust Loans in New Trust Investment
Sources: China Trustee Association, ADB staff calculation.
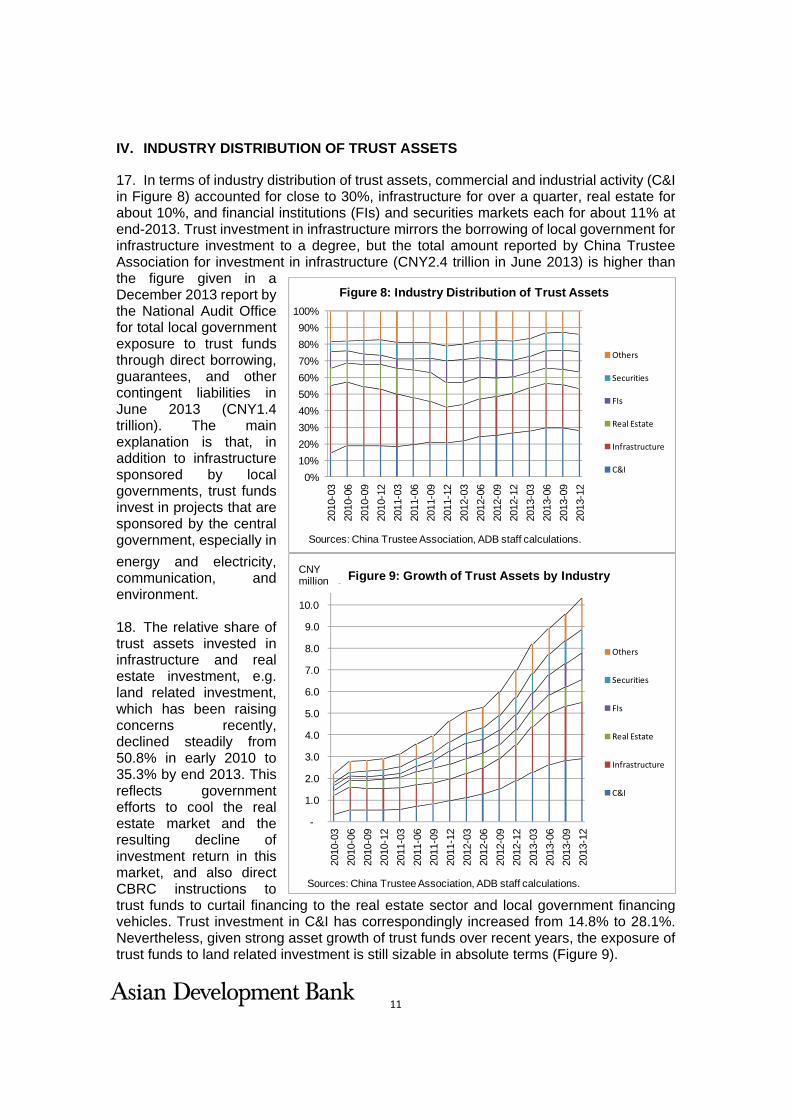
trusts included some of the so-called “window-dressing” loans designed to help some banks to escape from CBRC’s loan quotas. In December 2009, CBRC responded by issuing the “Notice on Further Regulation of Bank-Trust Cooperation”, prohibiting the use of WMPs by way of single-unit trust, back then the main form of bank-trust cooperation, to fund what are essentially bank loans. In August 2010, in its “Notice on Regulation of Cooperation between Bank WMPs and Trust Funds,” CBRC further stipulated that no more than 30% of bank WMPs funding trust assets could be invested in loans or loan-type assets. The effect of these regulations was a drop of over 20 percentage points of the share of loans in total assets of trust funds: from 61.8% in the first quarter of 2010 to 37.4% in the first quarter of 2012 (Figure 5).7 This sharp drop is also evident in the flow of new investment (Figure 7). 16. While the measures outlined above limited the direct exposure of banks to trust funds and somewhat reduced the importance of trust loans, such loans continued to grow strongly in 2012-13. Over half of new investment by trusts was in the form of loans during these two years. This was mainly because of the rapid growth of non-bank investment in trusts (para. 8), the remaining significant source of the single-unit trusts that is exempted from the limitation of trust loans to 30% of assets. Since 2009, insurance companies have been allowed to provide debt financing for infrastructure projects by way of trust funds. In September 2012, other non-bank financial institutions such as fund management companies and securities brokers were allowed to expand into wealth management and enabled to invest in trust fund assets. Since 2011, when economic growth started to slow, non-financial enterprises have trimmed investment in their own operations and many have deployed their resources to trust funds. This development might have let to additional indirect exposure of banks to the trust loan sector, if such enterprises have financed their trust investment by bank loans.
7 Correspondingly, the share for deposits increased from 3.4% to 11.6% and the share for AFS and HTM
securities increased from 8.4% to 17.5%.
11
0%10%20%30%40%50%60%70%80%90%
100%
2010
-03
2010
-06
2010
-09
2010
-12
2011
-03
2011
-06
2011
-09
2011
-12
2012
-03
2012
-06
2012
-09
2012
-12
2013
-03
2013
-06
2013
-09
2013
-12
Others
Securities
FIs
Real Estate
Infrastructure
C&I
Figure 8: Industry Distribution of Trust Assets
Sources: China Trustee Association, ADB staff calculations.
-
1.0
2.0
3.0
4.0
5.0
6.0
7.0
8.0
9.0
10.0
11.0
2010
-03
2010
-06
2010
-09
2010
-12
2011
-03
2011
-06
2011
-09
2011
-12
2012
-03
2012
-06
2012
-09
2012
-12
2013
-03
2013
-06
2013
-09
2013
-12
Others
Securities
FIs
Real Estate
Infrastructure
C&I
Figure 9: Growth of Trust Assets by Industry
Sources: China Trustee Association, ADB staff calculations.
CNYmillion
IV. INDUSTRY DISTRIBUTION OF TRUST ASSETS
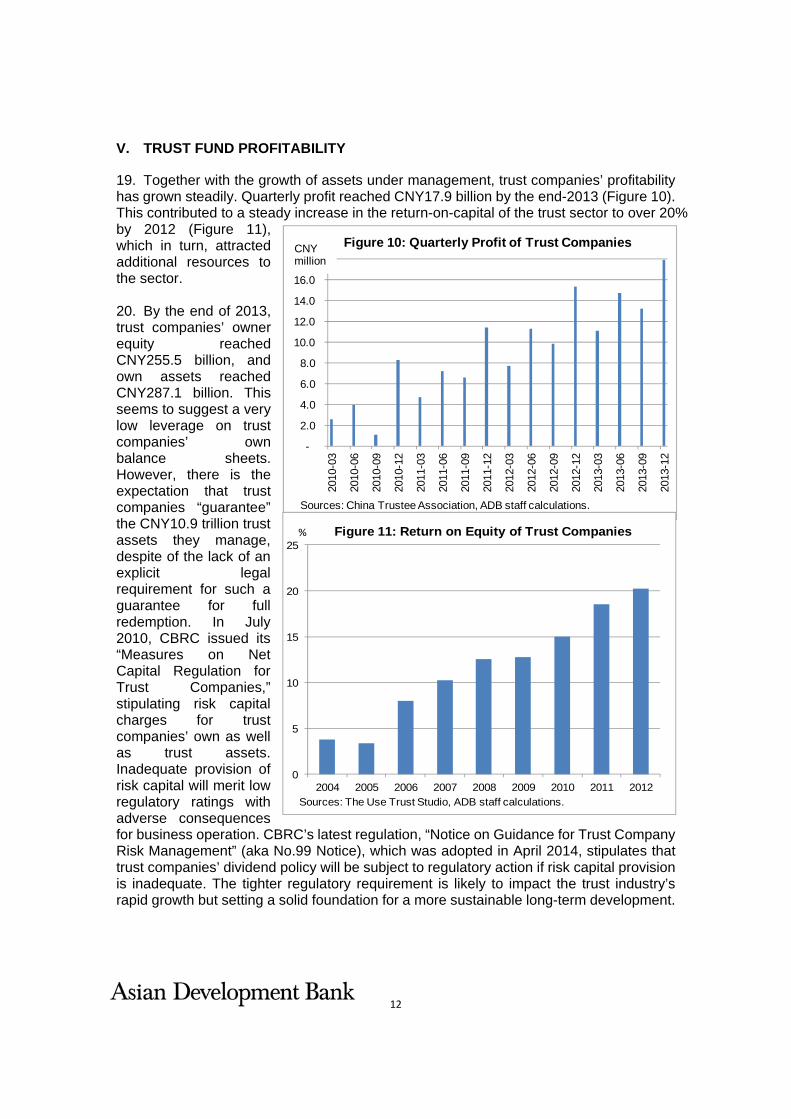
17. In terms of industry distribution of trust assets, commercial and industrial activity (C&I in Figure 8) accounted for close to 30%, infrastructure for over a quarter, real estate for about 10%, and financial institutions (FIs) and securities markets each for about 11% at end-2013. Trust investment in infrastructure mirrors the borrowing of local government for infrastructure investment to a degree, but the total amount reported by China Trustee Association for investment in infrastructure (CNY2.4 trillion in June 2013) is higher than the figure given in a December 2013 report by the National Audit Office for total local government exposure to trust funds through direct borrowing, guarantees, and other contingent liabilities in June 2013 (CNY1.4 trillion). The main explanation is that, in addition to infrastructure sponsored by local governments, trust funds invest in projects that are sponsored by the central government, especially in energy and electricity, communication, and environment. 18. The relative share of trust assets invested in infrastructure and real estate investment, e.g. land related investment, which has been raising concerns recently, declined steadily from 50.8% in early 2010 to 35.3% by end 2013. This reflects government efforts to cool the real estate market and the resulting decline of investment return in this market, and also direct CBRC instructions to trust funds to curtail financing to the real estate sector and local government financing vehicles. Trust investment in C&I has correspondingly increased from 14.8% to 28.1%. Nevertheless, given strong asset growth of trust funds over recent years, the exposure of trust funds to land related investment is still sizable in absolute terms (Figure 9).
12
-
2.0
4.0
6.0
8.0
10.0
12.0
14.0
16.0
18.0
2010
-03
2010
-06
2010
-09
2010
-12
2011
-03
2011
-06
2011
-09
2011
-12
2012
-03
2012
-06
2012
-09
2012
-12
2013
-03
2013
-06
2013
-09
2013
-12
Sources: China Trustee Association, ADB staff calculations.
Figure 10: Quarterly Profit of Trust CompaniesCNYmillion
0
5
10
15
20
25
2004 2005 2006 2007 2008 2009 2010 2011 2012
Figure 11: Return on Equity of Trust Companies %
Sources: The Use Trust Studio, ADB staff calculations.
V. TRUST FUND PROFITABILITY
19. Together with the growth of assets under management, trust companies’ profitability has grown steadily. Quarterly profit reached CNY17.9 billion by the end-2013 (Figure 10). This contributed to a steady increase in the return-on-capital of the trust sector to over 20% by 2012 (Figure 11), which in turn, attracted additional resources to the sector. 20. By the end of 2013, trust companies’ owner equity reached CNY255.5 billion, and own assets reached CNY287.1 billion. This seems to suggest a very low leverage on trust companies’ own balance sheets. However, there is the expectation that trust companies “guarantee” the CNY10.9 trillion trust assets they manage, despite of the lack of an explicit legal requirement for such a guarantee for full redemption. In July 2010, CBRC issued its “Measures on Net Capital Regulation for Trust Companies,” stipulating risk capital charges for trust companies’ own as well as trust assets. Inadequate provision of risk capital will merit low regulatory ratings with adverse consequences for business operation. CBRC’s latest regulation, “Notice on Guidance for Trust Company Risk Management” (aka No.99 Notice), which was adopted in April 2014, stipulates that trust companies’ dividend policy will be subject to regulatory action if risk capital provision is inadequate. The tighter regulatory requirement is likely to impact the trust industry’s rapid growth but setting a solid foundation for a more sustainable long-term development.
13
0%
10%
20%
30%
40%
50%
60%
70%
80%
90%
100%
2010
-03
2010
-06
2010
-09
2010
-12
2011
-03
2011
-06
2011
-09
2011
-12
2012
-03
2012
-06
2012
-09
2012
-12
2013
-03
2013
-06
2013
-09
2013
-12
Interest
Investment
Fee
Figure 12: Sources of Income for Trust Companies
Sources: China Trustee Association, ADB staff calculations.
0.0%
10.0%
20.0%
30.0%
40.0%
50.0%
60.0%
70.0%
-
0.5
1.0
1.5
2.0
2.5
2010
-09
2010
-12
2011
-03
2011
-06
2011
-09
2011
-12
2012
-03
2012
-06
2012
-09
2012
-12
2013
-03
2013
-06
2013
-09
2013
-12
Figure 13: Bank WMPs Funding Trust Assets
%, right
CNY trillion, left
Sources: China Trustee Association, ADB staff calculations.
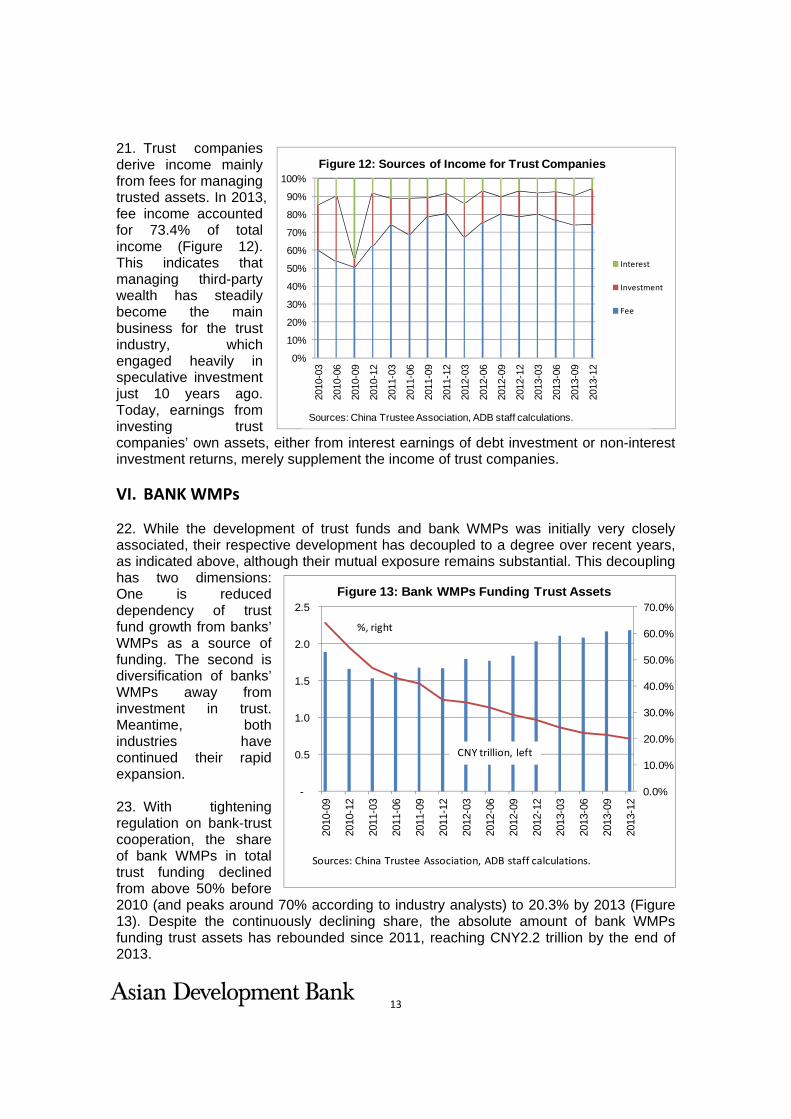
21. Trust companies derive income mainly from fees for managing trusted assets. In 2013, fee income accounted for 73.4% of total income (Figure 12). This indicates that managing third-party wealth has steadily become the main business for the trust industry, which engaged heavily in speculative investment just 10 years ago. Today, earnings from investing trust companies’ own assets, either from interest earnings of debt investment or non-interest investment returns, merely supplement the income of trust companies.
VI. BANK WMPs
22. While the development of trust funds and bank WMPs was initially very closely associated, their respective development has decoupled to a degree over recent years, as indicated above, although their mutual exposure remains substantial. This decoupling has two dimensions: One is reduced dependency of trust fund growth from banks’ WMPs as a source of funding. The second is diversification of banks’ WMPs away from investment in trust. Meantime, both industries have continued their rapid expansion. 23. With tightening regulation on bank-trust cooperation, the share of bank WMPs in total trust funding declined from above 50% before 2010 (and peaks around 70% according to industry analysts) to 20.3% by 2013 (Figure 13). Despite the continuously declining share, the absolute amount of bank WMPs funding trust assets has rebounded since 2011, reaching CNY2.2 trillion by the end of 2013.
14
0%
10%
20%
30%
40%
50%
60%
70%
80%
90%
100%
01/2
013
02/2
013
03/2
013
04/2
013
05/2
013
06/2
013
07/2
013
08/2
013
09/2
013
10/2
013
11/2
013
12/2
013
Non‐RMB
RMB
Figure 14: WMPs' Currency Denomination
Sources: iFinD, ADB staff calculations.
0.0
1.0
2.0
3.0
4.0
5.0
6.0
01/2
009
03/2
009
05/2
009
07/2
009
09/2
009
11/2
009
01/2
010
03/2
010
05/2
010
07/2
010
09/2
010
11/2
010
01/2
011
03/2
011
05/2
011
07/2
011
09/2
011
11/2
011
01/2
012
03/2
012
05/2
012
07/2
012
09/2
012
11/2
012
01/2
013
03/2
013
05/2
013
07/2
013
09/2
013
11/2
013
01/2
014
03/2
014
Figure 15: Returns for WMPs
Fixed‐income Product Floating‐income Product Weighted Average
Sources: Chinese Academy of Social Sciences, ADB staff calculation.
%
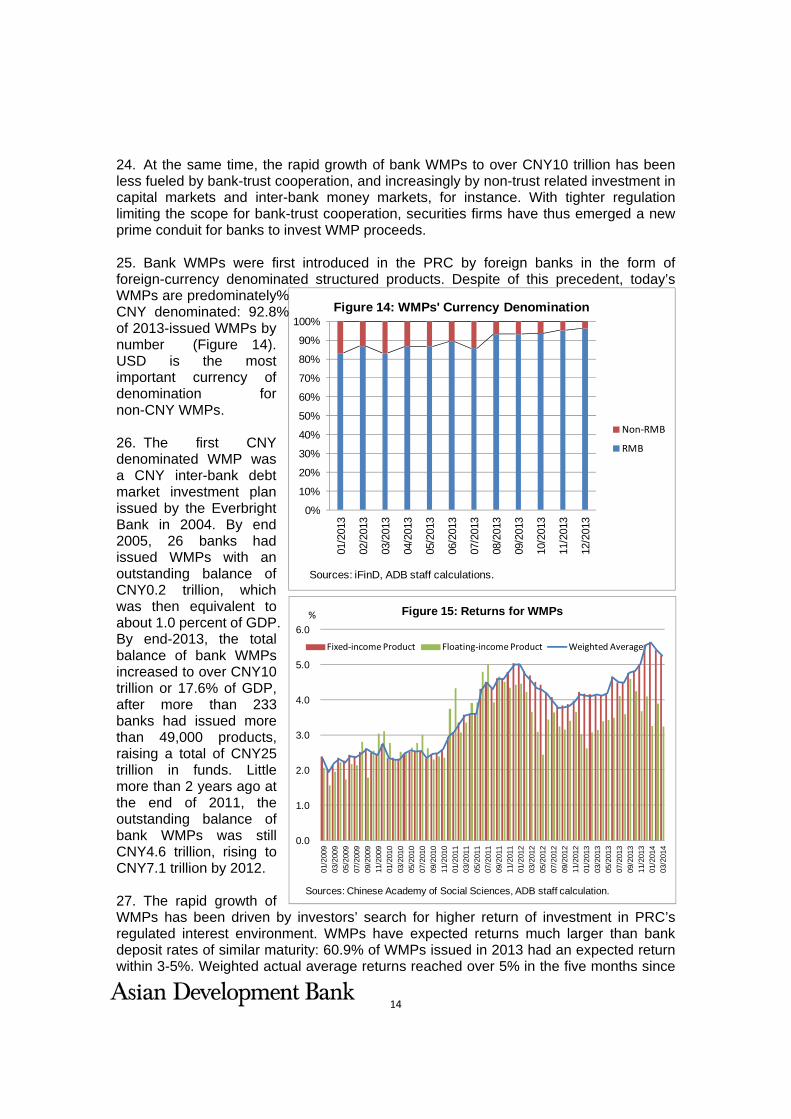
24. At the same time, the rapid growth of bank WMPs to over CNY10 trillion has been less fueled by bank-trust cooperation, and increasingly by non-trust related investment in capital markets and inter-bank money markets, for instance. With tighter regulation limiting the scope for bank-trust cooperation, securities firms have thus emerged a new prime conduit for banks to invest WMP proceeds. 25. Bank WMPs were first introduced in the PRC by foreign banks in the form of foreign-currency denominated structured products. Despite of this precedent, today’s WMPs are predominately% CNY denominated: 92.8% of 2013-issued WMPs by number (Figure 14). USD is the most important currency of denomination for non-CNY WMPs. 26. The first CNY denominated WMP was a CNY inter-bank debt market investment plan issued by the Everbright Bank in 2004. By end 2005, 26 banks had issued WMPs with an outstanding balance of CNY0.2 trillion, which was then equivalent to about 1.0 percent of GDP. By end-2013, the total balance of bank WMPs increased to over CNY10 trillion or 17.6% of GDP, after more than 233 banks had issued more than 49,000 products, raising a total of CNY25 trillion in funds. Little more than 2 years ago at the end of 2011, the outstanding balance of bank WMPs was still CNY4.6 trillion, rising to CNY7.1 trillion by 2012. 27. The rapid growth of WMPs has been driven by investors’ search for higher return of investment in PRC’s regulated interest environment. WMPs have expected returns much larger than bank deposit rates of similar maturity: 60.9% of WMPs issued in 2013 had an expected return within 3-5%. Weighted actual average returns reached over 5% in the five months since
15
0%10%20%30%40%50%60%70%80%90%
100%
01/2
013
02/2
013
03/2
013
04/2
013
05/2
013
06/2
013
07/2
013
08/2
013
09/2
013
10/2
013
11/2
013
12/2
013
Principal‐guaranteed
Return‐guranteed
Floating
Figure 16: Shares of Floating and Guaranteed WMPs
Sources: iFinD, ADB staff calculations.
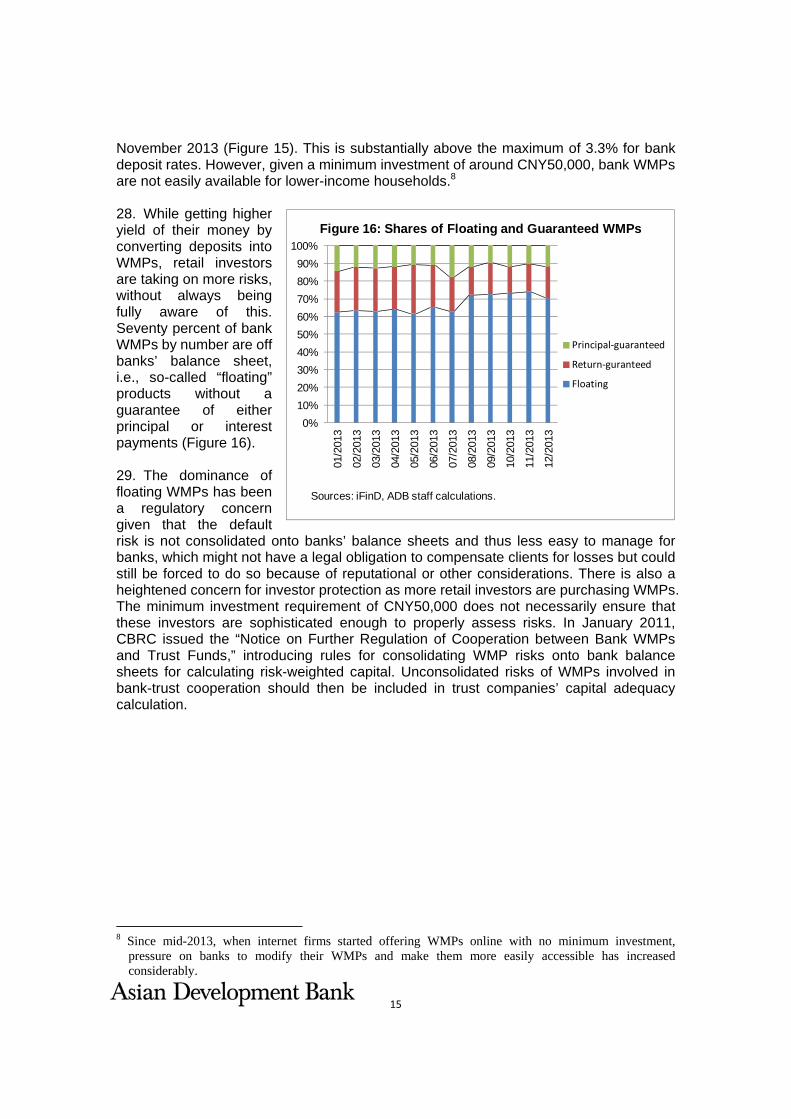
November 2013 (Figure 15). This is substantially above the maximum of 3.3% for bank deposit rates. However, given a minimum investment of around CNY50,000, bank WMPs are not easily available for lower-income households.8 28. While getting higher yield of their money by converting deposits into WMPs, retail investors are taking on more risks, without always being fully aware of this. Seventy percent of bank WMPs by number are off banks’ balance sheet, i.e., so-called “floating” products without a guarantee of either principal or interest payments (Figure 16). 29. The dominance of floating WMPs has been a regulatory concern given that the default risk is not consolidated onto banks’ balance sheets and thus less easy to manage for banks, which might not have a legal obligation to compensate clients for losses but could still be forced to do so because of reputational or other considerations. There is also a heightened concern for investor protection as more retail investors are purchasing WMPs. The minimum investment requirement of CNY50,000 does not necessarily ensure that these investors are sophisticated enough to properly assess risks. In January 2011, CBRC issued the “Notice on Further Regulation of Cooperation between Bank WMPs and Trust Funds,” introducing rules for consolidating WMP risks onto bank balance sheets for calculating risk-weighted capital. Unconsolidated risks of WMPs involved in bank-trust cooperation should then be included in trust companies’ capital adequacy calculation.
8 Since mid-2013, when internet firms started offering WMPs online with no minimum investment,
pressure on banks to modify their WMPs and make them more easily accessible has increased considerably.
16
0.7%
15.8%
37.3%
38.6%
4.5%3.2%
Figure 17: WMPs Maturity Distribution (2013 issurance, %)
1‐3mth
3‐6mth
6‐12mth
12‐24mth
Over 24mth
Unknown
Sources: iFinD, ADB staff calculations.
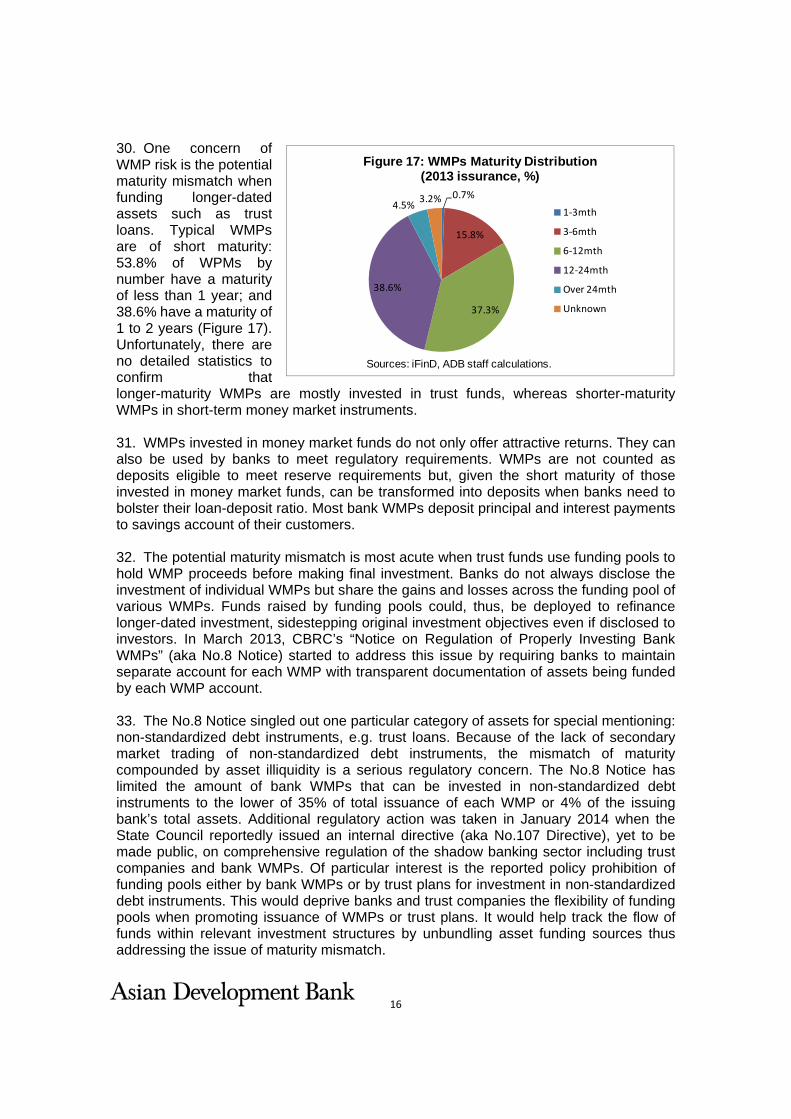
30. One concern of WMP risk is the potential maturity mismatch when funding longer-dated assets such as trust loans. Typical WMPs are of short maturity: 53.8% of WPMs by number have a maturity of less than 1 year; and 38.6% have a maturity of 1 to 2 years (Figure 17). Unfortunately, there are no detailed statistics to confirm that longer-maturity WMPs are mostly invested in trust funds, whereas shorter-maturity WMPs in short-term money market instruments. 31. WMPs invested in money market funds do not only offer attractive returns. They can also be used by banks to meet regulatory requirements. WMPs are not counted as deposits eligible to meet reserve requirements but, given the short maturity of those invested in money market funds, can be transformed into deposits when banks need to bolster their loan-deposit ratio. Most bank WMPs deposit principal and interest payments to savings account of their customers. 32. The potential maturity mismatch is most acute when trust funds use funding pools to hold WMP proceeds before making final investment. Banks do not always disclose the investment of individual WMPs but share the gains and losses across the funding pool of various WMPs. Funds raised by funding pools could, thus, be deployed to refinance longer-dated investment, sidestepping original investment objectives even if disclosed to investors. In March 2013, CBRC’s “Notice on Regulation of Properly Investing Bank WMPs” (aka No.8 Notice) started to address this issue by requiring banks to maintain separate account for each WMP with transparent documentation of assets being funded by each WMP account. 33. The No.8 Notice singled out one particular category of assets for special mentioning: non-standardized debt instruments, e.g. trust loans. Because of the lack of secondary market trading of non-standardized debt instruments, the mismatch of maturity compounded by asset illiquidity is a serious regulatory concern. The No.8 Notice has limited the amount of bank WMPs that can be invested in non-standardized debt instruments to the lower of 35% of total issuance of each WMP or 4% of the issuing bank’s total assets. Additional regulatory action was taken in January 2014 when the State Council reportedly issued an internal directive (aka No.107 Directive), yet to be made public, on comprehensive regulation of the shadow banking sector including trust companies and bank WMPs. Of particular interest is the reported policy prohibition of funding pools either by bank WMPs or by trust plans for investment in non-standardized debt instruments. This would deprive banks and trust companies the flexibility of funding pools when promoting issuance of WMPs or trust plans. It would help track the flow of funds within relevant investment structures by unbundling asset funding sources thus addressing the issue of maturity mismatch.
17
0
1
2
3
4
5
6
2010 2011 2012 2013 2014
Figure 18: Amount of Maturing Trust
Sources: Haitong Securities, ADB staff calculations.
CNY trillion
34. A prerequisite for the success of these and additional regulatory initiatives is improved investment management skills by banks and trust companies, including the ability to capture and report relevant information. The lack of information is most acute in the area of bank WMPs. Currently, most aggregate statistics on bank WMPs are computed without taking into account the size of individual WMP, e.g., the outstanding amount in CNY. Lack of more detailed information on a WMP’s investment flows has led to double-counting. For example, if a WMP invests in more than two sectors, e.g., “infrastructure” and “securities”, it will be counted once as invested in “infrastructure” and again as invested in “securities”, without reference to the CNY amount that is actually invested in either sector. A stronger reporting system with standardized definitions and data collection processes is needed to provide a sound basis for decision-making by both market participants and policymakers.
VII. Conclusions and Policy Issues
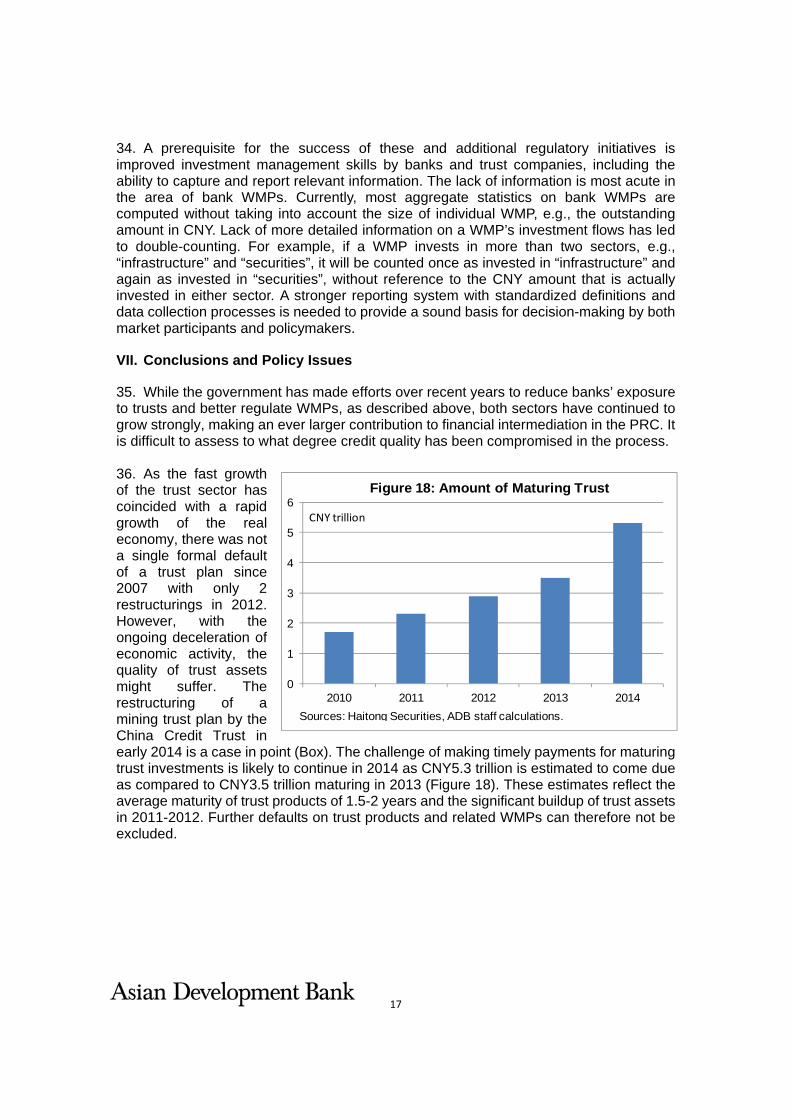
35. While the government has made efforts over recent years to reduce banks’ exposure to trusts and better regulate WMPs, as described above, both sectors have continued to grow strongly, making an ever larger contribution to financial intermediation in the PRC. It is difficult to assess to what degree credit quality has been compromised in the process. 36. As the fast growth of the trust sector has coincided with a rapid growth of the real economy, there was not a single formal default of a trust plan since 2007 with only 2 restructurings in 2012. However, with the ongoing deceleration of economic activity, the quality of trust assets might suffer. The restructuring of a mining trust plan by the China Credit Trust in early 2014 is a case in point (Box). The challenge of making timely payments for maturing trust investments is likely to continue in 2014 as CNY5.3 trillion is estimated to come due as compared to CNY3.5 trillion maturing in 2013 (Figure 18). These estimates reflect the average maturity of trust products of 1.5-2 years and the significant buildup of trust assets in 2011-2012. Further defaults on trust products and related WMPs can therefore not be excluded.
18
37. The government appreciates that defaults are needed for improving the allocation of financial resources by increasing the risk awareness of investors and constraining moral hazard. Investors and intermediaries have to face potential losses commensurate with the risk of their investment. The government is thus likely to allow more defaults. However, the government is clearly not interested in a broader wave of financial failure that could destabilize the financial system and, by extension, the real economy. In March 2014, Premier Li Keqiang warned investors that defaults on bonds and other financial instruments are unavoidable but also stressed that the government would ensure that they do not pose a threat to the overall financial system. 38. One important element in a broader strategy to achieve this objective is, in our opinion, to ensure that economic growth does not decelerate too quickly and to announce growth targets to stabilize growth expectations. The target of around 7.5% GDP growth approved by the National People’s Congress in March 2014 is frequently justified by labor market consideration, which is clearly one crucial aspect . However, there might also be a GDP growth “bottom line” for limiting the stress on exposed borrowers and their creditors to a degree that can be managed by the government on a case-by-case basis through selected bail-outs and defaults. 39. The second element of the strategy is accelerated financial sector liberalization. The growth of trust funds, WMPs and other segments of shadow banking can still be partly explained by remaining policy constraints for the regulated banking sector in combination with underdeveloped capital markets. Continued banking sector liberalization and capital market reforms should thus help to decelerate the growth of trusts funds and WMPs in future. Trusts are structured investment vehicles whose higher returns have attracted a growing investor base since 2009 given the environment of low or even negative real interest rates in the regular banking sector. The chase for higher returns through investment in trusts and WMPs will thus likely be affected by the pace of liberalization of interest rates in the banking sector: the faster the pace of liberalization of interest rates, the slower but healthier the development of the trust sector. While bank lending rates
Box: The Restructuring of a Mining Trust Sold through the private banking department of the Industrial and Commercial Bank ofChina, a CNY3 billion mining trust plan was set up by the China Credit Trust in 2011. Thetrust invested in a private coal mining company operating in the Shanxi province: 49%equity investment with a buyback provision effective 3 months before the trust plan’smaturity in January 2014 and collateralized by 51% shareholding of the mining company.This trust plan can be seen as a pseudo-debt instrument with an annual interest rate of17%. Unfortunately, demand for coal fell short of expectations due to slowing economicgrowth and coal prices plummeted over the investment period. By May 2012, the miningcompany was effectively bankrupt with substantial payment arrears. By January 2014,when the trust product matured, a restructuring was unavoidable. A third-party investorwas brought in at the last minute to buy back the trust fund’s 49% holding of the miningcompany’s equity, ensuing redemption of trust investors who then lost only the lastannual interest payment. It was reported that the third-party investor could be one of thefour financial asset manager related to the bank and involved in the issuance of the trustplan.

19
were fully liberalized in July 2013, deposit rates remain regulated. In March 2014, the Governor of PBOC, Zhou Xiaochuan, stated that he expects deposit rate liberalization to be completed within two years. 40. Similarly, since late 2009 CBRC has prohibited banks from securitizing their own credit exposures, for instance by issuing WMPs. Thus many bank WMPs have to go through the trust companies as conduits to fund investments originally identified by banks and not the trust companies. More liberalization in the securitization market will, therefore, likely reduce the attraction of the conduit business through trusts. International experience in this area, especially the development of the North American market for credit asset securitization testifies the importance of securitization being a necessary part of a complete capital and credit market. This is in spite of the immense challenge of the 2008 market upheaval due to excessive risk-taking of securitized products.9 41. The third element of the government strategy to ensure a sound development of banks and non-bank financial service providers should be to further strengthen regulation to increase transparency and mitigate risks. As mentioned above, CBRC has already tightened prudential regulation for trust assets especially loans and other non-standard debt instruments as well as capital adequacy requirement through incremental steps over recent years. CBRC has also limited bank’s exposure to trusts, requested banks to register all WMPs on a centralized electronic platform, and to include non-guaranteed WMPs into their calculation of risk-weighted assets for capital adequacy calculations. 42 We expect the growth of both trust funds and bank WMPs to become healthier albeit slower as these policies and other are being implemented. As the condition of financial repression will be made less acute by accelerated financial sector liberalization, including deposit rate liberalization and asset securitization, the regulatory-arbitrage incentives for investing in WMPs and trust funds will fade. Bank WMPs will increasingly become an investment instrument available for more risk-savvy retail investors. Trust funds will become actively managed investment platforms for dedicated wealth rather than speculative funding vehicles. This reform path of development is not without challenges, especially in view of the expected uptick of defaults in coming years. Nevertheless, reasonably robust growth of GDP, continuing financial sector liberalization and further strengthening of prudential regulation will likely ensure the success of the reform path for trust funds and bank WMPs. This success will significantly contribute to the resolution of the broader issue of shadow banking reform and regulation in the PRC.
9 Securitization pilots that were (re-) launched in the PRC in 2011 and ongoing expert consultations seem
to suggest that the government is considering broadening the scope for securitization.
20
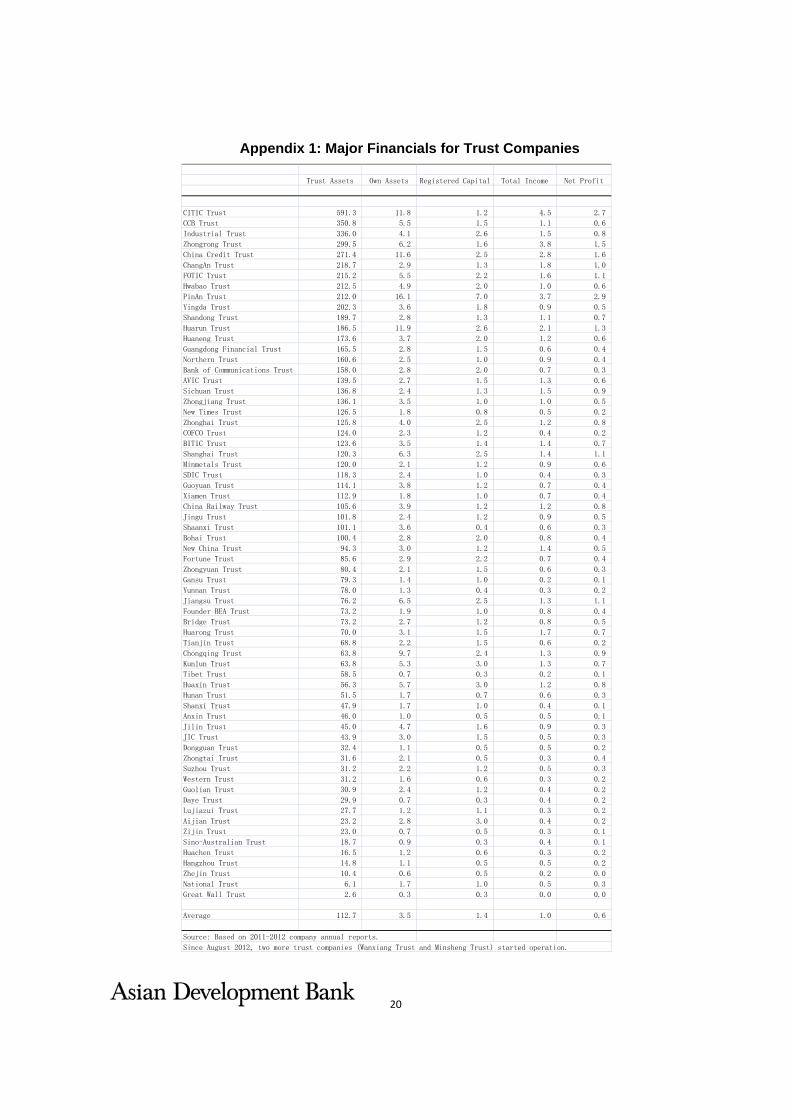
Appendix 1: Major Financials for Trust Companies
Trust Assets Own Assets Registered Capital Total Income Net Profit
CITIC Trust 591.3 11.8 1.2 4.5 2.7
CCB Trust 350.8 5.5 1.5 1.1 0.6
Industrial Trust 336.0 4.1 2.6 1.5 0.8
Zhongrong Trust 299.5 6.2 1.6 3.8 1.5
China Credit Trust 271.4 11.6 2.5 2.8 1.6
ChangAn Trust 218.7 2.9 1.3 1.8 1.0
FOTIC Trust 215.2 5.5 2.2 1.6 1.1
Hwabao Trust 212.5 4.9 2.0 1.0 0.6
PinAn Trust 212.0 16.1 7.0 3.7 2.9
Yingda Trust 202.3 3.6 1.8 0.9 0.5
Shandong Trust 189.7 2.8 1.3 1.1 0.7
Huarun Trust 186.5 11.9 2.6 2.1 1.3
Huaneng Trust 173.6 3.7 2.0 1.2 0.6
Guangdong Financial Trust 165.5 2.8 1.5 0.6 0.4
Northern Trust 160.6 2.5 1.0 0.9 0.4
Bank of Communications Trust 158.0 2.8 2.0 0.7 0.3
AVIC Trust 139.5 2.7 1.5 1.3 0.6
Sichuan Trust 136.8 2.4 1.3 1.5 0.9
Zhongjiang Trust 136.1 3.5 1.0 1.0 0.5
New Times Trust 126.5 1.8 0.8 0.5 0.2
Zhonghai Trust 125.8 4.0 2.5 1.2 0.8
COFCO Trust 124.0 2.3 1.2 0.4 0.2
BITIC Trust 123.6 3.5 1.4 1.4 0.7
Shanghai Trust 120.3 6.3 2.5 1.4 1.1
Minmetals Trust 120.0 2.1 1.2 0.9 0.6
SDIC Trust 118.3 2.4 1.0 0.4 0.3
Guoyuan Trust 114.1 3.8 1.2 0.7 0.4
Xiamen Trust 112.9 1.8 1.0 0.7 0.4
China Railway Trust 105.6 3.9 1.2 1.2 0.8
Jingu Trust 101.8 2.4 1.2 0.9 0.5
Shaanxi Trust 101.1 3.6 0.4 0.6 0.3
Bohai Trust 100.4 2.8 2.0 0.8 0.4
New China Trust 94.3 3.0 1.2 1.4 0.5
Fortune Trust 85.6 2.9 2.2 0.7 0.4
Zhongyuan Trust 80.4 2.1 1.5 0.6 0.3
Gansu Trust 79.3 1.4 1.0 0.2 0.1
Yunnan Trust 78.0 1.3 0.4 0.3 0.2
Jiangsu Trust 76.2 6.5 2.5 1.3 1.1
Founder BEA Trust 73.2 1.9 1.0 0.8 0.4
Bridge Trust 73.2 2.7 1.2 0.8 0.5
Huarong Trust 70.0 3.1 1.5 1.7 0.7
Tianjin Trust 68.8 2.2 1.5 0.6 0.2
Chongqing Trust 63.8 9.7 2.4 1.3 0.9
Kunlun Trust 63.8 5.3 3.0 1.3 0.7
Tibet Trust 58.5 0.7 0.3 0.2 0.1
Huaxin Trust 56.3 5.7 3.0 1.2 0.8
Hunan Trust 51.5 1.7 0.7 0.6 0.3
Shanxi Trust 47.9 1.7 1.0 0.4 0.1
Anxin Trust 46.0 1.0 0.5 0.5 0.1
Jilin Trust 45.0 4.7 1.6 0.9 0.3
JIC Trust 43.9 3.0 1.5 0.5 0.3
Dongguan Trust 32.4 1.1 0.5 0.5 0.2
Zhongtai Trust 31.6 2.1 0.5 0.3 0.4
Suzhou Trust 31.2 2.2 1.2 0.5 0.3
Western Trust 31.2 1.6 0.6 0.3 0.2
Guolian Trust 30.9 2.4 1.2 0.4 0.2
Daye Trust 29.9 0.7 0.3 0.4 0.2
Lujiazui Trust 27.7 1.2 1.1 0.3 0.2
Aijian Trust 23.2 2.8 3.0 0.4 0.2
Zijin Trust 23.0 0.7 0.5 0.3 0.1
Sino-Australian Trust 18.7 0.9 0.3 0.4 0.1
Huachen Trust 16.5 1.2 0.6 0.3 0.2
Hangzhou Trust 14.8 1.1 0.5 0.5 0.2
Zhejin Trust 10.4 0.6 0.5 0.2 0.0
National Trust 6.1 1.7 1.0 0.5 0.3
Great Wall Trust 2.6 0.3 0.3 0.0 0.0
Average 112.7 3.5 1.4 1.0 0.6
Source: Based on 2011-2012 company annual reports.
Since August 2012, two more trust companies (Wanxiang Trust and Minsheng Trust) started operation.
21
Appendix 2: Major CBRC Regulations Since its establishment in 2002, CBRC has been the lead regulator of the trust industry, which had been supervised by PBOC previously. An important foundation for a revamped regulatory environment was the 2007 issuance of the “CBRC Measures on Administration of Trust Companies”, which aimed to transform trust companies from speculative financing platforms to professional institutions entrusted with managing third-party wealth. Since then, CBRC has taken a multitude of regulatory actions affecting various aspects of the trust industry. Of particular note are 8 major regulatory policies that had a significant bearing on trust companies’ operations and their cooperation with banks. The latest regulation issued in April 2014 is a comprehensive guidance on risk management by trust companies covering a wide area including corporate governance, dividend policy, liquidity support, investor protection and project due diligence. In particular, the guidance implements the No.107 Directive by the State Council in prohibiting the use of funding pools by trust companies for investment in non-standardized debt instruments (e.g., loans). Existing funding pools will have to be phased out orderly without disrupting overall liquidity situation. 2014 04 CBRC Notice on Guidance for Trust Company Risk Management (aka No.99 Notice) 2014 01 State Council Directive on Shadow Banking Regulation (aka No.107 Directive) 2013 03 CBRC Notice on Regulation of Properly Investing Bank WMPs (aka No.8 Notice) 2011 01 CBRC Notice on Further Regulation of Cooperation between Bank WMPs and Trust Funds 2010 08 CBRC Notice on Regulation of Cooperation between Bank WMPs and Trust Funds 2010 07 CBRC Measures on Net Capital Regulation for Trust Companies 2009 12 CBRC Notice on Further Regulation of Bank-Trust Cooperation 2009 03 CBRC Measures on Administration of Combined Trust Plans (Revised) 2007 01 CBRC Measures on Administration of Trust Companies