Knowledge diffusion from FDI and Intellectual Property Rights
38
Knowledge diffusion from FDI and Intellectual Property Rights Roger Smeets Albert de Vaal CPB Discussion Paper | 168
Transcript of Knowledge diffusion from FDI and Intellectual Property Rights

Knowledge diffusion from FDI and Intellectual Property Rights
Roger SmeetsAlbert de Vaal
CPB Discussion Paper | 168


CPB Discussion Paper
No 168
February 2011
Knowledge diffusion from FDI and Intellectual
Property Rights
Rogers Smeets and Albert de Vaal
The responsibility for the contents of this CPB Discussion Paper remains with the author(s)

2
CPB Netherlands Bureau for Economic Policy Analysis
Van Stolkweg 14
P.O. Box 80510
2508 GM The Hague, the Netherlands
Telephone +31 70 338 33 80
Telefax +31 70 338 33 50
Internet www.cpb.nl
ISBN 978-90-5833-495-4

Abstract in English
We study the extent to which a country's strength of Intellectual Property Rights (IPR) protection
mediates knowledge spillovers from Foreign Direct Investment (FDI). Following the opposing
views in the IPR debate, we propose a negative effect of IPR strength on unintentional horizontal
(intra-industry) knowledge diffusion, and a positive effect on intentional vertical (inter-industry)
knowledge diffusion. Using a unique firm-level dataset of large, publicly traded firms in 22
(mostly) developed countries, we find partial support for these expectations. Strong IPR indeed
reduces horizontal knowledge diffusion, while it stimulates backward (to suppliers) knowledge
diffusion. Somewhat unexpectedly however, we also find that forward (to customers) knowledge
diffusion decreases with IPR strength. In general, and in line with earlier literature, the results
regarding backward knowledge diffusion are most robust to changes in model specification. Our
results contribute to the debate regarding the desirability of strengthening national IPR systems,
and suggest that local firms might indeed benefit from this through their (backward) linkages
with multinationals. Additionally, our results suggest that the moderating effect of IPR strength
might partly explain the inconclusive results in the FDI knowledge diffusion literature.
Key words: Intellectual property rights, knowledge diffusion, multinationals, FDI
JEL codes: F23, O33, O34
Abstract in Dutch
In deze studie onderzoeken we het effect van nationale bescherming van intellectueel eigendom
(IE) op kennisdiffusie van multinationals. We verwachten dat een toename van IE bescherming
enerzijds tot minder horizontale kennisdiffusie naar concurrenten leidt, omdat deze vorm van
diffusie vaak onbedoeld (d.w.z. een externaliteit) is. Anderzijds zal verticale kennisdiffusie naar
leveranciers en afnemers toenemen, omdat het risico op oneigenlijk gebruik na deze doelbewuste
kennistransfer daalt. Onze analyse van 2500 grote bedrijven in 22 (ontwikkelde) landen
gedurende de periode 2000-2005 is deels conform deze verwachtingen. Kennisdiffusie naar
concurrenten neemt af, en kennisdiffusie naar leveranciers neemt toe wanneer IE bescherming
stijgt. Kennisdiffusie naar afnemers neemt echter ook onverwacht toe in dit geval. De resultaten
met betrekking tot kennisdiffusie richting leveranciers zijn het meest robuust. Onze resultaten
suggereren dat een toename van IE bescherming in het voordeel van lokale bedrijven is wanneer
deze stevige toeleveringsrelaties hebben met multinationals. Verder bieden onze resultaten een
gedeeltelijke verklaring voor het gebrek aan eenduidige resultaten in de literatuur rondom
kennisdiffusie van multinationals.


Knowledge diffusion from FDI and Intellectual Property Rights
Roger Smeetsa,b∗ Albert de Vaalc
February 2011
a CPB Netherlands Bureau for Economic Policy Analysis
b Department of International Economics & Business, University of Groningen
c Department of Economics, Radboud University Nijmegen
Abstract
We study the extent to which a country’s strength of Intellectual Property Rights (IPR)
protection mediates knowledge spillovers from Foreign Direct Investment (FDI). Following
the opposing views in the IPR debate, we propose a negative effect of IPR strength on
unintentional horizontal (intra-industry) knowledge diffusion, and a positive effect on in-
tentional vertical (inter-industry) knowledge diffusion. Using a unique firm-level dataset
of large, publicly traded firms in 22 (mostly) developed countries, we find partial support
for these expectations. Strong IPR indeed reduces horizontal knowledge diffusion, while it
stimulates backward (to suppliers) knowledge diffusion. Somewhat unexpectedly however,
we also find that forward (to customers) knowledge diffusion decreases with IPR strength.
In general, and in line with earlier literature, the results regarding backward knowledge
diffusion are most robust to changes in model specification. Our results contribute to the
debate regarding the desirability of strengthening national IPR systems, and suggest that
local firms might indeed benefit from this through their (backward) linkages with multina-
tionals. Additionally, our results suggest that the moderating effect of IPR strength might
partly explain the inconclusive results in the FDI knowledge diffusion literature.
Keywords: Intellectual Property Rights, knowledge diffusion, multinationals, FDI
1 Introduction
Over the past couple of decades, many countries have witnessed important developments towards
a stronger system of Intellectual Property Rights (IPR) protection (Maskus, 2000; Branstetter
et al., 2006). Nonetheless, there has been considerable debate regarding the desirability of a
∗Corresponding author: CPB Netherlands Bureau for Economic Policy Analysis, P.O. Box 80510, 2508 GM,The Hague, The Netherlands. Tel: +31 70 338 3423. E: [email protected].
1

strong IPR system. On the one hand, proponents argue that it will induce innovation world-
wide, and enhance cross-country technology transfer. On the other hand, it has been argued
that increased IPR will shift the rents of innovation towards multinationals (MNEs) as they
are better able to appropriate technological developments, at the expense of small (national)
firms. Stated differently, strong IPR reduces static efficiency by increasing the marginal costs of
knowledge diffusion, but supports dynamic efficiency by stimulating innovation (Maskus, 2000).
Empirical research has so far remained relatively silent on the matter.1 Two important
recent exceptions are Branstetter et al. (2006) and Branstetter et al. (2010). Branstetter et al.
(2006) investigate how US MNEs respond to increased IPR strength by means of parent-affiliate
international technology transfer. They offer convincing evidence that such transfers increase
significantly following IPR reform. Branstetter et al. (2010) additionally show that industry-
level value added increases after IPR reform, which they take as evidence that reduced imitative
local activity is more than offset by increased MNE activity and activity of non-imititating lo-
cal firms. However, these two studies do not address the effects on local firms due to potential
changes in MNE knowledge diffusion.
Our aim in this study is to assess the mediating impact of national IPR strength on MNE
knowledge diffusion to local firms. To this end, we employ a unique firm-level dataset span-
ning 22 (mostly) developed countries during the period 2000-2005. In our empirical setup,
we exploit the conceptual difference between horizontal (intra-industry) versus vertical (inter-
industry) knowledge diffusion. In particular, we argue that horizontal knowledge diffusion is
dominated by unintentional spillovers, which IPR systems aim to reduce. By contrast, vertical
knowledge diffusion is dominated by intentional transfers, which are encouraged under strong
IPR. We are thus able to assess the relative importance of the two opposing effects of increased
IPR strength on FDI knowledge diffusion.
The empirical results partly corroborate our expectations. Whithout accounting for the im-
pact of IPR strength, we find no robust knowledge diffusion effect from MNEs in any direction.
Yet when allowing for knowledge diffusion to vary with IPR strength, we find robust evidence
that backward knowledge diffusion (transfer towards suppliers) increases with stronger IPR.
Somewhat unexpectedly, forward knowledge diffusion (transfer towards customers) decreases
1There is a rather large literature on the impact of IPR strength on the amount and composition of trade andFDI countries receive (e.g Maskus and Penubarti, 1995; Lee and Mansfield, 1996; Smith, 2001; Javorcik, 2004a).However, the consequences for technology transfer or innovation in general remain unclear from these studies.
2

with IPR strength. Finally, and in line with expectations, horizontal knowledge spillovers are
also affected negatively by stronger IPR. The results regarding backward diffusion are most
robust to changes in model specifications.
The local benefits following Foreign Direct Investments (FDI) by MNEs has been the domain
of a large literature studying knowledge spillovers from FDI (Javorcik, 2004b). These studies
have become notorious for their widely divergent findings (cf. Gorg and Strobl, 2001; Gorg
and Greenaway, 2004; Smeets, 2008). It has been argued that this is because many empirical
estimates simultaneously incorporate positive knowledge diffusion effects, as well as negative
consequences of inward FDI activity due to e.g. competitive pressures (Aitken and Harrison,
1999). Conditioning the impact of MNE activity in a way which induces positive effects to
dominate negative effects (or vice versa) may partly help to solve the ambiguity (Castellani
and Zanfei, 2006). National IPR strength is such a conditioning mechanism. Yet so far, none
of the studies in this field has considered the impact of national IPR strength on the extent
of knowledge spillovers from FDI, presumably because of lack of cross-country firm-level data
(Javorcik, 2008).
By focusing on the impact of IPR strength, our study thus also adds to the literature on
knowledge spillovers from FDI in general. Moreover, our study shows that IPR systems achieve
what they are supposed to achieve, which is to correct a market faillure by decreasing knowl-
edge externalities. However, we also find that MNEs more easily share their knowledge and
technology with their local suppliers under strong IPR, thus enhancing the local host-country
knowledge base. A simple back-of-the-envelope evaluation suggests that the positive effects on
backward knowledge diffusion tend to outweigh the negative effects through decreased hori-
zontal and forward knowledge diffusion, although this conclusion depends somewhat on how
conservatively one wishes to interpret the estimation results.
The rest of this paper is structured as follows. Section 2 formulates the theoretical expec-
tations regarding the impact of IPR on MNE knowledge diffusion. It characterizes the nature
of the different diffusion effects and relates these to IPR strength. Section 3 describes the data
and the methodology. Section 4 presents the empirical results and robustness checks. Finally,
Section 5 concludes.
3

2 FDI knowledge diffusion: spillovers and transfers
Many studies have documented significant productivity advantages of MNEs and their foreign
affiliates over national (host-country) firms (Blomstrom and Sjoholm, 1999; Markusen, 2002).
The recent heterogeneous firms literature has attributed this productivity advantage to the high
fixed costs of foreign investment, leading only the most productive firms to engage in FDI (Help-
man et al., 2004). Accordingly, there is a lot of potential for knowledge or technology to diffuse
from MNE affiliates to relatively backward local firms. As such, MNEs play an important role
in international cross-country technology diffusion.
The literature on knowledge diffusion from FDI has generally distinguished three channels
along which knowledge or technology can diffuse between MNE affiliates and host-country firms
(cf. Gorg and Greenaway, 2004; Javorcik, 2004b): First, MNE products and practices may be
copied or imitated by local firms, which is the so-called demonstration effect. Second, MNEs
might assist their suppliers and customers in various aspects of e.g. quality control or product
management. These effects thus work through vertical linkages. Third, workers employed by
MNE affiliates may be (re)employed by local firms, so that knowledge diffuses through labor
turnover. Although many studies have empirically scrutinized these effects empirically, surveys
of this literature have repeatedly pointed out their widely divergent results (Blomstrom and
Kokko, 1998; Gorg and Strobl, 2001; Gorg and Greenaway, 2004; Smeets, 2008).
One of the reasons for this ambiguity may be due to the methodology employed, which
usually relates (changes in) local firms’ Total Factor Productivity (TFP) to inward MNE ac-
tivity. Even though knowledge diffusion can be expected to increase TFP, it has been pointed
out that negative productivity effects might also arise simultaneously. For instance, Aitken and
Harrison (1999) argue that local firms’ productivity might decline due to an adverse competi-
tion effect generated by MNE activity. In particular, if firms incur fixed costs of production,
MNEs may find it optimal to draw demand from their local competitors and force them back up
their average cost curve. If the production contraction is large enough, this could outweigh any
positive productivity effects. Adverse productivity effects could also arise for local suppliers
and customers of MNEs (Javorcik, 2008). If the MNE acts a monopsonist towards its local
suppliers, their (revenue based) TFP could be adversely affected due to the downward pressure
on their price margins. Similarly, MNEs might act as monopolists towards their local customers
4

by forcing them to pay higher prices relative to the local suppliers that they displace.
In sum, measured productivity responses of local firms due to MNE activity can go either
way, and generally empirical estimates will incorporate both the positive and negative effects.
Yet if we can establish conditions under which the positive effects dominate the negative effects
(or vice versa), we might be able to partly solve this ambiguity (Castellani and Zanfei, 2006).
Because national IPR sytems influence the knowledge diffusion impact of MNEs while leaving
its competition effects (relatively) unaffected, the strength of national IPR systems provides
such a conditional mechanism. As we will argue, however, the way the impact is conditional on
IPR strength crucially depends on the distinction between horizontal and vertical FDI knowl-
edge diffusion due to the different nature of the knowledge diffusion implied.
Knowledge diffusion in general may be thought of to occur both intentionally as well as
unintentionally. In the latter case, it constitutes an externality and therefore a market failure,
and it is usually termed a knowledge spillover. Intentional knowledge diffusion is usually coined
a knowledge transfer, comprising the intra-firm diffusion of knowledge studied in Branstetter
et al. (2006) or the deliberate transfer of knowledge to local firms in order to ascertain quality
in the supply chain (Javorcik, 2008). A well designed IPR system corrects the market faillure
that occurs due to knowledge spillovers by providing innovators with sufficient means to ap-
propriate their ideas and inventions. By reducing the possibility for knowledge spillovers, this
should induce them to increase the resources invested in innovation, as their private optimal
investment shifts closer towards the social optimum. However, it is also expected to increase
knowledge transfer exactly because it reduces the risk of ex-post expropriation, as demonstrated
in Branstetter et al. (2006) for intra-MNE technology transfer. Consequently, a trade-off arises
from increasing national IPR strength: On the one hand, knowledge diffusion diminishes through
decreased spillovers. On the other hand, knowledge diffusion surges through increased transfers.
We argue that these two different types of knowledge diffusion are naturally related to the
direction of knowledge diffusion from FDI. First consider horizontal knowledge diffusion. Con-
ceptually, this constitutes knowledge diffusion towards local competitor firms within the industry
(Saggi, 2002), occuring mainly through labor turnover and demonstration effects (Mansfield and
Romeo, 1980; Javorcik, 2008). MNE affiliates have nothing to gain by intentionally engaging in
such knowledge diffusion, as it will erode the competitive edge they have over local host-country
5

firms. Indeed, as noted by Blomstrom and Kokko (1998), “[...] pure demonstration effects often
take place unconsciously [...]” (p.15). This type of knowledge diffusion thus constitutes a true
externality, and hence is dominated by knowledge spillovers.
Vertical knowledge diffusion on the other hand occurs between MNEs and their local suppli-
ers and customers, i.e. through vertical linkages. Conceptually, this is a very different kind of
diffusion, as it is mainly intentional. The reason is that MNEs have much to gain from increased
input and (final) output quality, as it further establishes and strengthens their competitive po-
sition in local markets. Recent survey evidence documented by Javorcik (2008), designed to
investigate the implications of foreign entry for domestic Czech and Latvian firms, corroborates
this view. For instance, fourty percent of Czech supplying firms report having received some
kind of MNE assistance, such as personnel training, leasing of machinery, or assistance with
technology (cf. Figure 5, p.151 in Javorcik, 2008).2 Hence, (inter-firm) knowledge transfer plays
a key role in vertical knowledge diffusion from FDI.
The different nature of horizontal versus vertical MNE knowledge diffusion leads to two
opposing expecations.3 First, increased IPR strength should reduce the amount of knowledge
spillovers. Hence, given adverse horizontal competition effects, we expect that positive knowl-
edge diffusion effects dominate in low IPR countries (and vice versa in high IPR countries).
Second, increased IPR reduces the risks of knowledge transfer by strengthening the means to
appropriate knowledge and technology by MNEs. Consequently, we expect vertical knowledge
diffusion to rise with increased IPR strength (in the same spirit as the increased intra-MNE tech-
nology transfer documented in Branstetter et al. (2006)), so that they dominate adverse vertical
competition effects in high IPR countries (and vice versa in low IPR countries). These divergent
expectations allow us to test the trade-off embodied in increasing national IPR strength. Addi-
tionally, they offer a potential explanation for the widely divergent findings in (single country)
2A substantially smaller amount of Czech MNE customers (6 percent) report having received assistance onhow to use MNE inputs. Hence, vertical knowledge diffusion from MNEs appears to be more substantial upstreamthan downstream.
3Two comments are in order. First, by arguing that horizontal (vertical) knowledge diffusion will be domi-nated by knowledge spillovers (transfers), we do not deny that in practice both horizontal and vertical knowledgediffusion will be a mix of spillovers and transfers. However, given the different nature of the relationships be-tween the MNE and the receiving local firms (competitors versus suppliers or customers), overall we would expectspillovers to drive horizontal knowledge diffusion and transfers to drive vertical knowledge diffusion. Second, weonly focus on first-order effects here. That is, we do not consider knowledge spillovers among local upstreamor downstream firms that might result after vertical FDI knowledge transfer. Nor do we consider knowledgetransfers between local firms that might result after horizontal FDI knowledge spillovers. Given that these effectsare indirect (i.e. of higher order), we do not expect these to dominate the outcomes.
6
studies on FDI knowledge diffusion.
3 Data and methodology
3.1 Data and variables
Our firm-level data are derived from Thomson’s Worldscope database. Our access to this
database provides us with a sample that contains a panel of about 2,500 non-financial local firms
and 324 foreign-owned firms that are active in 22 countries and 16 manufacturing industries
(at the 2-digit ISIC Rev. 3 level) during the period 2000-2005. Data on ownership was derived
from the “Who owns whom” database, from which we could subtract data on ownership shares
and identities for all the firms in our sample for the year 2004. We use this information in
constructing the horizontal and vertical MNE presence variables below. Table 1 presents some
descriptive statistic regarding the allocation of (foreign owned) firms accross the countries in
our sample. In the Appendix we provide more details regarding the exact construction of the
firm-level dataset.
<< INSERT TABLE 1 ABOUT HERE>>
Our main independent variables of interest concern the presence of MNEs, both within the local
firms’ own industries, as well as in upstream and downstream industries. Intra-industry MNE
presence is measured as follows (cf. Javorcik, 2004b):
Horizontaljt =
∑nj
i=1(ρi × Salesit)∑Nj
i=1 Salesit(1)
where i, j and t index firms, industries and years respectively, nj denotes the total number of
foreign owned firms in industry j, and ρi denotes the share of foreign ownership in firm i.4 Nj
denotes the total number of firms in industry j. Sales denote firm-level sales.
In line with Javorcik (2004b) we use industry-level input and output shares (constructed from
the OECD Input-Output tables) to compute vertical linkages.5 Specifically, if αjk denotes the
output share of industry j flowing to industry k (with j = k), backward linkages (to supplying
4We omit country subscripts k but note that all MNE presence variables are computed per country.5The most recent I-O tables available for the period of study are for 2002. We use these tables to compute
(constant) input-output shares for the entire sample period.
7

industries) are computed as:
Backwardjt =∑j =k
(αjk ×Horizontalkt) (2)
where Horizontal is defined as in (1). Similarly, letting σjk denote the share of inputs obtained
by industry j from industry k, we construct forward linkages as:6
Forwardjt =∑j =k
(σjk ×Horizontalkt) (3)
Table 2 presents the average degree of foreign ownership per industry, as well as its standard
deviation. In industries such as “Motor vehicles” and “Food and beverages” the average foreign
ownership share is relatively low, contrary to industries such as “Wood and wood products”. It
might be the case that there are unobserved industry-level characteristics which cause these av-
erage ownership shares to diverge accross industries. In the empirical specification we therefore
include fixed effects (FE) to account for this possibility.
<< INSERT TABLE 2 ABOUT HERE>>
We follow the extant literature on knowledge diffusion from FDI and consider the effect of
Horizontal, Backward and Forward on local firms’ productivity (Gorg and Strobl, 2001; Ja-
vorcik, 2004b; Blalock and Gertler, 2008). In order to do so, we first estimate industry-level
production functions, explaining value added from capital and labor inputs (at the two-digit
ISIC Rev. 3 level).7 Next to an idiosyncratic component, the error term in this production
function contains a measure of firm-level productivity. Because of this, the error term is cor-
related with factor inputs, as the (variable) input decisions are made partly in response to the
productivity contained in the error term (Olley and Pakes, 1996; Levinsohn and Petrin, 2003).
As is standard in the literature, we follow the procedure in Olley and Pakes (1996) to correct
for this simultaneity bias. Table A.1 in the Appendix compares the coefficients for labor and
capital stocks obtained in this way with those obtained through simple OLS. In the majority of
6Javorcik (2004b) nets out MNE exports when computing Horizontal in this case, since such exports are notdestined for the local market. Due to lack of firm-level export data, we cannot follow this approach.
7Preferably, we would have estimated country-industry specific production functions, as the parameters inthe production function are likely to vary both accross industries as well as countries. However, in many casesthis yields too few observations to generate consistent parameter estimates.
8

cases the Olley-Pakes coefficients deviate in the expected way from the OLS coefficients.8
We further add two firm-level control variables: First, we incorporate a measure of firm
size, which is the (log of) total assets of firms. The expected effect of this variable is positive,
as many studies have demonstrated a positive correlation between firm size and productivity
(e.g. Haltiwanger et al., 1999). Second, we also include the the share of firm sales in total
industry-level sales, to capture the firm’s competitive power. Again, we expect this variable to
enter with a positive sign (e.g. Aitken and Harrison, 1999).
In order to measure the strength of the national IPR systems of the countries in our sample,
we employ the widely-used Ginarte and Park-index of IPR strength (Ginarte and Park, 1997;
Javorcik, 2004a). This IPR index is a composite of five different components, that capture
(1) the extent of coverage, (2) whether or not a country participates in international patent
agreements, (3) whether there are provisions for loss of protection, (4) the quality of enforce-
ment mechanisms, and (5) the duration of protection.9 Each individual component is rated on
a scale from 0 (weak IPR protection) to 1 (strong IPR protection), so that the (unweighted)
index varies between 0 and 5.10 The most recent values relevant for our sample period are for
2000 and 2005.11 In the main specifications below, we use the 2000 index, which corresponds
to IPR strength at the start of our sample. This should mitigate concerns that IPR strength
develops in response to MNE knowledge diffusion, for instance when MNEs that intensively
transfer technology to their suppliers actively lobby for strengthening national IPR systems
(cf. Ahlquist and Prakash, 2008). In the robustness analysis we also run our model with the
2005 IPR index. Table 1 presents the IPR index for each country in our sample. Because the
countries in our sample are mainly developed countries whose IPR systems are already quite
well developed, the variation on the index is relatively low. The minimum score is 2.9 for Hong
Kong, versus a maximum of 5 for the United States.
In order to investigate if the theoretical expectations are also borne out by the raw data, we
first inspect some simple correlations. Specifically, we divide our sample into high versus low
IPR countries, where we use the median index (4.2) as the cutoff. We then plot industry-level
8Levinsohn and Petrin (2003) describe an alternative approach to Olley and Pakes (1996) which can be usedwhen there are a lot of firms with zero investment. Given that we only look at large, publicly traded firms in oursample, this is not a problem in our case.
9A more elaborate discussion of these individual components and how they have been measured can be foundin Ginarte and Park (1997).
10It should be noted that this measure tends to capture de jure IPR strength rather than de facto IPR strength.11We thank professor Park for sharing the updated dataset with us.
9

correlations between the (log) TFP of local firms and the Horizontal, Backward and Forward
shares as defined above. Figures 1-3 plot these correlations, distinguishing between high and
low IPR countries.
<< INSERT FIGURES 1-3 ABOUT HERE>>
All figures show clearly diverging and opposite correlations between MNE sales shares and
local TFP for high versus low IPR countries. A couple of features are noteworthy: First,
the patterns correspond to the theoretical expectations formulated in Section 2. Specifically,
Figure 1 shows a clear positive correlation between Horizontal and TFP only for low IPR
countries. For Backward and Forward, by contrast, Figures 2 and 3 show that a positive
correlation only exists for high IPR countries. This accords well with the theoretical prediction
that better IPR facilitates the transfer of knowledge, but reduces knowledge spillovers. Second,
Horizontal correlates negatively with TFP in high IPP countries, and Backward and Forward
correlate negatively with TFP in low IPR countries. This corresponds to our contention that
adverse competition effects generated by MNE presence will dominate any positive knowledge
diffusion effects in high IPR countries (for Horizontal) or low IPR countries (for Backward
and Forward). Finally, the correlations in Figure 3 are substantially less pronounced than in
the other two figures. This corresponds to the general findings in the literature, mentioned in
Section 2, that no or only small effects of forward linkages can be found(Javorcik, 2008; Kugler,
2006).
Despite the correspondence between these figures and our expectations, it is also clear that
there is large variation along the predicted fits. We will have to turn to more formal econometric
analysis to see if these patterns are robust to various controls for observed and unobserved
heterogeneity. Before presenting the results, we first briefly discuss the empirical model.
3.2 Empirical strategy
As mentioned in the previous section, we follow the extant literature on FDI knowledge diffusion
and investigate the impact of intra and inter-industry MNE presence on local firms’ TFP. Our
approach differs from previous studies in that we allow this impact to vary with the strength of
10

national IPR systems. Our empirical model looks as follows:
TFPijkt =β0 + β1Horizontaljkt + β2Backwardjkt + β3Forwardjkt + β4HorizontaljktIPRk
+ β5BackwardjktIPRk + β6ForwardjktIPRk +Xitγ + εijkt
s.t. εijkt = ηi + ϕj + µk + νt + ϵijkt
(4)
where i, j, k and t index firm, industry, country and year respectively, and X is a vector with
the two firm-level controls described in the previous section. The error term ε is a composite of
unobserved firm, industry, country, and time specific heterogeneity, and an idiosyncratic com-
ponent ϵ.
Following the discussion in Section 2 regarding horizontal FDI knowledge diffusion, we ex-
pect β4 to be negative, because knowledge spillover effects decrease in high IPR countries and
negative competition effects start to dominate. Accordingly, we expect β1 to be positive because
it mainly captures the positive horizontal knowledge spillovers effects in low IPR countries. In
contrast, for backward and forward knowledge diffusion we expect the individual effects β2 and
β3 to be negative, because weak IPR regimes generate little vertical knowledge diffusion, so that
adverse vertical competition effects dominate. Accordingly, β5 and β6 should be positive, since
increased IPR strength increases vertical knowledge diffusion.
In order to account for the unobserved heterogeneity, we run model (4) with firm fixed effects
(FE). Since none of the firms in our sample switches industries or countries, this simultaneously
takes care of all unobserved heterogeneity, except for νt.12 In order to take care of this latter
component, we also run the model including year FE. Additionally, we have to account for the
multiple levels of observation in our model when computing standard errors (Moulton, 1990).
The standard practice in the literature is to cluster standard errors at the industry level (Ja-
vorcik, 2004b; Javorcik and Spatareanu, 2008). However, since we also have multiple countries
in our sample, we also have to address the possibility that firms operating in the same country
might be simultaneously exposed to country-level shocks. Therefore, we cluster our standard
errors at the country-industry level.13
Another well-known issue in the FDI knowledge diffusion literature is the potential endo-
12This also implies that including any time-invariant industry or country-level variables - such as the IPRindex - individually in the model is not necessary, as these will be accounted for in the fixed effects.
13This yields a total of 338 clusters, which should be sufficient for computing robust standard errors (Moulton,1990).
11

geneity of the MNE sales share variables. Specifically, if MNEs choose to invest mainly in the
most productive industries or regions of a host-country, this could induce a reverse causality
when estimating the model in (4). However, finding proper instruments for the MNE presence
variables is notoriously difficult, especially in our setup with multiple countries and industries.
We address this issue in two alternative ways. First, we also run the model including one-
period lagged values of the MNE presence variables, to establish Granger causality (Granger,
1969). Second, instead of running a GLS FE model, we also experiment with running the
model by means of the system GMM estimator by Blundell and Bond (1998). This approach
simultaneously estimates two equations: The level equation in (4), as well as its first-differenced
counterpart. It then uses lagged first-differences as instruments for the MNE variables in the
level equation, and lagged levels as instruments for the MNE variables in the first-differenced
equation. The key assumptions for these instruments to be valid is that the idiosyncratic com-
ponent of the error term ϵijkt is not serially correlated, and that the explanatory variables are
not correlated with future realizations of the error term. We report results for formal tests of
these assumptions below.14
4 Results
We first run the model in (4) without including the IPR interaction terms, in order to consider
the unmoderated impact of MNE presence. Table 3 presents the results. Column 1 is the GLS
FE model without year dummies. As can be seen, none of the MNE variables has a significant
impact on TFP, except for Forward, which is negative. Column 2 adds the year dummies
to control for unobserved time heterogeneity. In addition to Forward, now Backward is also
significant but with a positive sign. Column 3 uses lagged values of the MNE variables in
order to partly address the endogeneity issue. None of the MNE knowledge diffusion effects
are robust to this change in specification, as both the effects of Backward and Forward turn
insignificant. Finally, column 4 runs the model in (4) using the system GMM estimator by
Blundell and Bond (1998) to control for the endogeneity of the MNE variables. Again, none of
the MNE effects are robust to this alternative estimation method. However, inspection of both
14When applying system GMM estimation, we employ STATA’s XTABOND2 command by Roodman (2009).We follow the various suggestions in this paper when estimating the model.
12

the Sargan and Hansen test statistics for instrument validity indicates that the instruments
are not exogenous. Taken together, these results mirror the ambiguity in the literature and
underline the notion that the estimated coefficients incorporate both positive and negative
productivity effects simultaneously.
<< INSERT TABLE 3 ABOUT HERE >>
The two firm-level control variables consistently show up with a positive and significant co-
efficient, indicating that both absolute firm size and relative (to the industry) firm size are
conducive to a firm’s TFP. The only exception is the impact of firm size (assets) in the GMM
specification, which is negative and significant. Although this result is somewhat puzzling, we
recall that this specification suffers from instrument endogeneity, which might bias the results.
In terms of explanatory power, given the multiple levels of observation in our analysis the GLS
models perform reasonably well, with R2’s between 8.2% and 14%.
We now add the interactions with national IPR strength to the model. Table 4 presents the
results. The setup is the same as in Table 3. First consider the baseline specification in column
1. Results are very different from those in Table 3. Specifically, the results for Horizontal and
Backward are in line with expectations: The individual effect of Horizontal is positive whereas
the interaction with IPR is negative, indicating that horizontal knowledge spillovers are posi-
tive in low IPR countries, but decrease with IPR strength. For Backward this is exactly the
opposite: Backward linkages are negative in low IPR countries, but positive knowledge transfers
effects increase with IPR strength. These results corroborate the correlations shown in Figures
1 and 2. The effects of Forward, however, are not in line with expectations. Forward effects
are positive in low IPR countries but decrease with IPR strength. As we discuss in the next
section, this might be due to the fact that we only include manufacturing firms in our sample.
Finally, as shown in the bottom of the table, the F-statistic that tests whether the additional
explanatory power of this model over that in column 1 in Table 3 is statistically sufficient is
significant at 1% (the critical value is 3.78).15
<< INSERT TABLE 4 ABOUT HERE >>
15The statistic is computed as ((R22 −R2
1)/(K2 −K1))/((1−R22)/(N −K2 − 1)) where R2 is the R-squared, K
is the number of estimated parameters, N is the number of observations, and subscripts 1 and 2 index the modelexcluding and including interactions respectively. The R2 reported in Table 4 does not differ from that in Table3 due to rounding at two decimals. The increased explanatory power, albeit small, is still statistically significantdue to the relatively large number of observations in our model.
13

Column 2 adds year dummies to the model. Even though all coefficients decrease somewhat
in absolute value, all effects remain robust to this change in specification. Column 3 uses
one-year lagged values of the MNE variables. This leaves the signs of all coefficients intact,
but Horizontal and its interaction with IPR become insignificant. Finally, column 4 employs
the system GMM estimator. The results mirror those in column 3, although the coefficient
estimates decrease substantially in absolute value. As before, however, the Sargan and Hansen
test statistics indicate that the instruments are not exogenous at regular significance levels. As
in column 1, the F-statistics all indicate a significant increase in explanatory power over the
models reported in Table 3.16
Table 5 presents the results of five different robustness analyses. All models include the 1-
year lagged MNE variables, except when indicated otherwise. Column 1 reruns the model while
excluding Hong Kong from the sample. The reason for doing so is that Hong Kong displays a
strong gap in terms of IPR strength relative to the other countries in the sample, which might
drive some of the results.17 As can be seen, the results for Backward and Forward are robust
to this exclusion. Moreover, Horizontal and its interaction with IPR becomes significant again,
with the expected signs.
<< INSERT TABLE 5 ABOUT HERE >>
Our sample exhibits a lot of observations with a zero value on either Horizontal, Backward,
and Forward, as there are many country-industry pairs that do not have any (vertical) MNE
activity. In order to ensure that these zero values do not drive our results, column 2 in Table
5 excludes them from the sample. The results for all MNE variables are robust to this sample
reduction and remain significant. All coefficient estimates increase somewhat across the board.
The choice of a one-year lag might not be sufficient to account for the endogeneity of MNE
activity, nor for knowledge diffusion to take full effect. Therefore, in column 3 we repeat the
analyses while using two-year lags for the MNE variables.18 The results for Horizontal and
V ertical are robust and retain their expected signs. However, in this case Forward and its
16We do not report a F-statistic for the system GMM model because this model does not yield a (meaningful)R2.
17The 2000 IPR index for Hong Kong is 2.9, whereas Canada and Norway, who are next in line, exhibit anIPR index of 3.9. The standard deviation of the 2000 IPR index is 0.48 including Hong Kong, whereas it is 0.33excluding Hong Kong.
18Mansfield and Romeo (1980) document an average lag between intra-MNE technology transfer and inter-firmtechnology diffusion between 1.5 and 4 years. Our choice of a two-year lag is within this range. Due to the shorttime-span of our panel, using deeper lags substantially reduces the number of observations.
14

interaction with IPR become insignifcant.
As mentioned in Section 3.1, we also have IPR index values for the year 2005, which cor-
responds to the end of our sample period. Although using this index might raise concerns
regarding the endogeneity of IPR strength to MNE knowledge diffusion, column 4 uses the 2005
IPR index as a robustness check.19 The results stronlgy resemble those in column 3 of Table
4, with Horizontal and its interaction insignificant, Backward and its interaction with IPR
showing up significantly and with the expected signs, while Forward and its interaction are
significant but with the wrong signs.
Finally, a concern might be that instead of IPR strength, our IPR index is actually picking
up on economic development in general, given that IPR strength and economic development
tend to be related.20 This might confound our estimates in two ways. On the one hand, firms
in developed countries arguably have high absorptive capacity which supports the extent to
wich they benefit from knowledge diffusion (Cohen and Levinthal, 1989). On the other hand,
because of the small technology gap between local firms and foreign investors, it might be ar-
gued that they have little room to benefit from MNE knowledge diffusion (Griffith et al., 2004).
The former argument could explain the positive impact of IPR on backward diffusion, whereas
the latter could underly the negative impact of IPR on horizontal and forward diffusion. To
investigate this, in column 5 of Table 5 we include acountry’s (log) GDP per capita, as well as
its interaction with the three diffusion variables. 21 The results show that interacting with GDP
yields all of the Horizontal results insignificant. The Backward and Forward results are more
robust. In particular, the interactions with IPR remain (marginally) significant. GDP itself
has a positive effect on local firms’ productivity, possibly as a result of tougher competition in
larger, more developed markets (Melitz and Ottaviano, 2008).22
Finally, in order to illustrate the moderating effect of IPR, Figure 4 shows the predicted
impact of Horizontal, Backward and Forward for the different IPR values that the countries
19Given the short time-span of our sample, the changes in the IPR index are not very substantial. In particular,only two countries in our sample exhibit such a change: Korea (from 4.2 to 4.33) and Singapore (from 4.05 to4.21).
20The correlation coefficient between IPR (in 2000) and log GDP per capita in our sample is 0.23.21Data on per capita GDP are taken from the Penn World Tables, version 6.3 (Heston et al., 2009). It is
measured in constant international (PPP) US dollars.22Because of the apparent strong impact of excluding Hong Kong from the sample, we also ran the models
in columns 2-5 excluding Hong Kong. The most notable effect is that in this case, also Horizontal and itsinteraction with IPR becomes significant with the expected signs. The results are not presented but are availableupon request.
15

in our sample exhibit.23
<< INSERT FIGURE 4 ABOUT HERE >>
The figure shows that for Horizontal (Backward), the implied positive (negative) effects on
TFP in the low IPR countries of our sample are relatively small. Moreover, the total impact
of Horizontal is small in general compared to the effects of both Backward and Forward.
Additionally, the figure demonstrates that even in the country with the lowest IPR strength in
our sample, the forward productivity effects are negative.24 All in all, the vertical impact of
MNE activity seems to substantially outweigh the horizontal impact.
5 Discussion and conclusion
Acknowledging that MNEs are an important vehicle for international technology diffusion, we
investigate the impact of national IPR protection on horizontal and vertical knowledge diffu-
sion from FDI to domestic host-country firms. The debate regarding the costs and benefits of
strengthening national IPR systems centers around two arguments: On the one hand, stronger
IPR protection decreases static efficiency as it raises the marginal costs of knowledge diffusion
by limiting knowledge externalities or spillovers. On the other hand, it enhances dynamic effi-
ciency by stimulating innovation and international technology transfer. Even though previous
empirical research has examined parts of this debate, so far no study has investigated the ul-
timate impact of increasing IPR protection on national (domestic) firms. To study these two
arguments, we exploit the different nature of horizontal (intra-industry) knowledge diffusion and
vertical (inter-industry) knowledge diffusion. As the former mainly constitutes an externality or
spillover, increased IPR strength should diminish its occurence. The opposite holds for vertical
diffusion, as this occurs mainly through (inter-firm) knowledge transfer.
Our results partly corrobarate these expectations. They are strongest and most robust for
backward or upstream knowledge diffusion, i.e. from MNEs to their local suppliers. We consis-
tently find that increased IPR strength induces stronger and more positive backward knowledge
diffusion. For horizontal and forward knowledge diffusion, the effects are somewhat less robust.
23The bars in the figure display the coefficient estimates for the three MNE variables, taking into account thedifferent IPR levels. We use the estimates of column 1 in Table 5 as the basis for this figure, because it excludesHong Kong, which appears to be a clear outlier in our sample in terms of IPR strength.
24Note that this is due to the fact that the individual (i.e. non-interacted) effects of the MNE variables capturethe effects in countries with zero IPR, which we do not have in our sample.
16

Horizontal knowledge spillovers indeed seem to decrease with increased IPR strength, as ex-
pected. However, this result is somewhat sensitive to the use of lagged realizations of MNE
activity. The results for forward or downstream knowledge diffusion do not correspond well
with our expectations: Increased IPR strength seems to depress forward knowledge diffusion,
and even generates strong negative effects on local firms, most likely due to competition effects.
However, this result is also somewhat senstive to the use of lagged realizations of MNE activity,
as well as to changing the measure of IPR strength. Moroever, as suggested by Javorcik (2008),
forward knowledge diffusion might be particularly salient for downstream service firms, which
we do not consider here. Within manufacturing, adverse competition effects might indeed dom-
inate positive knowledge diffusion, as MNEs can more easily force higher input prices and hence
lower margins on their downstream customers.
Overall, our results seem to suggest that both arguments in the IPR protection debate have
some empirical bite. The question then arises which of the two effects dominates. This question
is not easily answered, as our results and the specific coefficient estimates tend to vary across
the different specifications. Moreover, it is difficult to pick a preferred specification. Still, we
briefly attempt a back-of-the-envelope evaluation to put some numbers to the debate, using
the estimates of column 1 in Table 5 as our point of departure.25 First consider the impact of
horizontal knowledge spillovers. In the countries with the lowest 2000 IPR index (Canada and
Finland with an index of 3.9), a one standard deviation increase of horizontal MNE activity
(1.93) increases local firms’ TFP by approximately 8.7%.26 The corresponding backward and
forward impacts of MNE activity are -9.2% and 5.6% respectively, generating a net increase
of 5.1%.27 Redoing these calculations for the country with the highest IPR index (the United
States with an index of 5) yields Horizontal, Backward and Forward effects of -29.5%, 41.6%
and -19.7% respectively, yielding a net effect of -7.6%. These calculations seem to imply that
the (contemporaneous) static efficiency argument for low IPR has more merit for domestic
firms than the dynamic efficiency argument for high IPR. However, we also noted that only
the backward effects of MNE activity are robust across all specifications. If we only take these
25This particular specification excludes Hong Kong as an outlier in terms of IPR strength, and the coefficientestimates are approximately in-between the extremes of the various estimates reported in Section 4.
26Recall that TFP is measured in logs, so that the coefficients can be interpreted as semi-elasticities. Hence,the total impact is computed as 0.747× 1.93− 0.180× 1.93× 3.9.
27The standard devations of Backward and Forward are 0.74 and 2.19 respectively. Also note that this neteffect is a national average. Different firms are affected asymmetrically, depending on their various relationshipswith respect to MNEs.
17

into account, it is clear that strong national IPR systems are strongly preferred over weak IPR
systems. A similar conclusion follows if we only consider the combined effects of horizontal and
backward, or forward and backward effects.
Somewhat disappointingly then, it still proves to be difficult to have the final verdict out on
the desirability of strong national IPR systems. If we take a conservative approach regarding our
estimation results, we should only consider the backward knowledge diffusion effects of MNEs
as being robust. In that case, our results make a strong case for strengthening national IPR
systems, as this will stimulate MNE-supplier knowledge and technology transfer, yielding strong
productivity gains for local firms in upstream industries. It also implies that FDI policies only
aimed at attracting inward MNE activity by themselves are not sufficient to ensure domestic
benefits. Developing a strong system of IPR protection and facilitating linkages between local
suppliers and MNEs appear to be necessary conditions for policy in this regard.
Finally, our study suffers from some shortcomings that provide opportunities for future re-
search. We only mention the two most salient ones here. First, our sample consists only of
very large firms, which could seriously bias the coefficient estimates. Given that these large
firms often dominate local markets and are prone to have strong linkages with each other and
foreign MNEs, it is likely that the competition effects will be more adverse, biasing our results
downward. At the same time, however, larger firms will be more productive and technologically
advanced, making their knowledge transfers more effective. This could lead to an upward bias
in our results. Working with samples including small(er) firms seems warranted to get rid of
these biases. Second, the countries in our sample are all (fairly) well developed, which could also
bias our results in various ways. The literature on the importance of absorptive capacity and
technological distance in relation to FDI knowledge diffusion would imply that the local firms
in these countries are particularly well equiped to benefit from foreign MNE activity (Cohen
and Levinthal, 1989; Griffith et al., 2004). Additionally, the variation in national IPR system
strength is seriously limited in this sample of countries. Effectively, we have no countries with
truly weak IPR, which again might lead to (too) favourable results regarding the knowledge
diffusion impact of MNE activity. Because of these reasons, expanding the sample of countries
to include a more heterogeneous country population is strongly desirable. Fortunately, given
the increased availability of detailed firm-level dataset in countries across the globe, as well as
18

datasets combining such data for various countries simultaneously, such research opportunities
should prove to be within reach in a not too distant future.
Acknowledgements
We thank Holger Gorg, Peter Nunnenkamp, Enrico Pennings, Horst Raff, and participants of
the 2008 European Trade Study Group, the 2009 European Economic Association Meeting,
and seminars at the University of Nijmegen, the CPB Netherlands Bureau for Economic Policy
Analysis, the Kiel Institute for the World Economy, and the Amsterdam Business School for
useful comments and suggestions. Any remaining errors are our own.
References
Ahlquist, John S. and Prakash, Aseem. 2008. ‘The influence of Foreign Direct Investment on
contracting confidence in developing countries’. Regulation and Governance 2, 316–339.
Aitken, Brian J. and Harrison, Ann E. 1999. ‘Do domestic firms benefit from Direct Foreign
Investment? Evidence from Venezuela’. American Economic Review 89(3), 605–618.
Blalock, Garrick and Gertler, Paul J. 2008. ‘Welfare gains from Foreign Direct Invest-
ment through technology transfer to local suppliers’. Journal of International Economics
74(2), 402–421.
Blomstrom, Magnus and Kokko, Ari. 1998. ‘Multinational corporations and spillovers’. Journal
of Economic Surveys 12(2), 1–31.
Blomstrom, Magnus and Sjoholm, Frederik. 1999. ‘Technology transfer and spillovers: Does
local participation with multinationals matter?’. European Economic Review 43(4-6), 915–
923.
Blundell, Richard and Bond, Stephen. 1998. ‘Initial conditions and moment restrictions in
dynamic panel data models’. Journal of Econometrics 87, 110–143.
Branstetter, Lee, Fisman, Ray, Foley, C. Fritz and Saggi, Kamal. 2010. ‘Does intellectual
property rights reform spur industrial development?’. Journal of International Economics in
press.
19

Branstetter, Lee, Fisman, Raymond and Foley, C. Fritz. 2006. ‘Do stronger intellectual
property rights increase international technology transfer?’. Quarterly Journal of Economics
121(1), 321–349.
Castellani, Davide and Zanfei, Antonello. 2006.Multinational Firms and Spillovers: Theoretical,
Methodological, and Empirical Issues. Cheltenham: Edward Elgar.
Cohen, Wesley and Levinthal, Daniel. 1989. ‘Innovation and learning: The two faces of R&D’.
The Economic Journal 99(397), 569–596.
Ginarte, Juan Carlos and Park, Walter. 1997. ‘Determinants of patent rights: A cross-sectional
study’. Research Policy 26(3), 283–301.
Gorg, Holger and Greenaway, David. 2004. ‘Much ado about nothing? DO domestic firms really
benefit from Foreign Direct Investment?’. World Bank Research Observer 19(2), 171–197.
Gorg, Holger and Strobl, Eric. 2001. ‘Multinational companies and productivity spillovers’. The
Economic Journal 111(475), F723–F739.
Granger, Clive. 1969. ‘Investigating causal relations by econometric models and cross-spectral
methods’. Econometrica 37(3), 424–438.
Griffith, Rachel, Redding, Stephen and van Reenen, John. 2004. ‘Mapping the two faces of R&D:
Productivity growth in a panel of OECD industries’. Review of Economics and Statistics
86(4), 883–895.
Haltiwanger, John, Lane, Julia and Spletzer, James. 1999. ‘Productivity differenes across em-
ployers: The role of age, size and human capital’. American Economic Review 89(2), 94–98.
Helpman, Elhanan, Melitz, Marc and Yeaple, Stephen. 2004. ‘Exports versus FDI with hetero-
geneous firms’. American Economic Review 94(1), 300–316.
Heston, Alan, Summers, Robert and Aten, Bettina. 2009. ‘Penn World Table Version 6.3’.
Center for International Comparisons of Production, Income and Prices at the University of
Pennsylvania .
20
Javorcik, Beata. 2004a. ‘The composition of Foreign Direct Investment and protection of in-
tellectual property rights: Evidence from transition countries’. European Economic Review
48, 39–62.
Javorcik, Beata. 2004b. ‘Does Foreign Direct Investment increase the productivity of domes-
tic firms? In search of spillovers through backward linkages’. American Economic Review
94(3), 605–627.
Javorcik, Beata. 2008. ‘Can survey evidence shed light on spillovers from Foreign Direct Invest-
ment?’. World Bank Research Observer 23(2), 139–159.
Javorcik, Beata and Spatareanu, Mariana. 2008. ‘To share or not to share: Does local participa-
tion matter spillovers from Foreign Direct Investment?’. Journal of Development Economics
85(1-2), 194–217.
Kugler, Maurice. 2006. ‘Spillovers from Foreign Direct Investment: Within of between indus-
tries?’. Journal of Development Economics 80, 444–477.
Lee, Jeon-Yeong and Mansfield, Edwin. 1996. ‘Intellectual property protectino and US Foreign
Direct Investment’. Review of Economics and Statistics 78(2), 181–186.
Levinsohn, James and Petrin, Amil. 2003. ‘Estimating production functions using inputs to
control for unobservables’. Review of Economic Studies 70(2), 317–341.
Mansfield, Edwin and Romeo, Anthony. 1980. ‘Technology transfer to overseas subsidiaries by
U.S.-based firms’. Quarterly Journal of Economics 95, 737–750.
Markusen, James R. 2002. Multinational Firms and the Theory of International Trade. MIT
Press, Cambridge MA.
Maskus, Keith E. 2000. Intellectual Property Rights in the Global Economy. Peterson Institute
for International Economics, Washington DC.
Maskus, Keith E. and Penubarti, Mohan. 1995. ‘How trade-related are intellectual property
rights?’. Journal of International Economics 39(3/4), 227–248.
Melitz, Marc and Ottaviano, Gianmarco I.P. 2008. ‘Market size, trade, and productivity’.
Review of Economic Studies 75(1), 295–316.
21

Moulton, Brent. 1990. ‘An illustration of a pitfall in estimating the effects of aggregate variables
on micro units’. Review of Economics and Statistics 72(2), 334–338.
Olley, G. Steven and Pakes, Ariel. 1996. ‘The dynamics of productivity in the telecommunica-
tions equipment industry’. Econometrica 64(6), 1263–1297.
Roodman, David. 2009. ‘How to do xtabond2: An introduction to ”difference” and ”system”
GMM in Stata’. The Stata Journal 9(1), 86–136.
Saggi, Kamal. 2002. ‘Trade, Foreign Direct Investment, and international technology transfer:
A survey’. World Bank Research Observer 17(2), 191–235.
Smeets, Roger. 2008. ‘Collecting the pieces of the FDI knowledge spillovers puzzle’. World Bank
Research Observer 23(2), 107–138.
Smith, Pamela J. 2001. ‘How do foreign patent rights affect U.S. exports, affiliate sales, and
licenses?’. Journal of International Economics 55, 411–439.
Appendix
For the purposes of this paper, we collected information for all publicly listed non-financial firms
in 22 countries, i.e. all countries where a sufficient number firms with reliable data were present
in the Worldscope database. However, for Japan and the United States, because of time and
cost constraints, we collected information only on one third of the firms present in the database,
accounting for a representative sample in terms of size and 4-digit industry. More precisely, in
each of these countries we first divided the firms into ten groups according to size. Within each
of these ten groups we then ordered the firms by their 4-digit primary SIC code. Within each
of these industries we then selected every third firm from the total.
In order to obtain information on the extent of foreign (and local) ownership, we supple-
mented these data with information from the “Who owns whom” database, for which we only
had access for the year 2004. In several cases the information in this dataset was not satisfac-
tory. In such cases we augmented the dataset with information from other sources, primarily
company websites and annual reports. In particular, for firms with dual-class shares the infor-
mation from Thomson turned out to be insufficient, since it reflects the ownership structure of
22

only one class of shares. In many instances (especially in Scandinavia), these are actually the
shares with subordinate voting rights, mostly because the shares with full voting rights are not
listed. We identified the companies with dual class shares via Thomson Datastream. Fifteen
companies of this type for which we could not find data from alternative sources were excluded
from the sample.
In some cases the total percentage of shareholdings reported by Thomson was greater than
100%. For five of these companies we could not find information from alternative sources and
excluded them from the dataset. In some cases the fraction of total shareholding reported in
“Who owns whom” is quite low, raising doubts about the presence of all substantial share-
holders in this dataset. For companies where the fraction of total shareholding reported was
less than 10%, we collected information using other sources, and were often able to identify
investors holding very substantial fractions of shares. For forty-eight of these companies we
could not find additional ownership information, so that we excluded them from the dataset.
Finally, we excluded companies where the largest equity stake at the moment of reporting was
larger than 20% and was held by the company itself (four companies) or a broker-dealer firm
(five companies). This procedure resulted in a dataset of about 2,500 firms from 22 industrial
countries.
23

Tab
le1:
Cou
ntry-level
sample
descriptives
Cou
ntry
Localfirm
s(N
)MNEs(N
)IP
Rindex
(2000)
Country
Localfirm
s(N
)MNEs(N
)IP
Rindex
(2000)
Australia
9323
4.19
Japan
483
13
4.19
Austria
184
4.71
South
Korea
175
10
4.2
Belgium
2811
4.05
Netherlands
45
10
4.38
Can
ada
120
183.9
New
Zealand
27
4Den
mark
207
4.19
Norw
ay34
13.9
France
150
244.05
Singapore
101
19
4.05
German
y150
384.52
Spain
35
84.05
Hon
gKon
g137
542.9
Sweden
67
44.38
Irelan
d13
24
Switzerland
80
12
4.38
Israel
154
4.05
United
Kingdom
252
27
4.19
Italy
7311
4.33
UintedStates
408
17
5
24
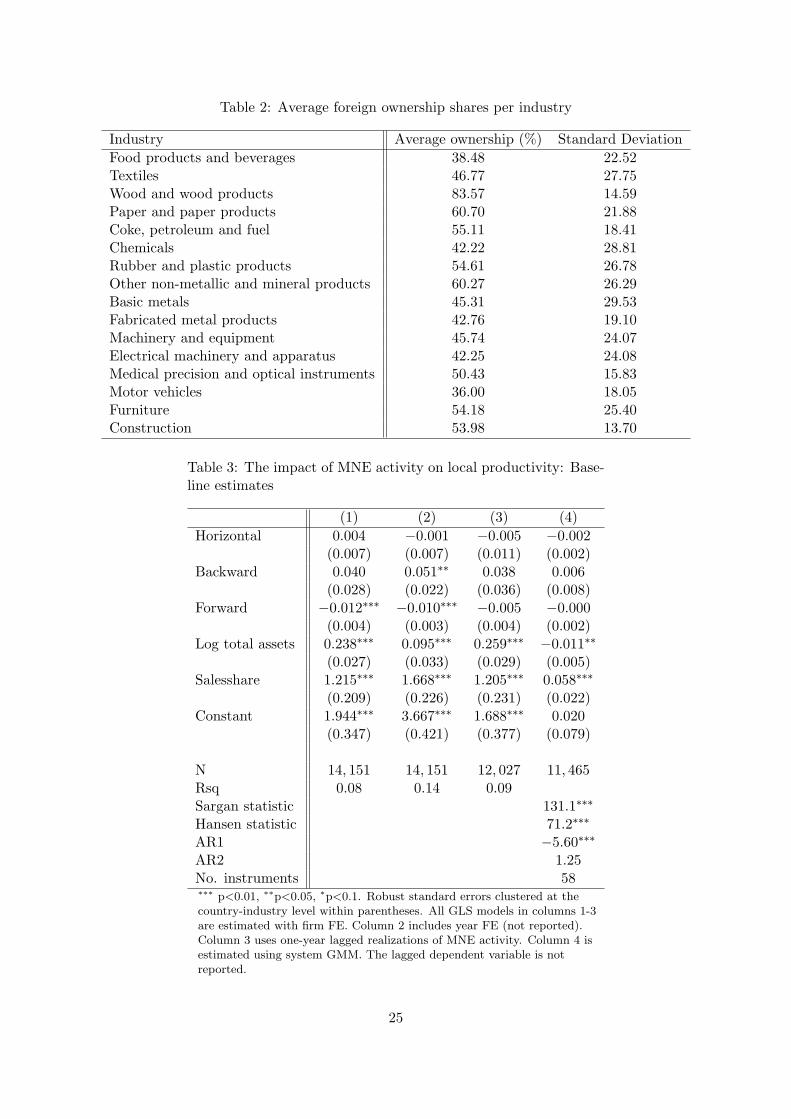
Table 2: Average foreign ownership shares per industry
Industry Average ownership (%) Standard Deviation
Food products and beverages 38.48 22.52Textiles 46.77 27.75Wood and wood products 83.57 14.59Paper and paper products 60.70 21.88Coke, petroleum and fuel 55.11 18.41Chemicals 42.22 28.81Rubber and plastic products 54.61 26.78Other non-metallic and mineral products 60.27 26.29Basic metals 45.31 29.53Fabricated metal products 42.76 19.10Machinery and equipment 45.74 24.07Electrical machinery and apparatus 42.25 24.08Medical precision and optical instruments 50.43 15.83Motor vehicles 36.00 18.05Furniture 54.18 25.40Construction 53.98 13.70
Table 3: The impact of MNE activity on local productivity: Base-line estimates
(1) (2) (3) (4)
Horizontal 0.004 −0.001 −0.005 −0.002(0.007) (0.007) (0.011) (0.002)
Backward 0.040 0.051∗∗ 0.038 0.006(0.028) (0.022) (0.036) (0.008)
Forward −0.012∗∗∗ −0.010∗∗∗ −0.005 −0.000(0.004) (0.003) (0.004) (0.002)
Log total assets 0.238∗∗∗ 0.095∗∗∗ 0.259∗∗∗ −0.011∗∗
(0.027) (0.033) (0.029) (0.005)Salesshare 1.215∗∗∗ 1.668∗∗∗ 1.205∗∗∗ 0.058∗∗∗
(0.209) (0.226) (0.231) (0.022)Constant 1.944∗∗∗ 3.667∗∗∗ 1.688∗∗∗ 0.020
(0.347) (0.421) (0.377) (0.079)
N 14, 151 14, 151 12, 027 11, 465Rsq 0.08 0.14 0.09Sargan statistic 131.1∗∗∗
Hansen statistic 71.2∗∗∗
AR1 −5.60∗∗∗
AR2 1.25No. instruments 58∗∗∗ p<0.01, ∗∗p<0.05, ∗p<0.1. Robust standard errors clustered at thecountry-industry level within parentheses. All GLS models in columns 1-3are estimated with firm FE. Column 2 includes year FE (not reported).Column 3 uses one-year lagged realizations of MNE activity. Column 4 isestimated using system GMM. The lagged dependent variable is notreported.
25

Table 4: The impact of MNE activity on local productivity: Na-tional IPR strength
(1) (2) (3) (4)
Horizontal 0.113∗∗∗ 0.065∗ 0.071 −0.003(0.036) (0.036) (0.073) (0.015)
× IPR −0.033∗∗∗ −0.020∗ −0.024 −0.000(0.011) (0.011) (0.023) (0.004)
Backward −1.475∗∗∗ −1.085∗∗ −1.351∗ −0.198∗
(0.569) (0.544) (0.739) (0.118)× IPR 0.374∗∗∗ 0.279∗∗ 0.342∗ 0.053∗
(0.139) (0.132) (0.183) (0.030)Forward 0.570∗∗∗ 0.428∗∗ 0.516∗∗ 0.074∗∗
(0.181) (0.167) (0.235) (0.034)× IPR −0.137∗∗∗ −0.103∗∗∗ −0.123∗∗ −0.018∗∗
(0.043) (0.040) (0.055) (0.008)Log total assets 0.235∗∗∗ 0.094∗∗∗ 0.255∗∗∗ −0.009∗∗
(0.026) (0.033) (0.029) (0.004)Salesshare 1.236∗∗∗ 1.677∗∗∗ 1.209∗∗∗ 0.066∗∗∗
(0.209) (0.225) (0.231) (0.020)Constant 1.994∗∗∗ 3.691∗∗∗ 1.749∗∗∗ 0.079
(0.339) (0.414) (0.372) (0.065)
N 14,151 14,151 12,027 11,465Rsq 0.08 0.14 0.09F-statistic 10.7∗∗∗ 5.2∗∗∗ 6.7∗∗∗
Sargan statistic 167.5∗∗∗
Hansen statistic 111.4∗∗∗
AR1 −5.68∗∗∗
AR2 1.25No. instruments 100∗∗∗ p<0.01, ∗∗p<0.05, ∗p<0.1. Robust standard errors clustered at thecountry-industry level within parentheses. All GLS models in columns 1-3are estimated with firm FE. Column 2 includes year FE (not reported).Column 3 uses one-year lagged realizations of MNE activity. Column 4 isestimated using system GMM. The lagged dependent variable is notreported.
26

Table 5: The impact of MNE activity on local productivity: Robustness analyses
(1) (2) (3) (4) (5)
Horizontal 0.747∗∗∗ 0.982∗∗∗ 0.513∗∗∗ 0.061 0.913∗
(0.185) (0.260) (0.140) (0.070) (0.534)× IPR −0.180∗∗∗ −0.237∗∗∗ −0.127∗∗∗ −0.021 −0.053
(0.044) (0.057) (0.032) (0.020) (0.035)× GDP −0.067
(0.045)Backward −2.558∗∗∗ −3.792∗∗∗ −2.192∗∗ −1.216∗ −5.179∗∗∗
(0.810) (1.053) (0.930) (0.728) (1.435)× IPR 0.624∗∗∗ 0.923∗∗∗ 0.535∗∗ 0.309∗ 0.210∗
(0.197) (0.253) (0.224) (0.180) (0.114)× GDP 0.421∗∗∗
(0.137)Forward 0.435∗∗ 0.596∗∗ 0.411 0.478∗∗ 0.661∗
(0.219) (0.288) (0.262) (0.231) (0.390)× IPR −0.105∗∗ −0.143∗∗ −0.097 −0.114∗∗ −0.066∗∗
(0.052) (0.068) (0.062) (0.055) (0.030)× GDP −0.038
(0.032)Log total assets 0.274∗∗∗ 0.293∗∗∗ 0.304∗∗∗ 0.255∗∗∗ 0.131∗∗∗
(0.029) (0.050) (0.028) (0.029) (0.033)Salesshare 1.044∗∗∗ 1.472∗∗∗ 0.829∗∗∗ 1.208∗∗∗ 1.482∗∗∗
(0.227) (0.401) (0.217) (0.231) (0.256)Log GDP per capita 2.680∗∗∗
(0.220)Constant 1.548∗∗∗ 1.219∗ 1.202∗∗∗ 1.743∗∗∗ −24.37∗∗∗
(0.375) (0.652) (0.370) (0.321) (2.035)
N 11,382 4745 9730 12,027 12,027Rsq 0.11 0.11 0.13 0.09 0.17∗∗∗ p<0.01, ∗∗p<0.05, ∗p<0.1. Robust standard errors clustered at the country-industry levelwithin parentheses. All models are estimated with firm FE and one-year lagged MNE variables,unless indicated otherwise. Column 1 excludes Hong Kong from the sample. Column 2 excludesobservations with zero MNE activity. Column 3 uses two-year lagged realizations of MNEactivity. Column 4 uses the 2005 IPR index. Column 5 includes (log) GDP per capita as anadditional control variable.
27

Tab
leA1:
Lab
oran
dcapital
coeffi
cients
inOLSandOP
productionfunctionregressions
Industry
βOLS
LβOP
LDeviationOP-O
LS
βOLS
KβOP
KDeviationOP-O
LS
(Expected:-)
(Expected:+)
Foodproductsan
dbeverages
0.57
40.446
-0.484
0.553
+Textiles
0.35
60.342
-0.266
0.566
+Woodan
dwoodproducts
0.26
10.255
-0.371
0.502
+Pap
eran
dpap
erproducts
0.36
80.358
-0.431
0.505
+Coke.
petroleum
andfuel
0.38
50.390
+0.503
0.602
+Chem
icals
0.75
60.723
-0.159
0.192
+Rubber
andplastic
products
0.34
10.349
+0.421
0.632
+Other
non
-metallican
dmineral
products
0.51
30.507
-0.507
0.475
-Basic
metals
0.36
70.345
-0.485
0.555
+Fab
ricatedmetal
products
0.39
50.340
-0.221
0.552
+Machineryan
dequipment
0.34
20.309
-0.613
0.591
-Electricalmachineryan
dap
paratus
0.64
30.561
-0.284
0.299
+Medical
precision
andop
ticalinstruments
0.55
60.477
-0.351
0.359
+Motor
vehicles
0.80
60.772
-0.219
0.283
+Furniture
0.60
50.605
00.437
0.456
+Con
struction
0.66
60.674
+0.148
0.205
+
28

Figure 1: Correlation between local firms’ TFP and horizontal MNE activity: High versus lowIPR countries.
Figure 2: Correlation between local firms’ TFP and downstream MNE activity: High versuslow IPR countries.
29

Figure 3: Correlation between local firms’ TFP and upstream MNE activity: High versus lowIPR countries.
Figure 4: Estimated horizontal, backward and forward coefficients at various levels of the IPRindex.
30


Publisher:
CPB Netherlands Bureau for Economic Policy AnalysisP.O. Box 80510 | 2508 GM The Haguet (070) 3383 380
February 2011 | ISBN 978-90-5833-495-4