Knowledge Architecture: Graphing Your Knowledge
30
Knowledge Architecture: Graphing your knowledge David Meza Chief Knowledge Architect, NASA
-
Upload
neo4j-the-fastest-and-most-scalable-native-graph-database -
Category
Government & Nonprofit
-
view
52 -
download
1
Transcript of Knowledge Architecture: Graphing Your Knowledge

Knowledge Architecture:Graphing your knowledge
David MezaChief Knowledge Architect, NASA
David MezaChief Knowledge Architect, NASA
© 2015 IHS. ALL RIGHTS RESERVED.
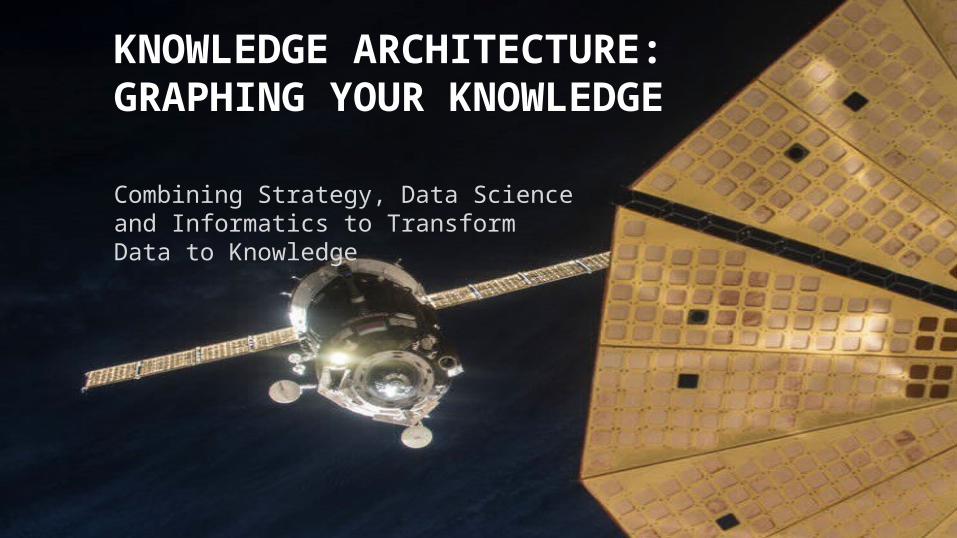
KNOWLEDGE ARCHITECTURE: GRAPHING YOUR KNOWLEDGE
Combining Strategy, Data Science and Informatics to Transform Data to Knowledge

4
AGENDA• Challenges• Knowledge
Architecture• Graphing LLDB• Questions?

“The most important contribution management needs to make in the 21st Century is to increase the productivity of knowledge work and the knowledge worker.”PETER F. DRUCKER, 1999

NASA Challenges• Hundreds of millions of documents, reports, project data, lessons
learned, scientific research, medical analysis, geo spatial data, IT logs, etc., are stored nation wide
• The data is growing in terms of variety, velocity, volume, value and veracity
• Accessibility to Engineering data sources • Visibility is limited

To convert data to knowledge a convergence of Knowledge Management, Informatics and Data Science is necessary.
7
Knowledge Management
Data ScienceInformatics

Knowledge Architecture• The people, processes, and technology of designing, implementing, and
applying the intellectual infrastructure of organizations.• What is an intellectual infrastructure?
• The set of activities to create, capture, organize, analyze, visualize, present, and utilize the information part of the information age..
• Information + Contexts = Knowledge• Knowledge Management + Informatics + Data Science = Knowledge
Architecture• KM without Informatics is empty (Strategy Only)• Informatics without KM is blind (IT based KM)• Data Science transforms your data to knowledge 8

“We have an opportunity for everyone in the world to have access to all the world’s information. This has never before been possible. Why is ubiquitous information so profound? It is a tremendous equalizer. Information is power.”ERIC SCHMIDT (FORMER CEO OF GOOGLE)


There was a inquisitive engineer…
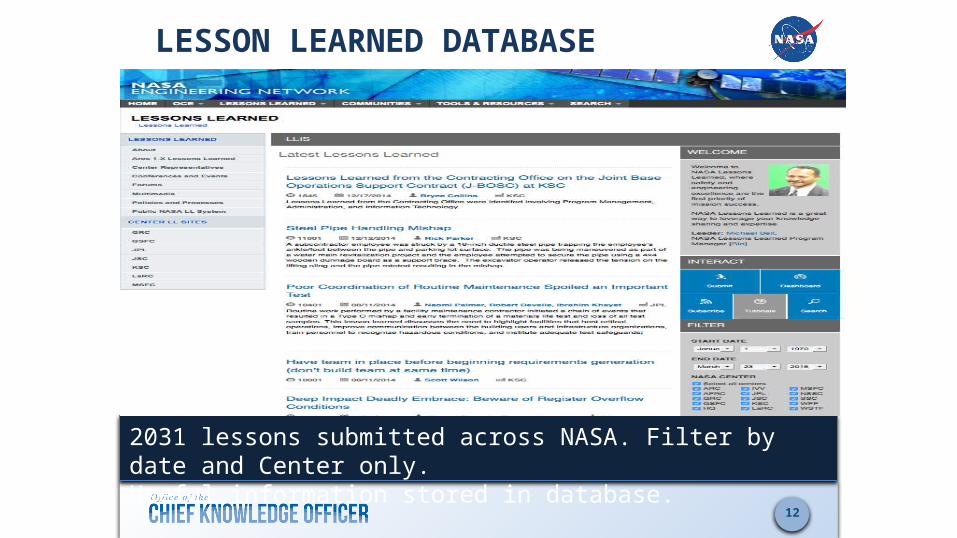
LESSON LEARNED DATABASE
12
2031 lessons submitted across NASA. Filter by date and Center only. Useful information stored in database.

Document to Graph
13

PATTERNS EMERGE

TOPIC MODELING
15
Topic models are based upon the idea that documents are mixtures of topics, where a topic is a probability distribution over words.
LDA Model from Blei (2011)
David Blei homepage - http://www.cs.columbia.edu/~blei/topicmodeling.htmlBlei, David M. 2011. “Introduction to Probabilistic Topic Models.” Communications of the ACM.

CORRELATION BY CATEGORY
16
To find the per-document probabilities we extract theta from the fitted model’s topic posteriors

TOPIC TRENDS
17
Using mean of theta by years to trend topics

TOPIC VISUALIZATION
18

GRAPH MODEL OF LESSON LEARNED DATABASE
19
http://davidmeza1.github.io/2015/07/16/Graphing-a-lesson-learned-database.html

GRAPH MODEL OF LESSON LEARNED DATABASE
20
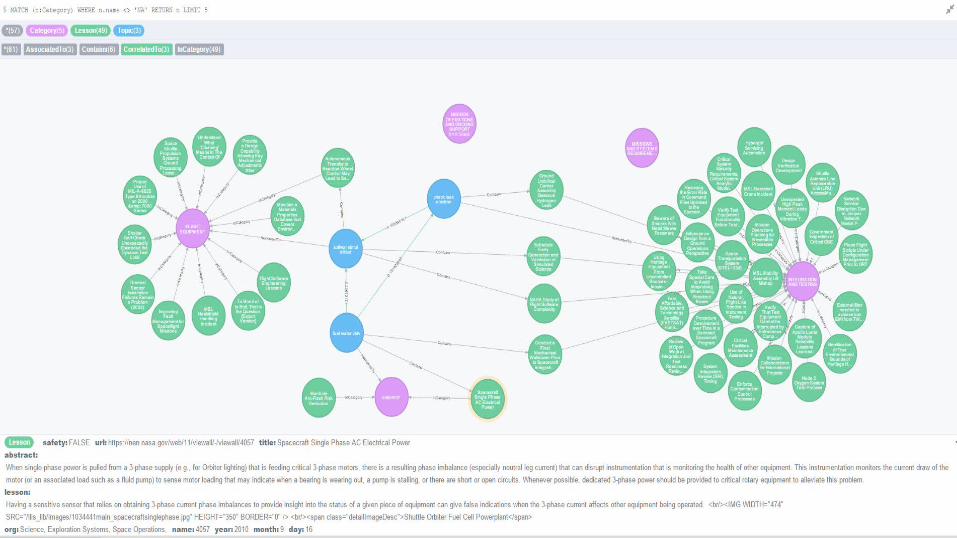
GRAPH MODEL OF LESSON LEARNED DATABASE
21

DATA DRIVEN VISUALIZATION
22


28
WHAT COULD YOU ACCOMPLISH IF YOU COULD:
• Empower faster and more informed decision-making
• Leverage lessons of the past to minimize waste, rework, re-invention and redundancy
• Reduce the learning curve for new employees• Enhance and extend existing content and
document management systems

Contact Information
David Meza – [email protected]
Twitter - @davidmeza1
Linkedin - https://www.linkedin.com/pub/david-meza/16/543/50b
Github – davidmeza1
Blogdavidmeza1.github.io
29

Contents
© 2015 IHS. ALL RIGHTS RESERVED. 30Report Name / Month 2015
QUESTIONS?