Knight civic-tech
30
The Emergence of Civic Tech: Investments in a Growing Field December 2013
-
Upload
knight-foundation -
Category
Business
-
view
36.271 -
download
2
Transcript of Knight civic-tech

The Emergence of Civic Tech:
Investments in a Growing Field
December 2013

2
About
At Knight Foundation, we strive to support informed and engaged communities. With the proliferation of technology in everyday life over the past decade, Knight has increasingly funded new technologies designed to improve the health and vitality of cities. Since 2010, Knight has invested more than $25 million in such projects, ranging from government data access platforms to new tools for community planning to online neigh-borhood forums.
Over the past two years, we’ve witnessed through our work a groundswell of interest at the nexus of technology, civic innovation, open government and resident engagement. Though the terminology may vary, more and more funders, investors and practitioners have joined this emerging “civic tech” field. We began to wonder: How can practi-tioners supporting civic tech form stronger connections, and how can we gather better insights into the trends in the field?
Knight embarked on an analysis earlier this year to examine clusters of inno-vation and investment within the field of civic tech. Rather than performing a run-of-the-mill landscape review with stakeholder interviews, we decided to experiment with a new set of research tools. We partnered with Quid, a firm that specializes in data analytics and network analysis, to map the field of civic tech through semantic analysis and private and philanthropic investment data.
This report summarizes key findings and implications from the analysis. We hope this experiment will be valuable to those interested in the field of civic tech as well as organiza-tions looking to advance the use of big data in the social sector. This study is a first foray into analyzing the civic tech landscape but is certainly not an exhaustive analysis. We look forward to continued partnerships with others to advance learning and practice in this field.
About
Authors
Mayur Patel
VP/Strategy and Assessment
Knight Foundation
Jon Sotsky
Director/Strategy and Assessment
Knight Foundation
Sean Gourley
Co-founder & CTO
Quid
Daniel Houghton
Engagement Manager
Quid

3
overview Objectives & Approach
mapping the field Themes & Trends
innovation clusters Investment Activity & Distribution
investor analysis Funding Sources & Types of Capital
takeaways Strategic Implications & Next Steps
Contents
4
Overview
This section examines:
objectives What are the main questions explored in the study?
definition What is “civic tech”?
scope What types of organizations and investment are included in the analysis?

5
Key implications
The analysis was designed to address the following questions:
• how much money is being invested in civic tech projects?
• What are the different clusters of civic tech innovation?
• How does investment vary across these clusters of innovation?
• Which organizations are attracting the most investment?
• who is investing in civic tech?
• What is the balance of private and philanthropic investment?
ADDITIONAL RESOURCES
Further analyze the data gathered
through the review using these tools:
Civic Tech Visualized
Interactive website to explore the
landscape of civic tech organizations
Civic Tech Directory
Index of organizations,
investors and investment data
Objectives
Explore
Download

6
Civic Tech: A Convergence of Fields
This review incorporates tech companies and projects from sev-eral fields of work. Only projects primarily focused on promoting civic outcomes were included. government
data
community organizing
civictech
social networks
Peer-to-peer sharing of
resident-owned goods and
services
Public data access and
transparency
Internal performance and analytics
software
Virtual, professional or practice-
based networks
Place-based networks
and community forums
Social causes,
civic engagement
Political campaign
management tools
Funding for projects
that enhance public
services and spaces
crowd funding
Funding for consumer
and commercial
products
Tools for procuring paid services
from local vendors and sharing of
corporate-owned assets
collaborative consumption

7
Criteria for Inclusion
• Organizations Startups, private companies and nonprofits are included. Events, loose affiliations and networks that are not legally registered entities are excluded.
• Time Frame Organizations that received funding between January 2011 and May 2013 are included. Organizations that received funding prior to January 1, 2011, are largely excluded.
• Investment Grants and investments made by foundations, corporations and private investors are included. Government and public funding for civic tech is excluded. In addition, an organization must receive funding from a third party, rather than just being financed through an organiza-tion’s internal budget.
• Technology Organizations funded to support advocacy, research, events and other purposes related to civic tech but not directly tied to building tech-related projects are excluded.
• Geography The study concentrates on U.S. investments in U.S.-based civic tech projects. Some international companies that achieved significant investment and/or press also included.
This study focuses on orga-nizations, including for-profit companies and nonprofits, that received funding between January 2011 and May 20131 to develop or scale civic technology.
The review used a set of guidelines to determine which projects should be included. The resulting analysis provides a useful initial assessment, albeit not an exhaustive exam-ination, of the emerging field of civic tech.
1 The analysis captures organizations that received funding during this period; some have subse-
quently closed operations or been acquired. Quid’s investment database captures funding dating
back to Jan. 1, 2011. While the review captured a handful of projects that received funding prior to
this date, those data are not as comprehensive as data analyzed from this point forward.

8
Mapping
the Field
This section examines:
approach How was the civic tech landscape mapped?
clusters What are different innovation clusters in the field?
trends How has the field grown over time?

9
Approach to Mapping Civic TechnologyThe following steps were used to map the civic tech landscape:
1 Quid and Knight, in consultation with others in the field, seeded the analysis with a set of organizations viewed as core to civic tech innovation.
2 Key terms (e.g., “civic,” “open government,” “open data”) were used to examine media, press and investment data to generate additional organizations to include in the landscape.
3 Quid’s proprietary software generated a network map based on the level of similarity between the way organizations described the functionality and purpose of their technology.
4 Quid and Knight reviewed the resulting map and determined descriptors for different clusters of organizations that emerged from the analysis.
READING THE MAP
• Each node (circle) represents
an organization
• Connections between nodes (lines) form
between organizations with similar
functionality and/or purpose—thicker
connections mean greater similarity
• Nodes of similar companies cluster
together; nodes of dissimilar
companies repel each other and
create spacing in the map
Civic Tech Landscape MapNetwork by Quid

10
Landscape Themes: Open Government & Community ActionIn reviewing the network map, two top-level themes were identified in relation to the org-anizations included in the analysis. The network map was then color-coded to highlight these two themes.
Open Government
Projects focused on advancing government transparency, access- ibility of government data and services, and civic involvement in democratic processes
Community Action
Projects 1
READING THE MAP
• Circle size represents the number
of organizations in each cluster
• Line thickness represents the
number of connections between
organizations in each cluster
• open government
• community action
Network by Quid

11
Innovation Clusters
Within the two overarching themes, 11 clusters of civic tech innovation were identified:
Open Government
1 Data Access & Transparency
2 Data Utility
3 Public Decision Making
4 Resident Feedback
5 Visualization & Mapping
6 Voting
Community Action
7 Civic Crowdfunding
8 Community Organizing
9 Information Crowdsourcing
10 Neighborhood Forums
11 Peer-to-Peer Sharing
11
10
837
2
1
9
4
5
6
READING THE MAP
• Circle size represents the number
of organizations in the cluster
• Line thickness represents the
number of connections between
organizations in each cluster
• open government
• community action
Network by Quid

12
Open Government Innovation Clusters
Data Access & Promote government data availability, Transparency transparency and accountability
Data Utility Empower users to analyze government data and leverage data to improve public service delivery
Public Decision Encourage resident participation in Making large-scale deliberative democracy and community planning efforts
Resident Feedback Provide residents with opportunities to interact with government officials and give feedback about public service delivery
Visualization & Enable users to make sense of and gain Mapping actionable insight from civic data sources, specifically through the visualization and mapping of that information
Voting Support voter participation and fair election processes
cluster example organizations description

13
Community Action Innovation Clusters
Civic Crowdfunding Suport local projects and organizations that generate a public benefit through peer-to-peer lending and crowdfunding
Community Manage social campaigns and initiatives Organizing
Information Collect data from a large number Crowdsourcing of individuals to inform and address civic issues
Neighborhood Power local groups of people Forums to connect, share information and collaborate
Peer-to-Peer (P2P) Promote resident-driven sharing of Sharing goods and services
cluster descriptionexample organizations

14
Growth of Civic Tech
2012
121 companies
2000
16 civic tech companies founded
2004
34 companies
2008
83 companies
2000–2004
21%compound annual
growth rate (cagr)
2004–2008
25%cagr
2008–2012
23%cagr
The analysis of civic tech organizations launched each year since 2000 reveals consistent, high growth rates in the field. From 2008 to 2012, the field of civic tech grew at an annual rate of 23%.

15
Growth Trends by Cluster
Growth has varied across innovation clusters within civic tech, with Community Action clusters growing at a faster rate than those in Open Government. The fastest growth has been among organizations focused on Peer-to-Peer Sharing (36% annually from 2009 to 2012).
43 Peer-to-Peer Sharing Organizations
32 Community Organizing
18 Resident Feedback
11 Data Utility 12 Information Crowdsourcing
16 Data Access & Transparency
7 Civic Crowdfunding
15 Neighborhood Forums
16 Public Decision Making
8 Voting
14 Visualization & Mapping
2000 2005 2010 2012
READING THE CHART
• open government • community action
10 organizations
20
30
40
Cumulative growth (in number of organizations)

16
Innovation
Clusters
This section examines:
total investment How much money has been invested in civic tech projects?
funding distribution How has investment varied across different themes and innovation clusters in the landscape?
cluster characteristics What are the primary characteristics of the organizations in each innovation cluster?

17
Total Investment Summary
209 civic tech projects
identified in the civic tech landscape
102 of the 209
organizations received investment from
Jan 2011 to May 2013
$431M invested in
these civic tech organizations
237 different investors provided funding
to civic tech organizations
177 investments made
in civic tech organizations1
1 Instances where multiple investors participated in the same
funding round are counted as a single investment

18
20 40 100M 200M
Funding Distribution
The analysis reviewed the number of investments and amount invested in each innovation cluster from January 2011 to May 2013.
Peer-to-Peer Sharing attracted the vast majority of total investment in the landscape (close to $240M), followed by three clusters that each received close to $40M: Neighborhood Forums, Com- munity Organizing and Information Crowdsourcing.
Peer-to-Peer Sharing2
Community Organizing
Resident Feedback
Data Utility
Information Crowdsourcing
Data Access & Transparency
Civic Crowdfunding
Neighborhood Forums
Public Decision Making
Voting
Visualization & Mapping
20 $16M
$15M
$37M
$600K
$3M
$4M
$38M
$35M
$41M
$8M
18
15
10
8
8
42
29
14
7
6
Number1 of Investments
Amount of Investment ($)
READING THE CHART
• open government • community action
$234M
1 Includes grants and private investments
from 1 Jan 2011 to 31 May 2013
2 Peer-to-Peer Sharing includes a $119M
round for Airbnb

19
Innovation Cluster Maturity
The analysis examined the median age of organizations in each civic tech cluster.
Compared to the tech industry as a whole, civic tech organizations are relatively young. Civic Crowd-funding projects have a median age of just two years, while the average age of organizations in the most mature clusters—Voting, Public Decision Making and Visualization & Mapping— was five to seven years.
1 2 3 4 5 6 7
50 investments
40
30
20
10
Median Company Age
P2P Sharing
Community Organizing
Resident Feedback
Data Utility
Information Crowdsourcing
Data Access & Transparency
Civic Crowdfunding
Neighborhood Forums
Public Decision Making
VotingVisualization & Mapping
READING THE CHART
• Circle size
represents
the number of
organizations
in each cluster
• open government
• community action

20READING THE CHART
• open government • community action
Investment Concentration within ClustersThe analysis examined the distribution of investments within each cluster to highlight emerging market leaders and competitive dynamics at play in each area. The diagram ranks the “investment inequality” of clusters by measuring the extent to which a handful of organi- zations have secured a dominant share of capital to the cluster.
Neighborhood Forums is an example of a civic tech cluster with a high level of investment inequality where a single firm has received the overwhelming share of investment (Nextdoor = $40.2M).
Information Crowdsourcing and Peer- to-Peer Sharing clusters have the most unequal levels of investment, but dominant firms in both areas are highly focused on particular issue verticals (e.g., Waze = transportation data, Airbnb = housing).
1 Investment inequality is based on the Gini coefficient,
which measures on a 0–1 scale the evenness of fund-
ing distribution across organizations within each cluster
(0.0 = perfectly even distribution, 1.0 = single firm
received entire share of funding)
Highest Funded Organizations
0 .1 .2 .3 .4 .5 .6 .7
P2P Sharing
Community Organizing
Resident Feedback
Data Utility
Information Crowdsourcing
Data Access & Transparency
Civic Crowdfunding
Neighborhood Forums
Public Decision Making
Voting
Visualization & Mapping
Investment Inequality 1
.77
.76
.75
.74
.73
.72
.70
.67
.66
.44
.42
$30.0M
$118.6M
$40.2M
$9.8M
$16.5M
$15.0M
$2.0M
$6.5M
$8.0M
$0.3M
$1.7M

21
developed
static
Cluster Characteristics
Cluster investment inequality can be cross-analyzed with median investment size by cluster to help determine the competitive dynamics and impressionability of each cluster.
“Emerging” clusters of innovation have lower investment inequality and contain organizations that attract smaller average investments—these include Public Decision Making, Civic Crowdfunding and Voting.
“Developed” clusters have a high level of investment inequality (i.e., market leaders attracting the bulk of investment) and higher average investments—these include Peer-to-Peer Sharing and Neigh-borhood Forums.
$15k $150k $1.5 million
Median Investment
Amount (log scale)
Investment Inequality
(Gini coefficient)
.8
.3
maturing
emerging
P2P SharingCommunity Organizing
Resident Feedback
Data Utility
Information Crowdsourcing
Data Access & Transparency
Civic Crowdfunding
Neighborhood Forums
Public Decision Making
Voting
Visualization & Mapping
READING THE CHART
• Circle size
represents
the number of
organizations
in each cluster
• open government
• community action

22
Investor
Analysis
This section examines:
types of capital What is the balance between private and philanthropic capital supporting civic tech?
investors Who is investing in civic tech?
investor networks How are civic tech investors connected?

23
Types of Capital
The analysis examined the balance of private and philan- thropic investment attracted by civic tech organizations from January 2011 to May 2013.
While the number of grant investments and private invest- ments was relatively even, the vast majority of total capital supporting civic tech came from private investments (84%).
177 Total
Investments
$431M Total Investment
Dollars
Private Investments
76
$364M
$67M
Grants 101

24
Capital Mix by Cluster
The mix of philanthropic funding and private investment from January 2011 to May 2013 varied greatly between the two themes.
Open Government innovation clusters including Data Utility, Data Access & Transparency, and Resident Feedback are mostly supported through grant funding.
Community Action clusters including Peer-to-Peer Sharing, Neighborhood Forums, Civic Crowdfunding and Information Crowdsourcing mostly attracted private capital.
P2P Sharing
Community Organizing
Resident Feedback
Data Utility
Information Crowdsourcing
Data Access & Transparency
Civic Crowdfunding
Neighborhood Forums
Public Decision Making
Voting
Visualization & Mapping
100% grants 100% grants
6%
91%
98%
33%
44%
1%
15%
14%
2%
3%
72%
73%
90%
75%
75%
7%
59%
79%
29%
50%
Number of Investments
Amount of Investment ($)
READING THE CHART
• open government • community action
20 40 100M 200M

25
Civic Tech Investors
Omidyar Network1
SV Angel
Start Fund
Y Combinator
Lerer Media Ventures
General Catalyst
Benchmark Capital
Andreessen Horowitz
7
5
4
16 investments Knight
MacArthur
Hewlett
Rockefeller
Points of Light
Open Society
Code for America
Ford
Kauffman
Gates
39
6
43
5
4
3
2
Dell
Zipcar
SXSW
Obvious
Nelnet
Daimler
BMW
Bennett Coleman
Comcast
6 investments
2
1
Ashton Kutcher
Sean Parker
Guy Oseary
Esther Dyson
Aviv (Vivi) Nevo
Alexis Ohanian
Peter Thiel
Marissa Mayer
Jeff Bezos
3 investments
2
1
Top Foundation2 investors (32 total)
Top Financial investors (84 total)
Top Corporate investors (21 total)
Top Individual investors (101 total)
Four types of investors are involved in supporting civic tech projects—foundations, financial investors, corporate investors and individual (often angel) investors.
Investor types and investment count of
most frequent investors are based on data
from January 2011 to May 2013
1 Omidyar Network is designated as a
financial investor but operates as a
philanthropic investment firm that also
provides grant funding
2 Foundation investors may have contributed
multiple types of investments—grant
funding, program-related and mission-
related investments
Code for America and Points of Light are
included in this list stemming from funding
they provide through their civic accelerators
ADDITIONAL RESOURCES
Civic Tech Directory
Index of organizations,
investors and investment data
Download
26
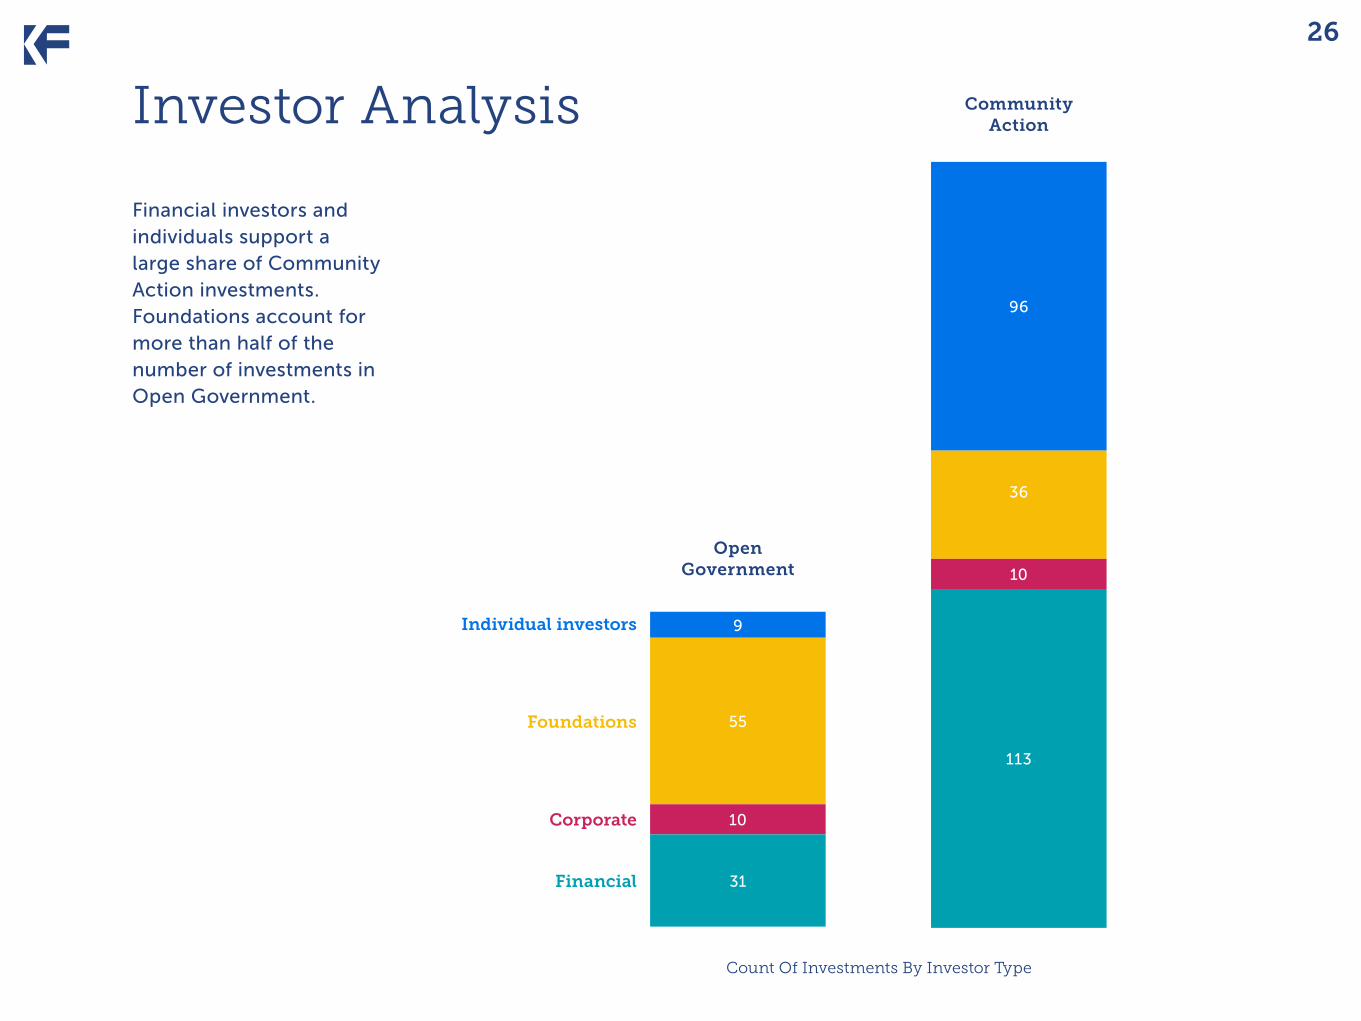
Investor Analysis
Financial investors and individuals support a large share of Community Action investments. Foundations account for more than half of the number of investments in Open Government.
31
10
55
9
Open Government
113
10
36
96
Community Action
Individual investors
Corporate
Foundations
Financial
Count Of Investments By Investor Type

27
Investor Networks
The analysis reviewed funder relationships based on instances where they co- invested in the same civic tech organizations. Venture capital and angel investors are at the center of the network map, signaling they most frequently co-invest with others. Foundations are largely peripheral to the investor network, rarely co-investing with other types of investors.
READING THE MAP
• Each circle represents
a distinct investor
• Investors share a connection
when they have both co-invested
in the same company
• A larger circle indicates that the investor
has co-invested frequently with others
Ashton Kutcher
Crunchfund
Aviv (Vivi) Nevo
General Catalyst
Omidyar
Knight
Rockefeller Foundation
SV Angel
Y Combinator
financial
foundation
corporate
individual
Network by Quid

28
Key
Takeaways
This section examines:
strategic implications How might foundations continue to influence the growth of civic tech?
next steps How can civic tech funders and practitioners build on the insights from this initial analysis?

29
Key implications
Findings from this initial analysis of civic tech funding raise important questions about oppor-tunities and approaches for investors, particularly foundations, to advance this emerging field.
Strategic Implications
1How can Open Government attract greater private capital?
Though the number of philanthropic grants far outpaces private capital investments (65 vs. 14), private capital constitutes $21M of $75M invested in open government. Examining the characteristics of open government organizations attracting private invest-ment might help illuminate the viability of market-based initiatives in this space and be used to attract more private capital.
2How can philanthropy support new
“Tools for Democracy”?
Innovation clusters focused on civic engagement and democratic participation— Public Decision Making, Resident Feed- back and Voting—are among the youngest and least funded areas in the overall landscape. At the same time, they appear most ripe to be influenced through further support based on the small average investment size and lack of a dominant market leader in each cluster.
3How can philanthropy exert influence beyond its investments?
Philanthropy can shape the civic tech field in ways besides directly investing in organizations, especially in clusters where significant private investment already exists. For example, foundations may achieve greater impact advancing the growth of peer-to-peer sharing economies by addressing outdated regulations inhibiting the growth of this sector rather than supplying limited amounts of grant funding to a handful of tech organizations in the space.
4How can funders increase co- investment and collaboration?
Relatively little co-investment currently occurs in the civic tech field, especially between philanthropic institutions and other types of investors. As more foun-dations pursue impact investing strate-gies, philanthropic funders could seek out more opportunities to co-invest and partner with other types of investors.

30
Key implicationsNext Steps
This initial review was designed to provide a clearer picture of overall investment flows in civic tech, including the distribution of invest-ments across different clusters of innovation and variances between private and philanthropic support. While the boundaries of civic tech remain loosely defined, the analysis
demonstrates a growing level of investment and activity in civic tech.
This report summarizes findings from the analysis. Additionally, two related resources exist for those interested in exploring the underlying data about civic tech organizations and investors.
Share Feedback and Suggestions
Help improve the analysis and build a more robust data set of civic tech organizations and investments. We will update the report in 2014 and welcome your recommendations for other orga-nizations to include in the data.
Do you have any feedback? Share your suggestions with Jon Sotsky at the Knight Foundation.
Interactive data visualization tool to
explore the data
Explore
Data directory of organizations and investors
captured in the analysis
Download